Annual Report and Accounts 2015 to 2016
Updated 14 September 2016
Applies to England and Wales

© Crown copyright 2016
This publication is licensed under the terms of the Open Government Licence v3.0 except where otherwise stated. To view this licence, visit nationalarchives.gov.uk/doc/open-government-licence/version/3 or write to the Information Policy Team, The National Archives, Kew, London TW9 4DU, or email: psi@nationalarchives.gov.uk.
Where we have identified any third party copyright information you will need to obtain permission from the copyright holders concerned.
This publication is available at https://www.gov.uk/government/publications/land-registry-annual-report-and-accounts-2015-to-2016/annual-report-and-accounts-2015-to-2016
Performance report
(a) Overview
Statement by the Interim Chair
I am delighted to contribute to this year’s Annual Report and Accounts. As the organisation’s Senior Independent Director I was honoured to be asked to serve as Interim Chair following the departure of our former Chair Mark Boyle and this is one of the many pleasant tasks that have fallen to me in that role.
To begin with I would like to pay tribute to Mark, who took over as Land Registry’s first independent Chair in October 2011. Mark oversaw many positive changes in the way the organisation is run and perceived during his four-and-a-half-year tenure. I would like to thank him for the work that he has done, a sentiment which I know will be reflected by his colleagues on the Land Registry Board. Mark saw Land Registry become a more efficient, more productive and more innovative organisation under his leadership.
As Interim Chair my role is to lead my colleagues on the Board in achieving our shared vision and goals for Land Registry until a permanent appointment is made. I am working in partnership with Chief Executive and Chief Land Registrar Graham Farrant to represent and promote the organisation in our dealings with our customers, stakeholders and ministers.
The Government has consulted on the options to move the operations of Land Registry into the private sector from 2017. Whatever the Government decides about the future ownership of Land Registry, the Board will play its part in developing any future operational and ownership options and formulate a strategy to deliver the way forward chosen by the Government. This will be a key decision for the organisation and it will be our task to see this through in a manner that provides reassurance and confidence to the public and Land Registry’s key customers and stakeholders.
In the latter respect we were all pleased by the success of the stakeholder event hosted at the Royal Society last November. We look forward to making that an annual tradition and continuing to make Land Registry a more open and inclusive organisation. Increasingly Land Registry has become a business that listens to its customers, its stakeholders and its people. As a Board we very much want to help this culture to grow further and to improve our standing across the wider property sector.
I know our new Chair will find, on their appointment, an impressive organisation with a rich history, a track record of success and a dedicated and professional workforce.
Foreword by the Chief Executive and Chief Land Registrar
I am pleased to report that my first year as Chief Executive and Chief Land Registrar has been another very successful year in Land Registry’s history.
When I became Chief Executive and Chief Land Registrar last June one of my immediate priorities was to review our Business Strategy. I invited all our colleagues to take part and their ideas and opinions influenced our choice of a new vision and values for Land Registry which I believe better reflect the vital role we play in the property market and wider economy.
Our vision and values
Your land and property rights: guaranteed and protected
We give assurance
We have integrity
We drive innovation
We are professional
Our new vision and values reflect our core commitment to the integrity of the Land Register, which remains one of my highest priorities. For our colleagues this represents a welcome restatement of the central purpose to which many have devoted their working lives and provides clarity of purpose for our new recruits. Indeed we have reaffirmed our central mission of maintaining the integrity of the register and increased the resources we devote to ensuring home buyers and sellers can rely on our professionalism and expertise. We also believe this will be welcomed by our customers and stakeholders.
This last year we received more than 30 million applications, ranging from simple electronic requests for information and official searches which form a critical component of the conveyancing process to applications to change the register. This increase in workload over the year has been a huge challenge for our casework teams who have responded by exceeding our targets for customer satisfaction and the quality of our registrations. The number of titles in the Land Register climbed to almost 24.5 million with almost 88% of England and Wales now registered. However we are still taking longer to process certain types of applications than we would like or our customers have come to expect and we remain focused on improving our speed of service.
We recognised we would need to recruit to respond to our rising workload and we have undertaken our first large-scale recruitment in almost a decade. Building on the 150 new recruits we welcomed last year, which included 80 apprentices, this year 330 new colleagues joined Land Registry, including another 57 apprentices.
But we have not stopped there; we are prioritising the most urgent applications and we have launched a new online tracker, Application Enquiry, so customers can view the progress of their applications.
Application Enquiry is just one example of the progress we have made in digitising the register and registration services. We now handle virtually all of our applications electronically, with 94% received via our Business e-services, and we scan the remaining paper applications so our teams can treat them in the same way.
During 2015/16 we made good progress in creating a digital Land Charges service, a digital register view service and a digital mortgage service as well as starting work on a new technology platform to underpin all our services. These have now been launched either as live products or as ‘betas’ and we are already receiving positive feedback from our customers – further improving our digital and IT capabilities.
On that note I had the pleasure of accompanying members of the team who developed our ground-breaking MapSearch service to Buckingham Palace to accept the 2015 Civil Service Award in the Digital category, building on the award we won in the Innovation category the previous year. We were honoured to speak to Her Majesty the Queen about MapSearch and how it makes it quicker, easier and cheaper for our business customers to check the register and obtain property details. We are also delighted to be a feature of this year’s Civil Service Live where we will share our experiences from MapSearch with civil servants from across the country.
We have also made good progress in building a single digital register for Local Land Charges under the powers granted to us by the Infrastructure Act 2015 and we have just launched a second consultation to get the views of our stakeholders on the specifics of its implementation. Working with the 326 English local authorities which hold Local Land Charges data, we intend to substantially improve the speed and consistency of service for customers. We are funding the £190 million programme from our reserves and I was delighted to meet many of the stakeholders at our first Local Land Charges conference in November.
We are already a significant holder and publisher of data thanks to the size and richness of the Land Register. We released four new datasets during the year, including the Overseas Companies dataset which supported the Prime Minister’s pledge for greater transparency on foreign ownership of property in the UK.
We also have provided further stability to the Executive Team thanks to the appointment of a permanent Director of Digital Services, John Abbott. John joined us from Ordnance Survey in January and succeeded Jon Parry in that role and also takes over the Board-level responsibilities for Information Systems following the retirement of Rowland Coombs. I would like to place on record my thanks to Rowland and Jon for their contributions to Land Registry.
I would like to thank our departing Non-Executive Chair Mark Boyle for his unstinting efforts to direct Land Registry and to achieve some very real efficiencies and improvements in our services, including the push to become more digital, and for his personal support during the last year.
We are now in a strengthened position at all levels of the organisation to meet the challenges ahead of us. Everyone from our apprentices to our directors are working together and with a renewed sense of purpose to live up to our vision and values.
Following the Chancellor’s Autumn Statement, the Government is consulting on the options for moving the operations of Land Registry to the private sector from 2017. The directors and I have worked hard to ensure that the normal operations of Land Registry continue to be our focus, while working with government on assessing the options and taking account of the consultation responses received.
This could represent the biggest change for Land Registry since it was created in 1862 but in reviewing our achievements this year I remain confident that we are prepared for whichever option the Government chooses.
The result of the referendum held on 23 June was in favour of the UK leaving the European Union. The impact of this decision on the UK economy is uncertain. Land Registry’s business and fee income is related to levels of activity in the wider property market as well as to property prices and we will therefore need to consider how this might affect our medium term financial planning and to determine whether we need to adjust our resourcing strategy and fee levels in order to ensure that we fulfil our responsibilities as a trading fund. In the short term the business has sufficient cash reserves to manage the immediate impact of any reduction in income.
Graham Farrant, Chief Executive and Chief Land Registrar
28 June 2016
Statement of purpose and activities of the organisation
Her Majesty’s Land Registry was established in 1862. We are a non-ministerial government department, an executive agency (since 1990) and a trading fund (since 1993) that makes no call on funds voted by Parliament. By statute we are required to ensure that our income from fees covers all of our expenditure under normal operating conditions.
From 2011 certain statutory functions relating to Land Registry are vested in the Secretary of State for Business, Innovation and Skills. Within his department our sponsor minister is the Minister for Small Business, Industry and Enterprise.
Our principal function is to keep a register of title to freehold and leasehold land and charges throughout England and Wales and to record dealings with land once it is registered. On behalf of the Crown we guarantee title to registered estates and interests in land.
This report deals with our Land Charges and Agricultural Credits departments separately from our main business but the accounts are given for Land Registry as a whole (see note 2 in the accounts).
Our functions are entirely statutory. We have no prerogative powers. The Land Registration Act 2002 empowers us to deal with “the business of registration under this Act” and is our primary governing statute.
The Infrastructure Act 2015 enabled Land Registry to become the sole registering authority for Local Land Charges. We are currently working on the provision of a single centralised digital service for Local Land Charges and will have wider powers than those contained in the Land Registration Act 2002 to develop new services to benefit the wider property market.
The head of Land Registry is the Chief Land Registrar, appointed under statute by the Secretary of State for Business, Innovation and Skills. The Chief Land Registrar is also Land Registry’s Chief Executive and Accounting Officer. The Chief Executive is responsible for the effective and efficient day-to-day management of Land Registry, subject to financial and legislative parameters. Full details of the roles and responsibilities of the Secretary of State and the Chief Land Registrar are set out in our framework document 2012.
Information on our volumes of work, including our intake for statutory services, is contained in Appendix A and Appendix B.
Fee income and business performance
Income
We derive income from our statutory services and from commercial services.
Section 102 of the Land Registration Act 2002 states that fees may be prescribed for ‘dealings’ with Land Registry. This covers fees in respect of our statutory services, which are those applications to Land Registry in respect of land registration, such as applications to register a transfer or charge of a property or to obtain an official copy of the register.
Authority for the level of fees on applications to Land Registry stems from a fee order made by the Secretary of State for Business, Innovation and Skills under section 102 and laid before Parliament. Orders are made with the advice and assistance of the Land Registration Rule Committee (an advisory non-departmental public body representing stakeholder and legal interests) and the consent of HM Treasury. Our current fees were established under the Land Registration Fee Order 2013.
The fee order covers applications for: registering title to land for the first time (‘first registrations’); dispositionary first leases; transfers of part of registered land; applications affecting a registered title (‘dealings’); and a range of services relating to inspection, copies and searches of the register.
In line with the principles established in Managing Public Money Land Registry are conducting a review of fees and charges during 2016/17, taking into account the recent financial surpluses and our future financial plans.
Land Charges and Agricultural Credits
Under the Land Charges Act 1972, we maintain registers of Land Charges, pending actions, writs and orders affecting land and other encumbrances registered against the names of owners of property, which are not registered under the Land Registration Acts. Under Section 16 of the Act, the Secretary of State for Business, Innovation and Skills has the authority to set fees by means of statutory instrument with the consent of HM Treasury. The current fees are specified in the Land Charges Fees Rules 1990 as amended by the Land Charges Fees (Amendment) Rules 1994.
In addition, under the Agricultural Credits Act 1928 we maintain a register of agricultural charges made under Part II of the Act. Under Section 9 of the Act, the Secretary of State for Business, Innovation and Skills has the authority to set fees by means of statutory instrument with the consent of HM Treasury. The current fees are specified in the Agricultural Credits Fees Order 1985.
Commercial income
Section 105 of the Land Registration Act 2002 gave the Chief Land Registrar authority to “provide, or arrange provision of, consultancy or advisory services about the registration of land in England and Wales or elsewhere”. Section 35 of the Infrastructure Act 2015 broadens these powers to enable Land Registry to provide (a) consultancy and advisory services about land and other property in England and Wales or elsewhere and (b) information services and services relating to documents or registers, relating to land or other property in England and Wales.
Our Commercial Services function was established in 2004 under the authority of section 105, for the purposes of identifying ways of giving more effective access to our data and also of adding value by creating specific services.
The focus of the commercial activity has subsequently shifted from the development of new commercial services and revenue raising to providing better access to data through the publication of datasets.
We currently offer 17 products within our commercial portfolio, under a mixed pricing model, including a range of data cleansing, spatial and data verification services.
We comply with our duty not to cross-subsidise our commercial services with fee income in respect of our statutory services. Development costs for new products may be funded from cash held returns but these costs are recovered from future revenues. In line with “Managing Public Money Annex 6.2 Charging for Information”, the charges for most of our commercial services are set on a ‘cost plus’ basis, but some reflect a market rate. Data publication pricing is based on the three principles of open data: free, cost recovery and trial access.
Strategy
Our Business Strategy was endorsed by ministers in December 2012 but we have been updating the core elements during this year. The objectives are outlined within the Governance statement in this annual report and accounts.
Our vision and values
Your land and property rights: guaranteed and protected
We give assurance
We guarantee our services and provide confidence to the property market
We drive innovation
We are forward thinking, embrace change and are continually improving our processes
We have integrity
We value honesty, trust and doing the right thing in the right way
We are professional
We value and grow our knowledge and professional expertise
Our 2013–2018 strategic targets
The 2012 Business Strategy set out 12 targets to be achieved over the five-year period.
| Original target | Forecast performance to 2018 |
|---|---|
| 99% of information services and 60% of registration services to be lodged electronically by 2017/18 | Achieved |
| Digitisation of local land search data and reduction of the average cost of local searches by 20%, improving the average speed of service by two days by 2017/18 | Digitisation of local land search data and reduction of the average cost of local searches by 20%, improving the average speed of service by two days by 2017/18, for those authorities where the Chief Land Registrar has served notice for responsibility |
| A 60% increase in productivity driven by digital by default by 2017/18 | A 45% increase in productivity by 2017/18 |
| Payment of a special dividend of £100m in 2013/14 and a further planned £100m in 2014/15 contingent upon market conditions | Achieved |
| Implementation of a sustainable model to make 100% of licensable data available to all by 2017/18 either for free or at marginal cost | Remains a key target but timing under review pending decisions on the potential privatisation |
| Access to data provided to all customers through an online application in 2013/14 | Achieved |
| 100% of all licensed data available to W3 data standard level 4 by 2017/18 | Remains a key target but timing under review pending decisions on the potential privatisation |
| Customer satisfaction maintained at no less than 96% | Maintain target at 90% |
| Net Promoter Score maintained at no less than 50% by 2017/18 | Target relinquished |
| Introduction of a free property alert service to the public in 2013/14 | Achieved (as Property Alert) |
| Recruitment to strengthen the Executive Team and better align accountabilities to deliver the Business Strategy by the end of 2013/14 | Achieved |
| Employee engagement levels to be in top half of the Civil Service by the end of 2014/15 | Not achieved |
We have achieved five of the strategic targets. We relinquished the target on net promoter score and modified the customer satisfaction target, both in the context of the provision of digital service, as opposed to provision of bespoke customer service. We have made good progress on our other strategic targets and measuring our units processed per post per day against the 2012/13 Business Plan budget we have achieved a 35.8% efficiency improvement to 31 March 2016.
Key issues and risks
In the Spending Review and Autumn Statement 2015, the Government announced its intention to “consult on options to move operations of the Land Registry to the private sector from 2017” and this commitment was repeated in the Budget in March 2016. Land Registry is making appropriate preparation for any transition and change of status, while continuing to focus on day-to-day land registration activities.
Currently there are 15 strategic risks, four of which are within the specified risk appetite in terms of impact and likelihood. The most significant risk is that we do not have the right numbers of people with the right skills to meet current and future business needs. Primarily this relates to frontline staff and the need to reduce the backlog and challenges for senior staff relating to the workstreams arising out of a transition and change of status. Further information is available in the Governance statement.
Explanation of going concern basis and significant liabilities
Land Registry is the statutory provider of land registration services and there is continued demand for those services; on statutory land registration, on Agricultural Credits and on Land Charges.
The volume of intake forecast for 2016/17 is 31.4 million applications equating to 12.6 million units, which is in excess of 2015/16; and there were no financial difficulties in 2015/16 under the fee order in place.
The provision of Land Registry services may alter in terms of operating model but there is no greater risk to the organisation’s continued activity. Our medium-term financial plans give no indication there is currently an increased risk to demand for land registration services.
Our year in figures
- Number of employees at 31 March: 4,486
- 60% women
- 40% men
- average full-time equivalent 4,035
- including 119 apprentices
- Customer satisfaction score: 94%
- Total number of applications for services:
- total: 30,20,012
- electronic 28,224,225
- Number of awards: 3
- for diversity (Employers Network for Equality and Inclusion)
- MapSearch (Civil Service Digital Award)
- Lean (Institute for Continuous Improvement in Public Services)
- Registered titles: 24.5 million
- Registered land: 87.9%, of 15.4 million hectares in England and Wales
- Income: £295 million
- Operating costs: £254 million
- Retained surplus: £21.1 million
- Dividend: £13.6 million
Our year in focus
We give assurance
A buoyant property market meant registrations rose for the sixth consecutive year. To cope with our increasing workload we:
-
undertook our biggest recruitment programme since the late 2000s, welcoming more than 250 permanent recruits and 57 apprentices
-
called on the expertise and dedication of our staff who responded by increasing local office productivity by 1.6%
-
increased overtime hours and moved staff with suitable experience back into casework roles
-
centralised the processing of certain application types to make them more efficient
-
enhanced and developed our range of digital services
Less costly, more efficient
Providing official copies of the register and associated deeds is integral to the conveyancing process, with around 10 million applications per year. By centralising the processing of application types into specialised teams, consolidating file storage from multiple suppliers to a single supplier, introducing new scanning technology and promoting digital alternatives to customers we have cut the number of staff involved from 116 people across 14 locations from 2012/13 to 56 people in one office today. The costs associated with paper, printing and postage have fallen from £1.57m per year to £0.57m. Digital applications for associated deeds rose from 68% to 96%.
Some customers encountered longer registration completion times than they were used to in the past as we experienced an increase in our works in progress, particularly those which involved the registration of new titles, as demand increased. We:
-
continued to prioritise applications required for property transactions and mortgage applications, with 98% of information services applications processed within two days
-
launched our new, free Application Enquiry service which allowed our business customers to view the progress of their applications online
-
surpassed our 98% target for the quality of our registrations.
At 94% our customer satisfaction for the year was comfortably above our target.
The Land Register has grown steadily since it was created in 1862 but in recent years the number of titles added each year has accelerated. Over the past two years we have:
-
added 1% of the land mass of England and Wales every six months, moving close to 88%
-
increased the number of titles in the register to close to 24.5 million.
We continued to strengthen our counter-fraud activity and measures, with:
-
the number of active Property Alert accounts almost doubling to just under 30,000
-
our Property Fraud Line reaching its third anniversary having received nearly 3,000 calls and emails from members of the public seeking help to protect their homes
-
an external counter-fraud conference featuring speakers including the Metropolitan Police
-
an internal Fraud Awareness Week promoting key messages
-
staff joining police in leafleting the public as part of Operation Rogue Trader
Our lawyers worked with the Law Commission on a review of the Land Registration Act 2002 which could have significant implications for future practice and represented Land Registry in a rare Court of Appeal case, Swift 1st Limited v Chief Land Registrar, which clarified important aspects of the law regarding indemnity.
Faster conveyancing
Our Local Land Charges Programme is regarded by the Government as a key element in improving the conveyancing process and providing assurance to the property market. Searching for Local Land Charges – which are binding obligations, prohibitions or restrictions on a property – in advance of a sale can be slow and expensive. By delivering a single Local Land Charges register for England under the powers given to us by the Infrastructure Act 2015 we will provide confidence and consistency to customers. We have started to build the register, working with the 326 English local authorities which currently hold the data.
We have integrity
This was the first year where all our applications were handled electronically, either as digital submissions or through front-end scanning, other than first registrations as we don’t scan deeds. This was thanks to:
-
the effectiveness of our Business e-services
-
the popularity of our 50% discount for electronic applications
-
the success of our scanning service in turning paper applications into electronic documents
-
the developing role of our case management ‘workflow’ system in distributing electronically mobile work around the organisation.
We reviewed our progress against our Business Strategy and updated our vision and values to ensure they were relevant and resonated throughout the organisation. Every member of staff had the opportunity to have their say on their development and we ran a comprehensive training programme to ensure that all of our staff knew the vision and values.
A modern working environment
Our Coventry Office moved from its home of 20 years, Leigh Court, to allow a free school to take its place. We moved our operations to city centre Earlsdon Park and also transformed the working environment for the 200-plus staff by using more modern working methods, including hot desking and improved information communications technology. Daily team meetings are held around plasma screens with up-to-date information rather than in front of a wall of paper print-outs. We share the building and facilities with Civil Service colleagues from the Department for Education and the Local Government Ombudsman.
Continuous improvement
Our ‘Coventry GoSee’ learning resource helps staff understand how to apply the principles of continuous improvement effectively. A tour of Coventry shows ‘Lean’ processes in real-life situations. By putting participants firmly in the role of a customer they are able to identify waste, observe the flow of work and find ways of improving customer satisfaction. They see good and bad cases of systems thinking, visual management and dealing with bottlenecks, as well as many examples of managing workflow and variation in demand and waste. The project won the Institute for Continuous Improvement in Public Services Special Innovation Award 2016.
Collaboration across the organisation helped find multi-million pound savings to meet our target of achieving a 5% reduction in running costs. Our efficiency measures included a:
-
£1.7 million reduction in computer hire, maintenance and depreciation costs by finding more cost-effective ways to replace our equipment
-
£0.6 million reduction in utility and security costs as we reduced the size of our estate under our Estate Strategy
-
£0.5 million reduction in our contract spend with the DX delivery network
-
£0.9 million reduction in spending on scanning paper documents as their number continued to decline
We drive innovation
We improved our digital capability and performance as we moved closer to our ambition of being digital by default. We:
-
developed new services by agile principles in multi-disciplinary teams which pool their expertise to solve problems and take the service through customer research and testing, prototype building and launch
-
worked with the Government Digital Service to test our prototypes against the highest standards
-
ensured our customers can always apply electronically by achieving a near perfect performance on the availability of our e-services, keeping them running 99.96% of the scheduled time
-
started building a new technology platform capable of supporting the comprehensive digital services of the future
Our new digital services to improve the conveyancing process included our:
-
Bankruptcy Register, providing an improved search service to mortgage lenders and others (launched in April 2016)
-
Find Property Information service, allowing anyone to search the register online by property and log in to obtain further details (in development)
-
Digital Mortgage service, allowing borrowers to digitally sign their mortgage deeds (in development)
Royal recognition
Business customers saved just over £2 million in fees in 2015/16 by using our free MapSearch service in favour of a traditional search of the index map. The online mapping tool was created to allow business customers to check whether a property is registered, view its location and obtain its title number and details of tenure. Just over four million searches were made during the year but our customers weren’t the only people to show an interest. MapSearch won a Civil Service Award in the digital category and the team representing Land Registry had the honour of talking about the service to Her Majesty the Queen.
Our data releases meet the demand for open and transparent government and provide the raw material for innovative businesses to create new products and services. We released four new datasets, including:
-
Additional Price Paid Data, making information about repossessions, buy-to-lets and transfers to non-private individuals available free of charge
-
National Polygon and Title Descriptor, allowing customers to view, download, host and interrogate our entire index map for the first time
-
Overseas Companies, revealing more than 100,000 freehold and leasehold titles owned by companies incorporated overseas
Tackling corruption through transparency
Releasing the Overseas Companies dataset was an important step in fulfilling the Prime Minister’s promise to tackle corruption and tax avoidance through greater corporate transparency. We routinely record whether a company buying a property is registered in the UK or overseas. However delivering the details of more than 100,000 freehold and leasehold titles was nevertheless a huge team effort delivered to a very tight timescale. We identified more than 20,000 titles requiring investigation and updated their register entries where necessary, producing a high quality dataset.
We are professional
To achieve our Business Strategy vision of a workforce of “highly professional and motivated knowledge workers”, we:
-
invested in our current staff, our new recruits and our apprentices, increasing the average number of training days per employee from 5.2 to 7.1
-
adopted a People Strategy with input from across the organisation, ensuring we have a workforce clear on their priorities and focused on delivery and we have the capability, capacity and culture to undertake our digital and technical transformation
-
gained a much more detailed understanding of our resourcing needs by developing a workforce plan and tactical recruitment plan
-
created a change framework putting people at the heart of change processes
-
encouraged diversity, reaching 61st place in the Stonewall Top 100 and winning the Representative Workforce category of the Employers Network for Equality & Inclusion Awards
-
recognised outstanding individuals in the inaugural LR Leisure People Awards, with management working with the LR Leisure Committee
With rising workloads, a large number of staff approaching retirement and the need for new digital skills it has never been more important to plan our future recruitment. Our recruits included:
-
permanent casework executives from both within and outside the Civil Service
-
57 apprentices to join the 78 who arrived the previous year. Our scheme is one of the biggest and most productive in government with the apprentices working on live casework from the very start of their two-year apprenticeship. They have demonstrated their value not only in casework, but also in their insights into digital working and systems development. Some have already secured permanent executive roles
-
16 new lawyers to enhance our legal expertise. Their training was a two-way process as they brought new skills and knowledge to Land Registry, such as digital awareness and recent litigation experience in private practice
Up-to-date training
The long hiatus since our last large-scale recruitment programme meant we needed a completely revamped training course for our new caseworkers. Much of the existing training material was out of date and technology had moved on. A cross-office team designed and built a new package to a tight two-month deadline. Managers, trainers and ‘buddies’ in each recruiting office used it as the basis of their training programme while also learning from their own and their counterparts’ experience as they put it into practice.
Our levels of staff engagement improved steadily despite the challenges of the year. We:
-
carried out quarterly Pulse surveys
-
published regular blogs by the Chief Executive and the directors
-
encouraged staff to comment freely and publicly in response to the blogs
-
created a Unified Communications system allowing staff to communicate and collaborate with each other from their desks via video, audio or instant messaging and on-screen sharing
(b) Performance analysis
Key annual performance indicators and milestones
The performance indicators and milestones were approved by the Minister and are aligned to the new strategic values which were established as part of the Business Strategy refresh. They measure key aspects of day-to-day business along with planned change milestones designed to support the Business Strategy.
| Key annual performance indicator/objective | Performance | |
|---|---|---|
| We give assurance | ||
| A1 | The percentage of customers who rate our overall services as good, very good or excellent to achieve 90% | 94% |
| A2 | Substantive registrations to pass at least 98% of defined quality checks | 98.06% |
| We have integrity | ||
| I1 | A 5% reduction in running costs compared with the budget for 2014/15 | Met |
| I2 | Unit cost to be £19.91 (based on a planned volume of 11.8 million units) | £19.49 |
| I3 | Achieve at least 12 units processed per full-time equivalent post per day based on a planned volume of 11.8 million units | 12.09 |
| We drive innovation | ||
| Inn1 | Average external e-service availability at 99.6% or higher during published service hours | 99.96% |
| Inn2 | We will establish two public beta services operating on the GOV.UK website by the end of March 2016 | Not achieved |
| Inn3 | We will release a further four datasets by 31 March 2016 including price paid information on commercially owned properties | Achieved |
| We are professional | ||
| P1 | Maintain a consistent index score calculated from a basket of four measures designed to measure motivation and performance of our workforce (see note 1) | Met |
| P2 | To achieve an improvement in the engagement score for leadership and managing change over two years of 15% compared with the 2014/15 baseline | Two-year target |
| P3 | Capability Milestone 1 – In 2015/16 to achieve an overall increase in the engagement score of 2%, with a 4% improvement in leadership and managing change in the Civil Service Survey and a 4% improvement in response to senior managers taking action on results from the survey |
3% 6% 12% |
| P4 | Capability Milestone 2 – 75% or more of the apprentice intake are still on the scheme at 31 March 2016 | 93% |
| P5 | Capability Milestone 3 – By the end of March 2016 we will have refreshed the workforce through a new starter rate of 4% | 7.4% |
| Note 1: The indicator measures organisational health indicators such as development days, sickness and fairness in distribution of performance marks across protected characteristic groups. The pass score is less than 11. |
We achieved:
-
all seven of the key performance indicators (KPIs) relevant including an additional target to reduce our running costs by 5% that was set by the Minister after the KPIs had been agreed, and
-
four of five milestone targets
We also made good progress on the two-year target to improve the engagement score for leadership and change by 15%.
The milestone that was not achieved was the provision of two new public beta services on GOV.UK. In fact we developed three (not two) digital services last year – a digital bankruptcy service for the Insolvency Service, the digital register view and digital charges. These products were developed and were available by 31 March but not on GOV.UK, but while the exact requirements were not met, this still represented very significant progress.
Finance Director performance analysis
Revenue
Our total revenue was £295.4m (2014/15: £297.1m), down £1.7m (0.6%) year on year. This was primarily as a result of the continued impact of our discount for electronic lodgement of dealings, but part compensated by rising intake volumes and rising house prices putting fees into higher bands. Transaction volumes excluding bulk register updates of 11.7m units (2014/15: 10.9m units) were up 0.8m (7.3%) on the prior year. Bulk register updates were comparatively low in 2015/16.
£’000
income
Operating costs
Our operating costs of £254.2m (2014/15: £249.5m) included staff costs of £168.2m (2014/15: £165.2m). Salary costs rose by £3m (1.8%), although full-time equivalent (FTE) average headcount increased from 4,033 to 4,035 over the year. This includes our apprentice scheme, disclosed separately, in note 4.2, which shows an increase to 99 average FTE (2014/15: 39). The salary increase reflects a combination of overtime, pay award and the national insurance changes.
Operating costs are affected by an increase to the outstanding claims provision of the indemnity fund of £2.1m (2014/15: £2.8m decrease) and an increase to the incurred but not reported (IBNR) provision of £9.1m (2014/15: £11.5m, see details in Other costs).
Other costs
There were finance lease charges of £0.7m (2014/15: £0.9m) and amortisation and depreciation of e-service systems of £3.5m (2014/15: £3.5m). Costs were offset by investment income of £1.8m (2014/15: £1.9m). Our impairment of non-current assets on buildings was £6.5m (2014/15 £1.1m). This followed a full valuation exercise to review the valuations of our buildings and reflect the most up-to-date market evidence.
Overall costs are £260.7m (2014/15: £260.5m). This is an increase of £0.2m (less than 0.1%). The underlying trend reflects a drive for efficiency, being 32% cumulative from 2008/9, the year of the property market crash, on the cost of service ignoring inflation (40.7% after accounting for inflation). The surplus before dividend for the year is £34.6m (2014/15: £36.6m).
Indemnity Fund
Schedule 8 to the Land Registration Act 2002 requires us to indemnify third parties against loss caused by mistakes in the register, mistakes in search results and loss of documents. Most of our indemnity claims arise as a result of mistakes in the register, and some of these mistakes are the result of forgery of documents such as charges. We provide for these claims under our Indemnity Fund, which covers both known claims and the liability for IBNR claims. External review and valuation of these provisions is conducted annually by Lane Clark & Peacock LLP, our actuaries.
In 2015/16 we paid £8m for 1,003 claims, compared with £8.3m for 968 claims in 2014/15. The largest claim paid this year was for a forged charge, settled for £530,000. This settlement of the large claim (in common with a number of others) had been delayed pending the outcome of the Swift Court of Appeal hearing, in which Land Registry was ordered to pay a lender indemnity for its loss arising from a forged charge, settling the law in this area under the Land Registration Act 2002. Fraud (usually by way of forgery) remains the single most significant cause of indemnity payments and this reflects the general trend over the past decade or so.
The original maximum value of the substantive claims paid was £8.6m but these were settled for £6.4m, a reduction of £2.2m. During the year a further 365 claims valued at £5.5m were settled for no value. Of these 22 were for fraud and were valued at £3.7m. During the year 1,384 new claims were received totalling £15.8m, including 57 fraud claims valued at £7.2m.
We recovered £0.2m under our statutory rights of recourse, compared with £0.1m last year. Recourse figures tend to vary considerably from year to year, reflecting the unpredictable interplay of legal and factual elements which will determine the viability of achieving any recovery, see Appendix F.
Indemnity Fund provision
This year the value of the outstanding claims provision increased to £10.5m (2014/15: £8.4m). The impact of this increased provision was a charge of £2.1m to our operating costs (2014/15: £2.8m reduction). Further information, including sensitivity analyses, can be found in note 16.2 in the accounts.
Indemnity Fund IBNR provision
This year the value of the Indemnity Fund IBNR provision has increased to £74.3m (2014/15: £65.2m). The impact of this increased provision was a charge of £9.1m to our operating costs (2014/15: £11.5m) The change is caused by three factors, the change in prescribed HM Treasury long-term discount rate increasing the provision by £14.9m, offset by a reduction in provision for unreported/reopened Swift claims of £4.5m and a reduction caused by changes in reporting patterns and average claim costs of £1.3m. Further information, including sensitivity analyses that reflect the estimated nature of the IBNR liability and susceptibility of the provision to fluctuation, can be found in note 16.2 in the accounts.
Dividends
A dividend of £13.6m (2014/15: £19.1m) is based on a 3.6% return on capital employed (2014/15: 4.6%). This left a retained surplus of £21.1m (2014/15: £82.5m deficit, after special dividend of £100m).
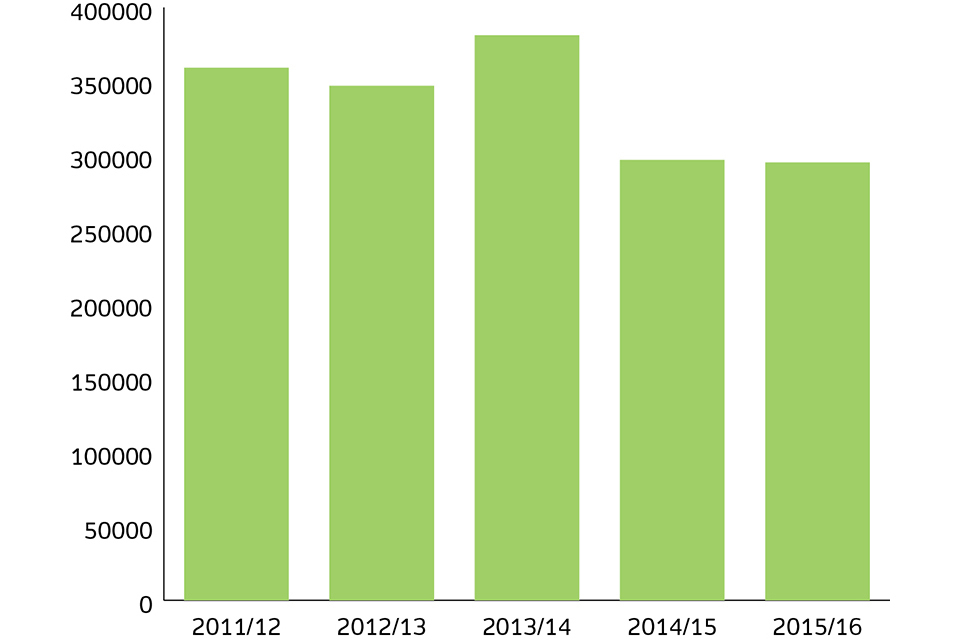
Statement of financial position
The statement of financial position remains robust. Net assets rose to £373.6m (2014/15: £360.3m). Closing cash was £443.9m (2014/15: £397.8m).
Non-current assets
The 14 office buildings we occupied at the end of the year provided a total of 67,078 square metres of office space. Our total spend on property (including rent, business rates and service charges) and facilities management (including utilities, post and reprographics) was approximately £23m. Our expenditure on contracted-out services with facilities management provider Carillion was £10.1m.
Our Coventry Office was sold to the Education Funding Agency for £4.6m. Staff were relocated to leased accommodation at Earlsdon Park in Coventry.
At Nottingham the northern plot of our former Chalfont Drive site was sold to Bellway Homes for residential development for £9.4m, to be paid in instalments with a down payment received in 2015/16 of £4.75m and £4.65m due in January 2017.
Our leased accommodation for our former York Office, which had been sublet, was vacated and the lease terminated.
We continue to share surplus space in our properties with other government departments and commercial tenants and this year has seen further co-locations including with BAE Systems at Weymouth Office. Our tenants now occupy 22,725 sqm (25.5%) of the whole estate. This has enabled a further reduction in our estate occupancy per full-time employee, which has fallen from 13.67 sqm to 11.46 sqm. The operational estate is currently 69% occupied.
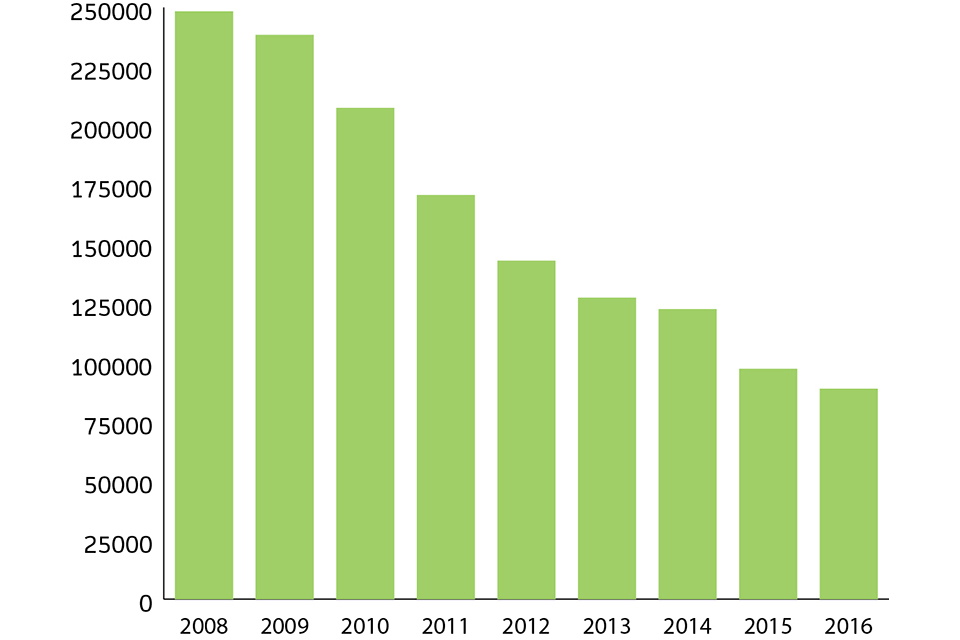
The value of our estate is now £55.6m with no assets classified as held for sale (2014/15: £85m, which included assets held for sale of £12.2m). The reduction is due to a downward revaluation of £5.6m, an impairment charge of £6.5m, disposals with a net book value of £16.1m and a depreciation charge of £1.2m.
The graph below summarises the progress made in reducing the size of the estate since 2008. It reflects our commitment to demonstrating consistent improvements in the effectiveness and efficiency of our estate in support of the Government’s Efficiency and Reform Agenda.
Whole estate size 2008 – 2016 (m2)
whole estate size
The estate was externally valued by Cushman & Wakefield. The overall movement was a fall in value of £29.4m following the disposal of Leigh Court in Coventry and the northern lot of Chalfont Drive, Nottingham. We have three properties meeting the definition of investment property (the second floor of Weymouth Office, Old Market House in Birkenhead and the Earl House Extension in Hull, which are let on a commercial basis).
Our total capital spend, primarily on information communications technology (ICT) equipment, was £5.6m (£5m tangible and £0.6m intangible).
Treasury Management
Management of liquid assets is governed by the Land Registry Trading Fund Order 1993, the Additional Assets Order 1996, the Extension and Amendment Order 2003 and the framework document 2012. Non-operating cash balances are maintained in interest-bearing accounts at the Government Banking Service and the National Loans Fund with the balance held with a UK commercial bank.
Performance
Performance is as reported in Performance analysis.
Future activities: Business Strategy and Business Plan
Our future activities are driven by the Business Strategy, which was approved by ministers in December 2012. This strategy, which is now incorporated within our overall Business Plan 2013/18, incorporates our objectives and a new vision that sets out an ambition to achieve significant change. Details are covered in the performance section.
Main trends affecting future activities
The main trend affecting future activities is the level of housing market activity. This is reviewed constantly using a range of indicators from internal and external sources. Our assumption for the 2016/17 year is that activity will be 12.9m units, including 0.4m bulk register updates. This is higher than the activity for 2015/16 (11.9m units including 0.2m bulk register updates).
Directorships and significant interests
Directorships and significant interests are covered in the corporate governance report.
Key relationships
We maintain close relationships with our suppliers through our procurement and contract management processes. Our key suppliers for the year included TNT, Carillion and IBM. The performance of these key suppliers is closely monitored to ensure the contracted service is being delivered effectively, improvement opportunities are sought and we continue to receive good value for money.
Our key suppliers are monitored in line with the relevant strategic risk and we are taking further steps to enhance our open book contract management activity.
Significant use continues to be made of cross-government contracts, in line with the Cabinet Office’s procurement policy.
HM Revenue & Customs
Following a tax compliance audit by HM Revenue & Customs, a provision of £1.2m has been provided. Details of provisions can be found in note 16.1.
Pensions
Details of how pension costs and liabilities are treated in the accounts can be found in note 1.7 and note 4.4 in the accounts and in the remuneration and staff report.
Payments
We comply with the Late Payment of Commercial Debt (Interest) Act 1998 and the Better Payment Practice Code. During the year we paid 92.5% of undisputed invoices received from suppliers within five working days (2014/15: 93.1%).
Principal risks and uncertainties
We face challenges and risks to the achievement of our strategic and business objectives. Key current strategic risks relate to our Business Strategy and the capability and capacity required to deliver our ambitious programme of business change.
Strategic risks are managed at Land Registry Board level. Directorate risk is managed by each director. Programme and project risk is managed within parameters set for the relevant boards. Information risk is managed in line with CESG (the national technical authority for information assurance) guidance. Risk is escalated where the risk appetite is exceeded and an adverse impact on targets, reputation or operations could arise.
Auditors
The accounts have been audited by the Comptroller and Auditor General (C&AG). The cost in respect of services relating to the statutory audit for 2015/16 was £65,000 (2014/15: £65,000).
Catherine Vaughan, Finance Director
28 June 2016
Performance on other matters
Land registration
We registered 283,840 hectares for the first time, taking the total registered area to 13,557,628 hectares or 87.93% of England and Wales. This is despite the testing market conditions and the reduced remaining area of unregistered land.
The calculation of the total land area is complicated. We are working to improve the methodology which has to take account of a number of factors. These include, for example, the property footprint on the ground, the registered properties above ground floor level and the registration of rights below ground, for mines and mineral rights, and the land around the coast, which varies subject to the tides.
Public Sector Information Holder
We fulfill our role as a Public Sector Information Holder by adhering to the Data Protection and Freedom of Information Acts. We take the protection of our information seriously and mandate annual Responsible for Information learning for our staff. We have augmented this training by promoting good practice in the areas of cloud collaboration sites and email security. Our Senior Information Risk Owner (SIRO) oversees an information risk management process, which is measured through external accreditation (ISO27001) and independently challenged self-assessment (using the Information Assurance Maturity Model – IAMM).
Significant changes
On 24 March 2016 the Government launched a consultation about the options to move Land Registry operations into the private sector. Responses were required by 26 May and at the time of publication no decision had been announced by the Government.
Responsible business
We are committed to performing as a responsible business, and to providing encouragement and support to our people to enable them to contribute to that aim.
With the support of Business in the Community, and through their own endeavours, Land Registry people have continued to participate in a range of volunteering activities including voluntary work in the community and as magistrates. We continue to encourage and support them to do so with the assistance of our volunteering policy and supportive managers. In 2015/16, 262 members of staff undertook volunteering across a range of activities, providing support to others while gaining valuable experience and skills they can bring back to Land Registry. For example, working alongside volunteers from other organisations in the area, members of staff from our Plymouth Office volunteered as job coaches with the Shekinah Mission as part of their Ready for Work programme designed to help people get back into work. Our staff also work with Plymouth City Council as Appropriate Adult and Referral Panel Members, and with Crisis to help their work for homeless people.
Charitable fundraising has continued to be a prominent part of our commitment to responsible business, with many events taking place across our offices to raise money for a number of national and local charities. These have included taking part in fun runs and other sporting events, cake sales and collecting for food banks, as well as supporting national events such as Sport Relief and Movember. In February staff raised £5,841.23 for World Cancer Day through a range of coordinated activities across our offices.
All our offices have a dedicated Health and Wellbeing Committee, encouraged and supported to develop initiatives and activities to promote healthy lifestyles and the physical and emotional wellbeing of our people. Wales Office retained the Gold Corporate Health Standard, the national quality mark for workplace health promotion in Wales.
We ensure we pay our suppliers’ invoices promptly to assist with their cash flow and business planning and we share ideas and expertise in responsible business with other government departments, particularly in the environmental and sustainability fields.
LR Leisure, our national sports and social association, organises events throughout the year including a festival, a walking challenge, an arts and photographic competition, a team quiz and various sporting tournaments as well as entering teams in Civil Service tournaments. In October it held the inaugural LR Leisure Awards to recognise the hard work and dedication of staff who support sports and leisure activities and give their time to volunteering and charity work.
Open and full information
We received 442 Freedom of Information requests, of which 433 were answered within 20 working days.
Sustainability report
We manage the delivery of land registration in an environmentally responsible way. We utilise our Environmental Management System (EMS) to ensure we are continually improving and working towards the required targets set as part of the Greening Government Commitments (GGC) and the Greening Government ICT requirements. This report is delivered in line with the 2015/16 guidelines supplied by HM Treasury.
We continue to be accredited to the environmental ISO14001 standard which independently ratifies our performance across the full range of sustainability activities.
Current performance against the 2009/10 sustainability baseline data is as follows against the draft GGC targets.
| Area | Achieved | Proposed draft target for 2020 | On target? |
|---|---|---|---|
| Carbon | 41% reduction | 31% reduction | Yes |
| Waste arising | 44% reduction | Reduce the amount of waste generated by at least 25% | Yes |
| 97% recycled | Recycle or compost at least 70% of waste | Yes | |
| 3% to landfill | Landfill less than 10% of waste | Yes | |
| Water consumption | 36% reduction | 25% reduction (self-imposed) | Yes |
| Paper consumption | 39% reduction | Reduce our paper use by 60% from 2009/10 baseline | Yes – changes to Land Registry digital delivery will continue to deliver a reduction in paper consumption |
In addition the following requirement within the GGC continues to be delivered.
- Continue to pursue public procurement practices that are sustainable, so that the Government buys more sustainable and efficient products with the aim of achieving the best overall value for money for society.
Departments will report on the systems they have in place and the action taken to support this commitment, including:
-
to embed compliance with the Government Buying Standards in departmental and centralised procurement contracts, within the context of government’s overarching priorities of value for money and streamlining procurement processes
-
to understand and reduce supply chain impacts.
Performance data against draft GGC targets
| Area | Performance | ||
|---|---|---|---|
| Actual | 2020 reduction target | ||
| Energy: greenhouse gas emissions, all areas within scope | Carbon emissions (tonnes) | 8,392 | 9,776 |
| Expenditure (£) | 1,641,835 | ||
| Waste | Consumption (tonnes) | 1,106 | 1,484 |
| Expenditure (£) | 212,993 | ||
| Water | Consumption (m³) | 36,396 | 38,346 |
| Expenditure (£) | 173,819 |
Governance
Compliance with environmental legislation is managed through the Sustainability Governance Framework and compliance meetings with Carillion. This is managed through the Sustainability Manager by our Senior Facilities Business Partners and Carillion.
Overall delivery of additional requirements of GGC
The draft targets continue to drive central government to be more sustainable and ensure the requirements of the Climate Change Act (2008) of a reduction of 31% by 2020 in greenhouse gas emissions is delivered.
Climate change adaptation
Climate change impacts are considered during the delivery of building works and projects.
We utilise information delivered in building condition surveys and forward maintenance plans as part of our sustainability reduction strategy during major refurbishments relocations or significant building plant replacement. The Climate Change Adaptation Plan is kept under continuous review.
Biodiversity and the natural environment
Biodiversity improvements continue to be introduced where financially viable through Carillion. In particular improvements have been made by a number of initiatives with grounds maintenance. Changes to the planting processes have allowed the contractor to promote biodiversity by encouraging bees and butterflies.
Other areas of significance
Ten of our offices are taking part in a European initiative called Save@Work with SevernWye energy consultants to reduce energy through behavioural change.
Carbon
| Greenhouse gas emissions | 2015/16 | 2014/15 | 2013/14 | 2012/13 |
|---|---|---|---|---|
| Non-financial indicators (tCO2e) | ||||
| Total gross emissions for scopes 1 and 2 | 7,835 | 8,048 | 8,404 | 10,447 |
| Electricity: green/renewable | 1,195 | 2,306 | 2,780 | 2,265 |
| Total net emissions for scopes 1 and 2 (ie having removed renewable elements) | 6,640 | 5,742 | 5,624 | 8,182 |
| Gross emissions scope 3 travel (gross emissions scope 3 includes all available business travel) | 557 | 608 | 724 | 893 |
| Total gross reported emissions | 8,392 | 8,656 | 9,128 | 11,340 |
| Non-financial indicators (mWh) | ||||
| Electricity: purchased (grid, combined heat and power, and non-renewable) | 12,956 | 12,902 | 12,200 | 15,943 |
| Electricity: renewable | – | – | – | – |
| Gas | 7,325 | 6,989 | 8,355 | 11,567 |
| Other energy sources | – | – | – | – |
| Total energy | 20,281 | 19,891 | 20,555 | 27,510 |
| Financial indicators (£’000) | ||||
| Expenditure on energy | 1,641 | 1,684 | 1,810 | 2,043 |
| Expenditure on accredited offsets (eg Government Carbon Offsetting Fund) | – | – | – | – |
| Expenditure on official business travel | 1,222 | 1,142 | 1,240 | 1,127 |
Notes:
- data includes other government departments in occupation of our estate, but excludes data relating to non-government tenants.
- Ordnance Survey and the NHS who use Land Registry data centre services report their carbon consumption directly to government. This equates to 2,674,431KWh, resulting in the removal of 1,338 tonnes of carbon.
- throughout this report our consumption data includes government tenants sharing our estate but excludes data relating to non-government tenants.
The greenhouse gas draft target is to reduce emissions by 31% by March 2020 over the baseline data for 2009/10.
Gross emissions have fallen by 40.8% over the baseline and by 5.6% over the previous year.
Consumption has increased over the last year. This is due to the recruitment of 250 permanent recruits, 57 apprentices and additional tenant numbers in some locations and an increase in working hours across the estate.
The cost of the Carbon Reduction Commitment to the organisation was £163,452.
Our overall reduction in carbon emissions since 2009/10 is 41%. See Appendix E for historical trend data.
Waste management
| Waste | 2015/16 | 2014/15 | 2013/14 | 2012/13 | |
|---|---|---|---|---|---|
| Non-financial indicators (tonnes) | |||||
| Hazardous waste | 1.6 | – | – | – | |
| Non-hazardous waste | Landfill waste | 31.9 | 105 | 101 | 379 |
| Reused/recycled waste | 972.0 | 802 | 858 | 1,042 | |
| Energy from waste | 6.6 | – | – | – | |
| Total waste arising | 1,012.1 | 907 | 959 | 1,421 | |
| Financial indicators (£’000) | |||||
| Hazardous waste | – | – | – | – | |
| Non-hazardous waste | Landfill waste | 4 | 180 | 144 | 197 |
| Reused/recycled waste | 208 | 99 | 146 | 218 | |
| Incinerated waste | – | – | – | – | |
| Total waste costs | 212 | 279 | 290 | 415 |
The waste draft target is to reduce the amount of waste generated by at least 25% from a 2009/10 baseline and strive to reduce it further, recycle or compost at least 70% of waste, and landfill less than 10% of waste.
The organisation is currently meeting all of the draft targets with performance as follows: the amount of waste generated reduced by 44%, the amount of waste recycled, diverted or composted is at 97% and landfill is at 3% of waste.
Waste management is delivered through two routes. Paper waste is managed through a confidential waste disposal contract outside of the facilities management contract. All other waste management is delivered through the facilities management contract with Carillion.
Of the waste arising 826 tonnes is paper sent for processing through the closed loop paper recycling provision within government. This paper equates to 66% of our total waste arising.
Our overall reduction in waste production since 2009/10 is 44%. See Appendix E for historical trend data.
Water consumption
| 2015/16 | 2014/15 | 2013/14 | 2012/13 | |
|---|---|---|---|---|
| Non-financial indicators (cubic metres) | ||||
| Consumption | ||||
| Supplied | 36,395 | 38,153 | 36,037 | 31,230 |
| Abstracted | – | – | – | – |
| Total consumption | 36,395 | 38,153 | 36,037 | 31,230 |
| Financial indicators (£’000) | ||||
| Total supply costs | 173 | 188 | 228 | 236 |
The water draft targets are to continue to further reduce water consumption from a 2009/10 baseline. This allows departments to set their own internal targets for water reduction and report on their progress against these. Additionally departments will continue to report on office water use (m³ per FTE).
A 36% reduction in water consumption has been achieved against a target of 25%. Consumption per FTE, including staff on Land Registry sites from other government departments, is 7.7m³.
Paper usage
The draft paper reduction target to reduce our paper use by 60% from a Land Registry baseline year of 2011/12 shows a current improvement of 39% over A4 equivalent paper use. Our continued move to the delivery of digital services will have a significant impact on paper requirements over the next few years.
Sustainable procurement against GGC
The Corporate Procurement Team continue to work to maintain and, we hope, improve on Level 3 (Practice) across all categories in the Sustainable Procurement Flexible Framework maturity model. By working with our business stakeholders and key suppliers, the Cabinet Office’s Government Buying Standards is now embedded into our procurement processes.
Key suppliers are to identify and progress opportunities for making social and environmental improvements. We have continued to work on sustainability issues as highlighted by:
-
recent procurement activities for shredding, where 100% of confidential waste is now recycled in the UK, compared with the previous process where waste was taken to Germany
-
the printer refresh, working with Carillion on corporate social responsibility issues and ensuring the application of the buying standards for a refresh of all our printers.
We continue to support local charities and will also be working with Carillion through Business in the Community to support our chosen charity, Hospice UK.
Other information
Rule Committee
The Rule Committee was constituted under the Land Registration Act 2002 to provide advice and assistance originally to the Lord Chancellor but now, since the transfer of ministerial responsibility for Land Registry to the Department for Business, Innovation and Skills, to the Secretary of State in making land registration rules and fee orders under the Act.
The Rule Committee was involved in the following activities in the past year.
(1) In March 2015, the Department for Business, Innovation and Skills completed a Triennial Review of the Land Registration Rule Committee and published a report containing its recommendations and conclusions.
(2) On 2 June 2015, the Rule Committee met to consider the recommendations and conclusions in the report. The Rule Committee resolved to accept the recommendations and conclusions and determined the steps to be taken to give effect to the same.
(3) In November 2015, the Royal Institution of Chartered Surveyors nominated Carl Calvert as their representative on the Rule Committee in accordance with the Land Registration Act 2002, section127(2)(g). Carl Calvert replaced David Powell who retired after serving on the Rule Committee since its inauguration in 2002.
The Rule Committee was not called on to give advice and assistance to the Secretary of State during the past year as no land registration rules or fee orders were made by the Secretary of State in that period.
Policy and Stakeholder Unit
Our Policy and Stakeholder Unit incorporates international and domestic policy and development, stakeholder engagement and public affairs. It ensures our interests are properly represented domestically and globally and the importance of land registration and its benefits are promoted to others. The unit sits as part of the Chief Land Registrar’s Office, giving Land Registry a presence across government and counterpart organisations overseas.
In 2015/16 we responded to 16 Land Registry written and oral Parliamentary Questions and supported other departments with responses to their questions. Key pieces of policy work this year have included participation in a cross-government working group exploring the recording of beneficial ownership information for overseas companies that wish to buy property in England and Wales or bid for public contracts in England. This work is part of the Government’s anti-corruption agenda, and as a first step to improve transparency of foreign ownership we released our Overseas Companies property ownership dataset in March.
We have also been working across government to increase transparency in the property market, including by increasing the visibility of information relating to options to purchase or lease land, which was a commitment announced in the Budget statement.
Land Registry staff hold positions within various global forums. In support of British foreign policy we assist with the development of land administration overseas. We participated in a United Nations Economic Commission for Europe (UNECE) mission to Armenia in April 2015. Our involvement in the UNECE 2014 mission to Uzbekistan was also formally recognised by UNECE with its publication of the Country Profile in March 2016.
This year there have been significant pieces of work with Rwanda and the Republic of Azerbaijan, and we have taken part in a UK Trade & Investment-sponsored trade mission to Uganda and Tanzania.
In the last year we have also hosted educational study visits for representatives from many jurisdictions including China, Indonesia, Malaysia, Nigeria, Rwanda, South Korea, Turkey and Uganda, and hosted ministerial visits for officials from our counterpart organisations in Indonesia, Iraqi Kurdistan and Tanzania.
The unit organised a stakeholder event hosted by Chief Executive and Chief Land Registrar Graham Farrant in November 2015 at the Royal Society, bringing together major stakeholders for the first time in this way. Its success has now established this as an annual event with 2016, we hope, seeing a larger and broader mix of domestic and international stakeholders.
Graham Farrant, Chief Executive and Chief Land Registrar
28 June 2016
Accountability report
Corporate governance report
(a) Directors’ report
Pension liabilities
Details of the treatment of pension liabilities are available in note 1.7 and note 4.4 to the accounts and in the Remuneration and staff report.
Details of directors and boards
Land Registry Board
The remit of the Land Registry Board (LRB) is supervisory and advisory. The LRB is responsible for governance and public accountability, sets the Land Registry strategy and assists the Chief Executive and Chief Land Registrar in his ultimate responsibility as Accounting Officer for the governance and performance of Land Registry.
The LRB terms of reference which were first approved in 2012 were revised during 2015/16.
The LRB meets formally 10 times per year, with additional meetings as and when required. The Chair, the Chief Executive and Chief Land Registrar and the Finance Director also held quarterly meetings with the shareholder executive (transferred to UKGI 1 April 2016 – UK Government Investments).
Land Registry Board membership
| LRB membership | |
|---|---|
| Mark Boyle (Chair) | Non-Executive Chair (to 31 March 2016) |
| Tim Franklin | Non-Executive Director and Senior Independent Director (Interim Chair from 1 April 2016) |
| Catrina Holme | Non-Executive Director |
| Gerard Connell | Non-Executive Director |
| Leo Geddes | Non-Executive Director |
| Graham Farrant | Chief Executive and Chief Land Registrar (from 1 June 2015) |
| Craig Lester (note: attends as an observer) | Assistant Chief Executive (from 11 January 2016) |
| John Peaden | Director of Operations and (from 19 March to 31 May 2015) Interim Chief Executive and Chief Land Registrar |
| Catherine Vaughan | Finance Director |
| Note: Mike Westcott-Rudd attends as legal adviser |
Executive Board
The Executive Board (EXB) is chaired by the Chief Executive and Chief Land Registrar and its members are Land Registry’s executive directors. The EXB is responsible for the delivery of Land Registry’s Annual Management Plan and for the day-to-day operational management of the business. The Board meets on a monthly basis and met on 10 occasions throughout the course of the year.
| Executive Board membership | |
|---|---|
| Graham Farrant (Chair) | Chief Executive and Chief Land Registrar (from 1 June 2015) |
| Craig Lester | Assistant Chief Executive(from 11 January 2016) |
| John Peaden | Director of Operations and (from 19 March to 31 May 2015) Interim Chief Executive and Chief Land Registrar |
| Alasdair Lewis | Director of Legal Services and Deputy Chief Land Registrar |
| Catherine Vaughan | Finance Director |
| Caroline Anderson | Director of Human Resources & Organisational Development |
| Rowland Coombs | Director of Information Systems (to 31 March 2016) |
| Jon Parry | Interim Director of Digital Services (from 5 January 2015 to 24 January 2016) |
| John Abbott | Director of Digital Services from 25 January 2016 |
| Mike Westcott-Rudd | Legal Adviser to the Board |
| Attendees | |
|---|---|
| Nicky Heathcote | Head of the Chief Land Registrar’s Office |
| Paul Dowse | Head of Strategy |
Audit Committee
The committee supports the LRB and the Accounting Officer by seeking assurance on the risk management framework, the control framework, governance and compliance with policies, procedures and external standards and statutory requirements.
| Audit Committee membership | |
|---|---|
| Tim Franklin (Chair) | Non-Executive Director |
| Gerard Connell | Non-Executive Director |
| Derrick Palmer | Non-executive member |
| Attendees | |
|---|---|
| Graham Farrant | Chief Executive (from 1 June 2015) |
| Catherine Vaughan | Finance Director |
| Grahame Hughes | Head of Internal Audit |
| Representative of the National Audit Office | National Audit Office |
Remuneration and Nomination Committee
The committee agrees pay strategy and authorises the annual pay review for Land Registry Senior Civil Service staff and agrees a strategy for succession to the LRB and EXB.
| Remuneration and Nomination Committee membership | |
|---|---|
| Catrina Holme | Non-Executive Director |
| Gerard Connell | Non-Executive Director |
| Graham Farrant | Chief Executive and Chief Land Registrar (from 1 June 2015) |
| John Peaden | Interim Chief Executive and Chief Land Registrar (from 19 March to 31 May 2015) |
Register of interests
A register of interests is maintained at Land Registry Head Office. See note 20 to the accounts for related party disclosures.
Personal data-related incidents
| Category | Nature of incident | Total |
|---|---|---|
| I | Loss of inadequately protected electronic equipment, devices or paper documents from secured government premises | 4 |
| II | Loss of inadequately protected electronic equipment, devices or paper documents from outside secured government premises | 7 |
| III | Insecure disposal of inadequately protected electronic equipment, devices or paper documents | – |
| IV | Unauthorised disclosure | 9 |
| V | Other | 1 |
| Total | 21 |
Conflicts of interest
There are no conflicts of interest reported.
(b) Other accountabilities
Health and safety
We have continued to develop our health and safety guidance, processes and policies with assistance from Carillion. The challenge, as always, is to keep pace with changes in working practices and ensure our health and safety policies continue to be fit for purpose in a modern office environment. We have continued to monitor our main health and safety risks, in particular driving for work to ensure that the health, safety, and wellbeing of our staff is protected while working out of the office.
The total number of accidents reported by Land Registry staff at work was 100 with two accidents reported to the Health and Safety Executive under the Reporting of Injuries Diseases and Dangerous Occurrences Regulations. The three-year Accident Reduction Strategy has reached its conclusion this year and we are now considering how we take this initiative forward to ensure that the improvements in accident reduction are maintained.
We have retained our certification to OHSAS18001, the British Standard for health and safety management. This was first achieved in June 2014 and has been maintained following six-monthly external audits. The standard is seen as the benchmark for health and safety management systems and provides an assurance that we are aligned with recognised best practice.
Service standards
Details of the service that customers can expect from us.
For 2016/17 we have new internal standards designed to increase the speed of our services and to reduce the backlog of work.
Welsh language service
More information about our Welsh language service.
Complaints
We recorded 2,088 complaints in 2015/16 compared with 4,262 in 2014/15.
Although there was a fall in the complaints recorded, overall more customer comments and feedback have been captured than ever before.
The overall proportion of upheld complaints was 40%. Customer feedback about delays in our processing of some registration applications was the most common area of upheld complaint, comprising 29% of the total.
We reviewed our complaints procedure, to increase our people’s awareness of the importance of effective feedback handling and recording. This included sharing information, expertise and best practice. We also developed and launched new tools and processes for feedback reporting and analysis and updated a staff training package on complaints handling and recording. The roll out of this will continue into the first quarter of 2016/17.
We also participated in a Cabinet Office initiative on complaints handling in the public sector, involving providing an online form specifically for complaints. We continue to work with the Cabinet Office on this initiative alongside other government departments.
Use of our Customer Relationship Management tool has facilitated further opportunities to learn from and act on customer feedback and improve our overall service. Examples of this included:
-
enhancements to:
-
our website information on GOV.UK, such as improving the ease of navigation and accessibility of information on our contact addresses and fees. Also providing forms and guidance material in additional/improved formats
-
the online information and tools available to customers to query progress of applications and average completion times with the aim of being more transparent about our processing times without the need for customers to contact us
-
-
improving the usability, accessibility and scope of our Business e-services, which included increasing the number of notifications and documents that we deliver electronically, the electronic file size allowed for plans supporting some types of search application and the number of our electronic filed documents that are available to customers for immediate delivery.
Security incidents
Physical security is overseen by the Physical and Personnel Security Panel. There were 62 recorded incidents during the year, including one significant (Class 1) incident.
(c) Statement of Accounting Officer’s responsibilities
Under Section 4(6) of the Government Trading Funds Act 1973 HM Treasury has directed Land Registry to prepare for each financial year a statement of accounts in the form and on the basis set out in the Accounts Direction referred to in note 1.1. The accounts are prepared on an accruals basis and must give a true and fair view of the state of affairs of Land Registry and of its income and expenditure, changes in reserves and cash flows for the financial year.
In preparing the accounts, the Accounting Officer is required to comply with the requirements of the Government Financial Reporting Manual and in particular to:
-
observe the Accounts Direction issued by HM Treasury, including the relevant accounting and disclosure requirements, and apply suitable accounting policies on a consistent basis
-
make judgements and estimates on a reasonable basis
-
state whether applicable accounting standards as set out in the Government Financial Reporting Manual have been followed and disclose and explain any material departures in the accounts, and
-
prepare the accounts on a going concern basis when appropriate to do so.
HM Treasury has appointed the Chief Executive of Land Registry as the Accounting Officer for the trading fund. The responsibilities of an Accounting Officer, including responsibility for the propriety and regularity of the public finances for which the Accounting Officer is answerable, for keeping proper records and for safeguarding Land Registry’s assets, are set out in the Accounting Officers’ Memorandum issued by HM Treasury and published in Managing Public Money.
So far as I am aware there is no relevant audit information of which the auditor is unaware, and the directors have taken all the steps that they ought to have taken as directors in order to make themselves aware of any relevant audit information and to establish that the auditor is aware of that information.
As Accounting Officer I confirm that the annual report and accounts as a whole is a fair, balanced and understandable account of Land Registry’s operational and financial performance and I take personal responsibility for the annual report and accounts and the judgements required for determining that it is fair, balanced and understandable.
(d) Governance statement
Scope of responsibility
As the Accounting Officer for Land Registry I have the responsibility, with the Land Registry Board (LRB), for maintaining corporate governance structures that support the achievement of Land Registry’s aims, objectives and targets, while safeguarding public funds and Land Registry’s assets.
Land Registry is a non-ministerial government department, a trading fund and an executive agency. As a trading fund sponsorship is overseen by UKGI, within HM Treasury, who report our overall performance to the Department for Business, Innovation and Skills (BIS).
My duties as Accounting Officer are set out in Managing Public Money. I am accountable for performance and stewardship guided by the LRB to the Secretary of State for Business, Innovation and Skills with day-to-day responsibility delegated to the Minister of State for Small Business Industry and Enterprise.
The main duties relating to maintaining the register of title to freehold and leasehold land and charges are defined in the Land Registration Act 2002 and those relating to Land Charges and Agricultural Credits are defined in the Land Charges Act 1975 and the Agricultural Credits Act 1928 (see the Performance Report overview).
Under the Infrastructure Act 2015 Land Registry will become the registering authority and hold the statutory Local Land Charges register in place of local authorities. The Act also widened the scope of Land Registry’s powers enabling us to build on the property services we already provide.
Purpose of the governance framework
The governance framework is designed to give assurance that Land Registry carries out its duties in a manner that meets the appropriate standards of effective internal control and risk management. It is based on processes designed to identify and prioritise the opportunities and risks to the delivery of Land Registry’s strategy, the strategic objectives and performance targets. It is designed to evaluate the likelihood of those opportunities and risks being realised (and the impact should they be realised) and to manage them efficiently, effectively and economically.
It is also designed to align with the strategic aims of BIS and our statutory duties as set out in our framework document 2012. The framework complies with the code published by HM Treasury and the Cabinet Office, Corporate governance in central government departments: Code of good practice 2011. The framework described, with the exception of specific enhancements detailed below, has been in place throughout 2015/16 and up to the date of approval of the accounts.
Key components of the governance framework
The Land Registry Business Strategy sets out five-year objectives and was presented to the minister at BIS in October 2012. It is clear that we will meet the majority of our Business Strategy targets, or have done so already, but the overall efficiency target will not be met, based on our planning and achievements to date and the current projects that are in flight and are planned. Land Registry has delivered significant efficiency gains over the last three years and continues to target improved efficiency throughout our operations.
The governance framework includes:
-
the framework document 2012
-
LRB terms of reference and minutes
-
Audit Committee terms of reference and minutes
-
Remuneration and Nomination Committee terms of reference and minutes
-
other minutes and communication points
-
ministerial endorsement of the objectives behind the Business Strategy
-
information on the Business Strategy and related change activities
-
delegations of budget
-
delegations of authorities designed to reflect the external framework set and revised by the Cabinet Office and UKGI
-
director-led committees of the EXB
Land Registry Board
The LRB recognises the importance of leadership to create an environment where performance and risk are managed effectively.
The LRB consists of a Non-Executive Chair, four other non-executive directors, including a representative from UKGI and three executive directors, being myself as Chief Executive and Chief Land Registrar, the Finance Director and the Director of Operations. The Assistant Chief Executive and the Legal Adviser to the Board also attend the meetings. The Board structure ensures a balance between executive and non-executive director membership.
The role of the LRB is to provide guidance, strategic oversight and expertise to the executive.
The non-executive members are independent of management. There were no examples of company appointments or consultancy arrangements held by them that could give rise to a potential conflict of interest with their responsibilities as members of the Board.
Purpose
In line with Cabinet Office guidance the LRB is tasked with advising on, and supervising, five main areas.
- Strategic clarity
- Commercial sense
- Talented people
- Results focus
- Management information
Review of effectiveness
Over the course of the year, the Board reviewed its effectiveness of performance and progress against the recommendations from the April 2015 report on Board Effectiveness by Warren Partners.
During 2015/16 the Board:
-
revised and updated the Land Registry Board terms of reference
-
reviewed the governance structure and clarified the distinctions between the LRB, the EXB, committees and panels
-
established better consistency in use of standardised terms of reference, clarifying delegated authorities
-
revised the governance structure, for example creating a new performance panel to enhance the use of performance information
-
closed down the LR Connect framework and established a Land Registry Transformation Board with clearer governance and improved control over change
-
updated the governance pages on the intranet and provided further guidance to staff
Committees of LRB
Audit Committee
The Audit Committee supports the LRB and the Accounting Officer by seeking assurances through information and reports over:
-
the strategic framework and process for risk management, control and governance and this governance statement
-
the accounting policies, the accounts and the annual report of the organisation, including levels of error identified, and management’s letter of representation to the external auditors
-
the risk-based planned activity and results of both Internal Audit and External Audit
-
the adequacy of management response to issues identified by audit activity, including External Audit’s management letter
-
assurances relating to corporate governance requirements for the organisation
-
anti-fraud policies, whistleblowing processes and the arrangements for special investigations
-
a professionally mandated External Quality Review (EQA) of Internal Audit, which was reported to the Audit Committee, along with the monitoring of the implementation of its recommendations
The Audit Committee also periodically reviews its own effectiveness and reports the results of that review to the Board. During the year the Internal Audit Strategy and Charter were updated.
Membership of the Audit Committee comprises non-executives Tim Franklin, Gerard Connell, Derrick Palmer. Myself, Finance Director Catherine Vaughan and the Legal Adviser to the Board also attend.
Remuneration and Nomination Committee
Membership of the Remuneration Committee comprises myself and non-executives Catrina Holme and Gerard Connell, advised by HR Director Caroline Anderson.
Executive Board
The EXB assists me in my responsibilities for operational management and direction, development of strategy, management of strategic risk, performance against published targets, statutory duties, decisions and development of Land Registry’s transformation and planning functions.
The EXB maintains close oversight of the operational and financial performance and position of Land Registry. The EXB holds formal monthly board meetings, reviewing performance and progress against targets, and meets on a weekly basis for other matters.
I also created a Leadership Group, drawn from the first-tier managers below executive director level, to help formulate and take forward some of the ideas and detail for policy and strategy around land registration and its associated activities. The Strategic Leadership Network is comprised of almost 100 middle and senior managers who meet four or five times each year to enable participation in strategic decisions and better communication of strategic initiatives throughout the organisation.
Transformation Board established
During the year I established a new Transformation Board as part of my revision of the governance framework, to replace LR Connect.
The new Transformation Board, which I chair, comprises the Executive Board and programme support. During this year the Board has prioritised resource allocation to critical change, with a better framework for understanding business priority, and has improved control, financial monitoring and governance over change activities and established better tracking of their implementation and of benefits realisation.
The Senior Responsible Officer for the previous LR Connect programme has finished a post-completion review and Internal Audit have carried out a review of the LR Connect programme.
Committee structures and panels
The committees of the EXB are supported by a range of panels which are chaired by senior management, including a new Performance Panel which will analyse management information and identify risks to the achievement of objectives. These panels are incorporated into the revised governance framework, with formal terms of reference and membership being established.
Commercial Governance Panel
The Commercial Governance Panel provides an additional layer of internal governance for expenditure on external goods and services over £100,000. The panel supports Land Registry’s delegations of authority, providing additional assurance to the Finance Director and Accounting Officer on procurement. It ensures that all expenditure and the proposed procurement route will deliver the best value for money and is compliant with public procurement legislation and Cabinet Office controls.
Statement on strategy update
During 2015/16 I initiated an evaluation of the Business Strategy. Progress against the strategic targets is detailed in the Performance report, including the five milestones contributing to the strategy this year. In addition to these milestones the Local Land Charges Programme outline business case was developed and approved as described below.
As part of that process I also revised the vision and the values for Land Registry to provide a better strategic context for our operations and support staffing. All staff have now been appropriately briefed through a major communication programme called Delivering our Business Strategy, which sought to engage every member of staff in seven interactive web-based modules and a face-to-face group session chaired by a senior manager to help them all to understand the principles behind the strategy and how we intend to work within the new vision and values.
Our vision and values
Your land and property rights: guaranteed and protected
We give assurance
We have integrity
We drive innovation
We are professional
Attendance schedule for LRB, Audit Committee and Remuneration Committee
| Title | Period | Board | Committee | ||
|---|---|---|---|---|---|
| Land Registry Board | Audit | Remuneration and Nomination | |||
| Non-executive | |||||
| Mark Boyle | Non-Executive Chair | From Oct 2011 | 10/10 | – | – |
| Gerard Connell | Non-Executive Director | From 1 Sept 2013 | 9/10 | 4/4 | 3/3 |
| Tim Franklin | Non-Executive Director | From 9 June 2012 | 10/10 | 4/4 | – |
| Leo Geddes | Non-Executive Director | From 22 July 2014 | 10/10 | – | – |
| Catrina Holme | Non-Executive Director | From 9 June 2012 | 9/10 | – | 3/3 |
| Derrick Palmer | Non-executive member (Audit Committee) | From March 2013 | – | 4/4 | – |
| Executive | |||||
| Graham Farrant | Chief Executive | From 1 June 2015 | 9/9 | 4/4 | 3/3 |
| Craig Lester | Assistant Chief Executive | From 11 Jan 2016 | 3/3 | – | – |
| John Peaden | Operations Director | 10/10 | – | – | |
| Maggie Telfer | Acting Operations Director | From 19 March 2015 to 31 May 2015 | 2/2 | – | – |
| Catherine Vaughan | Finance Director | 10/10 | 4/4 | – | |
| Mike Westcott-Rudd | Board Legal Adviser | 10/10 | 3/4 | – |
Notes:
- In April and May John Peaden served as Interim Accounting Officer(from 19 March 2015 to 31 May 2015).
- Maggie Telfer served as Acting Director of Operations.
- Craig Lester attends as an observer.
- Mike Westcott-Rudd attends as Legal Adviser to the Board.
Statement on ministerial decision
In the Spending Review and Autumn Statement 2015, the Government announced its intention to “consult on options to move operations of the Land Registry to the private sector from 2017” and this commitment was repeated in the Budget in March 2016. Land Registry has engaged with those charged with considering these proposals in more detail and I have ensured appropriate resource is allocated within the financial plans for 2016/17 to enable potential changes to the operating model status for Land Registry.
BIS launched the Government’s formal consultation on 24 March, Consultation on moving Land Registry operations to the private sector, which concluded on 26 May.
Local Land Charges – statement on governance
Under the Infrastructure Act 2015 Land Registry will become the registering authority and hold the statutory Local Land Charges register in place of the 326 English local authorities. Investment for the programme requires approval by HM Treasury and the Cabinet Office through the sponsor department. The programme received outline business case approval from HM Treasury on 30 September 2015 and Cabinet Office on 23 November 2015. I am satisfied that the governance and risk management arrangements for the programme are appropriate and proportionate. I base this conclusion on the Major Project Authority’s reports and on the progress reports and assurances from the programme senior responsible owner.
Information about quality of data
The LRB is provided with a balanced scorecard of performance information identifying performance on published targets. The underlying information is provided by established supporting systems operated with appropriate controls. I have established a Performance Panel of senior managers to enhance the scrutiny of organisational performance, improve risk management and lead developments to better use the available performance data. Performance will still be reported to EXB monthly, but with the additional intelligence gained by a prior review by the Performance Panel.
Financial performance is monitored and reported using monthly reports based on our financial system. There is a procedure for setting annual budgets and reviewing financial performance and full-year forecasts. Quarterly forecast reviews are in operation giving the EXB and LRB appropriate oversight and assurance and monthly updates are provided via the Chief Executive’s monthly report to the LRB.
During the year I established robust modelling and planning for establishment control, thereby improving planning for the allocation of resources to workload and better understanding of resource requirement linked to our forecast intakes and people budgets. We have strengthened the use of an operational model to link intakes, workload and efficiency, resulting in a clear recruitment plan.
Statement on QA of relevant models
Land Registry operates a number of models critical to its core business. These include models to forecast intakes and fee income; models to forecast workload and resources and ensure service standards on speed can be achieved, plus backlog in casework kept to an appropriate level; models to forecast establishment and staff budgets; models to support standard management and financial reporting. These models are subject to peer review and challenge and forecasts are reported to and reviewed by the EXB and the LRB. More work is planned on these models for 2016/17.
In addition we have used external advisers on the business critical model for the Local Land Charges Programme and to support the outline business case, with use of Internal Audit to provide assurance on procurement evaluation models.
Whistleblowing – statement of arrangements and results
The sponsoring director is the Director of Legal Services. No new whistleblowing cases were reported in year. During 2015/16 new recording arrangements were established and a new senior nominated officer appointed. The whistleblowing guidance has been revised and reminders issued in the staff information circulars. HR Directorate have implemented guidance training for nominated officers and for the new senior nominated officer. This was completed in June 2015.
Risk
Framework for risk management
Land Registry follows Cabinet Office Orange Book risk appetite principles. These principles have formed a key element in the approval and sign off of a new Risk Management Framework, strategy and standard which was developed during 2015/16. These significant changes will ensure a controlled and consistent two-way flow of risks between strategic and directorate levels.
The LRB, EXB and Audit Committee all consider strategic risks. The Legal Adviser to the Board acts as EXB’s risk champion. At least quarterly the strategic risks are reviewed and key changes flagged to EXB; in addition a more thorough risk review is completed each quarter facilitated by the Risk Manager. Lead indicators are monitored to provide early warning of changes in strategic risk.
Key strategic risks
The overall risk environment has developed compared with the previous year. There are currently 15 strategic risks although four of these are within their specified risk appetite but continue to be monitored because of their criticality to the business. There is significant emphasis on volumes of intakes and the level of change activity and related resource needs.
New risks identified as having strategic relevance included commercial awareness, cyber security and business continuity. The highest priority is our people risk given the challenges that we face with succession planning and recruitment. Stability in the Executive Team has also been achieved throughout 2015, with EXB made up of substantive members as opposed to contract staff by the fourth quarter, for the first time since 2012.
Framework for control and risk management
The evaluation of second-tier risks at directorate level identified key risks around backlog of work and people challenges regarding training and development for our new recruits and apprentices. These risks all have appropriate and effective controls, are being carefully monitored and have been fed into our refreshed Business Strategy. A dynamic relationship is maintained between the Head of Risk Management and business stakeholders and has helped us to be proactive in how we manage risk.
As Accounting Officer I maintain oversight of strategic risks managed by the EXB and seek assurances on directorate risk management to afford the opportunity for escalation. Risk management systems are designed to be proportionate and effective in relation to relevant risks. The Risk Management Strategy was approved in January 2016 and ensures at all levels of the organisation that risks are effectively mitigated.
Through delegation to executive directors I am assured by the work of the Information Management Committee, the Register Protection Committee, the People Committee and the Health and Safety Panel, all of which play an integral part in the overall risk management matrix. Management of the financial risks, information risk, risk to the Land Register, fraud risk and health and safety and statutory duties are managed by these committees with escalation to me as appropriate, at the discretion of the relevant director for each committee.
I am informed on the effectiveness of operational controls to manage risk, safeguard assets and ensure effective use of resources through a framework of controls which includes reporting at local and organisational level. The performance information is reviewed and checked as part of the framework of control and performance information is designed to ensure issues requiring management action are reported appropriately.
As an example, known weaknesses in our outgoing LR Connect approach were independently reviewed by Internal Audit. I then requested that the reported issues were mapped across to our new Transformation Board model to ensure that all of the identified weaknesses were either eliminated from the outset, (for example documented objective consideration of all aspects of decision making), or would be addressed by the embedded governance requirements of the new model.
I have instigated creation of a more robust establishment framework to ensure allocation of resource can be better planned and controlled supporting a more integrated budgeting approach. In addition the governance around recruitment has been strengthened and Land Registry has received increased delegation for recruitment, enabling a more effective response to changes in workload volumes.
Financial delegation framework revised approach, with reference to maladministration payment authorities
During the year it was brought to my attention that maladministration payments (special payments) had been made, apparently without the relevant delegated authority having been properly sought and documented. The resolution to the issue involved reporting first to BIS Finance and then to HM Treasury, to seek retrospective approval of the unauthorised payments, for which approval was promptly given. A new authority relating to maladministration payments has now been given to me. The value of these payments does not require disclosure in section Parliamentary accountability and audit report.
Information risk
Information risk is managed through the Information Management Committee led by the Senior Information Risk Owner (SIRO). The SIRO is assured by information risk returns carried out by our Information Asset Owners (IAOs) and fully documented asset descriptions. Our IS Risk Management Process and Policy have been independently audited and validated through CMMI, ISO20000 and ISO2700 internal audits. I am assured by accreditation in respect of Public Service Network Code of Connection and Information Assurance Maturity Model (IAMM) where our scores have improved including among external suppliers where 74% of suppliers are achieving level 3 maturity.
The SIRO function was a subject of an external audit this year. This provided substantial assurance and reported that Land Registry current practices may in some instances exceed and are more embedded in Land Registry’s culture than implemented best practices observed in the private sector.
Protecting information
All staff are required to complete the appropriate levels of the Responsible for Information (RFI) module on Civil Service Learning (CSL). In 2015/16 we have augmented this RFI learning with additional in-house material to improve awareness of risks associated with collaborating in the cloud and emails sent to insecure accounts. Contractors are also obliged to sign a non-disclosure agreement.
We have been certified to ISO27001, the international standard for information security management, for almost 14 years. The standard works on a three-yearly recertification cycle and we were recertificated in April 2014. To ensure that the certification remains current we are subject to external six-monthly surveillance audits. The most recent of these was in December 2015 where our certification to the standard was reconfirmed.
The standard is wide-ranging and covers areas such as IT security, physical security, information management, business continuity and risk management.
Data losses
There were no personal data-related incidents reported to the Information Commissioner’s Office.
Response to HMRC tax compliance review
During the year Her Majesty’s Revenue & Customs (HMRC) informed Land Registry of its intention to audit our records to ensure Land Registry was meeting its tax obligations as an employer as part of a Civil Service-wide programme which has seen similar audits across the Civil Service. Through discussion, formal meetings and information sharing the list of areas of outstanding issues has been reduced, although not yet completed.
Based on the work to date, it has been confirmed that a retrospective tax liability is due, mainly connected to dual workplaces and the use of Travel & Subsistence; including car hire, hospitality expenditure and use of Government Procurement Cards (GPCs).
The relationship with HMRC has been proactively managed and the work has been concluded to:
-
identify the potential retrospective tax liability for 2013/14 and for the four previous years – based on extrapolation data
-
identify the current year’s liability (based on all relevant travel, for inclusion in the audit settlement)
-
ensure completion of an organisation-wide review of all regular travel patterns to identify potential tax liabilities and agree support or otherwise
-
ensure the implementation of new policies and processes to capture liability requirements at source.
I expect these policies and procedures to be in place for 2016/17 which will reduce the risk significantly going forward.
Response to Alexander Review and guidance for off-payroll contractors and revised recruitment processes
Land Registry has revised the systems and procedures relating to off-payroll contractors further to provide assurance that all contractors engaged by Land Registry are complying with appropriate tax and National Insurance Contribution regulations. I am assured that all of our most senior staff are now on payroll and we comply with the Alexander Review in this regard.
From April 2015 responsibility for off-payroll contractors became the responsibility of my HR Directorate following revisions to the policy and procedures in February 2015. This is supported by close oversight in Finance who contact all relevant contractors for assurance at the appropriate trigger points. During the year BIS oversight of contractors on a day rate greater than £385 was required. Following this period of scrutiny the oversight has been delegated to me as Accounting Officer at Land Registry.
I am assured by the Finance Director and the HR Director that Land Registry now has in place robust processes for ongoing monitoring of all off-payroll contractors and for seeking the relevant tax and National Insurance Contribution assurances on a rolling basis.
Action taken to address service delays
Land Registry has experienced significant increases in workload intake above the level forecast during 2015/16, building on similar increases in previous years. One consequence of the significant rises in intake has been an increase in service delivery times and an increase in the work not completed: the backlog. During the year the intakes, outputs and levels of backlog were monitored regularly and a number of interventions were made designed to improve speed of service, primarily by making additional casework resources available to replace those lost through attrition. These included: the recruitment into our Operations directorate of 263.8 full-time equivalents, including 57 apprentices who were given appropriate training, the use of overtime, plus the development and enhancements to our intake and resource planning models to allow us to plan more flex in response to variations in workload volumes. The plans for 2016/17 were specifically designed to meet new internal service standards and reduce the backlog to no more than seven working days’ worth of intakes by March 2017, subject to forecast intakes of 31.4m intake applications including 4.4m dealings and 0.5m new titles.
Litigation (tribunal cases)
There have been no cases in 2015/16.
Sources of assurance
Infrastructure and Projects Authority (formerly Major Projects Authority) (LLC)
Local Land Charges (LLC) is a significant programme that is subject to review by the Government’s Infrastructure and Projects Authority (IPA). During 2015/16 Land Registry received approval for the LLC outline business case from HM Treasury in September 2015 and from the Cabinet Office in November 2015.
During the reporting year two assessments of the Local Land Charges Programme were undertaken by the IPA – in August a Gateway 0 Review gave an amber/red assessment, and in January an Assurance of Action Plan 0 gave an amber assessment. The August review made 12 recommendations. The January review marked three recommendations as complete and provided a further three recommendations. The Programme Board actively manages the IPA Action Plan, reviewing progress against each recommendation on a monthly basis. The plan details each of the recommendations, highlighting an allocated owner and estimated delivery date. In March the Programme Board marked four recommendations as complete – the remaining actions remain active. Risk is managed actively with the support of the Head of Risk Management.
Land Registry published its consultation on proposed Local Land Charges Rules on 9 May. The consultation closes on 11 July.
Cyber defence
As part of the central government oversight of cyber security matters, the Office of Cyber Security and Information Assurance (OCSIA) was created to support the National Security Council to determine priorities in relation to securing cyberspace. In November 2015 Land Registry started working with them as part of a collective government cyber security programme. This led to the first-time review of our cyber security position using the Cyber Defence Capability Assessment Tool in respect of the critical national infrastructure data we hold. That data comprises our registers of title, Bankruptcy and Land Charges registers and the Agricultural Credits Act registers. The report scores us in the upper quartile and we are working with the OCSIA to develop appropriate additional controls.
Gateway functions
Land Registry operates within the delegations framework as defined by the Cabinet Office for arms-length bodies and the specific delegations authorised by officials at BIS. This includes the requirement to work with the Government Digital Service (GDS) to ensure that product releases conform to standards in terms of security, effectiveness and consistency. Before products are released as betas Land Registry must submit products and comply with the conditions specified by the GDS.
Financial management reporting
I am informed on Land Registry performance through the monthly financial reports from my Finance Director which include analysis of forecast workload intakes and the likely impact on revenues needed to finance the operational activities. During the year my Finance Director has led the response to the Chartered Institute of Public Finance and Accountancy (CIPFA) Financial Management Model report leading to enhancements in the quality of management reporting, enhanced support and ensuring the skills within the directorate are more appropriate to the demands of the organisation. During 2016/17 we will use CIPFA to formally review progress to date.
Procurement assurance
I am assured by the Chief Procurement Officer, at least annually, that procurement activities are conducted in line with Cabinet Office and HM Treasury guidance and that senior managers have complied with these and Land Registry-specific procurement guidelines.
Performance reporting
In addition to the monthly financial reports from my Finance Director I receive information on operational performance through scorecard reporting, the performance hub and update papers and presentations from management teams to me and my Executive Board.
I also regularly visit the operational offices and receive feedback on the backlog and speed of service outcomes from colleagues as well as external stakeholders.
In reporting performance against the original 2013/18 Business Strategy targets, it is now clear that we will meet the majority of our five-year targets, or have done so already, but the overall efficiency target of 60% improvement will not be met. I expect our performance is likely to culminate in a 45% efficiency improvement which is, in itself, a huge efficiency gain.
Internal Audit and opinion
The opinion of the Head of Internal Audit is that “based on the work of Internal Audit undertaken in 2015/16, I am able to provide reasonable assurance that the Land Registry framework of risk, control and governance has enabled the achievement of its objectives, and that key risks are generally being effectively managed at all levels of the business”.
Remuneration and staff report
Policy for senior civil servants
The remuneration of senior civil servants (SCS) is set by the Prime Minister following independent advice from the Senior Salaries Review Body.
In reaching its recommendations, the Review Body has regard to:
-
the need to recruit, retain and motivate suitably able and qualified people to exercise their different responsibilities
-
regional/local variations in labour markets and their effects on the recruitment and retention of staff
-
Government policies for improving the public services including the requirement on departments to meet the output targets for the delivery of departmental services
-
the funds available to departments as set out in the Government’s departmental expenditure limits
-
the Government’s inflation target.
The Review Body takes account of the evidence it receives about wider economic considerations and the affordability of its recommendations.
The salary of the Chief Executive and Chief Land Registrar is set by the Department for Business, Innovation and Skills. The Land Registry Remuneration Committee, acting on the authority of the Land Registry Board, considers pay recommendations provided by line managers and decides the distribution of performance pay in the annual pay review for Land Registry senior civil servants, in accordance with Cabinet Office guidance.
Both base pay and non-consolidated performance related awards are dependent on performance, which is assessed through an annual appraisal system for senior civil servants, more details of which can be found at https://www.gov.uk/government/publications/senior-civil-service-performance-management
During the year the members of the Remuneration and Nomination Committee were: Catrina Holme (Chair), Gerard Connell and Graham Farrant. The committee’s last meeting was on 1 March 2016.
Policy for other civil servants
Pay for Land Registry employees who are not in SCS grades is determined each year following negotiation and consultation between Land Registry and the unions, and is subject to approval by the Secretary of State, taking into account guidance issued by HM Treasury.
Service contracts
The Constitutional Reform and Governance Act 2010 requires Civil Service appointments to be made on merit on the basis of fair and open competition.
The Recruitment Principles published by the Civil Service Commission specify the circumstances when appointments may be made otherwise.
Unless otherwise specified, all the directors covered by this report hold appointments that are open-ended and are subject to a notice period of three months. Early termination for the directors on open-ended service contracts, other than for misconduct, would result in the individual receiving compensation as set out in the Civil Service Compensation Scheme.
Further information about the work of the Civil Service Commission.
Land Registry Board Chair
Chair Mark Boyle’s appointment ended on 31 March 2016. Tim Franklin will act as Interim Land Registry Board Chair until a new Chair has been appointed, which is expected imminently.
Chief Executive and Chief Land Registrar
Graham Farrant was appointed as Chief Executive and Chief Land Registrar on 1 June 2015, initially for a period of three years. John Peaden acted as Interim Chief Executive and Chief Land Registrar from 19 March 2015 until Graham Farrant took up his appointment.
Assistant Chief Executive
Craig Lester was appointed as Assistant Chief Executive from 11 January 2016 on a 12-month loan from the Department for Business, Innovation and Skills.
Director of Digital Services
John Abbott was appointed as permanent Director of Digital Services on 25 January 2016. Jon Parry acted as Interim Director of Digital Services until John Abbott took up his appointment.
Non-Executive Directors
The appointments of Tim Franklin and Catrina Holme from 8 July 2012 were initially for three years and were extended by two years.
The appointment of Leo Geddes from 22 July 2014 is for a period that will not normally exceed three years. He represents the interests of UKGI and does not receive any remuneration from Land Registry.
The appointment of Gerard Connell from 1 September 2013 was initially for three years and was extended by 12 months.
Off-payroll disclosure
Off-payroll engagements as at 31 March 2016, for more than £220 per day and that last for longer than six months.
| 2015/16 | 2014/15 | |
|---|---|---|
| Existing engagements as of 31 March 2016 | 10 | 8 |
| Of which existing: | ||
| – for less than one year at time of reporting | 6 | 7 |
| – for between one and two years at time of reporting | 3 | 1 |
| – for between two and three years at time of reporting | 1 | – |
| – for between three and four years at time of reporting | – | – |
| – for four or more years at time of reporting | – | – |
| Off-payroll engagements, or those that reached six months in duration, between 1 April 2015 and 31 March 2016, for more than £220 per day and that last for longer than six months | ||
| New engagements, or those that reached six months in duration, between 1 April 2015 and 31 March 2016 | 14 | 29 |
| – of which include contractual clauses giving the department the right to request assurance in relation to income tax and National Insurance obligations | 14 | 26 |
| – for which assurance has been requested | 13 | 23 |
| Of which: | ||
| – assurance has been received | 13 | 16 |
| – assurance has not been received (note: one contract which was originally agreed to be of six months duration marginally exceeded six months by two days. Assurance was not requested as it was assumed at the time it would not be required. It was not considered necessary to request the assurance retrospectively) | – | 7 |
| – have been terminated as a result of assurance not being received | – | 7 |
| Off-payroll engagements of board members and/or senior officials with significant financial responsibility between 1 April 2014 and 31 March 2015 | ||
| Off-payroll engagements of board members and/or senior officials with significant financial responsibility during the financial year | – | 2 |
| Individuals who have been deemed “board members, and/or, senior officials with significant financial responsibility” during the financial year. This figure should include both off-payroll and on-payroll engagements | 11 | 12 |
Consultants
Expenditure on consultancy for the year was £1.5 million including Executive Board interim costs.
Salary and performance pay 2015/16 – executive directors (note 1)
| Salary | Performance pay | Benefits in kind | Pension benefits (note 2) | Total | |
|---|---|---|---|---|---|
| £’000 | £’000 | To nearest £100 | £ | £’000 | |
| Graham Farrant (note 3) Chief Executive and Chief Land Registrar |
160 – 165 | – | – | 29,000 | 185 –190 |
| Annual equivalent | (190 – 195) | – | – | – | (190 – 195) |
| Craig Lester (note 4) |
|||||
| Assistant Chief Executive | 20 – 25 | – | – | 27,000 | 45 – 50 |
| Annual equivalent | (100 – 105) | – | – | – | (100 – 105) |
| John Peaden (note 5) Interim Chief Executive and Chief Land Registrar |
15 – 20 | – | – | – | 15 – 20 |
| Annual equivalent | (105 – 110) | – | – | – | (105 – 110) |
| John Peaden (note 6) Director of Operations |
80 – 85 | 10 – 15 | – | 72,000 | 165 – 170 |
| Annual equivalent | (95 – 100) | – | – | – | (95 – 100) |
| Alasdair Lewis Director of Legal Services and Deputy Chief Land Registrar |
95 – 100 | 0 – 5 | – | 30,000 | 125 – 130 |
| Catherine Vaughan Finance Director |
120 – 125 | – | – | 49,000 | 170 – 175 |
| Annual equivalent | – | – | – | – | |
| Maggie Telfer (note 7) Acting Director of Operations |
10 – 15 | – | – | 47,000 | 60 – 65 |
| Annual equivalent | (85 – 90) | – | – | – | (85 – 90) |
| Caroline Anderson Director of Human Resources and Organisation Development |
90 – 95 | 0 – 5 | – | 36,000 | 125 – 130 |
| Rowland Coombs Director of Information Systems | 75 – 80 | 10 – 15 | – | 29,000 | 115 – 120 |
| Paul Dowse (note 8) Acting Director of Strategy |
5 – 10 | – | – | 30,000 | 35 – 40 |
| Annual equivalent | (80 – 85) | – | – | – | (80 – 85) |
| John Abbott (note 9) Director of Digital Services |
20 – 25 | – | 100 | 14,000 | 35 – 40 |
| Annual equivalent | (115 – 120) | – | – | – | (115 – 120) |
| Jon Parry (note 10) Interim Director of Digital Services |
180 – 185 | – | – | – | 180 – 185 |
| Annual equivalent | (240 – 245) | – | – | – | (240 – 245) |
Notes:
-
Audited.
-
The value of pension benefits accrued during the year is calculated as (the real increase in pension multiplied by 20) plus (the real increase in any lump sum) less (the contributions made by the individual). The real increases exclude increases due to inflation or any increase or decreases due to a transfer of pension rights.
-
Graham Farrant was appointed as Chief Executive and Chief Land Registrar from 1 June 2015.
-
Craig Lester was appointed Assistant Chief Executive from 11 January 2016 for a period of 12 months.
-
John Peaden stood down as Interim Chief Executive and Chief Land Registrar on 31 May 2015.
-
John Peaden resumed his position as Director of Operations from 1 June 2015.
-
Maggie Telfer stood down as Acting Director of Operations on 31 May 2015.
-
Paul Dowse stood down as Acting Director of Strategy on 30 April 2015.
-
John Abbott was appointed Director of Digital Services from 25 January 2016.
-
Jon Parry stood down as Interim Director of Digital Services on 24 January 2016.
-
None of the directors paid into a stakeholder pension.
Salary and performance pay 2014/15 – executive directors (note 1)
| Salary | Performance pay | Benefits in kind | Pension benefits (note 2) | Total | |
|---|---|---|---|---|---|
| £’000 | £’000 | To nearest £100 | £ | £’000 | |
| Graham Farrant (note 3) Chief Executive and Chief Land Registrar |
– | – | – | – | – |
| Annual equivalent | – | – | – | – | – |
| Craig Lester (note 4) Assistant Chief Executive |
– | – | – | – | – |
| Annual equivalent | – | – | – | – | – |
| John Peaden (note 5) Interim Chief Executive and Chief Land Registrar |
0 – 5 | – | – | – | 0 – 5 |
| Annual equivalent | (100 – 105) | – | – | – | (100 – 105) |
| John Peaden(note 6) Director of Operations |
85 – 90 | 10 – 15 | 100 | 22,000 | 125 – 130 |
| Annual equivalent | (90 – 95) | – | – | – | (90 – 95) |
| Alasdair Lewis Director of Legal Services and Deputy Chief Land Registrar |
95 – 100 | 0 – 5 | – | 20,000 | 115 – 120 |
| Catherine Vaughan (not 5) Finance Director |
30 – 35 | – | – | 11,000 | 40 – 45 |
| Annual equivalent | (120 – 125) | – | – | – | (120 – 125) |
| Maggie Telfer (note 7) Acting Director of Operations |
0 – 5 | – | – | 14,000 | 15 – 20 |
| Annual equivalent | (80 – 85) | – | – | – | (80 – 85) |
| Caroline Anderson Director of Human Resources and Organisation Development |
85 – 90 | 0 – 5 | – | 33,000 | 120 – 125 |
| Rowland Coombs Director of Information Systems | 75 – 80 | 10 – 15 | – | 22,000 | 105 – 110 |
| Paul Dowse (note 8) Acting Director of Strategy |
80 – 85 | 0 – 5 | 300 | 49,000 | 130 – 135 |
| Annual equivalent | – | – | – | – | |
| John Abbott (note 9) Director of Digital Services |
– | – | – | – | – |
| Annual equivalent | – | – | – | – | – |
| Jon Parry (note 10) Interim Director of Digital Services |
55 – 60 | – | – | – | 55 – 60 |
| Annual equivalent | (235 – 240) | – | – | – | (235 – 240) |
Notes:
-
Audited.
-
The value of pension benefits accrued during the year is calculated as (the real increase in pension multiplied by 20) plus (the real increase in any lump sum) less (the contributions made by the individual). The real increases exclude increases due to inflation or any increase or decreases due to a transfer of pension rights.
-
Graham Farrant was appointed as Chief Executive and Chief Land Registrar from 1 June 2015.
-
Craig Lester was appointed Assistant Chief Executive from 11 January 2016 for a period of 12 months.
-
John Peaden stood down as Interim Chief Executive and Chief Land Registrar on 31 May 2015.
-
John Peaden resumed his position as Director of Operations from 1 June 2015.
-
Maggie Telfer stood down as Acting Director of Operations on 31 May 2015.
-
Paul Dowse stood down as Acting Director of Strategy on 30 April 2015.
-
John Abbott was appointed Director of Digital Services from 25 January 2016.
-
Jon Parry stood down as Interim Director of Digital Services on 24 January 2016.
-
None of the directors paid into a stakeholder pension.
Salary – non-executive directors (note 1)
| 2015/16 | 2014/15 | |
|---|---|---|
| £’000 | £’000 | |
| Mark Boyle Non-Executive Chair |
60 – 65 | 60 – 65 |
| Tim Franklin Non-Executive Director |
20 – 25 | 20 – 25 |
| Catrina Holme Non-Executive Director |
20 – 25 | 20 – 25 |
| Leo Geddes (note 2) Non-Executive Director |
– | – |
| Gerard Connell Non-Executive Director |
20 – 25 | 20 – 25 |
-
Audited.
-
Leo Geddes is a full-time employee of the Department for Business, Innovation and Skills; he receives no additional remuneration from Land Registry in relation to his role as a non-executive director.
Salary
‘Salary’ includes gross salary, reserved rights to London weighting or London allowances, recruitment and retention allowances and any other allowance to the extent that it is subject to UK taxation. The tables: ‘Salary and performance pay 2015/16 - executive directors’ and ‘Salary and performance pay 2014/15 – executive directors’ are based on accrued payments made by Land Registry and thus recorded in these accounts.
Benefits in kind
The monetary value of benefits in kind covers any benefits provided by Land Registry and treated by HM Revenue & Customs as a taxable emolument.
Performance awards
Awards are based on performance levels attained and are made as part of the performance review process. The awards reported relate to the performance in the year in which they were paid to the individual. Therefore the awards reported in 2015/16 relate to performance in 2014/15 and the comparative awards reported for 2014/15 relate to performance in 2013/14.
Pension benefits ( see note 1 in this table)
| Real increase in pension and lump sum at 60 | Total accrued at March 2016 | Cash equivalent transfer value (CETV) at 31 March | Real increase in CETV after adjustment for inflation and changes in investment factors | ||||
|---|---|---|---|---|---|---|---|
| Pension | Lump sum | Pension | Lump sum | 2016 | 2015 (see note 2 in this table) | ||
| £’000 | £’000 | £’000 | £’000 | £’000 | £’000 | £’000 | |
| Graham Farrant (see note 3 in this table) Chief Executive and Chief Land Registrar |
0 – 2.5 | – | 0 – 5 | – | 22 | – | 16 |
| Craig Lester (see note 4 in this table) Assistant Chief Executive |
0 – 2.5 | 0 – 2.5 | 30 – 35 | 95 – 100 | 586 | 532 | 19 |
| John Peaden (see note 5 in this table) Director of Operations |
2.5 – 5.0 | 10.0 – 12.5 | 40 – 45 | 140 – 145 | 1,079 | 940 | 70 |
| Alasdair Lewis Director of Legal Services and Deputy Chief Land Registrar |
0 – 2.5 | 2.5 – 5.0 | 35 – 40 | 115 – 120 | 847 | 761 | 28 |
| Catherine Vaughan (see note 5 in this table) Finance Director |
2.5 – 5.0 | – | 0 – 5 | – | 33 | 6 | 17 |
| Caroline Anderson Director of Human Resources | 0 – 2.5 | – | 0 – 5 | – | 66 | 35 | 20 |
| Maggie Telfer (see note 6 in this table) Acting Director of Operations |
0 – 2.5 | 5.0 – 7.5 | 30 – 35 | 85 – 90 | 540 | 463 | 35 |
| Rowland CoombsDirector of Information Systems | 0 – 2.5 | 2.5 – 5.0 | 35 – 40 | 105 – 110 | 777 | 696 | 26 |
| Paul Dowse (see note 7 in this table) Acting Director of Strategy |
0 – 2.5 | 0 – 2.5 | 30 – 35 | 85 – 90 | 487 | 429 | 12 |
| John Abbott (see note 8 in this table) Director of Digital Services |
0 – 2.5 | – | 0 – 5 | – | 48 | 39 | 4 |
| Jon Parry (see note 9 in this table) Interim Director of Digital Services |
– | – | – | – | – | – | – |
Notes:
-
Audited.
-
The actuarial factors used to calculate CETVs were changed in 2014/15. The CETVs at 31/3/15 and 31/3/16 have both been calculated using the new factors, for consistency. The CETV at 31/3/15 therefore differs from the corresponding figure in last year’s report, which was calculated using the previous factors.
-
Graham Farrant was appointed as Chief Executive and Chief Land Registrar from 1 June 2015.
-
Craig Lester was appointed as Assistant Chief Executive from 11 January 2016.
-
John Peaden was Interim Chief Executive and Chief Land Registrar until 31 May 2015. He resumed his position as Director of Operations from 1 June 2015.
-
Maggie Telfer was Acting Director of Operations until 31 May 2015.
-
Paul Dowse was Acting Director of Strategy until 30 April 2016.
-
John Abbott was appointed as Director of Digital Services from 25 January 2016.
-
Jon Parry was Interim Director of Digital Services until 24 January 2016. He was not in a Land Registry pension scheme.
-
No director paid into a stakeholder pension.
Civil Service pensions
Pension benefits are provided through the Civil Service pension arrangements. From 1 April 2015 a new pension scheme for civil servants was introduced – the Civil Servants and Others Pension Scheme or alpha, which provides benefits on a career average basis with a normal pension age equal to the member’s State Pension Age (or 65 if higher). From that date all newly appointed civil servants and the majority of those already in service joined alpha. Prior to that date, civil servants participated in the Principal Civil Service Pension Scheme (PCSPS). The PCSPS has four sections: three providing benefits on a final salary basis (classic, premium and classic plus) with a normal pension age of 60; and one providing benefits on a whole career basis (nuvos) with a normal pension age of 65.
These statutory arrangements are unfunded with the cost of benefits met by monies voted by Parliament each year. Pensions payable under classic, premium, classic plus, nuvos and alpha are increased annually in line with Pensions Increase legislation. Existing members of the PCSPS who were within 10 years of their normal pension age on 1 April 2012 remained in the PCSPS after 1 April 2015. Those who were between 10 years and 13 years and 5 months from their normal pension age on 1 April 2012 will switch into alpha sometime between 1 June 2015 and 1 February 2022. All members who switch to alpha have their PCSPS benefits ‘banked’, with those with earlier benefits in one of the final salary sections of the PCSPS having those benefits based on their final salary when they leave alpha. (The pension figures quoted for officials show pension earned in PCSPS or alpha – as appropriate. Where the official has benefits in both the PCSPS and alpha the figure quoted is the combined value of their benefits in the two schemes.) Members joining from October 2002 may opt for either the appropriate defined benefit arrangement or a ‘money purchase’ stakeholder pension with an employer contribution (partnership pension account).
Employee contributions are salary-related and range between 3% and 8.05% of pensionable earnings for classic (and members of alpha who were members of classic immediately before joining alpha) and between 4.6% and 8.05% for members of premium, classic plus, nuvos and all other members of alpha. Benefits in classic accrue at the rate of 1/80th of final pensionable earnings for each year of service. In addition, a lump sum equivalent to three years’ initial pension is payable on retirement. For premium, benefits accrue at the rate of 1/60th of final pensionable earnings for each year of service. Unlike classic, there is no automatic lump sum. Classic plus is essentially a hybrid with benefits for service before 1 October 2002 calculated broadly as per classic and benefits for service from October 2002 worked out as in premium. In nuvos a member builds up a pension based on their pensionable earnings during their period of scheme membership. At the end of the scheme year (31 March) the member’s earned pension account is credited with 2.3% of their pensionable earnings in that scheme year and the accrued pension is up-rated in line with Pensions Increase legislation. Benefits in alpha build up in a similar way to nuvos, except that the accrual rate is 2.32%. In all cases members may opt to give up (commute) pension for a lump sum up to the limits set by the Finance Act 2004.
The partnership pension account is a stakeholder pension arrangement. Land Registry makes a basic contribution of between 3% and 12.5% up to 30 September 2015 and 8% and 14.75% from 1 October 2015 (depending on the age of the member) into an approved stakeholder pension product chosen by the employee from a panel of providers. The employee does not have to contribute but where they do make contributions, the employer will match these up to a limit of 3% of pensionable salary (in addition to the employer’s basic contribution). Land Registry also contributes a further 0.8% of pensionable salary up to 30 September 2015 and 0.5% of pensionable salary from 1 October 2015 to cover the cost of centrally provided risk benefit cover (death in service and ill health retirement).
The accrued pension quoted is the pension the member is entitled to receive when they reach pension age, or immediately on ceasing to be an active member of the scheme if they are already at or over pension age. Pension age is 60 for members of classic, premium and classic plus, 65 for members of nuvos, and the higher of 65 or State Pension Age for members of alpha. (The pension figures quoted for officials show pension earnings in PCSPS or alpha – as appropriate. Where the official has benefits in both the PCSPS and alpha the figure quoted is the combined value of their benefits in the two schemes, but note that part of that pension may be payable from different ages.)
Further details about the Civil Service pension arrangements.
Cash equivalent transfer values
A cash equivalent transfer value (CETV) is the actuarially assessed capitalised value of the pension scheme benefits accrued by a member at a particular point in time. The benefits valued are the member’s accrued benefits and any contingent spouse’s pension payable from the scheme. A CETV is a payment made by a pension scheme or arrangement to secure pension benefits in another pension scheme or arrangement when the member leaves a scheme and chooses to transfer the benefits accrued in their former scheme. The pension figures shown relate to the benefits that the individual has accrued as a consequence of their total membership of the pension scheme, not just their service in a senior capacity to which disclosure applies.
The CETV figures include the value of any pension benefit in another scheme or arrangement that the individual has transferred to the Civil Service pension arrangements. They also include any additional pension benefit accrued to the member as a result of their buying additional pension benefits at their own cost. CETVs are worked out in accordance with The Occupational Pension Schemes (Transfer Values) (Amendment) Regulations 2008 and do not take account of any actual or potential reduction to benefits resulting from Lifetime Allowance Tax, which may be due when pension benefits are taken.
Real increase in CETV
This reflects the increase in CETV that is funded by the employer. It does not include the increase in accrued pension due to inflation, contributions paid by the employee (including the value of any benefits transferred from another pension scheme or arrangement) and uses common market valuation factors for the start and end of the period.
Reporting of Civil Service and other compensation schemes – exit packages (audited)
| Exit package cost band | Number of compulsory redundancies | Number of other departures agreed | Total number of exit packages by cost band | |||
|---|---|---|---|---|---|---|
| 2016 | 2015 | 2016 | 2015 | 2016 | 2015 | |
| £0–£10,000 | – | – | 2 | 2 | 2 | 2 |
| £10,001–£25,000 | – | – | 2 | 10 | 2 | 10 |
| £25,001–£50,000 | – | – | 1 | 27 | 1 | 27 |
| £50,001–£100,000 | – | – | – | 25 | – | 25 |
| £100,001–£150,000 | – | – | 1 | 4 | 1 | 4 |
| £150,001–£200,000 | – | – | – | 1 | – | 1 |
| >£200,000 | – | – | – | – | – | – |
| Total number of exit packages | – | – | 6 | 69 | 6 | 69 |
| Total cost | – | – | £186,918 | £3,621,025 | £186,918 | £3,621,025 |
A special severance payment of £10,000 was made to one individual with approval from HM Treasury.
There were no ex-gratia payments to directors in 2015/16 (2014/15: none).
Compensation for loss of office
Redundancy and other departure costs have been paid in accordance with the provisions of the Civil Service Compensation Scheme, a statutory scheme made under the Superannuation Act 1972. Exit costs are accounted for in full in the year of contractual agreement to depart. Where applicable, the additional costs of buy-out of reduced pension benefit are met by Land Registry and not by the Civil Service pension scheme. Ill health retirement costs are met by the pension scheme and are not included in the table.
Pay multiples (see note 1)
Reporting bodies are required to disclose the relationship between the remuneration of the highest-paid director in their organisation and the median remuneration of the organisation’s workforce.
Total remuneration includes salary, non-consolidated performance-related payments and benefits in kind, as well as severance payments. It does not include employer pension contributions and the cash equivalent transfer value of pensions.
| 2015/16 | 2014/15 | |
|---|---|---|
| Band of highest paid director’s total remuneration (£’000) | 190 – 195 | 150 – 155 |
| Median total (£) | 29,624 | 28,359 |
| Remuneration ratio | 6.5 | 5.4 |
| Note 1: Audited |
In 2015/16 no employees received remuneration in excess of the highest paid permanent director. Remuneration ranged from £190,000 – £195,000 to £15,000 – £20,000 (2014/15: £150,000 – £155,000 to £15,000 – £20,000).
The appointment of a new Chief Executive and Chief Land Registrar in June 2015 has resulted in an increase in the ratio.
Staff report
| 2015/16 | 2014/15 | |
|---|---|---|
| As at 31 March | ||
| Number of employees (including fixed-term appointments) on 31 March 2016 | 4,486 | 4,428 |
| Permanent full-time equivalents on 31 March | 4,035 | 3,968 |
| Number of apprentices at 31 March | 119 | 78 |
| Number of temporary/contract staff at 31 March | 18 | 27 |
| Female employees | 60% | 60% |
| Employees working part-time | 36% | 37% |
| Employees from ethnic minorities | 5% | 4% |
| Employees who report they have a disability | 9% | 8% |
| Average for the year | ||
| Average sickness days per employee | 6.3 | 6.3 |
| Average number of training days per employee | 7.1 | 5.2 |
| Training days per apprentice | 30.0 | 35.7 |
| Training spend as percentage of salary bill | 2.8% | 2.7% |
Gender analysis at 31 March 2016
| Male | Female | Total | |
|---|---|---|---|
| Non-executive directors | 4 | 1 | 5 |
| Executive directors (note: some Senior Civil Service employees are also directors, and are included in both categories) | 6 | 2 | 8 |
| Senior Civil Service – band 2 | 5 | 1 | 6 |
| Senior Civil Service – band 1 | 6 | 4 | 10 |
| Permanent employees (not including SCS) | 1,778 | 2,692 | 4,470 |
| Apprentices | 56 | 63 | 119 |
Staff costs 2015/16
| Permanent staff | Apprentices | Others | Total | |
|---|---|---|---|---|
| £’000 | £’000 | £’000 | £’000 | |
| Salaries | 124,291 | 2,118 | 7,640 | 134,049 |
| Social security costs | 9,337 | 169 | 151 | 9,657 |
| Other pension costs | 23,669 | 424 | 374 | 24,467 |
| Total staff costs | 157,297 | 2,711 | 8,165 | 168,173 |
Staff numbers
Average full-time equivalent in year
Based on full-time equivalent average of permanent staff and apprentices only (excludes contractors and consultants).
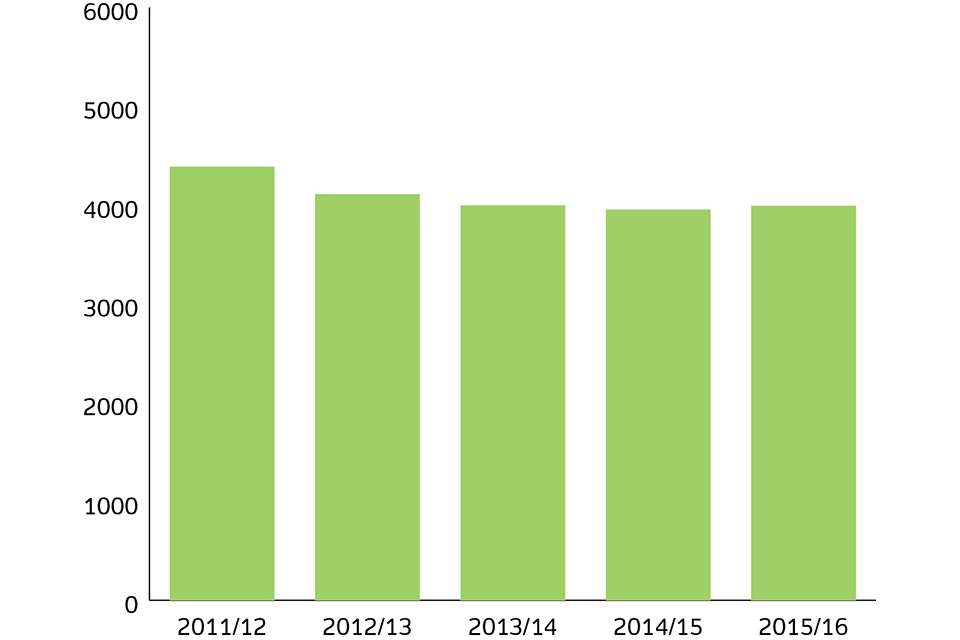
staff numbers
Resourcing
Our recruitment procedures are conducted on the basis of fair and open competition in accordance with the Civil Service Commissioners’ Recruitment Principles, and are subject to internal monitoring. All our job opportunities are subject to the Guaranteed Interview Scheme which assures that disabled people will progress to the next stage of the selection process if their application meets the minimum criteria. It is our policy to ensure that any tests used do not discriminate against disabled candidates.
Resourcing activity has addressed a number of requirements.
-
Key senior appointments to ensure we have a stable leadership team in place.
-
Enhancing specific competence areas, particularly in programme management and procurement/commercial skills.
-
Addressing front-line needs to maintain service delivery standards and to address future workforce sustainability.
A number of executive appointments were made, ensuring that Land Registry now has a stable Executive Team for the first time in five years. A permanent Director of Digital Services was appointed and took up his role in January 2016. A 12-month temporary appointment of an Assistant Chief Executive was made in January 2016. The role strengthens the capability of the executive team, enabling the development of a comprehensive stakeholder engagement and policy function, with a focus on strengthening relationships across government.
Delivery of the Local Land Charges Programme, which is one of the Government’s major projects managed under the Infrastructure and Projects Authority, was enhanced by the appointment of a permanent programme director in 2015.
The apprenticeship scheme has continued to provide the opportunity for young people to gain a qualification in business administration and learn the technical skills that could lead to future permanent employment with Land Registry, so creating the basis of a sustainable future workforce. 97 further apprentices were due to join in April 2016.
Recruitment
| 2015/16 | Total |
|---|---|
| Senior Civil Service (SCS) | 5 |
| Permanent Civil Service | 125 |
| Transfers from other government departments | 114 |
| On loan or fixed-term appointments from other government departments | 14 |
| Fixed-term appointments | 15 |
| Apprentices | 57 |
Off-payroll contractors have been used to meet short term needs in specialist areas, and information regarding compliance and disclosures is included in the Remuneration and staff report. At 31 March 2016, 15 contractors were engaged by Land Registry.
A small number of voluntary exits have enabled the organisation to release people with skills that are no longer required and refresh small specialist areas of the workforce.
Health and wellbeing
We are committed to maintaining the health and wellbeing of our staff. This year we have continued to deliver initiatives to support employees and the organisation through significant change.
Highlights for 2015/16 include:
-
introduction of an Employee Assistance Programme to provide employees and managers with comprehensive and effective support 24 hours a day
-
cross-Land Registry promotion and participation in the Time to Change, Time to Talk mental health day and Mental Health Awareness Week
-
delivery of a range of forums providing line managers with guidance and advice on supporting staff dealing with mental health issues, bereavement and serious illness
Ongoing staff wellbeing is promoted through a combination of the following key activities.
-
Health screening sessions providing staff with the opportunity to check blood pressure, body mass index and cholesterol.
-
Promotion and participation in a cycle to work scheme.
-
Provision of an occupational health service, with an associated health and wellbeing website and monthly promotional material on health issues.
-
Promotion of key wellness awareness events through departmental health campaigns promoting healthy lifestyle choices.
Capability
Land Registry places a strong emphasis on developing the skills of its people. We have continued to focus on the four priority areas identified by the Civil Service Capability Plan (change leadership, commercial, digital and project management) to facilitate change, build leadership capability and develop the knowledge, skills and behaviours required to create a flexible, effective and efficient organisation.
During 2015/16 we have undertaken a comprehensive training programme, Delivering our Business Strategy, to every member of staff, focusing on organisational priorities and values. We have clarified the role and expectation of our leaders and have introduced a People Focused Change Framework to support a consistent approach to change leadership and project management. To further our People Strategy objective of promoting a culture of professionalism we have focused on aligning Land Registry skills requirements to external bodies and frameworks and have piloted Civil Service-endorsed qualifications.
Our apprenticeship programme has been expanded, with additional apprentices in our Operations Directorate, and others due to take up their appointment in Finance and Human Resources & Organisational Development directorates during April 2016.
Employee involvement
We continue to engage both informally and formally with staff and their representatives, and this year have adopted some new approaches.
Chief Executive and director blogs have been issued during the year on a weekly basis and our staff have been encouraged to respond to these with the aim of creating open and honest dialogue and exchange of views.
Managers are expected to have regular monthly discussions with individual team members to openly discuss employee performance, ideas for improvements to working practices, wider organisational issues and any employee concerns.
We meet regularly with our trade unions. The Chief Executive and members of his team formally meet representatives at the Departmental Whitley Council meetings twice a year. There are structures in place for local Whitley meetings, and unions are consulted on specific issues. Informal six-weekly dialogue between the Chief Executive and trade union leads has been established during the year. Day-to-day operation of employment relations is managed through weekly engagement and consultation meetings between senior management and departmental trade union representatives.
During the year we have seen positive improvements in Land Registry’s engagement scores in the Civil Service People Survey, and regular Pulse surveys held during the year have shown that these improvements have been maintained. We continue to be committed to further improvements in engagement and an executive lead has responsibility for an engagement key performance indicator and action plan to create an environment where staff and managers feel valued and connected.
Constructive discussion with unions at both departmental and local level, in addition to encouraging staff involvement on other committees (including health and wellbeing, social and sports, diversity and charity), and directors’ visits with question and answer sessions, are all essential in ensuring our employees’ views are heard and understood.
Parliamentary accountability and audit report
Fees and charges
| 2016 | 2015 | |||||
|---|---|---|---|---|---|---|
| Income | Total costs | Surplus | Income | Total costs | Surplus | |
| £’000 | £’000 | £’000 | £’000 | £’000 | £’000 | |
| Registration of title | 284,196 | 249,120 | 35,076 | 286,696 | 241,092 | 45,604 |
| Land Charges and Agricultural Credits | 6,193 | 1,516 | 4,677 | 5,749 | 5,513 | 236 |
| Commercial | 4,983 | 3,548 | 1,435 | 4,635 | 2,934 | 1,701 |
| 295,372 | 254,184 | 41,188 | 297,080 | 249,539 | 47,541 | |
| Audited |
Special payments
| 2016 | 2015 | |||
|---|---|---|---|---|
| Number of Cases | Value of Payment | Number of Cases | Value of Payment | |
| £’000 | £’000 | |||
| Number of special payments over £300,000 | – | – | 1 | 1,030 |
| Audited |
Graham Farrant
Chief Executive and Chief Land Registrar
28 June 2016
The Certificate and Report of the Comptroller and Auditor General to the Houses of Parliament
I certify that I have audited the financial statements of HM Land Registry for the year ended 31 March 2016 under the Government Trading Funds Act 1973. The financial statements comprise the Statement of Comprehensive Income, Statement of Financial Position, Statement of Cash Flows, Statement of Changes in Reserves and the related notes. These financial statements have been prepared under the accounting policies set out within them. I have also audited the information in the Remuneration and Staff Report that is described in that report as having been audited.
Respective responsibilities of the Chief Land Registrar and auditor
As explained more fully in the Statement of Accounting Officer’s Responsibilities, the Chief Land Registrar is responsible for the preparation of the financial statements and for being satisfied that they give a true and fair view. My responsibility is to audit, certify and report on the financial statements in accordance with the Government Trading Funds Act 1973. I conducted my audit in accordance with International Standards on Auditing (UK and Ireland). Those standards require me and my staff to comply with the Auditing Practices Board’s Ethical Standards for Auditors.
Scope of the audit of the financial statements
An audit involves obtaining evidence about the amounts and disclosures in the financial statements sufficient to give reasonable assurance that the financial statements are free from material misstatement, whether caused by fraud or error. This includes an assessment of: whether the accounting policies are appropriate to HM Land Registry’s circumstances and have been consistently applied and adequately disclosed; the reasonableness of significant accounting estimates made by HM Land Registry; and the overall presentation of the financial statements.
In addition I read all the financial and non-financial information in the annual report to identify material inconsistencies with the audited financial statements and to identify any information that is apparently materially incorrect based on, or materially inconsistent with, the knowledge acquired by me in the course of performing the audit. If I become aware of any apparent material misstatements or inconsistencies I consider the implications for my certificate. I am required to obtain evidence sufficient to give reasonable assurance that the expenditure and income recorded in the financial statements have been applied to the purposes intended by Parliament and the financial transactions conform to the authorities which govern them.
Opinion on Regularity
In my opinion, in all material respects, the expenditure and income recorded in the financial statements have been applied to the purposes intended by Parliament and the financial transactions recorded in the financial statements conform to the authorities which govern them.
Opinion on Financial Statements
In my opinion:
-
the financial statements give a true and fair view of the state of HM Land Registry’s affairs as at 31 March 2016 and of its retained surplus for the year then ended; and
-
the financial statements have been properly prepared in accordance with the Government Trading Funds Act 1973 and HM Treasury directions issued thereunder
Opinion on other matters
In my opinion:
-
the part of the Remuneration and Staff Report to be audited has been properly prepared in accordance with HM Treasury directions made under the Government Trading Funds Act 1973; and
-
the information given in the Performance and Accountability reports for the financial year for which the financial statements are prepared is consistent with the financial statements
Matters on which I report by exception
I have nothing to report in respect of the following matters which I report to you if, in my opinion:
-
adequate accounting records have not been kept, or
-
the financial statements and the part of the Remuneration and Staff Report to be audited are not in agreement with the accounting records or returns, or
-
I have not received all of the information and explanations I require for my audit, or
-
the Governance Statement does not reflect compliance with HM Treasury’s guidance.
Report
I have no observations to make on these financial statements.
Sir Amyas C E Morse
Comptroller and Auditor General
National Audit Office
157-197 Buckingham Palace Road
Victoria
London
SW1W 9SP
1 July 2016
Financial statements
Statement of comprehensive income for the year ended 31 March 2016
| 2016 | 2015 | ||
|---|---|---|---|
| Notes | £’000 | £’000 | |
| Income – continuing operations | 2 | 295,372 | 297,080 |
| Cost of service | 2 | (238,591) | (236,571) |
| Gross surplus | 56,781 | 60,509 | |
| Administrative expenses | 2 | (15,593) | (12,968) |
| Operating surplus | 41,188 | 47,541 | |
| Loss on disposal of non-current assets | (431) | (10) | |
| Investment income – interest receivable | 5 | 1,774 | 1,881 |
| Finance costs | 6 | (702) | (899) |
| Amortisation and depreciation of e-service systems | 8.1, 9.1 | (3,469) | (3,530) |
| Restructure and reorganisation costs | 3.2 | (1,458) | (5,347) |
| Development costs | 3.3 | (2,265) | (3,028) |
| Surplus for the financial year | 34,637 | 36,608 | |
| Dividend payable | 7 | (13,584) | (19,114) |
| Special dividend | 7 | – | (100,000) |
| Retained surplus/(loss) for the financial year | 21,053 | (82,506) | |
| Loss on revaluation of property, plant and equipment | (7,817) | (1,074) | |
| Comprehensive surplus/(loss) for the financial year | 13,236 | (83,580) |
The notes to the financial statement are an integral part of these accounts.
Statement of financial position as at 31 March 2016
| 2016 | 2015 | ||||
|---|---|---|---|---|---|
| Notes | £’000 | £’000 | £’000 | £’000 | |
| Non-current assets | |||||
| Property, plant and equipment | 8 | 56,675 | 80,262 | ||
| Investment property | 8 | 6,800 | – | ||
| Intangible assets | 9 | 4,370 | 7,590 | ||
| Other receivables | 11.2 | 1,437 | 1,357 | ||
| Total non-current assets | 69,282 | 89,209 | |||
| Current assets | |||||
| Inventories | 10 | 4,745 | 2,489 | ||
| Trade and other receivables | 11.1 | 12,791 | 7,818 | ||
| Cash and cash equivalents | 12 | 443,871 | 397,752 | ||
| Total current assets | 461,407 | 408,059 | |||
| Non-current assets classified as held for sale | 8.3 | – | 12,150 | ||
| Total assets | 530,689 | 509,418 | |||
| Current liabilities | |||||
| Trade and other payables | 13.1 | 51,580 | 48,173 | ||
| Obligations under finance leases | 13.1, 14.1 | 284 | 621 | ||
| Short-term provisions | 16.1 | 8,116 | 10,218 | ||
| 59,980 | 59,012 | ||||
| Indemnity Fund | 16.2 | 84,800 | 73,600 | ||
| Total current liabilities | 144,780 | 132,612 | |||
| Non-current assets plus net current assets | 385,909 | 376,806 | |||
| Non-current liabilities | |||||
| Obligations under finance leases | 13.2, 14.1 | 4,931 | 5,215 | ||
| Long-term provisions | 16.1 | 7,416 | 11,265 | ||
| Total non-current liabilities | 12,347 | 16,480 | |||
| Net assets | 373,562 | 360,326 | |||
| Capital and reserves | |||||
| Public Dividend Capital | 61,545 | 61,545 | |||
| Revaluation reserve | 16,268 | 31,474 | |||
| Income and expenditure account | 295,749 | 267,307 | |||
| 373,562 | 360,326 |
The notes to the financial statements are an integral part of these accounts.
Graham Farrant
Chief Executive and Chief Land Registrar
28 June 2016
Statement of changes in reserves for the year ended 31 March 2016
| Public Dividend Capital | Revaluation reserve | I&E reserve | Total reserves | |
|---|---|---|---|---|
| £’000 | £’000 | £’000 | £’000 | |
| Balance at 31 March 2014 | 61,545 | 32,680 | 350,196 | 444,421 |
| Changes in reserves 2014/15 | ||||
| Revaluation reserve | ||||
| Transfer to retained earnings | – | (132) | 271 | 139 |
| Revaluation of non-current assets | – | – | (654) | (654) |
| Comprehensive loss | – | (1,074) | (82,506) | (83,580) |
| Balance at 31 March 2015 | 61,545 | 31,474 | 267,307 | 360,326 |
| Changes in reserves 2015/16 | ||||
| Revaluation reserve | ||||
| Transfer to retained earnings | – | (17) | 7,389 | 7,372 |
| Revaluation of non-current assets | – | (7,372) | – | (7,372) |
| Comprehensive surplus | – | (7,817) | 21,053 | 13,236 |
| Balance at 31 March 2016 | 61,545 | 16,268 | 295,749 | 373,562 |
The notes to the financial statements are an integral part of these accounts.
Cash flow statement for the year ended 31 March 2016
| 2016 | 2015 | ||
| Notes | £’000 | £’000 | |
| Net cash inflow from operating activities | 19.1 | 55,673 | 57,932 |
| Investing activities | |||
| Purchase of tangible assets | (4,091) | (1,976) | |
| Purchase of intangible assets | (355) | (467) | |
| Proceeds on disposal of tangible assets | 9,314 | 1,450 | |
| Interest received | 1,618 | 1,656 | |
| Net cash inflow from investing activities | 6,486 | 663 | |
| Financing activities | |||
| Dividends paid | (14,717) | (121,654) | |
| Repayments of capital element of obligations under finance leases | (621) | (2,929) | |
| Interest elements of obligations under finance leases | (702) | (899) | |
| Net cash outflow from financing activities | (16,040) | (125,482) | |
| Net increase/(decrease) in cash and cash equivalents | 19.2 | 46,119 | (66,887) |
| Cash and cash equivalents at beginning of year | 19.2 | 397,752 | 464,639 |
| Cash and cash equivalents at end of year | 12 | 443,871 | 397,752 |
The notes to the financial statements are an integral part of these accounts.
Notes to the financial statements
1. Statement of accounting policies
1.1 Basis of preparation
These financial statements have been prepared in accordance with the Government Financial Reporting Manual (FReM) 2015/16 and comply with the Accounts Direction given by HM Treasury in accordance with section 4 (6) (a) of the Government Trading Funds Act 1973. The accounting policies contained in the FReM follow International Financial Reporting Standards (IFRS) as adapted or interpreted for the public sector context. Where the FReM permits a choice of accounting policy, the accounting policy that has been judged to be the most appropriate to the particular circumstances of Land Registry for the purposes of giving a true and fair view has been selected. Land Registry’s accounting policies have been applied consistently in dealing with items considered material in relation to the financial statements.
These financial statements have been prepared on a going concern basis. Management is of the opinion that a going concern basis is appropriate as we are legally obliged under the Land Registration Act 2002 to provide statutory services relating to land registration and there are sufficient reserves to support the business going forwards.
IFRS 9 Financial instruments has been issued but is effective for periods commencing 1 January 2018 and IFRS 15 Revenue from contracts with customers has been issued but is effective for periods commencing 1 January 2017. Neither accounting standard is expected to have a material impact on Land Registry.
1.2 Accounting convention
The financial statements have been prepared under the historical cost convention modified for the revaluation of property, plant and equipment, investment property, assets held for sale, intangible assets and, where material, inventories to fair value as determined by the relevant accounting standard.
1.3 Estimation techniques
Estimates and judgements are continually evaluated and are based on historical experience and other factors, including expectations of future events that are believed to be reasonable under the circumstances.
The estimates and judgements that have a significant risk of causing a material adjustment to the carrying amounts of assets and liabilities within the next financial year are:
- Note 8 – impairment of non-current assets
- Note 13 – deferred income – fees received in advance
- Note 16.1 – early retirement, early severance and other provisions
- Note 16.2 – estimated provision for indemnity claims
1.4 Fee income
Income from fees and charges is recognised in the financial statements of the financial year in which the service is delivered. Income is recognised net of any refunds for transactions that are not completed or on transactions where erroneous information is provided by customers.
Certain services require receipt of payment upon application resulting in payments being received for services not yet delivered within the financial year being reported. These amounts are reported as ‘fees received in advance’ and disclosed within current liabilities. Fees are recognised once the register has been fully updated following receipt of an application.
1.5 Operating segments
Land Registry’s operating segments are organised around the services it provides and are reported in a manner consistent with the internal reporting provided to the chief operating decision maker (CODM). The three main business segments are registration of title, Land Charges and Agricultural Credits and commercial income. This is based on the group’s internal organisation and management structure, and is the primary way in which the CODM is provided with financial information. The CODM of Land Registry is Graham Farrant, Chief Executive and Chief Land Registrar.
Local Land Charges
Following the passing of the Infrastructure Act 2015, Land Registry is being given responsibility for registering Local Land Charges. In preparing for the provision of this service, related expenditure is being expensed as incurred as it does not meet the criteria for capitalisation. It is recorded in the accounts under ‘Development costs’.
1.6 Employee benefits
The cost of providing employee benefits is recognised in the period in which Land Registry receives services from its employees, rather than when it is paid or payable. Short-term employee benefits are recognised as an expense in the period in which the employee renders the service. Performance payments are recognised only when there is a legal or constructive obligation to pay them and the costs can be reliably estimated. Termination benefits are recognised when it can be demonstrated that there is an irreversible agreement to terminate the employment of employee(s) before the schemes’ retirement date or as a result of an offer to encourage voluntary redundancy.
1.7 Pensions
Land Registry employees are civil servants who are entitled to be members of the Principal Civil Service Pension Scheme (PCSPS) or the Civil Servants and Others Pension Scheme (CSOPS) or alpha. These are unfunded multi-employer defined benefit schemes, but Land Registry is unable to identify its share of the underlying assets and liabilities on a reasonable and consistent basis. Land Registry has therefore accounted for contributions and payments to these schemes under International Accounting Standard (IAS) 19 Employee benefits as if they were defined contribution schemes. Liability for the payment of future benefits is a charge on the PCSPS or alpha scheme.
1.8 Property, plant and equipment
Freehold and leasehold land and buildings are professionally valued by external, independent property valuers having appropriate recognised professional qualifications and recent experience in the location and category of the properties being valued. Cushman & Wakefield, RICS registered valuers, carried out a full valuation in February 2016.
Land Registry is required by the FReM to disclose non-current assets in the statement of financial position at fair value. For assets in use the FReM requires valuation at existing use as an asset’s fair value, rather than market value required by IFRS 13 Fair value measurement. Details of FReM adaptations which continue to apply for 2015/16 can be found at: Government financial reporting manual 2015 to 2016.
For short life non-property assets historical cost is used as an approximation to the fair value of the asset. Freehold land and buildings and leasehold buildings are included at revaluation less accumulated depreciation and impairment losses. All other tangible non-current assets are included at historical cost less accumulated depreciation and impairment losses.
Assets in the course of construction are not depreciated. For other assets the depreciation charge is calculated so as to allocate the cost or revalued amount, less the estimated residual value, of non-current assets systematically over their remaining useful lives using the straight-line method.
Other property, plant and equipment includes IT and office equipment and machinery. Land Registry capitalises expenditure over £1,000 for an individual asset. Where appropriate, individual assets falling below the minimum value for capitalisation are grouped. It is Land Registry’s policy not to capitalise expenditure on fixtures and fittings, principally office furniture, as they are not considered material.
Asset lives are reviewed at the end of each financial year.
The following asset depreciation rates are used.
| Asset | Rate | |
|---|---|---|
| Freehold land | nil | |
| Freehold buildings | Estimated useful life | |
| Leasehold buildings | period of the lease or estimated useful life | |
| Telecommunications equipment | 20% | |
| Office equipment | 20% | |
| Computers: | mainframe | 20% |
| PCs | 33.3% | |
| Structured cabling | 10% | |
| Plant and heavy machinery | 10% |
Non-current assets classified as held for sale are carried at fair value less costs to sell and are not depreciated. Land Registry classifies a non-current asset as held for sale if its carrying amount will be recovered principally through a sales transaction rather than through continuing use. To qualify the asset must be available for immediate sale in its present condition and the sale must be highly probable.
1.9 Impairment of non-current assets
Impairment reviews are undertaken at each year end and if there are indications that the asset has suffered an impairment loss a charge is reflected in the statement of comprehensive income in the year in which it occurs. If the asset is carried at a revalued amount, the impairment loss is treated as a revaluation decrease, to the extent of the revaluation reserve that relates to the asset, with any excess in the statement of comprehensive income. If any such indication exists the recoverable amount of the asset is estimated in order to determine the extent of the impairment loss. The recoverable amount is the higher of fair value less costs to sell and value in use.
1.10 Intangible assets
Software licences
Separately acquired intangible assets are shown at historical cost. The costs incurred to acquire and bring these assets to use are capitalised. These include contractors’ charges, materials, directly attributable labour and directly attributable overhead costs.
Software licences are included at cost less accumulated amortisation. They are amortised on a straight line basis at a rate of
| Software licence | Rate |
|---|---|
| Mainframe | 20% |
| PCs | 33.3% |
Software development costs
In accordance with IAS 38 Intangible assets, expenditure incurred on developing new IT infrastructure (covering third party costs and the direct costs of in-house staff effort) can be capitalised. Development costs that are directly attributable to the design and testing of identifiable and unique software products controlled by Land Registry are recognised as intangible assets when the following criteria are met.
-
It is technically feasible to complete the software product so that it will be available for use.
-
Management intends to complete the software product and use or sell it.
-
There is an ability to use or sell the software product.
-
It can be demonstrated how the software product will generate probable future economic benefit.
-
Adequate technical, financial and other resources to complete the development and to use or sell the software product are available.
-
The expenditure attributable to the software product during its development can be reliably measured.
Directly attributable costs that are capitalised as part of the software product include the software development employee costs and an appropriate portion of relevant overheads. Other development expenditures that do not meet these criteria are recognised as an expense as incurred. Development costs previously recognised as an expense are not recognised as an asset in a subsequent period.
All research expenditure is written off as incurred.
Land Registry portal, E-security and Business Gateway
Land Registry has developed three systems, all of which are now in use, to deliver e-services. The costs of developing the IT systems (Land Registry portal, E-security and Business Gateway) have been capitalised as intangible assets on the statement of financial position. These assets are now being amortised on a straight line basis, at a rate of 12.5% over the expected useful lives of the systems, which have been determined with reference to the useful lives of other similar assets in use in Land Registry. Where significant enhancements to these systems are made, the costs incurred are treated as a separate component and may be capitalised (subject to meeting the criteria for capitalisation within IAS 38). These components are amortised over their useful life.
1.11 Investment property
Investment property is measured at fair value. Any gain or loss on disposal (calculated as the difference between the net proceeds from disposal and the carrying amount of the item) is recognised in profit or loss. When investment property that was previously classified as property, plant and equipment is sold, any related amount included in the revaluation reserve is transferred to retained earnings (see note 1.8 for details of valuers).
1.12 Inventories
Work-in-progress is stated at the lower of cost and net realisable value. Cost includes internal costs of staff and directly attributable overheads in preparing completion of registration for the customer. Net realisable value is based on the fee that is charged to the customer less further costs expected to be incurred in completing the services.
1.13 Trade receivables
Trade receivables do not carry any interest and are stated at their nominal value as reduced by appropriate allowances for irrecoverable amounts. These impairment provisions are recorded in administrative expenses within the statement of comprehensive income. The carrying amount of trade receivables is deemed to be an approximation of fair value.
If collection of amounts receivable is expected in one year or less they are classified as current assets.
1.14 Cash and cash equivalents
Cash represents cash-in-hand, cash held with the Government Banking Service (GBS), cash on deposit with the National Loans Fund and in commercial bank accounts. The commercial bank and GBS deposits are immediately available funds. National Loans Fund deposits are short-term investments of six months or less and cannot be repaid until maturity of the loan.
1.15 Trade payables
Trade payables are obligations to pay for goods and services that have been acquired in the ordinary course of business from suppliers. Accounts payable are classified as current liabilities if payment is due within one year or less. If not they are presented as non-current liabilities. Trade payables are stated at their nominal value. The carrying amount of trade payables is deemed to be an approximation of fair value.
1.16 Provisions
Land Registry provides for legal and constructive obligations that are of uncertain timing or amount at the statement of financial position date, on the basis of management’s best estimate of the expenditure required to settle the obligation at the statement of financial position date. If the effect of discounting is material, provisions are discounted to the expected present value of their future cash flows using a risk-free discount rate. Where appropriate this is supported by independent professional advice. Provisions are charged to the statement of comprehensive income and recorded as liabilities in the statement of financial position. (Further details, including sensitivities, are given in note 16.)
1.17 Indemnity Fund
Schedule 8 to the Land Registration Act 2002 requires Land Registry to indemnify third parties against loss caused by mistakes in the register, mistakes in search results and loss of documents by Land Registry. Most of Land Registry’s indemnity claims arise as a result of mistakes in the register, and some of these mistakes are the result of forgery of documents such as charges. Indeed fraud/forgery usually accounts for the largest share of indemnity payments, and this year is no exception. Under Schedule 8 to the Act, Land Registry has statutory rights to recover these payments from third parties, where it is the case that third parties are at fault, either wholly or partly, for the loss.
As at the current accounting date, future claim payments are uncertain in timing and amount. The Indemnity Fund is established on the basis of the best estimate of the expenditure required to settle the obligation. The Indemnity Fund is determined after considering actuarial estimates of the cost of claims reported but not settled, as well as claims incurred but not reported. The estimated cost of claims includes expenses incurred in settling these claims.
The carrying amount of the Indemnity Fund is derived from critical judgements, estimates and assumptions based upon historical experience and other factors which are considered to be relevant. These estimates and underlying assumptions are reviewed on a quarterly basis by Land Registry, supported by its independent actuaries Lane, Clark & Peacock LLP.
After the accounting date, a further review of claims received by Land Registry (up to the date the Accounting Officer approves the Annual Report and Accounts) is made to see if the indemnity fund is still appropriately valued. Provided in these accounts are the likely settlement values of current and future claims against the Indemnity Fund. Further details of the Indemnity Fund are shown in note 16.2 of this report.
1.18 Contingent liabilities
Where appropriate, liabilities that have only a possible chance of crystallising and do not meet the provisions’ criteria have been classified as contingent liabilities. This includes, but is not limited to, claims for losses arising from errors, or fraud in relation to Land Registry’s statutory responsibility as insurer of titles in England and Wales, see note 18.1.
1.19 Finance leases
Where Land Registry retains all the risks and rewards of ownership of an asset subject to a lease, the lease is treated as a finance lease. Future instalments payable under finance leases, net of finance charges, are included in liabilities with the corresponding asset values recorded in non-current assets and depreciated over the shorter of their estimated useful lives or their lease terms. Lease payments are apportioned between the finance element, which is charged to the statement of comprehensive income as interest, and the capital element, which reduces the outstanding obligation for future instalments.
1.20 VAT
Land Registry accounts for VAT on its statutory activities under HM Treasury’s Taxing and Contracting Out of Services Directions. For non-statutory activity, which is business activity, VAT is charged and recovered according to commercial VAT rules. Irrecoverable VAT is charged to the relevant expenditure category or included in the capitalised purchase costs of non-current assets. Where output tax is charged or input tax is recoverable the amounts are stated net of VAT.
1.21 Treasury dividend
Land Registry is required to pay HM Treasury an annual dividend being 3.6% of the average capital employed during the financial year. Land Registry considers it sufficient to calculate this figure using an annual average. There is no material impact of calculating this figure using an alternative method, eg monthly average.
1.22 Prior period re-statements
Under IAS 8 Accounting policies changes in accounting estimates and errors, adjustments to prior periods are required for changes to accounting policies or to correct prior period errors, arising from omissions, or misstatements. There have been no prior period re-statements in 2015/16.
2. Business segments
IFRS 8 – Operating segments requires analysis of income and expenditure by principal business activities.
There are three separate areas for statutory services carried out by Land Registry: registration of title; registration of Land Charges; and registration of mortgages made under the Agricultural Credits Act 1928. For operational purposes, Land Registry combines delivery of these latter two services and this is reflected in this segmental analysis.
Land Registry also provides a range of commercial services which is shown separately as a business segment.
Detailed in the table below is the income from statutory fees and commercial charges, the cost of service and the net surplus for each of the business segments. The cost of service and administrative expenses are allocated and apportioned on an appropriate basis for the service.
| Statutory | Non-statutory | 2016 | Statutory | Non-statutory | 2015 | |||
|---|---|---|---|---|---|---|---|---|
| Registration of title | Land Charges and Agricultural Credits | Commercial income | Total | Registration of title | Land Charges and Agricultural Credits | Commercial income | Total | |
| £’000 | £’000 | £’000 | £’000 | £’000 | £’000 | £’000 | £’000 | |
| Income | 284,196 | 6,193 | 4,983 | 295,372 | 286,696 | 5,749 | 4,635 | 297,080 |
| Cost of service | (233,892) | (1,483) | (3,216) | (238,591) | (228,716) | (5,253) | (2,602) | (236,571) |
| Administrative expenses | (15,228) | (33) | (332) | (15,593) | (12,376) | (260) | (332) | (12,968) |
| Operating surplus | 35,076 | 4,677 | 1,435 | 41,188 | 45,604 | 236 | 1,701 | 47,541 |
The surplus for registration of title has decreased by £10.6 million compared with the prior year. This is due to a combination of lower income (which is in line with the original budget) and an increase in costs. The cost increase is due to an increase over the prior year of £11.2 million for the indemnity provision (primarily the IBNR) and a downward revaluation of the Land Registry estate, giving an impairment of £6.6 million.
The surplus for Land Charges and Agricultural Credits has increased due to greater understanding of the costs applicable to this service. The impact on the surplus for the prior year, if the same application of costs had applied, would have been a surplus of £4.4 million.
The surplus for the year on commercial income of £1.4 million is higher than expected. Revenues were higher than the baseline forecast (£0.9 million) due to: some customers developing their connectivity to a service more quickly than anticipated, resulting in revenue being realised earlier than forecast; another service being re-advertised, leading to an increase in take-up; and unanticipated requests from the lender sector.
3 Operating surplus
3.1 Operating surplus is stated after charging
| 2016 | 2015 | |
|---|---|---|
| £’000 | £’000 | |
| Staff costs | 168,173 | 165,235 |
| Provision for indemnity costs | 11,200 | 8,700 |
| IT infrastructure costs (note: IT services were brought in-house after the contract with Steria ended in July 2014) | – | 2,616 |
| IT services | 14,901 | 14,136 |
| Hire of machinery | 5,302 | 5,448 |
| Auditor’s remuneration – audit fee | 65 | 0,65 |
| Depreciation of tangible non-current assets – owned | 4,682 | 5,042 |
| Depreciation of tangible non-current assets – leased | 547 | 1,082 |
| Amortisation of intangible assets | 338 | 514 |
| Impairment in value of non-current assets | 6,466 | 1,125 |
| Charge for operating leases – buildings | 1,361 | 1,321 |
| Miscellaneous income | (2,842) | (2,265) |
3.2 Restructure and reorganisation costs
| 2016 | 2015 | ||||||||
|---|---|---|---|---|---|---|---|---|---|
| Early retirement | Early severance | ATP (Accelerated Transformation Programme) | Total | Early retirement | Early severance | ATP | Total | ||
| £’000 | £’000 | £’000 | £’000 | £’000 | £’000 | £’000 | £’000 | ||
| Costs incurred in year | 282 | – | 1,176 | 1,458 | 157 | 1,348 | 982 | 2,487 | |
| Costs provided in year | – | – | – | – | 588 | 2,272 | – | 2,860 | |
| 282 | – | 1,176 | 1,458 | 745 | 3,620 | 982 | 5,347 |
3.3 Local Land Charges development costs
| 2016 | 2015 | |
|---|---|---|
| £’000 | £’000 | |
| Costs incurred in year | 2,265 | 3,028 |
| 2,265 | 3,028 |
The Infrastructure Act 2015 passed to Land Registry the responsibility for maintaining a register of Local Land Charges and we are in the process of developing this statutory service as a new business segment. Costs related to the development of this service are recorded separately and shown in the table above.
4. Employee information
4.1 Staff costs
| 2016 | 2015 | |||||||
|---|---|---|---|---|---|---|---|---|
| Permanent staff | Apprentices | Others | Total | Permanent staff | Apprentices | Others | Total | |
| £’000 | £’000 | £’000 | £’000 | £’000 | £’000 | £’000 | £’000 | |
| Salaries | 124,291 | 2,118 | 7,640 | 134,049 | 127,745 | 574 | 4,116 | 132,435 |
| Social security costs | 9,337 | 169 | 151 | 9,657 | 9,756 | 46 | 36 | 9,838 |
| Other pension costs | 23,669 | 424 | 374 | 24,467 | 22,771 | 115 | 76 | 22,962 |
| Total staff costs | 157,297 | 2,711 | 8,165 | 168,173 | 160,272 | 735 | 4,228 | 165,235 |
4.2 Staff numbers
Average number of persons employed (full-time equivalent) by Land Registry during the year was made up as follows.
| 2016 | 2015 | |||||||
|---|---|---|---|---|---|---|---|---|
| Permanent staff | Apprentices | Others | Total | Permanent staff | Apprentices | Others | Total | |
| Senior management | 7 | – | 1 | 8 | 7 | – | 1 | 8 |
| Operational | 3,310 | 99 | 26 | 3,435 | 3,330 | 39 | 9 | 3,378 |
| Administration | 222 | – | 8 | 230 | 234 | – | 18 | 252 |
| IT | 344 | – | 18 | 362 | 354 | – | 41 | 395 |
| 3,883 | 99 | 53 | 4,035 | 3,925 | 39 | 69 | 4,033 |
4.3 Salary and pension entitlements
The salary and pension entitlements of the Chief Executive and the directors of Land Registry are included in the Remuneration and staff report.
4.4 Pensions
The Principal Civil Service Pension Scheme (PCSPS) and the Civil Servants and Others Pension Scheme (CSOPS) or alpha are unfunded multi-employer defined benefit schemes but Land Registry is unable to identify its share of the underlying assets and liabilities. The scheme actuary valued the scheme as at 31 March 2012. You can find details in the resource accounts of the Cabinet Office: Civil Superannuation.
For 2015/16, employers’ contributions of £24.4 million were payable to the PCSPS and CSOPS (2014/15: £22.9 million) at one of four rates in the range 20.0% to 24.5% of pensionable earnings, based on salary bands. The scheme actuary reviews employer contributions usually every four years following a full scheme valuation. The contribution rates are set to meet the cost of the benefits accruing during 2015/16 to be paid when the member retires and not the benefits paid during this period to existing pensioners.
Employees can opt to open a partnership pension account, a stakeholder pension with an employer contribution.
Land Registry contributions of £146,842 were paid to one or more of the panel of three appointed stakeholder pension providers (2014/15: £49,316). Employer contributions are age-related and range from 3% to 12.5% of pensionable earnings up to 30 September 2015 and from 8% to 14.75% of pensionable earnings from 1 October 2015. Land Registry also match employee contributions up to 3% of pensionable earnings. In addition, Land Registry contributions of £3,534, 0.8% of pensionable pay up to 30 September 2015 and 0.5% of pensionable pay from 1 October 2015, were payable to the PCSPS to cover the cost of the future provision of lump sum benefits on death in service or ill health retirement of these employees (2014/15: £3,208).
Any contributions due to the partnership pension providers at the statement of financial position date or contributions pre-paid at that date were not material.
Eleven individuals retired early during the year on ill-health grounds. The total additional accrued pension liabilities in the year amounted to £39,830 (2014/15: £23,558).
Further information relating to pension arrangements can be found in the Remuneration and staff report and note 1.7.
5. Investment income
| 2016 | 2015 | |
|---|---|---|
| £’000 | £’000 | |
| Interest on bank deposits | 1,774 | 1,881 |
6. Finance costs
| 2016 | 2015 | |
|---|---|---|
| £’000 | £’000 | |
| Interest on obligations under finance leases | 702 | 899 |
7. Dividend payable
| 2016 | 2015 | |
|---|---|---|
| £’000 | £’000 | |
| Dividend payable | 13,584 | 19,114 |
| Special dividend | – | 100,000 |
| 13,584 | 119,114 |
In March 2016 an interim payment of £10.6 million was made in respect of the ordinary dividend.
See note 1.21 for the accounting policy relating to dividend payments.
8. Property, plant and equipment
8.1 Cost or valuation
| Property | Plant and equipment | |||||||
|---|---|---|---|---|---|---|---|---|
| Freehold | Leasehold | Assets under construction | IT-related assets | Other plant and equipment | Total | |||
| Land | Buildings | Investment property | Buildings | |||||
| £’000 | £’000 | £’000 | £’000 | £’000 | £’000 | £’000 | £’000 | |
| At 1 April 2015 | 13,811 | 56,342 | – | 25,643 | – | 65,514 | 4,412 | 165,722 |
| Additions | – | – | – | – | 770 | 4,223 | 22 | 5,015 |
| Assets brought into use | – | – | – | – | (302) | 302 | – | – |
| Revaluation in year | (3,666) | 128 | – | (310) | – | – | – | (3,848) |
| Reclassification of assets | (335) | (5,665) | 6,800 | (800) | – | (1) | (21) | (22) |
| Impairment | (725) | (1,837) | – | (2,902) | – | – | – | (5,464) |
| Disposals | – | – | – | (9,459) | – | (1,594) | – | (11,053) |
| At 31 March 2016 | 9,085 | 48,968 | 6,800 | 12,172 | 468 | 68,444 | 4,413 | 150,350 |
| Accumulated depreciation and impairment | ||||||||
| At 1 April 2015 | – | 15,235 | – | 7,665 | – | 59,442 | 3,118 | 85,460 |
| Provided during the year | – | 1,497 | – | 910 | – | 3,861 | 215 | 6,483 |
| Current cost revaluation | – | (524) | – | (686) | – | – | – | (1,210) |
| Reclassification of assets | – | – | – | – | – | (1) | (21) | (22) |
| Disposals | – | – | – | (2,674) | – | (1,162) | – | (3,836) |
| At 31 March 2016 | – | 16,208 | – | 5,215 | – | 62,140 | 3,312 | 86,875 |
| Carrying amount at 31 March 2016 | 9,085 | 32,760 | 6,800 | 6,957 | 468 | 6,304 | 1,101 | 63,475 |
8.2 Cost or valuation
| Property | Plant and equipment | ||||||||||||||||
|---|---|---|---|---|---|---|---|---|---|---|---|---|---|---|---|---|---|
| Freehold | Leasehold | Assets under construction | IT-related assets | Other plant and equipment | Total | ||||||||||||
| Land | Buildings | Investment property | Buildings | ||||||||||||||
| £’000 | £’000 | £’000 | £’000 | £’000 | £’000 | £’000 | £’000 | ||||||||||
| At 1 April 2014 | 13,962 | 55,373 | – | 28,503 | 656 | 73,061 | 4,934 | 176,489 | |||||||||
| Additions | – | – | – | – | – | 2,317 | 344 | 2,661 | |||||||||
| Assets brought into use | – | 139 | – | – | (172) | 17 | – | (16) | |||||||||
| Revaluation in year | (151) | 832 | – | (2,405) | – | (468) | – | (2,192) | |||||||||
| Reclassification of assets | – | – | – | – | (484) | 59 | – | (425) | |||||||||
| Impairment | – | (2) | – | (455) | – | – | – | (457) | |||||||||
| Disposals | – | – | – | – | – | (9,472) | (866) | (10,338) | |||||||||
| At 31 March 2015 | 13,811 | 56,342 | – | 25,643 | – | 65,514 | 4,412 | 165,722 | |||||||||
| Accumulated depreciation and impairment | |||||||||||||||||
| At 1 April 2014 | – | 14,232 | – | 7,109 | – | 64,036 | 3,778 | 89,155 | |||||||||
| Provided during the year | – | 1,518 | – | 1,287 | – | 4,465 | 199 | 7,469 | |||||||||
| Current cost revaluation | – | (515) | – | (731) | – | – | – | (1,246) | |||||||||
| Reclassification of assets | – | – | – | – | – | 59 | – | 59 | |||||||||
| Disposals | – | – | – | – | – | (9,118) | (859) | (9,977) | |||||||||
| At 31 March 2015 | – | 15,235 | – | 7,665 | – | 59,442 | 3,118 | 85,460 | |||||||||
| Carrying amount at 31 March 2015 | 13,811 | 41,107 | – | 17,978 | – | 6,072 | 1,294 | 80,262 |
See note 1.8 for details of the property, plant and equipment accounting policy.
See note 1.9 for details of the impairment accounting policy.
See note 8.4 for details of investment property.
The carrying amount of land and buildings at market value is £41.4 million. The net amount of finance leases at the end of the year was £0.1 million (2014/15: £1.2 million). In the year £0.0 million of depreciation, £0.3 million downward revaluation and an impairment charge of £0.8 million was charged to these finance lease assets.
£0.04 million of depreciation has been charged to amortisation and depreciation of e-service systems.
8.3 Non-current assets classified as held for sale
Chalfont Drive, Nottingham – southern plot has been transferred from non-current assets classified as held for sale to non-current assets. This was because a review in March 2016 determined that there was no immediate prospect of sale. An impairment of £1 million was charged to expenditure and £1.75 million was charged against the revaluation reserve, prior to the asset being transferred to property, plant and equipment. The Chalfont Drive, Nottingham – northern plot was sold for £9.4m during the year.
8.4 Investment property
Investment property comprises a number of properties that are leased to third parties either in part or whole. The leases have different non-cancellable periods with current break option points ranging from six months to eight years. One lease has an annual rent review period, two are five yearly and one has none. Increases are linked to market rent based on comparables. None have an automatic right of renewal. Further information about these leases is included in note 14.2.
The fair value of investment property was determined by external, independent property valuers, having appropriate recognised professional qualifications and recent experience in the location and category of the property being valued. The independent valuers provide the fair value of the Land Registry’s investment properties annually (see note 1.8 for details of valuers)(#property-plant-and-equipment).
The movement from fair value existing use to investment property at fair value is shown in the table: Cost of valuation.
The fair value of investment properties are all level 3 on the fair value hierarchy, because they are valued by reference to valuation techniques using inputs that are not based on observable market data.
There were no transfers between level 2 and level 3 fair value disclosures during the year.
Each investment property is measured based upon active market prices adjusted where necessary for any difference in nature, location or condition of each specific property. The active market price is the market rent taking into account any expected or anticipated periods of non-occupancy by a future tenant.
9. Intangible assets
9.1 Cost
| E-security | Portal | Business Gateway | Software licences | Total | |
|---|---|---|---|---|---|
| £’000 | £’000 | £’000 | £’000 | £’000 | |
| At 1 April 2015 | 9,691 | 15,967 | 1,766 | 42,120 | 69,544 |
| Additions | – | – | – | 543 | 543 |
| Assets brought into use | – | – | – | – | – |
| Reclassification | – | – | – | 2 | 2 |
| Revaluation | – | – | – | – | – |
| Disposals | – | – | – | (18) | (18) |
| At 31 March 2016 | 9,691 | 15,967 | 1,766 | 42,647 | 70,071 |
| Amortisation | |||||
| At 1 April 2015 | 7,268 | 11,976 | 1,326 | 41,384 | 61,954 |
| Charge for the year | 1,210 | 1,995 | 221 | 336 | 3,762 |
| Reclassification of assets | – | – | – | 3 | 3 |
| Revaluation | – | – | – | – | – |
| Disposals | – | – | – | (18) | (18) |
| At 31 March 2016 | 8,478 | 13,971 | 1,547 | 41,705 | 65,701 |
| Carrying amount at 31 March 2016 | 1,213 | 1,996 | 219 | 942 | 4,370 |
9.2 Cost
| E-security | Portal | Business Gateway | Software licences | Total | |
|---|---|---|---|---|---|
| £’000 | £’000 | £’000 | £’000 | £’000 | |
| At 1 April 2014 | 9,691 | 15,967 | 1,766 | 42,858 | 70,282 |
| Additions | – | – | – | 509 | 509 |
| Assets brought into use | – | – | – | 16 | 16 |
| Reclassification | – | – | – | (59) | (59) |
| Revaluation | – | – | – | (186) | (186) |
| Disposals | – | – | – | (1,018) | (1,018) |
| At 31 March 2015 | 9,691 | 15,967 | 1,766 | 42,120 | 69,544 |
| Amortisation | |||||
| At 1 April 2014 | 6,057 | 9,980 | 1,104 | 41,947 | 59,088 |
| Charge for the year | 1,211 | 1,996 | 222 | 514 | 3,943 |
| Reclassification of assets | – | – | – | (59) | (59) |
| Disposals | – | – | – | (1,018) | (1,018) |
| At 31 March 2015 | 7,268 | 11,976 | 1,326 | 41,384 | 61,954 |
| Carrying amount at 31 March 2015 | 2,423 | 3,991 | 440 | 736 | 7,590 |
See note 1.10 for details of the intangible assets accounting policy.
£3.4 million of amortisation has been charged to amortisation and depreciation of e-service systems.
10. Inventories
| 2016 | 2015 | |
|---|---|---|
| £’000 | £’000 | |
| Work-in-progress | 4,745 | 2,489 |
| 4,745 | 2,489 |
11. Trade and other receivables
11.1 Current
| 2016 | 2015 | |
|---|---|---|
| £’000 | £’000 | |
| Trade receivables | 2,263 | 2,238 |
| Other receivables | 6,285 | 1,994 |
| Prepayments and accrued income | 4,243 | 3,586 |
| 12,791 | 7,818 |
The average credit period taken on provision of services is three days. No interest is charged on the receivables. An allowance has been made for estimated irrecoverable amounts from the provision of services and this allowance has been determined by reference to past default experience.
11.2 Non-current
| 2016 | 2015 | |
|---|---|---|
| £’000 | £’000 | |
| Other receivables | 302 | 375 |
| Prepayments | 1,135 | 982 |
| 1,437 | 1,357 |
The carrying amount of trade and other receivables is deemed to be an approximation of their fair value. Included within prepayments is £0.59 million relating to scanning equipment for the Virtual Post Room.
12 Cash at bank and in hand
| 2016 | 2015 | |
|---|---|---|
| £’000 | £’000 | |
| Government Banking Service | 46,764 | 36,539 |
| Commercial banks and cash-in-hand | 16,681 | 30,817 |
| National Loans Fund | 380,426 | 330,396 |
| 443,871 | 397,752 |
Land Registry’s financial assets are bank balances and cash and trade and other receivables, which represent the maximum exposure to credit risk in relation to financial assets. The credit risk is primarily attributable to trade and other receivables and is spread over a large number of customers. The amounts presented in the statement of financial position are net of allowances for doubtful receivables, estimated by management based on past experience and an assessment of the current economic climate. The credit risk on liquid funds is limited because Land Registry’s bank balances are in the main held with the Government Banking Service and the National Loans Fund.
13. Trade and other payables
13.1 Current
| 2016 | 2015 | |
|---|---|---|
| £’000 | £’000 | |
| Trade payables | 1,701 | 2,801 |
| Taxation and social security | 2,823 | 2,598 |
| Other payables | 2,777 | 2,512 |
| Accruals | 20,115 | 23,203 |
| Net obligations under finance leases – buildings | 165 | 146 |
| Net obligations under finance leases – computer equipment | 119 | 475 |
| Deferred income – fees received in advance | 21,183 | 12,945 |
| Dividend payable | 2,981 | 4,114 |
| 51,864 | 48,794 |
Trade and other payables principally comprise amounts outstanding for trade purchases and ongoing costs. The average credit period taken for trade purchases is nine days. The carrying amount of trade payables is deemed to be an approximation of their fair value.
13.2 Non-current
| 2016 | 2015 | |
|---|---|---|
| £’000 | £’000 | |
| Net obligations under finance leases – buildings | 4,924 | 5,089 |
| Net obligations under finance leases – computer equipment | 7 | 126 |
| 4,931 | 5,215 |
14. Obligations under leases
14.1 Finance leases
| Minimum lease payments | Present value of minimum lease payments | |||
|---|---|---|---|---|
| 2016 | 2015 | 2016 | 2015 | |
| £’000 | £’000 | £’000 | £’000 | |
| Amounts payable under finance leases | ||||
| Within one year | 966 | 1,322 | 284 | 621 |
| In the second to fifth years inclusive | 3,320 | 3,511 | 899 | 933 |
| After five years | 6,839 | 7,614 | 4,032 | 4,282 |
| 11,125 | 12,447 | 5,215 | 5,836 | |
| Less future finance charges | (5,910) | (6,611) | ||
| Present value of lease obligations | 5,215 | 5,836 | ||
| Less amount due for settlement within 12 months (shown under current liabilities) | (284) | (621) | ||
| Amount due for settlement after 12 months | 4,931 | 5,215 |
14.2 Operating leases
Leases as lessee
| 2016 | 2015 | |
|---|---|---|
| £’000 | £’000 | |
| Minimum lease payments under operating leases recognised in the year | 1,426 | 1,444 |
| Income from tenants | (65) | (123) |
| 1,361 | 1,321 |
At the statement of financial position date Land Registry had outstanding commitments for future minimum lease payments under non-cancellable operating leases, which fall due as follows:
| 2016 | 2015 | |
|---|---|---|
| £’000 | £’000 | |
| Within one year | – | 405 |
| In the second to fifth years inclusive | – | – |
| After five years | 1,021 | 1,021 |
| Income due from tenants | – | (65) |
| 1,021 | 1,361 |
Operating lease payments represent rentals payable by Land Registry for land and buildings, including the Nottingham and Peterborough local offices.
Leases as lessor
Land Registry leases out investment properties, see note 8.4.
At 31 March 2016 the future minimum lease payments under non-cancellable leases are receivable as follows: operating leases, which fall due as follows:
| 2016 | 2015 | |
|---|---|---|
| £’000 | £’000 | |
| Within one year | – | – |
| In the second to fifth years inclusive | 18 | – |
| After five years | 349 | – |
| 367 | – |
During the year investment property rental income of £0.55 million was included within miscellaneous income (see note 3.1). This follows the treatment of previous years when the properties were let under memorandum of terms of occupation (MOTO) to other public sector organisations. The investment properties are now let on commercial terms. As this is not part of Land Registry’s core business, and the values are immaterial, the rental income continues to be treated as miscellaneous income and netted off expenditure.
15. Loans
Land Registry had no loans during the financial year ending 31 March 2016.
16. Provisions for liabilities and charges
16.1 Early release schemes and other
| Early retirement | Early severance | Progression pay buy out | Other | Total | Early retirement | Early severance | Progressionpay buy out | Other | Total | |
|---|---|---|---|---|---|---|---|---|---|---|
| 2016 | 2015 | |||||||||
| £’000 | £’000 | £’000 | £’000 | £’000 | £’000 | £’000 | £’000 | £’000 | £’000 | |
| At 1 April 2015 | 18,005 | 2,272 | 845 | 361 | 21,483 | 22,789 | 726 | – | 1,966 | 25,481 |
| Revaluation of provision | 228 | – | – | 1,848 | 2,076 | 588 | 2,272 | 845 | 125 | 3,830 |
| Provision utilised in the year | (4,550) | (2,242) | (831) | (86) | (7,709) | (5,372) | (726) | – | (1,160) | (7,258) |
| Provision written back unused | – | (30) | (14) | (274) | (318) | – | – | – | (570) | (570) |
| At 31 March 2016 | 13,683 | – | – | 1,849 | 15,532 | 18,005 | 2,272 | 845 | 361 | 21,483 |
| Included in current liabilities | 8,116 | 10,218 | ||||||||
| Included in non-current liabilities | 7,416 | 11,265 | ||||||||
| 15,532 | 21,483 |
The early retirement provision (ERP) gives retirement benefits to certain employees. These benefits conform to the rules of the Principal Civil Service Pension Scheme (PCSPS). Land Registry bears the cost of these benefits until the normal retirement age of the employees retired under the scheme. Total payments in the year amounted to £4.6 million in 2015/16, of which £4.6 million had been provided for within the ERP provision in the 2015/16 accounts. The total pension liability up to normal retiring age in respect of each employee is charged to the statement of comprehensive income in the year in which the employee takes early retirement and a provision for future pension payments is created. Pension and related benefit payments to the retired employee until normal retiring age are then charged annually against the provision.
The early severance provision was set up to provide for the cost of those members of staff leaving Land Registry under the terms of a formal early departure programme in place as at 31 March 2015. Total payments in the year amounted to £2.3 million in 2015/16, of which £2.2 million had been provided for within the ERP provision in the 2015/16 accounts.
IAS 37 Provisions, contingent liabilities and contingent assets requires that: “Where the time value of money is material, the amount of a provision should be the present value of the expenditures expected to be required to settle the obligation”. The discount factor applied to the early retirement provision over 10 years is 2.0%. The impact of unwinding of the discount in 2015/16 was £0.2 million (2014/15: £0.5 million).
Included within ‘Other’ is an amount of £1.2 million payable to Her Majesty’s Revenue & Customs (HMRC) following a tax compliance audit. The timing and final value are yet to be agreed.
16.2 Indemnity Fund
The Land Registration Act 2002 places a legal liability on Land Registry to indemnify for losses resulting from errors or omissions on the register of title. This includes errors resulting from frauds perpetrated by third parties. As a statutory insurer of titles in England and Wales, indemnity payments are not confined to mistakes made by Land Registry. Land Registry provides for these claims under its Indemnity Fund both for known claims and claims incurred but not reported (IBNR).
| Outstanding provision | IBNR provision | 2016 Total | Outstanding provision | IBNR provision | 2015 Total | |
|---|---|---|---|---|---|---|
| £’000 | £’000 | £’000 | £’000 | £’000 | £’000 | |
| At 1 April | 8,400 | 65,200 | 73,600 | 11,200 | 53,700 | 64,900 |
| Provided in the year | 8,135 | – | 8,135 | 8,130 | – | 8,130 |
| Provisions utilised in the year | (8,135) | – | (8,135) | (8,130) | – | (8,130) |
| Claims revaluation | 2,100 | – | 2,100 | (2,800) | – | (2,800) |
| IBNR revaluation | – | 9,100 | 9,100 | – | 11,500 | 11,500 |
| At 31 March | 10,500 | 74,300 | 84,800 | 8,400 | 65,200 | 73,600 |
Following the actuarial review by Lane Clark & Peacock (LCP), the fund in respect of reported but not settled claims (Outstanding provision) has increased in 2015/16 by £2.1 million (2014/15: £2.8 million decrease). The provision for claims incurred but not reported (IBNR provision) has increased in 2015/16 by £9.1 million (2014/15: £11.5 million increase).
The main reasons for the £9.1 million movement were a change in the HM Treasury prescribed discount rate (increase – £14.9 million) and changes to LCP’s projection assumptions in the light of emerging patterns of claims experience (decrease – £6.7 million).
The Outstanding provision for claims received but not yet settled is an estimate and as it involves projecting future payments, the final amounts paid on these claims is uncertain. The main uncertainties are:
-
the proportion of outstanding claims that will ultimately be paid
-
the value of the payments made
-
the effect of any legal judgements
The presence of large outstanding claims can add significantly to this uncertainty.
The IBNR provision is greater and inherently more uncertain than the Outstanding provision. Unlike the Outstanding provision, which is based on existing claims information, the IBNR provision covers potential claims that may be made as a result of errors that have already been introduced into the register as a result of day-to-day update activity (either through fraud and forgery or administrative error). The main uncertainties within the IBNR provision are:
-
the number of unreported errors currently within the register is unknown
-
at what point in the future these errors will be discovered and claims made
-
how much the cost of the corresponding claims will be
Claims can take many years to be reported and subsequently settled.
In estimating the IBNR provision, the actuaries project the number and timing of future claim reports and average claim sizes, using assumptions about claims settlement patterns, the expected effects of any known legal judgements and claims inflation. The resulting projected future claims cash flows are then discounted to a net present value at the accounting date using Treasury prescribed discount rates.
The assumptions used in the projections are based on analysis of historical claims data, allowance for recent trends and consideration of the potential effects of underlying factors such as the volume of Land Registry activity and numbers of registered titles. We provide input to the actuaries on these assumptions, based on the knowledge of the legal team that handles the claims.
Uncertainty in the provisions – sensitivity analysis
The value of the Indemnity Fund provisions are subject to future uncertain final settlement value, both for known claims and claims incurred but not reported (IBNR). The uncertainty in value of outstanding claims could lead to a variation in the proposed provision. A range of scenarios have been considered in respect of the assumptions on:
-
the number of claims that will be received
-
the average claim size
-
the percentage of claim values paid on settlement (small and large)
-
the proportion of claims that are ‘large’ (Outstanding and IBNR)
-
the rate of inflation and expected discount rates.
These scenarios have been considered in isolation and combination as shown in the tables Sensitivity analysis.
On the basis of this analysis work and in respect of the adverse scenarios:
-
it is reasonably foreseeable that the value of liabilities could be about £0.5 million (Outstanding provision) or £8 million (IBNR provision) greater than expected
-
it is unlikely, but possible, that the value of the liabilities could be about £1.5 million (Outstanding provision) or £15 million (IBNR provision) greater than expected.
In respect of the favourable scenarios:
- it is reasonably foreseeable that the value of the liabilities could be about £8 million (IBNR) lower than expected.
By their nature, these figures are not precise and they can only illustrate the magnitude of uncertainty involved.
We have also considered extreme scenarios, where the value of liabilities is as much as £2.5 million (Outstanding provision) or £55 million (IBNR provision) greater than expected. The long-term open-ended nature of statutory indemnity means that these figures do not represent the maximum possible liability. However, we believe the likelihood of such scenarios to be small.
The degree of uncertainty at future accounting dates may be different from that illustrated here. This could be for a number of reasons, for example because the profile of claims has changed or because the outlook on future claim trends has changed.
At future accounting dates, it should be expected that:
-
the outstanding provision will fluctuate depending on the volume of claims reported at the time, especially large claims
-
all else being equal the IBNR provision will increase over time because of inflationary forces
-
both the Outstanding provision and the IBNR provision will be particularly sensitive to the number and value of fraud and forgery claims as these are the most financially significant category of claims.
The Indemnity Fund provision of £84.8 million is our best estimate. However, the value of the Indemnity Fund provisions are subject to future uncertainty.
Sensitivity analysis
| Outstandingprovision | 2016 Percentage movement increase | |
|---|---|---|
| £m | % | |
| Provided in these accounts see note 16.2 – reasonably foreseeable value | 10.5 | – |
| Impact of scenarios | ||
| Adverse but foreseeable scenarios | ||
| (1) Large claims assumed payment percentage increased from 60% to 70% | 10.9 | 3.9 |
| (2) Attritional claims paid are 5% greater than expected | 10.9 | 4.5 |
| (3) Treasury prescribed real discount rate reduces further by 0.5% pa | 10.6 | 1.0 |
| Possible but unlikely scenarios | ||
| (2) + (3) | 11.0 | 5.5 |
| (4) Large claims assumed payment increased from 60% to 100% | 12.1 | 15.8 |
| Extreme scenarios | ||
| (2) + (3) + (4) | 12.7 | 21.4 |
| IBNRprovision | Percentage movementincrease | |
| £m | % | |
| Provided in these accounts see note 16.2 – reasonably foreseeable value | 74.3 | – |
| Impact of scenarios | ||
| Favourable but foreseeable scenarios | ||
| (1) Decrease in projected number of attritional IBNR claims (-10%) | 70.2 | -5.5 |
| (2) Decrease in assumed attritional average claim size (-10%) | 70.2 | -5.5 |
| (3) Decrease in assumed large average claim size (from £680k to £580k) | 69.5 | -6.5 |
| (4) Decrease in projected number of large claims (from 6.5 to 5.5 per incident year) | 69.3 | -6.8 |
| (5) Decrease in assumed future claims inflation (-1% pa) | 66.7 | -10.2 |
| (6) Prescribed real discount rate on cashflows beyond 10 years increased by 1% pa | 68.8 | -7.4 |
| Adverse but foreseeable scenarios | ||
| (1) Increase in projected number of attritional IBNR claims (+10%) | 78.4 | 5.5 |
| (2) Increase in assumed attritional average claim size (+10%) | 78.4 | 5.5 |
| (3) Increase in assumed large average claim size (from 680k to 780k) | 79.1 | 6.5 |
| (4) Increase in projected number of large claims (from 6.5 to 7.5 per incident year) | 79.3 | 6.8 |
| (5) Increase in assumed future claims inflation (+1%) | 82.7 | 11.2 |
| (6) Prescribed real discount rate on cash flows beyond 10 years reduced by a further 1% pa | 81.2 | 9.2 |
| Possible but unlikely scenarios | ||
| (1) + (2) | 82.9 | 11.5 |
| (1) + (5) | 87.2 | 17.3 |
| (7) Increase in assumed large average claim size (from £680k to £980k) | 88.7 | 19.4 |
| Extreme scenarios | ||
| (1) + (2) + (4) + (5) + (6) + (7) | 128.7 | 73.2 |
17. Capital commitments
| 2016 | 2015 | |
|---|---|---|
| £’000 | £’000 | |
| Capital expenditure | ||
| Contracted for but not provided in these accounts | – | 779 |
18. Contingent liabilities
18.1 Indemnity
The Land Registration Act 2002 places a legal liability on Land Registry to indemnify for losses resulting from errors or omissions on the register of title. This includes errors resulting from frauds perpetrated by third parties. As a statutory insurer of titles in England and Wales, indemnity payments are not confined to mistakes made by Land Registry. Land Registry provides for these claims under its Indemnity Fund both for known claims and claims incurred but not reported (IBNR), see note 16.2, based on the assumed likelihood that claims will be successful.
As at 31 March 2016, the value of pending indemnity claims made to Land Registry is shown below. Included in this total is an amount of £10.5 million provided in the Indemnity Fund provision, see note 16.2.
Errors or omissions
| 2016 | 2015 | |
|---|---|---|
| £’000 | £’000 | |
| Mistakes | 10,337 | 3,828 |
| Fraud and forgery | 11,769 | 13,410 |
| 22,106 | 17,238 |
18.2 Other
The Land Registry property at Chalfont Drive, Nottingham, includes a former Regional Seat of Government (commonly referred to as the ‘bunker’). This property was previously classified as an asset held for sale and reference to a contingent liability was made in the 2014/15 financial statements. In 2015/16 the property has been reclassified as a non-current asset as there is no immediate prospect of sale.
The contingent liability in 2014/15 was for the estimated cost of remedial works. The current plan for this site does not involve remedial work, therefore there is no contingent liability in 2015/16.
19. Notes to the cash flow statement
19.1 Reconciliation of operating surplus to net cash inflow from operating activities
| 2016 | 2015 | |
|---|---|---|
| £’000 | £’000 | |
| Operating surplus | 41,188 | 47,541 |
| Restructure and reorganisation costs | (1,458) | (5,347) |
| LLC development costs | (2,265) | (3,028) |
| Depreciation of property, plant and equipment | 5,229 | 6,123 |
| Amortisation of intangible assets | 338 | 514 |
| Impairment in value of non-current assets | 6,466 | 1,125 |
| Decrease in provisions | (5,952) | (3,999) |
| Increase in inventories | (2,256) | (874) |
| (Increase)/decrease in receivables | (246) | 2,039 |
| Increase in payables | 3,429 | 5,138 |
| Increase in Indemnity Fund | 11,200 | 8,700 |
| Net cash inflow from operating activities | 55,673 | 57,932 |
19.2 Reconciliation of net cash flow to movement in net cash
| 2016 | 2015 | |
|---|---|---|
| £’000 | £’000 | |
| Net cash at start of period | 397,752 | 464,639 |
| Increase/(decrease) in cash in the period | 46,119 | (66,887) |
| Net cash at end of period | 443,871 | 397,752 |
20. Related party disclosures
In accordance with IAS 24 Related party disclosures, as interpreted by the FReM, the following information is provided on related party transactions.
Land Registry is an executive agency, trading fund and government department. During the year it has had a number of material transactions with other government departments and other central government bodies. Most of these transactions have been with Ordnance Survey, HM Courts & Tribunals and the Department for Communities and Local Government.
None of the board members, or members of the key management staff or other related parties, have had any influence over any material transactions undertaken by Land Registry.
Craig Lester, who joined the Land Registry Board as Assistant Chief Executive on 11 January 2016, was a non-executive director at Ordnance Survey prior to taking up his position at Land Registry. The contract for the provision of survey and data services with Ordnance Survey began in 2013 and will run until 2023. He was not a director at Ordnance Survey at the onset of this contract and therefore was not in a position to influence contract negotiations.
21. Corporate financial targets
| 2016 | 2015 | |||
|---|---|---|---|---|
| Actual | Target | Actual | Target | |
| % | % | % | % | |
| Percentage return on average capital employed | 8.6 | 3.6 | 8.5 | 4.6 |
22. Financial instruments
IFRS 7 Financial instruments: disclosures requires disclosure of the role financial instruments have had during the period in creating or changing the risks an entity faces in undertaking its activities.
Land Registry has no borrowings and relies primarily
on income from statutory activities and is therefore not exposed to liquidity risks. Material deposits are held with the Government Banking Service and the National Loans Fund.
As all material assets and liabilities are denominated in sterling Land Registry is not exposed to currency risk.
23. Events after the reporting period
In accordance with the requirements of IAS 10 Events after the reporting period, events after the statement of financial position date are considered up to the date on which the accounts are authorised for issue. This is interpreted as the date of the certificate and report of the Comptroller and Auditor General.
Non-adjusting event after the reporting period
The result of the referendum held on 23 June was in favour of the UK leaving the European Union. This is a non-adjusting event. A reasonable estimate of the financial effect of this event cannot be made.
There are no other non-adjusting events after the reporting period.
Appendix A: Volumes and workloads 2015/16 and 2014/15
| Application intake by type and method of receipt | ||||||
|---|---|---|---|---|---|---|
| 2015/16 | 2014/15 | |||||
| Total applications/products received | Applications/products received through online services | % of applications/products received through online services | Total applications/products received | Applications/products received through online services | % of applications/products received through online services | |
| Total applications/products | 30,372,360 | 28,224,225 | 92.9 | 28,569,636 | 25,005,653 | 87.5 |
| Bulk register updates (BRUs) | 352,348 | – | – | 1,157,728 | – | – |
| Total applications exc. BRUs | 30,020,012 | 28,224,225 | 94.0 | 27,411,908 | 25,005,653 | 91.2 |
| Substantive applications exc. BRUs | 4,721,574 | 3,926,879 | 83.2 | 4,724,245 | 3,431,087 | 72.6 |
| Preliminary services products | 17,096,106 | 16,898,741 | 98.8 | 15,890,630 | 15,580,001 | 98.0 |
| Enquiry services applications | 8,202,332 | 7,398,605 | 90.2 | 6,797,033 | 5,994,565 | 88.2 |
| 30,020,012 | 28,224,225 | 94.0 | 27,411,908 | 25,005,653 | 91.2 | |
| Substantive applications exc. BRUs | ||||||
| First registrations | 111,309 | – | – | 120,298 | – | – |
| Dispositionary first leases | 224,529 | 175,592 | 78.2 | 207,087 | 100,234 | 48.4 |
| Transfers of part of registered land | 170,108 | 129,046 | 75.9 | 158,076 | 84,779 | 53.6 |
| Dealings of whole with registered land | 4,215,628 | 3,622,241 | 85.9 | 4,238,784 | 3,246,074 | 76.6 |
| 4,721,574 | 3,926,879 | 83.2 | 4,724,245 | 3,431,087 | 72.6 | |
| Preliminary services products | ||||||
| Official copies1 | 13,882,149 | 13,760,713 | 99.1 | 12,644,809 | 12,493,672 | 98.8 |
| Official searches | 2,424,335 | 2,409,063 | 99.4 | 2,240,834 | 2,196,134 | 98.0 |
| Official searches of the index map1 | 789,622 | 728,965 | 92.3 | 1,004,987 | 890,195 | 88.6 |
| 17,096,106 | 16,898,741 | 98.8 | 15,890,630 | 15,580,001 | 98.0 | |
| Enquiry services applications | ||||||
| Register views | 5,325,027 | 5,325,027 | 100.0 | 4,873,717 | 4,873,717 | 100.0 |
| Title plan views | 957,449 | 957,449 | 100.0 | 884,241 | 884,241 | 100.0 |
| Document views | 73,125 | 73,125 | 100.0 | 76,520 | 76,520 | 100.0 |
| Correspondence | 334,762 | 214,026 | 63.9 | 283,428 | 160,087 | 56.5 |
| Telephone enquiries | 682,991 | – | – | 679,127 | – | – |
| MapSearch PDF downloads | 828,978 | 828,978 | 100.0 | – | – | – |
| 8,202,332 | 7,398,605 | 90.2 | 6,797,033 | 5,994,565 | 88.2 |
The table above sets out the transactional activities for the year, along with comparatives for the previous year. In this financial year we serviced more than 30 million applications, fulfilling the requirements of the 2002 Land Registration Act. These form the core of our activities and the revenues associated with them. The table also details our progress towards electronic delivery, in relation to the various types of application we receive. Excluding bulk register updates (BRUs), the proportion of applications received electronically rose from 91.2% to 94%.
Bulk register updates are groups of applications lodged at Land Registry affecting a large volume of registered titles, such as a bank changing the address for service on all of its registered charges. The levels of receipt of such applications are volatile in their nature and are therefore separated from other application types in order to avoid distortion of the data.
Note: An official copy application may result in more than one register and/or title plan being supplied. A search of the index map application may give rise to more than one title number being revealed. For this reason the number of registers/title plans or the number of title numbers revealed are used as a metric rather than the number of applications themselves. These are termed products.
Appendix B: Land Charges and Agricultural Credits volumes and workloads 2015/16 and 2014/15
The Land Charges Department
The Land Charges Department operates under the authority of the Land Charges Act 1972.
The department maintains registers of Land Charges, pending actions, writs and orders affecting land and other encumbrances registered against the names of owners of property, which are not registered under the Land Registration Acts. The department also maintains the Index of Proprietors Names (IOPN). This index can be searched against only on production of the appropriate authority and is used to establish whether any property assets are held against individuals or companies.
Some elements of customer accounts are also managed in the Land Charges Department.
| Type of application | Number of applications or names in 2015/16 | Percentage variation compared with 2014/15 |
|---|---|---|
| New registrations, rectifications and renewals | 42,572 | -20.54 |
| Cancellations | 8,671 | -14.76 |
| Official searches | ||
| – Full searches | 172,098 | -2.23 |
| – Searches limited to insolvency | 1,511,711 | +9.96 |
| Office copies | 25,490 | -4.08 |
| Total | 1,760,542 | +7.28 |
The Agricultural Credits Department
The Agricultural Credits Department is responsible for maintaining a register of short-term loans by banks under Part ll of the Agricultural Credits Act 1928. These charges are secured on farming stock and other agricultural assets of the farmer.
| Year | New registrations | Cancellations and rectifications | Searches | Total |
|---|---|---|---|---|
| 2007/8 | 1,267 | 808 | 4,269 | 6,344 |
| 2008/9 | 1,159 | 917 | 4,120 | 6,196 |
| 2009/10 | 917 | 737 | 3,405 | 5,059 |
| 2010/11 | 737 | 1,153 | 2,688 | 4,578 |
| 2011/12 | 840 | 1,086 | 2,689 | 4,615 |
| 2012/13 | 645 | 1,006 | 3,686 | 5,337 |
| 2013/14 | 772 | 943 | 2,552 | 4,267 |
| 2014/15 | 796 | 810 | 2,551 | 4,157 |
| 2015/16 | 857 | 820 | 2,541 | 4,218 |
Appendix C: Response to the economic climate
This graph summarises performance over five financial years.
Land Registry retained surplus/deficit from 2011/12
£’000
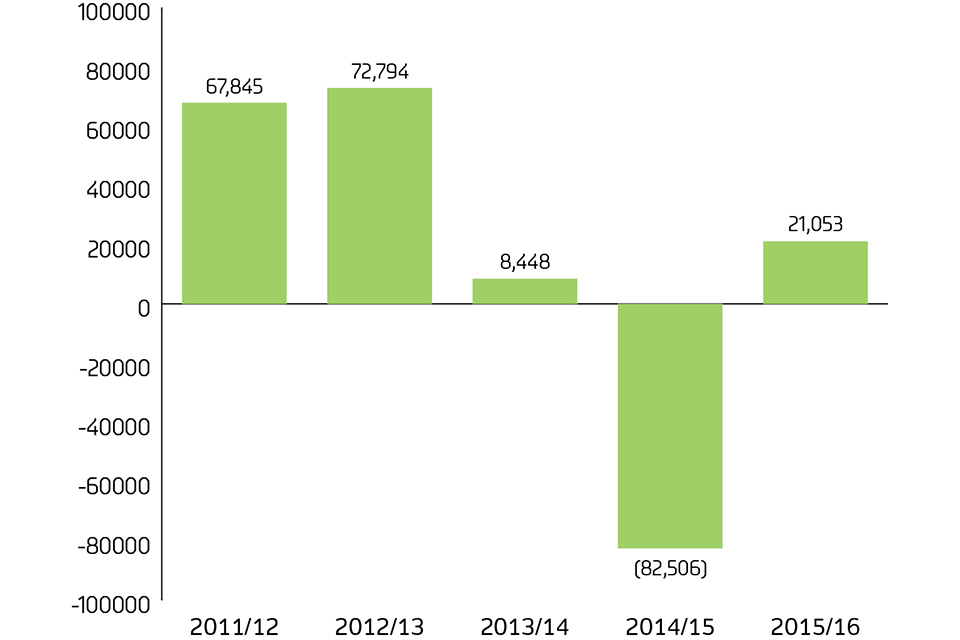
retained surplus
Notes:
-
The initial IBNR provision of £45.9 million is excluded from 2011/12 business running costs in this chart, but for subsequent years the movement in the provision is included
-
In line with the Business Strategy there were two additional exceptional dividends of £100 million paid in 2013/14 and 2014/15
Land Registry business running costs from 2011/12
£’000
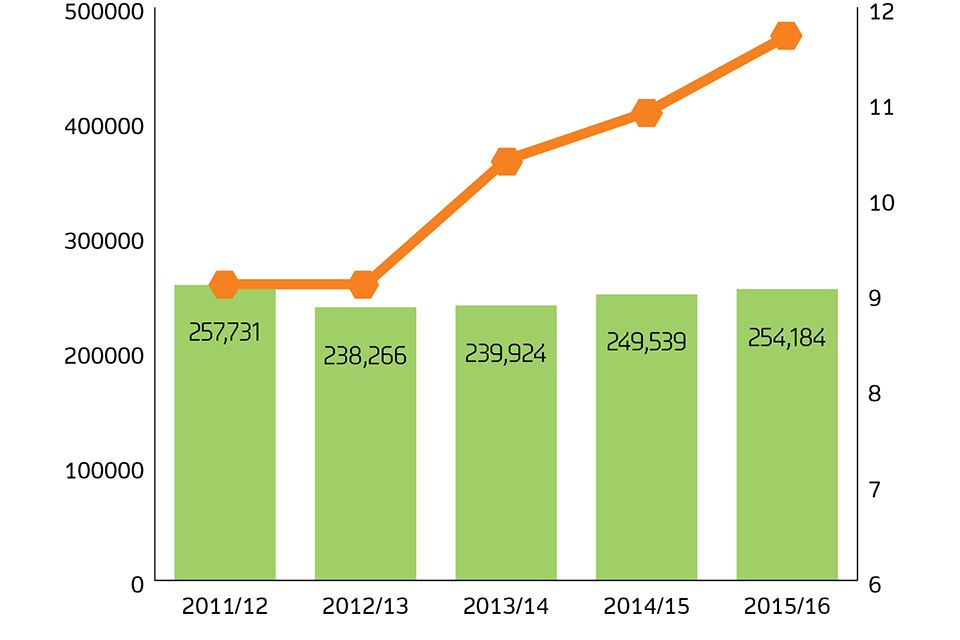
running costs
Notes:
-
The initial IBNR provision of £45.9 million is excluded from 2011/12 business running costs, in this chart, but for subsequent years the movement in the provision is included
-
In 2015/16 there were impairment costs of £6.5 million
-
In 2015/16 indemnity and IBNR increased by £11.2 million
-
These figures include inflation
Income statements: five years to 2015/16
| (Re-stated) | ||||||
|---|---|---|---|---|---|---|
| 2011/12 | 2012/13 | 2013/14 | 2014/15 | 2015/16 | Five year | |
| £’000 | £’000 | £’000 | £’000 | £’000 | £’000 | |
| Fee income continuing operations | 359,338 | 347,157 | 381,278 | 297,080 | 295,372 | 1,680,225 |
| Cost of service | (289,909) | (227,751) | (227,871) | (236,571) | (238,591) | (1,220,693) |
| Gross surplus/(deficit) | 69,429 | 119,406 | 153,407 | 60,509 | 56,781 | 459,532 |
| Administrative expenses | (13,722) | (10,515) | (12,053) | (12,968) | (15,593) | (64,851) |
| Operating surplus/(deficit) | 55,707 | 108,891 | 141,354 | 47,541 | 41,188 | 394,681 |
| Profit/(loss) on disposals of non-current assets | 5,170 | 3,913 | 66 | (10) | (431) | 8,708 |
| Investment income – interest receivable | 1,170 | 1,468 | 1,622 | 1,881 | 1,774 | 7,915 |
| Finance costs | (878) | (936) | (953) | (899) | (702) | (4,368) |
| Amortisation and depreciation of e-service systems | (4,448) | (4,053) | (5,357) | (3,530) | (3,469) | (20,857) |
| Restructure reorganisation costs | (21,000) | (10,529) | (1,630) | (5,347) | (1,458) | (39,964) |
| Development costs | – | – | – | (3,028) | (2,265) | (5,293) |
| Surplus/(deficit) for the financial year | 35,721 | 98,754 | 135,102 | 36,608 | 34,637 | 340,822 |
| Dividend payable | (13,776) | (25,960) | (126,654) | (119,114) | (13,584) | (299,088) |
| Retained surplus/(deficit) for the year | 21,945 | 72,794 | 8,448 | (82,506) | 21,053 | 41,734 |
| Gain/(loss) on revaluation of property, plant and equipment | (1,608) | 3,363 | 1,373 | (1,074) | (7,817) | (5,763) |
| Comprehensive surplus/(deficit) for the financial year | 20,337 | 76,157 | 9,821 | (83,580) | 13,236 | 35,971 |
| Full-time equivalent staff (average for the financial year) | 4,588 | 4,325 | 4,042 | 4,033 | 4,035 |
Notes:
- 2011/12: re-stated in 2012/13 with prior year adjustments for change in policy to recognise incurred but not reported indemnity claims.
- 2013/14: special dividend of £100 million included in dividend per new Business Strategy.
- 2014/15: special dividend of £100 million included in dividend per new Business Strategy.
Appendix D: Treasury Minute
HM Land Registry Trading Fund
HM Treasury Minute dated 24 April 2012
- Section 4(1) of the Government Trading Funds Act 1973 (“the 1973 Act”) provides that a Trading Fund established under that Act shall be under the control and management of the responsible Minister (or, where a Trading Fund is established for operations carried on by a person appointed in pursuance of any enactment, that person, if the Order establishing the Trading Fund in accordance with section 1(6) (a) of the 1973 Act) and in the discharge of his functions in relation to the fund it shall be his duty:
(a) To manage the funded operations so that the revenue of the fund:
(i) Consists principally of receipts in respect of goods and services provided in the course of the funded operations, and
(ii) is not less than sufficient, taking one year with another, to meet outgoings which are properly chargeable to revenue account; and
(b) To achieve such further financial objectives as the Treasury may from time to time, by minute laid before the House of Commons, indicate as having been determined by the responsible Minister (with Treasury concurrence) to be desirable of achievement.
2. The Trading Fund for HM Land Registry was established on 1 April 1993 under the Land Registry Trading Fund Order 1993 (SI 1993 No. 938). Article 3 (2) of that Order provides that the Trading Fund shall be under the control and management of the Chief Land Registrar. Additional assets were appropriated to the Trading Fund on 11 March 1996 under the Land Registry Trading Fund (Additional Assets) Order 1996 (SI 1996 No. 750). On 13 October 2003, the Trading Fund was extended and amended under the Land Registry Trading Fund (Extension and Amendment) Order 2003 (SI 2003 No. 2094).
3. The Secretary of State for the Department of Business, Innovation and Skills, being the responsible Minister for the purposes of section 4(1)(b) of the 1973 Act, has determined (with Treasury concurrence) that a further financial objective desirable of achievement by HM Land Registry to achieve, over the period from 1 April 2012 to 31 March 2017, a return, averaged over the period as a whole, of at least 3.5% real (see note 1) in accordance with Managing Public Money. This will take the form of an operating surplus on ordinary activities post exceptional items and interest (payable and receivable), but before dividends, expressed as a percentage of average capital employed. Capital employed shall equate to the total assets from which shall be deducted the total liabilities.
4. This Minute supersedes that dated 15 December 2003.
5. Let a copy of this Minute be laid before the House of Commons pursuant to section 4(1)(b) of the Government Trading Funds Act 1973.
Note 1:
3.5% real will be calculated annually as 3.5% plus the latest inflation estimate for that year, provided by ONS. By way of a worked example, for the fiscal year 2012/13 the financial target will be 6.29%. This has been calculated as (1+3.5%)* (1+ 2.7%), where 2.7% is the ONS 2012/13 inflation estimate (National Accounts figures from the ONS, 22 December 2011).
HM Treasury
24 April 2012
Appendix E: Sustainability historical data
Carbon data in tonnes
| Year | Year on year waste target | Actual waste | Actual percentage reduction over baseline |
|---|---|---|---|
| 2009/10 (baseline) | 14,327 | 14,327 | 0 |
| 2010/11 | 13,610 | 13,099 | -9 |
| 2011/12 | 12,894 | 11,211 | -22 |
| 2012/13 | 12,178 | 11,340 | -21 |
| 2013/14 | 11,461 | 9,128 | -36 |
| 2014/15 | 10,745 | 8,656 | -40 |
| 2015/16 | 9,885 | 8,392 | -41 |
The greenhouse gas draft target is to reduce emissions by 31% by March 2020 over the baseline data for 2009/10.
Gross emissions have reduced by 41% over the baseline and by 3% over the previous year.
Waste arising in tonnes
| Year | Year on year waste target | Actual waste | Actual percentage reduction over baseline |
|---|---|---|---|
| 2009/10 (baseline) | 1,979 | 1,979 | 0 |
| 2010/11 | 1,880 | 1,443 | -27 |
| 2011/12 | 1,781 | 1,689 | -15 |
| 2012/13 | 1,682 | 1,421 | -28 |
| 2013/14 | 1,583 | 959 | -52 |
| 2014/15 | 1,484 | 907 | -54 |
| 2015/16 | 1,484 | 1,106 | -44 |
The table shows the trend for waste arising against the Greening Government Commitments reduction target of 25% by March 2020. A 54% reduction was achieved. Of the waste arising 698 tonnes is paper sent for processing through the closed loop paper recycling provision within government. This paper equates to 70% of our total waste arising.
Water reduction in cubic metres
| Year | Year on year water target | Actual water | Actual percentage reduction over baseline |
|---|---|---|---|
| 2009/10 (baseline) | 57,214 | 57,214 | 0 |
| 2010/11 | 54,353 | 54,644 | -4 |
| 2011/12 | 51,493 | 37,413 | -35 |
| 2012/13 | 48,632 | 31,230 | -45 |
| 2013/14 | 45,771 | 36,037 | -37 |
| 2014/15 | 42,911 | 38,153 | -33 |
| 2015/16 | 42,911 | 36,396 | -36 |
A 36% reduction in water consumption has been achieved against a target of 25%. Consumption per FTE including staff on Land Registry sites from other government departments is 7.7m.
Appendix F: Summary of indemnity transactions 2015/16
| Nature of claim | Number of claims | Substantive loss (£) | Costs (£) | Percentage of total |
|---|---|---|---|---|
| Extent of registered titles | 142 | 354,397 | 206,045 | 7.0 |
| Errors in/omissions from register entries | 84 | 879,250 | 283,979 | 14.5 |
| Sundry plans errors | 7 | – | 11,446 | 0.1 |
| Fraud and forgery | 49 | 5,086,260 | 837,098 | 73.9 |
| Official inspections of title plans | 9 | 98,400 | 12,060 | 1.4 |
| Bankruptcy errors | – | – | – | – |
| Official searches | 1 | 2,189 | – | |
| Official copies | 1 | 500 | 780 | – |
| Errors in searches of the index map (SIMs) | 6 | 500 | 5,445 | 0.1 |
| Errors in filed extracts | 230 | 133 | 42,935 | 0.5 |
| Lost documents/administrative errors | 474 | 20,128 | 179,253 | 2.5 |
| Land Charges errors | – | – | – | – |
| Total | 1,003 | 6,439,568 | 1,581,230 | 100.0 |
| Gross payment | £8,020,798 | |||
| Less sums recovered under our statutory right of recourse | £231,298 | |||
| Net indemnity | £7,789,500 |