How many people continue their stay in the UK?
Updated 22 August 2019

© Crown copyright 2019
This publication is licensed under the terms of the Open Government Licence v3.0 except where otherwise stated. To view this licence, visit nationalarchives.gov.uk/doc/open-government-licence/version/3 or write to the Information Policy Team, The National Archives, Kew, London TW9 4DU, or email: psi@nationalarchives.gov.uk.
Where we have identified any third party copyright information you will need to obtain permission from the copyright holders concerned.
This publication is available at https://www.gov.uk/government/statistics/immigration-statistics-year-ending-june-2019/how-many-people-continue-their-stay-in-the-uk
Back to ‘Immigration Statistics, year ending June 2019’ content page.
This is not the latest release. View latest release.
Data in this section relate to the year ending June 2019 and all comparisons are with the year ending June 2018, unless indicated otherwise.
This section contains data on:
- Decisions on applications for extensions of temporary stay in the UK from non-European Economic Area (EEA) nationals
- Decisions on applications for settlement from non-EEA nationals
- Residence documentation issued to EEA nationals and their family members
- Applications for British citizenship
The Home Office publishes high-level progress information on the EU Settlement Scheme through monthly Experimental Statistics, available on GOV.UK. A more detailed quarterly EU Settlement Scheme quarterly statistics, June 2019 was published for the first time on 22 August 2019.
1. Extension of temporary stay in the UK
There were 288,531 decisions on applications to extend a person’s stay (including dependants) in the year ending June 2019 for all reasons, 13% more than in the previous year.
Of these, 267,951 were grants, 14% more than the previous year, with a grant rate of 93%. Increases included those extending for:
- work reasons (up 20% to 95,507), which included increases in those extending into Skilled (Tier 2) work categories – in particular Tier 2 ‘Intra-Company Transfers’ (up 11,145 to 27,381) and Tier 2 ‘General’ (up 5,961 to 49,124)
- family reasons (up 16% to 104,644), which likely reflect the change to the family Immigration Rules requiring individuals to obtain extensions every 2.5 years
Table 1: Grants of extensions by reason and refusals
| Year ending | Total decisions | Total grants | Work | Study | Family1 | Other | Total refusals |
|---|---|---|---|---|---|---|---|
| June 2018 | 256,374 | 234,604 | 79,842 | 43,429 | 90,262 | 21,071 | 21,770 |
| June 2019 | 288,531 | 267,951 | 95,507 | 43,390 | 104,644 | 24,410 | 20,580 |
| Change (latest year) | 32,157 | 33,347 | 15,665 | -39 | 14,382 | 3,339 | -1,190 |
| % change | 13% | 14% | 20% | 0% | 16% | 16% | -5% |
Source:
Table note:
- The latest increases in family extensions are likely to reflect a longer residence eligibility period before it is possible to apply to stay in the UK permanently (settlement), and a requirement to complete further periods of temporary leave, both implemented under family Immigration Rules from 9 July 2012. The rules in place before 9 July 2012 allowed spouses to apply for settlement after completion of a single two year ‘probationary period’. Further details on the rule changes can be found in the user guide.
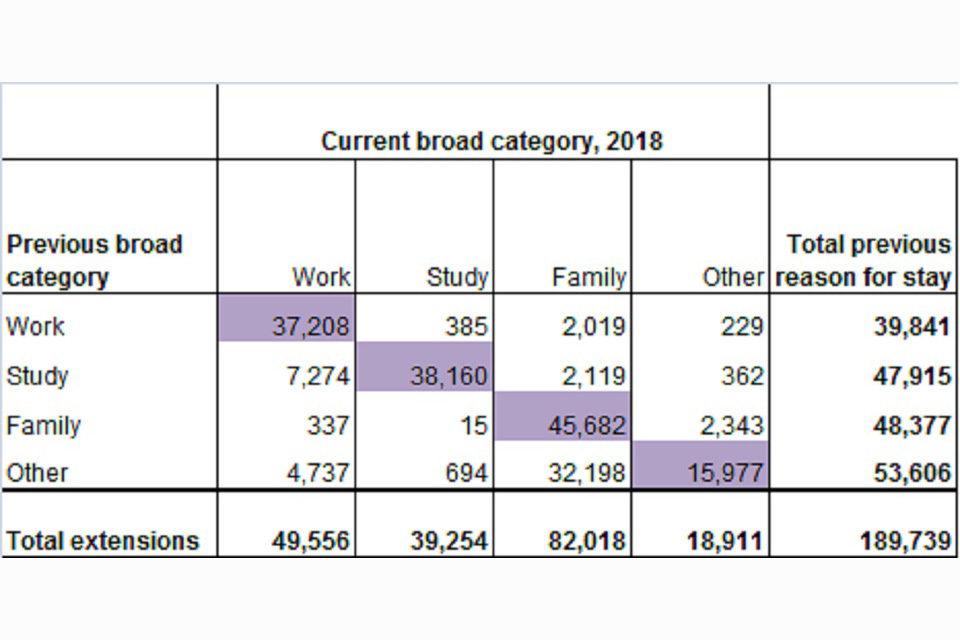
Data for 2018 (the latest for which data on extensions, broken down by previous reason for stay, are available) show 28% of those extending their stay switched from one broad category to another (for example, from study to work), while the rest remained within their existing broad category.
Table 2: Grants of extension of stay in 2018, current broad category compared with previous broad category
Not supplied by author.
Source:
Table ex pc 01 (Extensions tables).
Table note:
- Excludes dependants.
A more detailed commentary on extensions by previous category can be found in ‘Immigration statistics, year ending March 2019’.
Figure 1: Grants of extensions of stay1, by category
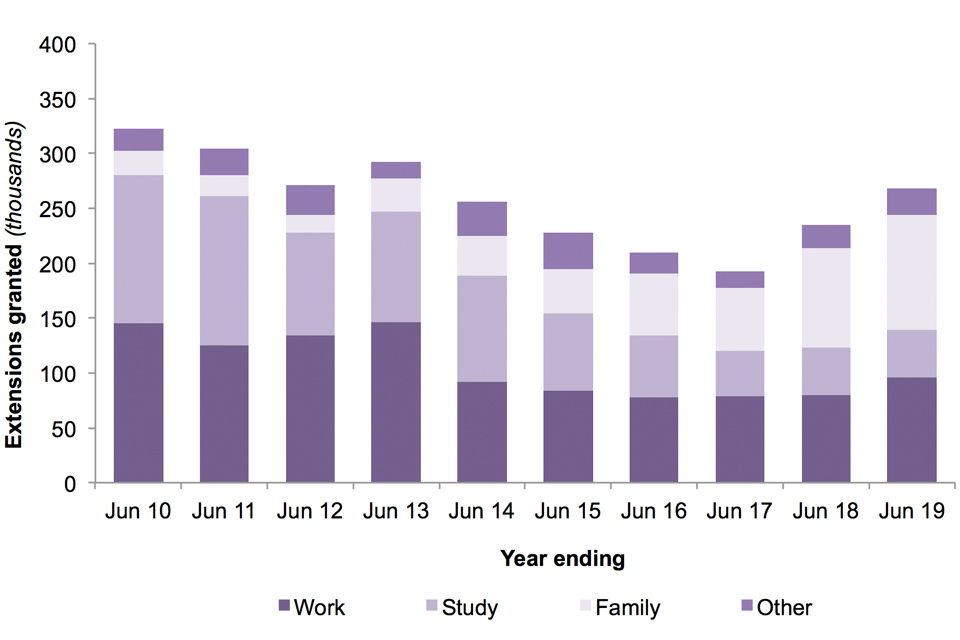
The chart shows the number of grants of an extension of stay by category over the last 10 years.
Source:
Table ex 01, (Extensions tables).
Chart note:
- New Family rules were introduced in July 2012 (see Statement of intent: Family Migration). As a result of these changes, people seeking to remain in the UK on the basis of their Family Life in compliance with Article 8 are included in the ‘family’ category from July 2012. Prior to this, such applications were considered under discretionary leave policy and included in the ‘Other’ category. Hence, data for the family and other categories from July 2012 are not fully comparable with earlier years.
In 2018 (the latest period for which data on extensions by nationality are available), the top five nationalities (led by Chinese and Indian nationals) accounted for over half (53%) of all extensions.
Chinese nationals typically extend into study routes (75% of Chinese extensions), whereas Indian nationals extend into work (56%) and family (33%) routes. Pakistani and Nigerian nationals commonly extend into family routes (68% and 60%, respectively).
Figure 2: Top 5 nationalities granted an extension of stay1 in 2018, by category
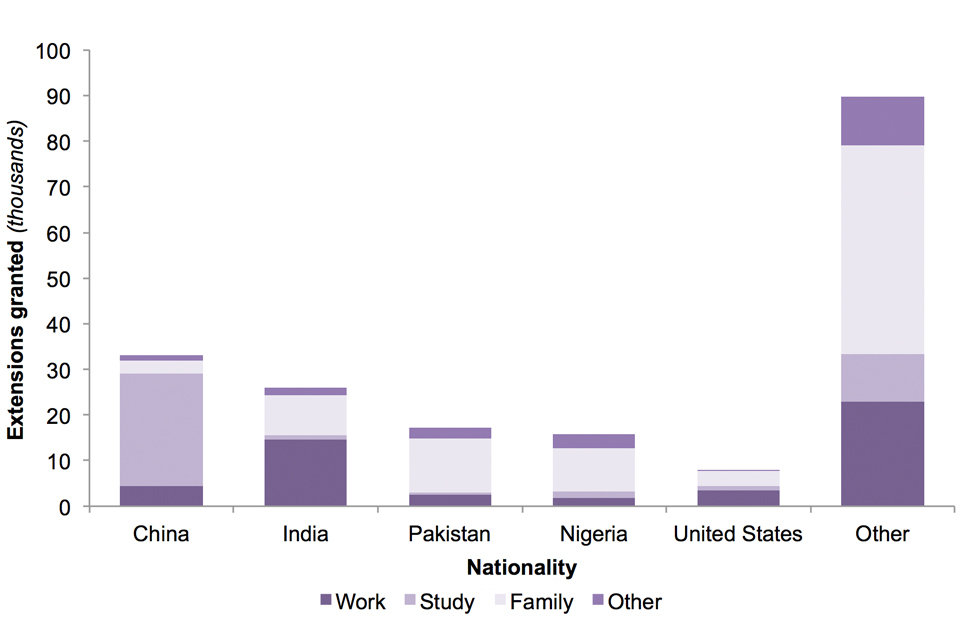
The chart shows the number of grants of extension of stay for each of the top 5 nationalities in 2018.
Source:
Table ex 02, (Extensions tables).
Chart note:
- Excludes dependants
1.1 Work-related extensions
There were 95,507 extensions in the work category in the year ending June 2019, an increase of 20% compared with the previous year. However, this is lower than the number seen in 2013. The fall in work-related grants of extensions from 2013 partly reflect the closure of Tier 1 ‘General’ and ‘Post-study’ routes which are now closed to new entrants. These falls have been partly offset by those extending in and into Tier 2 ‘Skilled’ work categories.
Data for 2018 (latest available) show that 75% of main applicants extending into work categories were previously on a work route, and 15% were previously on a study route.
Indian nationals were granted the highest number of work-related extensions in 2018 (14,590 or 29%, excluding dependants).
1.2 Study-related extensions
The number of study-related extensions granted over the last year has remained stable (43,390 in the year ending June 2019). This followed falls, from 100,470 in the year ending June 2013 and is likely to reflect previous falls in the number of study-related visas granted from the year ending June 2010 following the introduction of the Sponsorship system, together with tightening of the rules, such as the use of the ‘genuineness’ test. For further details see the Policy time line.
Data for 2018 (latest available) show that the vast majority (97%) of main applicants extending for study-related reasons were previously on the study route and are therefore extending their course of study or changing to another course.
The nationalities most likely to extend their stay in the UK are broadly consistent with the nationalities granted entry clearance visas, with nationals of China accounting for nearly two thirds (63% or 24,747) of study-related extensions granted (excluding dependants) in 2018.
1.3 Family-related extensions
Family-related grants of extensions have risen from 16,392 in the year ending June 2012 to 104,644 in the year ending June 2019. This increase reflects the introduction of the Family Life (10 year route) and a longer residence eligibility period before it is possible to apply to stay in the UK permanently (settlement). Individuals on family routes are required to obtain an extension every 2.5 years until they are eligible to apply for settlement. These changes were introduced as part of the new family Immigration Rules from 9 July 2012.
Data for 2018 (latest available) show that over half (56%) of main applicants extending for family-related reasons were previously on a family route, and 39% were previously on an ‘other’ route.
Pakistanis, Nigerians, Indians, Bangladeshis and Ghanaians accounted for nearly half (46%) of family-related extensions granted (excluding dependants) in 2018.
2. Settlement
There were 89,406 decisions on applications for settlement in the UK in the year ending June 2019, 4% more than in the previous year. Of these, 85,931 (96%) resulted in a grant. There were increases in settlement for:
- Family reasons (up 89% to 19,994), reflecting family rule changes in July 2012 that increased the qualifying period for settlement from 2 to 5 years. Individuals on a 5-year route to settlement following the rule change are now becoming eligible to apply (further information about the rules changes are available at: ‘Family and private life immigration rule changes 9 July 2012’)
- Skilled (Tier 2) work, up 53% (7,044) to 20,391 partly offset by a decrease in the ‘Permit-free employment, businessman, persons of independent means’ category down 76% (1,305) to 411
There were decreases in settlement:
- Following a grant of leave to stay following an asylum claim (down 35% to 16,533)
- To those previously in the UK for other reasons, primarily long residence or discretionary leave (down 12% to 21,491)
Table 3: Grants of settlement in the UK by reason and refusal1,2
| Year ending | Total decisions1 | Total grants | Work | Asylum | Family | Other2 | Refusals |
|---|---|---|---|---|---|---|---|
| June 2018 | 85,745 | 81,585 | 20,968 | 25,607 | 10,559 | 24,451 | 4,160 |
| June 2019 | 89,406 | 85,931 | 27,913 | 16,533 | 19,994 | 21,491 | 3,475 |
| Change: latest 12 months | +3,661 | +4,346 | +6,945 | -9,074 | +9,435 | -2,960 | -685 |
| Percentage change | +4% | +5% | +33% | -35% | +89% | -12% | -16% |
Source:
Table notes:
- The number of decisions in a given year can be affected by changes in casework resource allocation. Such fluctuations can be examined in more detail in the quarterly data that are available in the published Settlement tables.
- Includes grants on the basis of Long Residence and grants on a discretionary basis. Also includes a small number of cases where the category of grant has not been recorded.
Figure 3: Grants of settlement by qualifying category1
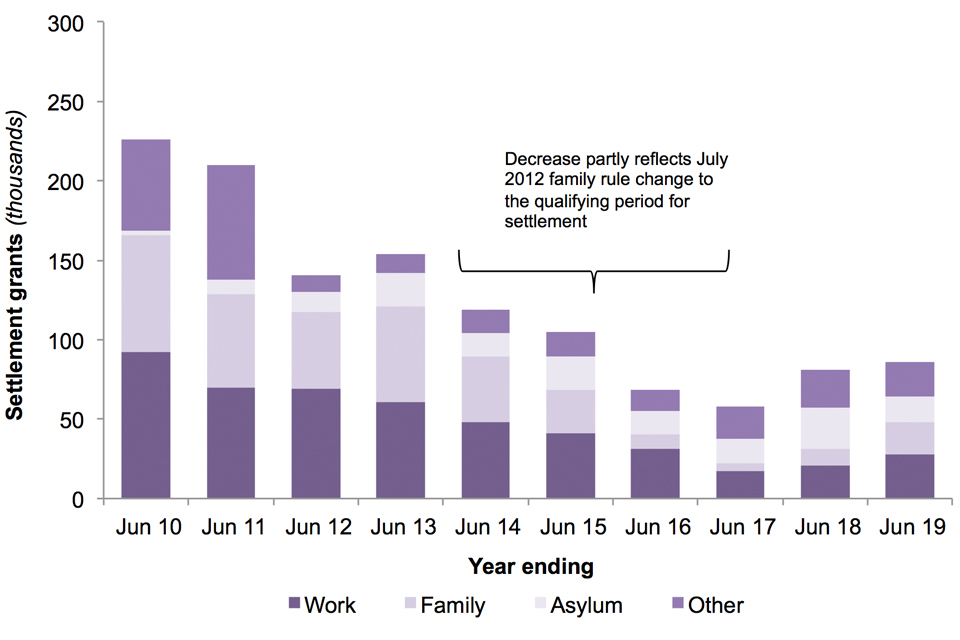
The chart shows the number of people granted settlement by reason over the last 10 years.
Source:
Chart note:
- Qualifying category relates to type of leave held immediately prior to being granted settlement.
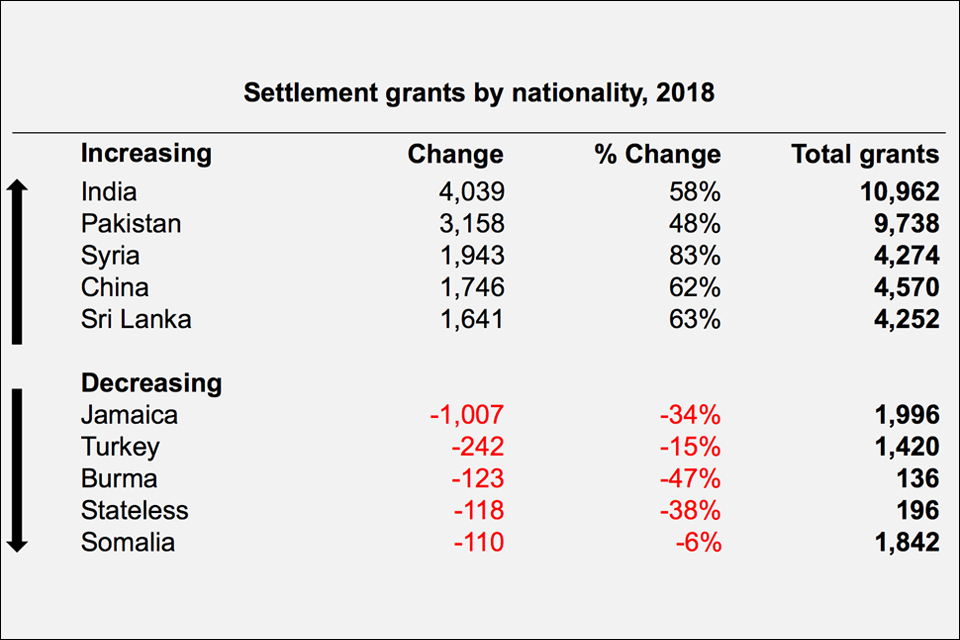
Of the total 91,298 grants of settlement in 2018 (the latest period for which data on settlement by nationality are available), 31% (28,086) were to nationals of South Asian countries and 22% (20,229) were to nationals of Sub-Saharan African countries.
The nationalities granted settlement in highest numbers in 2018 were:
- Indian (10,962)
- Pakistani (9,738)
- Nigerian (5,108)
- Chinese (4,570)
- Iranian (4,321)
Figure 4: Nationalities with the largest increases and decreases in grants of settlement in 2018 (compared with the previous year)
Not applied by author.
Source:
Table se 03, (Settlement tables.)
In May 2019, the Home Office published the Migrant Journey: 2018 report’, which explores changes in the immigration status of non-European Economic Area (non-EEA) migrants’ as they journey through the UK’s immigration system.
This analysis shows that of all migrants granted settlement in 2018:
- 29% had originally entered the UK on a Study visa
- 18% on a Work visa
- 15% on a Family visa
- 7% on an entry clearance visa for immediate settlement
- 3% on a Dependant joining or accompanying visa
- 28% had come to the UK for other reasons
3. EEA nationals and their family members
Under European law, EEA nationals and their dependants do not need to obtain documentation confirming their right of residence in the UK.
EEA nationals can apply for registration certificates and documents certifying permanent residence in the UK. Their family members (who are non-EEA nationals) can apply for residence and permanent residence cards. These act as confirmation of their right to stay in the UK. There is no need to apply for a residence card as a family member but it can help residence card holders prove their status.
EEA nationals only need to apply for a document certifying permanent residence if they want to either apply for British citizenship or sponsor their partner’s visa application under the Immigration Rules.
After 12 November 2015, a person applying for citizenship who is claiming to have permanent residence as an EEA national or the family member of an EEA national has been required to provide a permanent residence card or a document certifying permanent residence as evidence that they meet the requirement to be free of immigration time restrictions. These rule changes, along with EEA nationals’ response to perceived uncertainty following the 2016 EU referendum, are likely to have contributed to the steep increase in demand for EEA residence documentation during 2016 and 2017.
Variations in numbers of decisions can be affected by changes in resources and the mix of cases, as well as policy changes and application levels in earlier periods.
EEA residence documents, including registration certificates, registration cards, documents certifying permanent residence and permanent residence cards, will not be valid after 31 December 2020. From 30 March 2019, EU and EEA nationals resident in the United Kingdom, along with their non-EEA family members are able to apply to the EU Settlement Scheme to continue living in the UK.
The Home Office publishes high-level progress information on the EU Settlement Scheme through monthly Experimental Statistics, available on GOV.UK, A more detailed quarterly EU Settlement Scheme quarterly statistics, June 2019 was published for the first time on 22 August 2019.
3.1 Registration certificates and registration cards
In the year ending June 2019, there were 94,525 registration certificates and registration cards issued similar to the previous year. This followed the large increases seen in the period immediately following the referendum on membership of the EU in June 2016. The current level remains higher than before the referendum.
There were 25% fewer registration certificates issued to EU nationals (down 14,109 to 42,312), although this remains higher than pre-EU referendum periods.
Documents issued to non-EU nationals increased by 34% (up 13,310 to 52,213), continuing a gradual increase since June 2015.
Figure 5: Number of EEA1 residence documents issued to EU and non-EU2 nationals
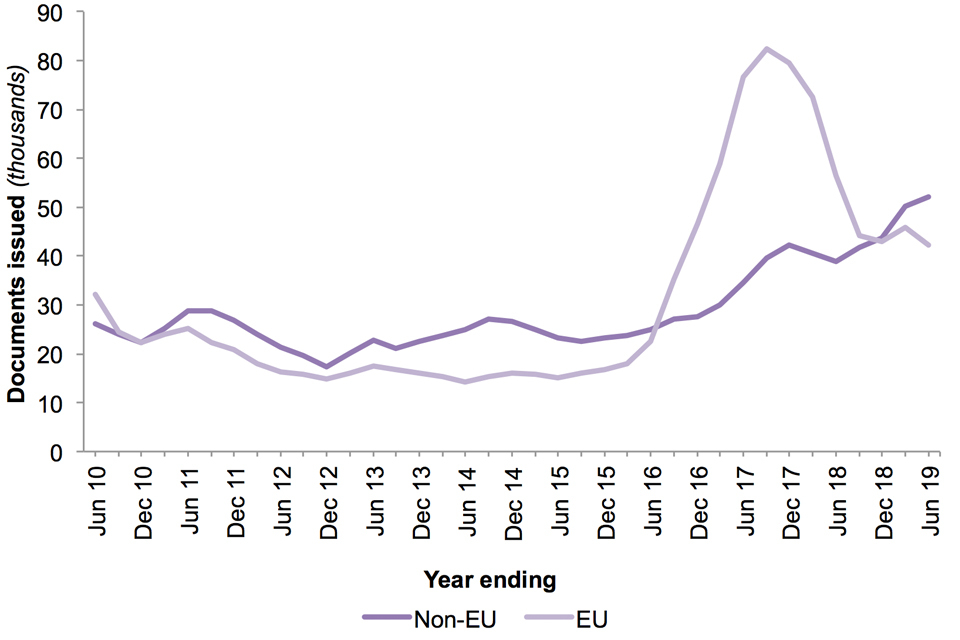
The chart shows registration certificates and registration cards issued to EEA nationals and their family members for the last 10 years.
Source:
Chart notes:
- The EEA consists of the 28 countries of the EU, plus Iceland, Liechtenstein and Norway. See the user guide for a list of countries within the EU.
- Non-EU includes non-EEA family members of EEA nationals and small numbers of EEA nationals from Iceland, Lichtenstein and Norway, and Swiss nationals.
3.2 Documents certifying permanent residence and permanent residence cards
There were 88,828 documents certifying permanent residence and permanent residence cards issued in the year to June 2019, 23% fewer than the previous year. Since the EU referendum, trends for EU and non-EU nationals have differed.
Although documents issued to EU nationals have fallen since the peak of 151,521 in Q3 2017, current levels (69,594) remain considerably higher than prior to the EU referendum.
The number of documents issued to non-EEA nationals has gradually increased over the last few years and was 19,234 in the latest year.
Figure 6: Number of EEA1 permanent residence documents issued to EU and non-EU2 nationals
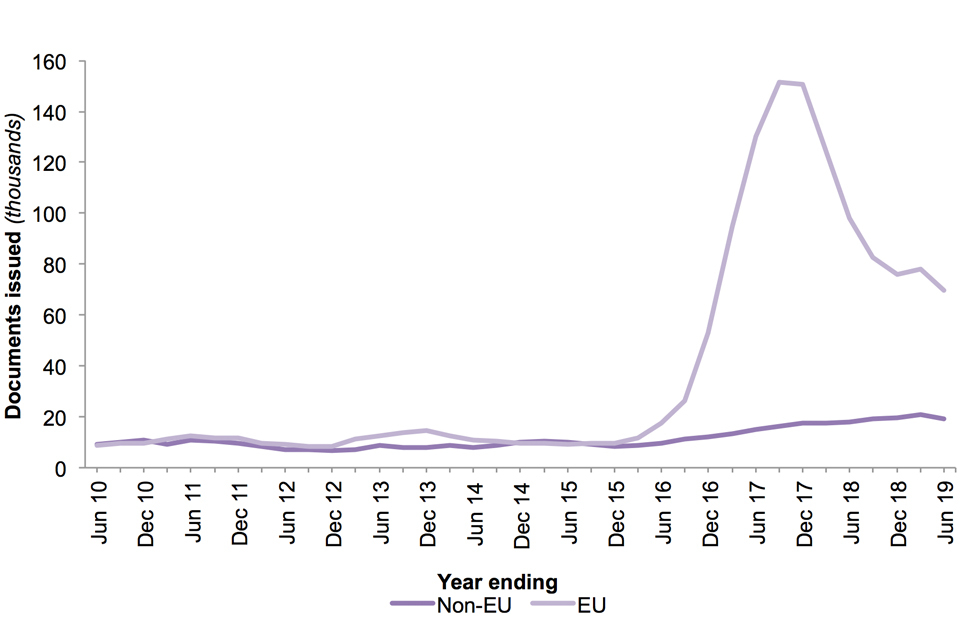
The chart shows the number of documents issued certifying permanent residence and permanent residence cards for EEA nationals and family members for the last 10 years.
Source:
Chart notes:
- The EEA consists of the 28 countries of the EU, plus Iceland, Liechtenstein and Norway. See the user guide for a list of countries within the EU.
- Non-EU includes non-EEA family members of EEA nationals and small numbers of EEA nationals from Iceland, Lichtenstein and Norway, and Swiss nationals.
4. Citizenship
4.1 Applications for British citizenship
There were 175,011 applications for British citizenship in the year to June 2019, 19% more than the previous year.
In the last 12 months, applications for citizenship by EU nationals increased by 26% to 53,588. EU nationals now account for 31% of all citizenship applications, compared with 12% in 2016. Increases in citizenship applications from EU nationals in the last 3 years are likely to result from more people seeking to confirm their status following the EU referendum.
Applications made by non-EU nationals increased by 17% in the most recent year to 121,423, following falls in the previous 2 years.
Figure 7: Applications for British citizenship from EU and non-EU nationals1,2
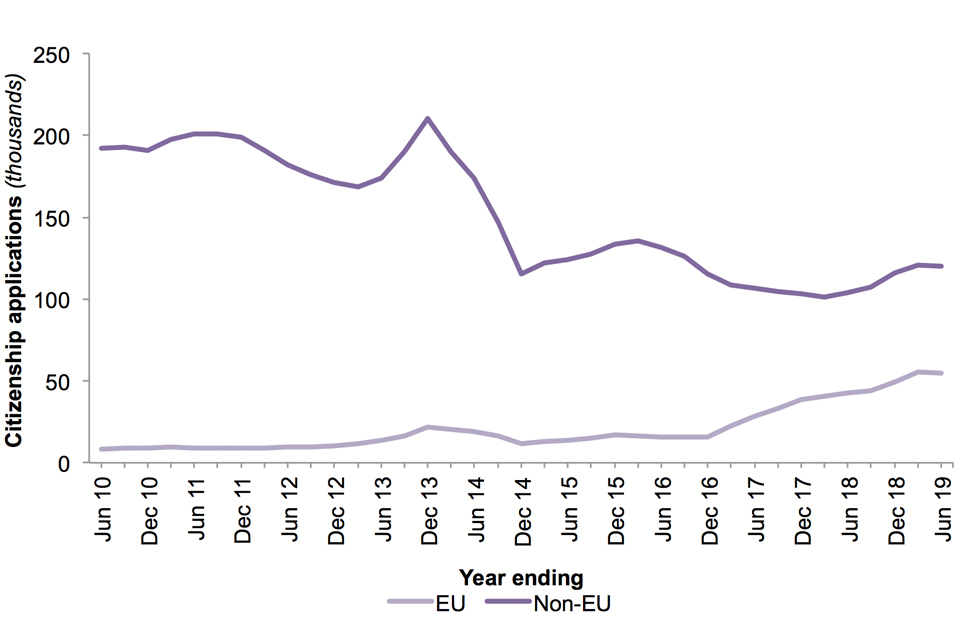
The chart shows numbers of applications for British citizenship made by EU and non-EU nationals for the last 10 years.
Source:
Chart notes:
- Series are based on current EU membership; for example, Croatians are included in the EU total throughout the time series.
- The increase in applications made in 2013 may have reflected people anticipating the rule change to the English language element of the Life in the UK test as of 28 October 2013. See the Policy and Legislative Changes Timeline for details.
4.2 Grants of British citizenship
There were 153,462 grants of British citizenship in the year ending June 2019, similar to the previous year. This remains below the peak seen in 2013 after which application and grant numbers fell.
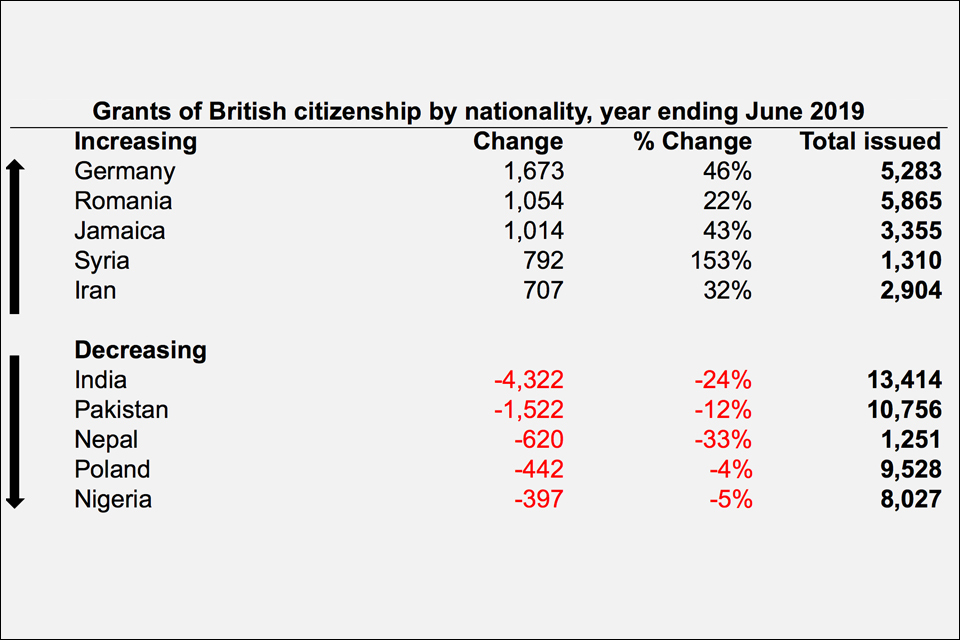
There were 50,180 grants of UK citizenship to former EU citizens, a 12% increase, with former German nationals seeing the largest increase. Polish nationals were the top EU nationality being granted citizenship in the latest year (9,528), followed by Romania (5,865).
Grants to former nationals of non-EU countries fell by 3% to 103,282.
Former Indian and Pakistani nationals had the highest numbers of citizenship grants in most years from 1998 to 2019 – and they represented 16% of all grants in the year ending June 2019, although both nationalities have seen a fall in citizenship grants since peaks in 2013 and 2014.
The diagram below illustrates the latest nationality trends in grants of British citizenship.
Table 4: Nationalities with the largest increases and decreases in grants of British citizenship in the year ending June 2019 (compared with the previous year)
Not applied by author.
Source:
More than half (54%) of grants of British citizenship in the last year were on naturalisations grounds of 5 or more years residence in the United Kingdom under section 6(1) of the British Nationality Act 1981 (‘residence’). Grants of citizenship following marriage increased to 25,736 (up 14%).
Table 5: Outcomes of citizenship applications, by general category
| Year ending | Total decisions | Total grants | Residence | Marriage | Children | Other | Refusals and withdrawals |
|---|---|---|---|---|---|---|---|
| June 2018 | 160,427 | 151,824 | 85,689 | 22,488 | 35,448 | 8,199 | 8,603 |
| June 2019 | 162,141 | 153,462 | 83,329 | 25,736 | 34,273 | 10,124 | 8,679 |
| Change: latest year | +1,714 | +1,638 | -2,360 | +3,248 | -1,175 | +1,925 | +76 |
| Percentage change | +1% | +1% | -3% | +14% | -3% | +23% | +1% |
Source:
Table note:
- ‘Other grounds’ includes Entitlement and Discretionary registration as an adult, Entitlement and Discretionary registration on other grounds, and registration under Section 5 of the British Nationality Act 1981. See Citizenship table cz 07 and the User Guide to Home Office Immigration Statistics for more detail.
Figure 8: Citizenship grants by reason for grant, and refusals
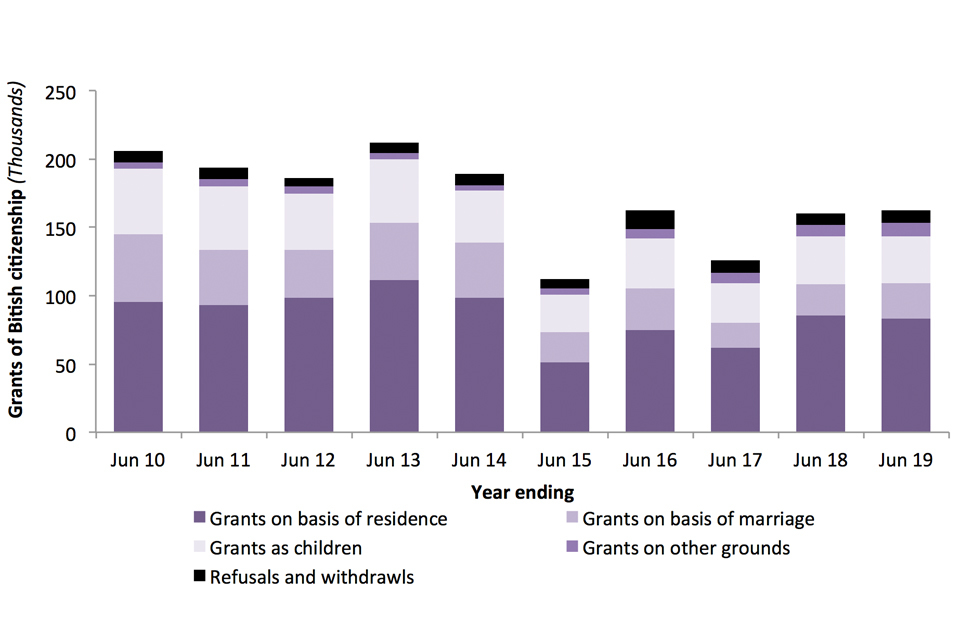
The chart shows grants and refusals of British citizenship over the last 10 years.
Source:
Citizenship tables cz 01 q and cz 02 q
Chart notes:
- In 2014 UK Visas and Immigration (UKVI) resources were used to assist HM Passport Office. In 2015 enhanced checks on cases were introduced.
- ‘Other grounds’ includes Entitlement and Discretionary registration as an adult, Entitlement and Discretionary registration on other grounds, and registration under Section 5 of the British Nationality Act 1981. See Citizenship table cz 07 and the User Guide to Home Office Immigration Statistics for more detail.
Between 2009 and 2013 there were generally higher levels of applications and grants than seen in earlier years, which is likely in part to reflect the rise in non-European Economic Area (EEA) migration and increased grants of permission to stay permanently (known as ‘settlement’) in the period up to 2010. The peak in 2013, when there were 232,262 applications, may have been partly due to some people anticipating the rule change to the English language element of the Life in the UK test as of 28 October 2013. See the Policy and Legislative Changes Timeline for further information.
5. About these statistics
The statistics in this section refer to individuals who have leave to remain in the UK who wish to extend, or make permanent, their right to remain in the UK.
Data in this section should be viewed in the context of wider policy and legislative changes, which can impact the number of applications and decisions. It should also consider the availability and allocation of resources within the Home Office, which can affect the number of decisions made in a given period. For example, fewer citizenship decisions were made in 2015 when UK Visas and Immigration (UKVI) resources were used to assist HM Passport Office.
The statistics should not be used to make inferences about the size of the non-British population in the UK. The data do not show whether, or for how long, an individual remains in the UK once their right to remain has been extended or made permanent. Statistics on resident foreign populations in the UK are published by the Office for National Statistics.
5.1 Extension of temporary stay in the UK
Extensions of temporary stay in the UK relates to individuals inside the UK extending or changing the status of their right to stay in the UK. An individual is required to apply for an extension or change in status before their existing permission to enter or stay in the UK expires.
The statistics in this section show the number of grants and refusals in a given year on applications for extension of temporary stay in the UK. One individual may have made multiple applications for an extension, so may account for multiple decisions in a given period. Data in this section include dependants and take account of the outcomes of reconsiderations and appeals.
The statistics do not show the number of people applying to extend their temporary stay in the UK, nor do they show how long an individual stayed in the UK following their extension.
The statistics in the previous immigration category of students granted an extension were estimated for 2013, 2014, 2015, 2016 and 2018. Data for 2017 are unaffected.
Further information on the statistics in this section can be found in the extension section of the user guide.
5.2 Settlement
Settlement can be granted to individuals, subject to immigration control, to allow them to work, study and travel into and out of the UK without restriction. To be granted settlement, individuals generally must have lived in the UK for a certain length of time in a qualifying category. Those granted settlement can access state benefits and register their UK-born children as British citizens. It does not entitle the individual to a British passport (which requires British citizenship) or to vote in a general election (which requires British, Commonwealth or Irish Republic citizenship).
The statistics in this section show the number of grants and refusals in a given year on applications for settlement in the UK. They take account of the outcomes of reconsiderations and appeals.
The data on settlement refusals relate to cases where settlement was refused and no other form of leave was granted. Cases where settlement was refused but an extension was granted instead (for example where an individual has not met the qualifying period for settlement) will not be included in the refusal figure.
Individuals who leave the UK for more than 2 years may have their settlement status revoked, except in exceptional circumstances. The statistics do not differentiate between those granted settlement for the first time, and those granted settlement multiple times.
5.3 EEA nationals and their family members
EEA and Swiss nationals have freedom of movement throughout the EEA. Non-EEA nationals who are dependants of EEA national residents in the UK can share their residence if they satisfy certain conditions. See the user guide for details.
The statistics in this section show the number of registration certificates and registration cards issued, and the number of documents certifying permanent residence and permanent residence cards issued.
More information about applying for residence documentation and how the status of EU citizens in the UK will be secured after the UK leaves the EU is available on GOV.UK.
Figures on applications received and cases currently outstanding in the European casework route (along with other information such as percentage processed within service standards) can be found in ‘In-country migration data’ on GOV.UK.
5.4 Citizenship
British citizens can live and work in the UK free of any immigration controls. They can apply for a British passport, register to vote in all forms of election and referenda, and share in all the other rights and responsibilities of their status.
Dual citizenship (also known as dual nationality) is allowed in the UK. This means people can be a British citizen and a citizen of other countries.
If someone is not already a British citizen based on where and when they were born, or their parents’ circumstances, they can apply to become one.
The statistics in this section show the number of applications for British citizenship. Data on the number of grants of citizenship are available in the associated data tables.
In May 2019, the Home Office published the Migrant Journey: 2018 report’, which explores changes in non-European Economic Area (non-EEA) migrants’ visa and leave status as they journey through the UK’s immigration system.
6. Data tables
Data referred to here can be found in the following tables:
We welcome your feedback
If you have any comments or suggestions for the development of this report, please provide feedback by emailing MigrationStatsEnquiries@homeoffice.gov.uk. Please include the words ‘PUBLICATION FEEDBACK’ in the subject of your email.
See section 7 of the ‘About this release’ section for more details.