How many people continue their stay in the UK?
Published 23 August 2018

© Crown copyright 2018
This publication is licensed under the terms of the Open Government Licence v3.0 except where otherwise stated. To view this licence, visit nationalarchives.gov.uk/doc/open-government-licence/version/3 or write to the Information Policy Team, The National Archives, Kew, London TW9 4DU, or email: psi@nationalarchives.gov.uk.
Where we have identified any third party copyright information you will need to obtain permission from the copyright holders concerned.
This publication is available at https://www.gov.uk/government/statistics/immigration-statistics-year-ending-june-2018/how-many-people-continue-their-stay-in-the-uk
We welcome your feedback
The content and format of the quarterly release and associated data tables is currently being reviewed. This means the release may be subject to change in the future. If you have any comments, or suggestions for the development of this report, please provide feedback by emailing MigrationStatsEnquiries@homeoffice.gov.uk. Please include the words ‘PUBLICATION FEEDBACK’ in the subject of your email.
The Home Office is also running a more general survey on Home Office statistical publications, which covers all Home Office statistical publications.
See section 6 of the About this release section for more details.
Back to ‘Immigration statistics, year ending June 2018’ content page.
This is not the latest release. View latest release.
Data in this section relate to the year ending June 2018 and all comparisons are with the year ending June 2017, unless indicated otherwise.
Extensions of temporary stay data mainly relate to the calendar year 2017.
This section contains data on:
- grants of extensions of temporary stay in the UK
- grants and refusals of settlement
- residence documentation issued to EEA nationals and their family members
- applications and grants of British citizenship
In February 2018 the Home Office published ‘Statistics on changes in migrants’ visa and leave status: 2016’, which shows how non-EEA migrants change their immigration status, achieve settlement in the UK, or have their status expire.
1. Key facts
In the year ending June 2018, there were 235,152 grants of extension of temporary stay, up 22% on the previous year. The latest available data on previous reason for stay (year ending December 2017) show that:
- 78% of extensions allowed the individual to stay within their previous broad reason for stay category
- 22% of extensions were to switch categories
In the year ending June 2018, 81,359 people were granted settlement in the UK, 40% more than in the previous year. The increase in the latest year followed 4 consecutive year-on-year falls.
There were 95,580 registration certificates and registration cards issued, 14% less than the previous year (111,192). This was due to a fall in those issued to EU nationals, following the large increase after the EU referendum. The number issued to non-EU nationals has continued to grow.
There were 116,323 documents certifying permanent residence and permanent residence cards issued in the year ending June 2018. The majority of these were issued to EU nationals. Following the EU referendum, the number issued to EU nationals increased sharply. However, the latest figure is down from a peak in the year ending December 2017.
Total applications for British citizenship from EU nationals rose by 47% to 42,037. EU nationals now account for 29% of applications, compared with 11% in the year ending June 2016 (before the EU referendum). Applications from non-EU nationals fell by 6% in the most recent year (to 101,649).
2. Extension of temporary stay in the UK
Extensions of temporary stay in the UK relates to individuals inside the UK extending or changing the status of their right to stay in the UK. An individual is required to apply for an extension or change in status before their existing permission to enter or stay expires.
There were 260,237 decisions on applications for extension of temporary stay in the year ending June 2018, 23% more than in the previous year. Of these:
- 90% were grants (235,152)
- 10% were refusals (25,085)
2.1 Extension of temporary stay by previous reason for stay
Data in this section relate to the calendar year 2017. This is the latest period for which data on extensions, broken down by previous reason for stay, are available.
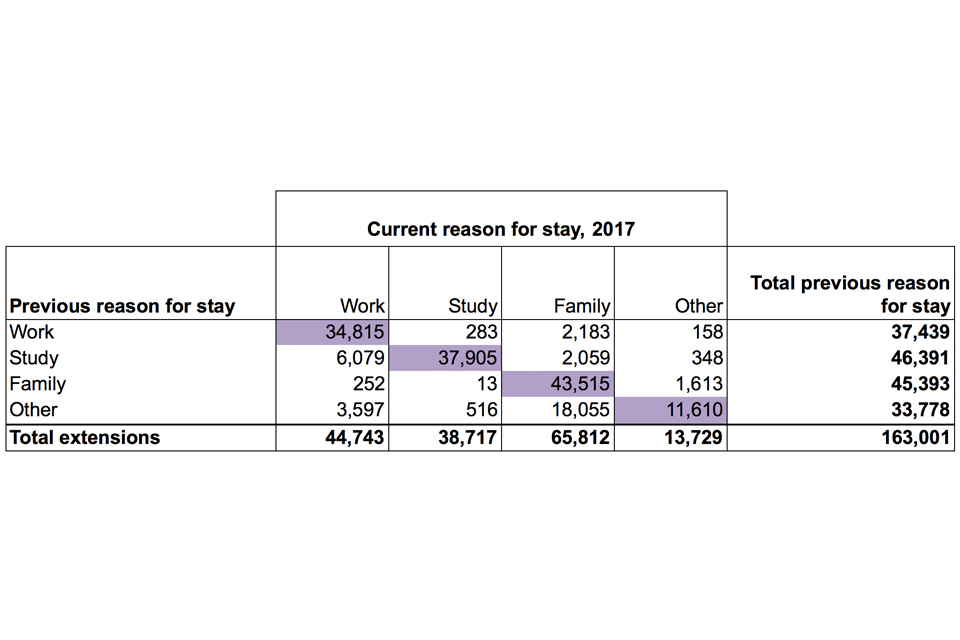
There were 163,001 extensions granted in 2017 to main applicants. Of these:
- 27% allowed individuals to extend their stay for work (44,743)
- 24% allowed individuals to extend their stay for study (38,717)
- 40% were for family reasons (65,812)
- 8% were for other reasons (13,729)
Of the 163,001 extensions granted in 2017, 127,845 (78%) allowed the individual to stay within their original broad reason for stay, with the other 22% having switched categories, which is similar to recent years. By comparison, in 2011 and 2012 a higher proportion switched (29% and 30% respectively). The fall in the proportion who switched largely reflects the closure of the Post-study route. Further details can be found in the user guide.
There were 46,391 extensions granted in 2017 to people who were previously students. Of these, the majority (82%) allowed individuals to continue to study.
Grants of extension of stay1, by current category and previous reason for stay, 2017
Not supplied by author.
Source:
Table ex pc 01, (Extensions tables)
Table notes:
- Figures exclude dependants.
- The family and other categories extensions by previous reason for stay in 2015, 2016 and 2017 have been revised.
Grants of extensions of stay1, by category, 2008 to 2017
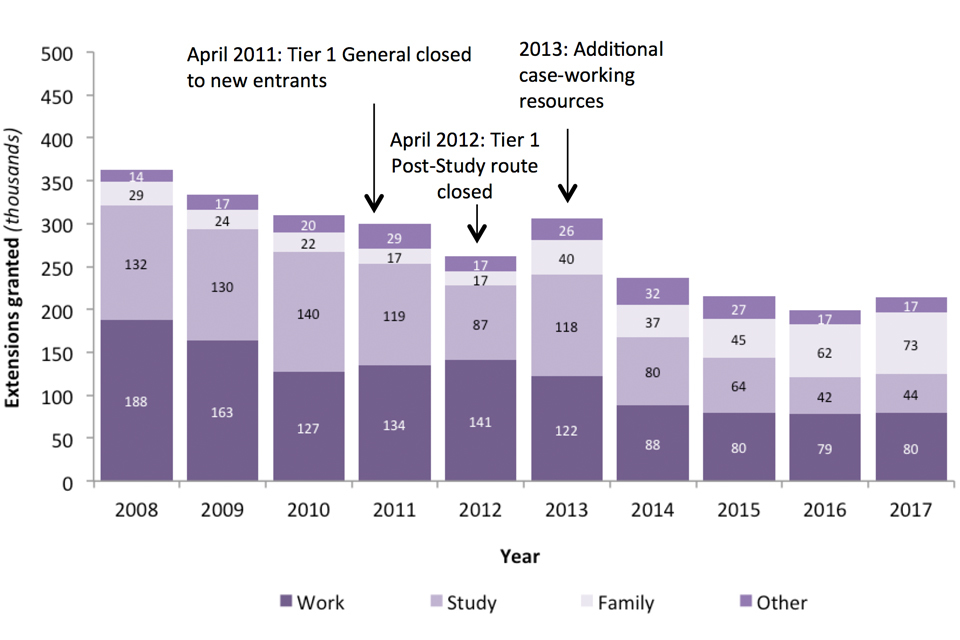
The chart shows the number of grants of an extension of stay between 2008 and 2017.
Source:
Table ex 01, (Extensions tables)
Chart note:
- New Family rules were introduced in July 2012 (see ‘Statement of intent: Family Migration’). As a result of these changes, data for the family and other categories from July 2012 are not fully comparable with earlier years.
The fall in work-related grants of extensions from 2012 partly reflect falls in Tier 1 General and Tier 1 Post-study grants, as these routes have been closed to new entrants. These falls have been partly offset by an increase in Tier 2 Skilled work grants.
Work-related extensions granted by category, 2017 compared to 2012
| 2012 | 2017 | Change | Percentage change | |
|---|---|---|---|---|
| Work-related grants of extension | 140,947 | 79,891 | -61,056 | -43% |
| of which: | ||||
| Tier 1 - General | 39,122 | 761 | -38,361 | -98% |
| Tier 1 - Post Study | 40,710 | 5 | -40,705 | -100% |
| Tier 2 and pre-PBS equivalent | 50,192 | 61,815 | +11,623 | +23% |
Source:
Table ex 01, (Extensions tables)
The fall in study-related grants of extensions, from 117,810 in 2013 to 44,311 in 2017, is likely to reflect previous falls in the number of study-related visas granted, together with tightening of the rules, such as the use of the ‘genuineness’ test. For further details see the Policy time line.
Family-related grants of extensions have risen from 36,634 in 2014 to 72,694 in 2017. This increase is likely to reflect a longer residence eligibility period before it is possible to apply to stay in the UK permanently (settlement). Individuals are required to obtain an extension every 2.5 years until they are eligible to apply for settlement. These changes were introduced as part of the new family Immigration Rules from 9 July 2012.
2.2 Extension of temporary stay in the UK by nationality
The top 5 nationalities account for over half of all extensions. For the largest group, Chinese nationals, 77% of extensions are for study. For the second largest nationality, Indian nationals, a majority (62%) are for work and a further 29% are extensions for family reasons. For the next 2 largest nationalities, Pakistan and Nigeria, extensions for family reasons tend to dominate, accounting for 69% and 56% respectively.
Grants of extension of stay1, by category, and nationality (top 5), 2017
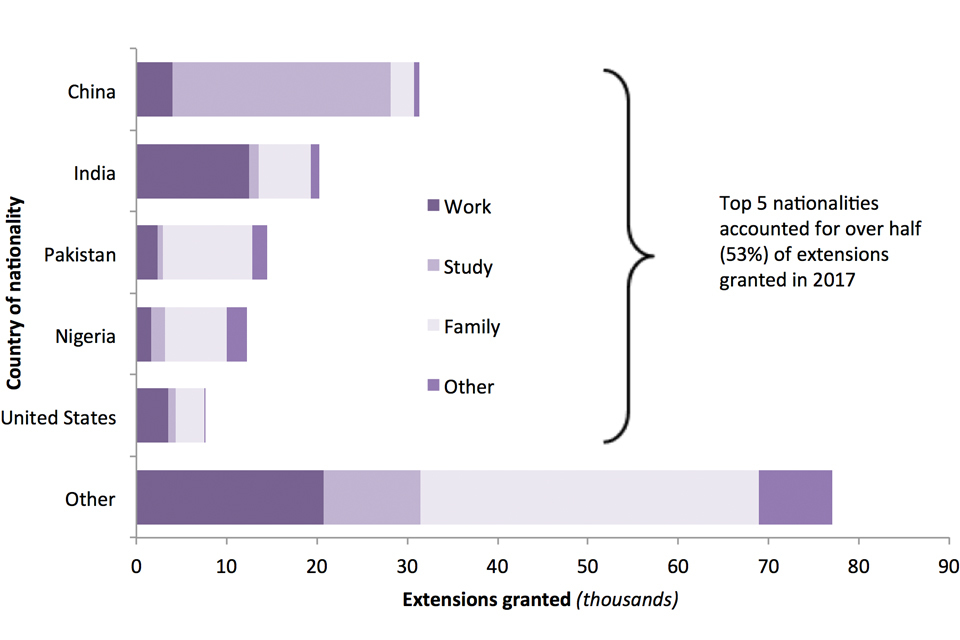
The chart shows the number of grants of extension of stay for each of the top 5 nationalities in 2017.
Source:
Table ex 02, (Extensions tables)
Chart notes:
- Excludes dependants
3. Settlement
Settlement can be granted to individuals, subject to immigration control, to allow them to work, study and travel into and out of the UK without restriction. Those granted settlement can access state benefits and register their UK-born children as British citizens. It does not entitle the individual to a British passport (which requires British citizenship) or to vote in general elections (which require British, Commonwealth or Irish Republic citizenship).
An individual may be granted settlement on arrival or following an application for settlement having lived in the United Kingdom for a certain length of time in a qualifying category – for example, currently 5 years for workers in certain routes. Following changes in immigration legislation, the majority of grants (around 96%) are to people already in the country.
There were 85,899 decisions on applications for settlement in the year ending June 2018. Of these:
- 95% were grants (81,359)
- 5% were refusals (4,540)
3.1 Settlement by reason for grant
There were 81,359 people granted settlement in the UK in the year ending June 2018, 40% more than in the previous year. The 23,097 increase in grants was reflected in higher numbers of people granted settlement in all broad categories. This included increases in:
- Settlement granted to those previously in the UK for work reasons (up 20% to 20,973), which was driven by an increase of 3,860 in grants to those in the Tier 2 Skilled Work category (to 13,348)
- Settlement granted to those previously in the UK for family reasons (more than doubled to 10,545). The increase reflects family rule changes in July 2012 which affected the qualifying period for settlement. Further information about the rules changes are available at: Family and private life immigration rule changes 9 July 2012
- Settlement granted to those who have previously been granted leave to stay following an asylum claim (up 64% to 25,375). Asylum was the largest category of settlement grants in the year ending June 2018, accounting for 31%
- Settlement granted to those previously in the UK for other reasons (up 20% to 24,466)
However, there was a fall in the number of Tier 1 (High value) work grants (down 16% to 4,096).
Outcome of applications for settlement in the UK, by reason for grant, year ending June 2018 compared to the year ending June 20171,2
| Year ending | Total decisions1 | Total grants | Work | Asylum | Family | Other2 | Refusals |
|---|---|---|---|---|---|---|---|
| June 2017 | 62,133 | 58,262 | 17,440 | 15,426 | 5,049 | 20,347 | 3,871 |
| June 2018 | 85,899 | 81,359 | 20,973 | 25,375 | 10,545 | 24,466 | 4,540 |
| Change: latest 12 months | +23,766 | +23,097 | +3,533 | +9,949 | +5,496 | +4,119 | +669 |
| Percentage change | +38% | +40% | +20% | +64% | +109% | +20% | +17% |
Source:
Table se 02 q, (Settlement tables)
Table notes:
- The number of decisions in a given year can be affected by changes in casework resource allocation. Such fluctuations can be examined in more detail in the quarterly data that are available in the published Settlement tables.
- Includes grants on the basis of Long Residence and grants on a discretionary basis.
Grants of settlement, by reason, year ending June 2009 to the year ending June 2018
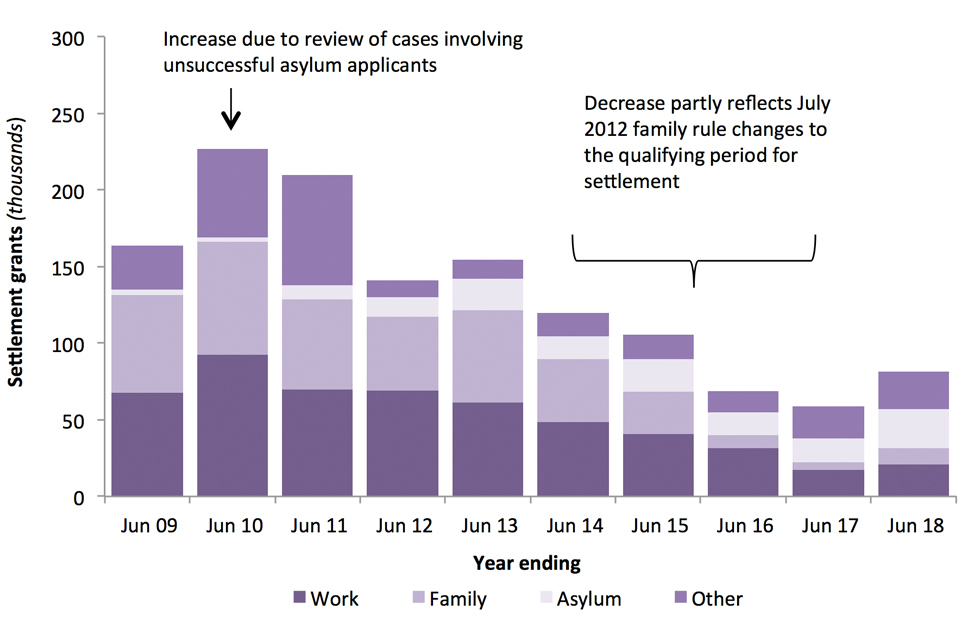
The chart shows the number of people granted settlement by reason, over the last 10 years.
Source:
Table se 02, (Settlement tables)
3.2 Settlement by nationality
Data in this section relate to the period 2017. This is the latest period for which data on settlement broken down by nationality are available.
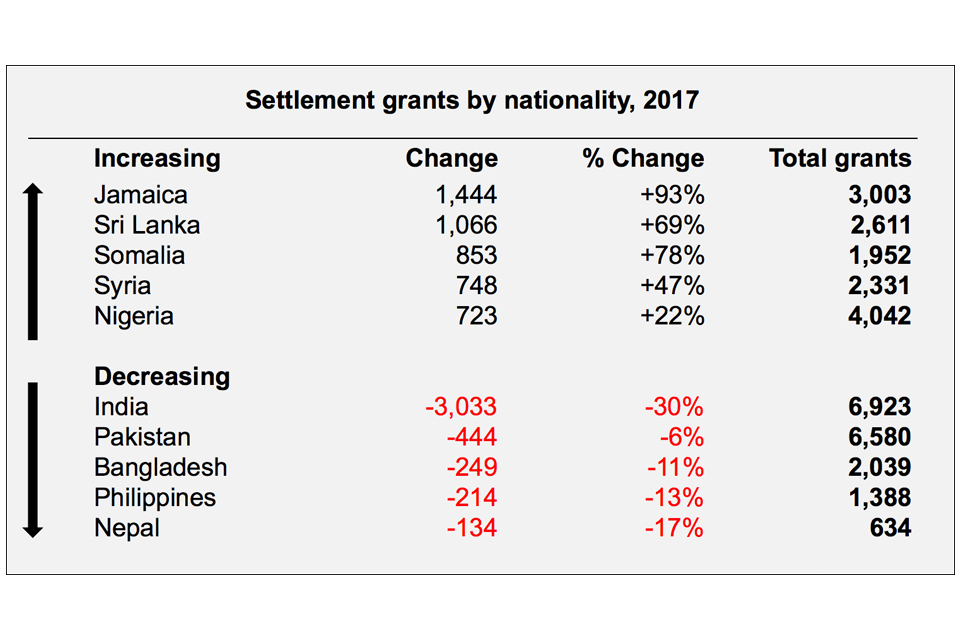
Of the total 65,102 grants of settlement in 2017, 29% (18,818) were to nationals of South Asian countries and a quarter (16,011) were to nationals of Sub-Saharan African countries.
The nationalities that were granted the highest numbers in 2017 were:
- Indian (6,923)
- Pakistani (6,580)
- Nigerian (4,042)
- Iranian (3,116)
- Jamaican (3,003)
These top 5 nationalities accounted for 36% of total grants in 2017.
The diagram below shows the nationalities with the largest changes in grants of settlement over the last year.
Not supplied by author.
Source:
Table se 03, (Settlement tables)
4. EEA nationals and their family members
Under the Immigration (European Economic Area) Regulations 2016 and Free Movement of Persons Directive (2004/38/EC), EEA and Swiss nationals have free movement rights within the EEA. Switzerland is not part of the EEA, but Swiss nationals and their family members have the same free movement rights as EEA nationals. Non-EEA nationals who are dependants of EEA nationals resident in the UK can share their residence if they satisfy the conditions set out in the regulations.
To ‘qualify’ for residence in the UK as an EEA or Swiss national, applicants must be one of the following:
- working
- studying
- self-employed
- self-sufficient
- looking for work
Under European law, EEA nationals and their dependants do not need to obtain documentation confirming their right of residence in the UK.
EEA nationals can apply for registration certificates and documents certifying permanent residence in the UK. Their family members (who are non-EEA nationals) can apply for residence and permanent residence cards. These act as confirmation of their right to stay in the UK. There is no need to apply for a residence card as a family member but it can:
- help residence card holders to re-enter the country more quickly and easily if travelling abroad
- show employers that residence card holders are allowed to work in the UK
- help prove residence card holders qualify for certain benefits and services
EEA nationals only need to apply for a document certifying permanent residence if they want to either:
- apply for British citizenship
- sponsor their partner’s visa application under the Immigration Rules
More information about applying for residence documentation and how the status of EU citizens in the UK will be secured after the UK leaves the EU is available on GOV.UK, Visas and immigration.
After 12 November 2015, a person applying for citizenship who is claiming to have permanent residence as an EEA national or the family member of an EEA national has been required to provide a permanent residence card or a document certifying permanent residence as evidence that they meet the requirement to be free of immigration time restrictions. These rule changes, along with EEA nationals’ response to perceived uncertainty following the 2016 EU referendum, are likely to have contributed to the steep increase in demand for EEA residence documentation during 2016 and 2017.
Variations in numbers of decisions can be affected by changes in resources and the mix of cases, as well as policy changes and application levels in earlier periods.
Figures on applications received and cases currently outstanding in the European casework route (along with other information such as percentage processed within service standards) can be found on the UK Visas and Immigration Migration transparency data web page, In-country migration data.
4.1 Registration certificates and registration cards
In the year ending June 2018, there were 95,580 registration certificates and registration cards issued, 14% less than the previous year (111,192). The fall is attributed to EU nationals (down 20,197 to 56,536), while registration documents issued to non-EU nationals increased (up 4,585 to 39,044).
Registration certificates and registration cards issued to EEA nationals and their family members, year ending June 2009 to the year ending June 20181
The chart shows numbers of EEA permanent residence documents issued to EU and non-EU nationals over the last 10 years.
Source:
Table ee 02 q, (EEA tables)
Chart note:
- Non-EU includes non-EEA family members of EEA nationals and small numbers of EEA nationals from Iceland, Lichtenstein and Norway, and Swiss nationals.
4.2 Registration certificates and registration cards, by nationality
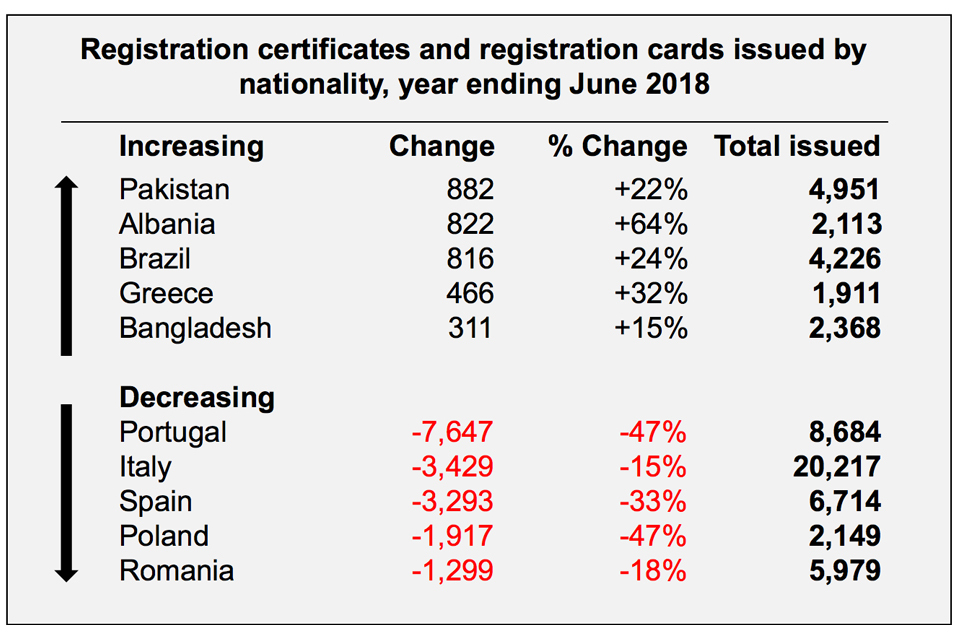
There were 95,580 registration certificates and registration cards issued in the year ending June 2018. The nationalities that were issued the highest numbers were:
- Italian (20,217)
- Portuguese (8,684)
- Spanish (6,714)
- Romanian (5,979)
- Indian (5,205)
These top 5 nationalities accounted for around half (49%) of total issues in the year ending June 2018.
The following diagram shows the nationalities with the largest changes in registration certificates and registration cards issued over the last year.
Not supplied by author.
Source:
Table ee 02 q, (EEA tables)
Table note:
- Registration certificates are issued to EEA and Swiss nationals. Registration cards are issued to non-EEA family members.
4.3 Documents certifying permanent residence and permanent residence cards
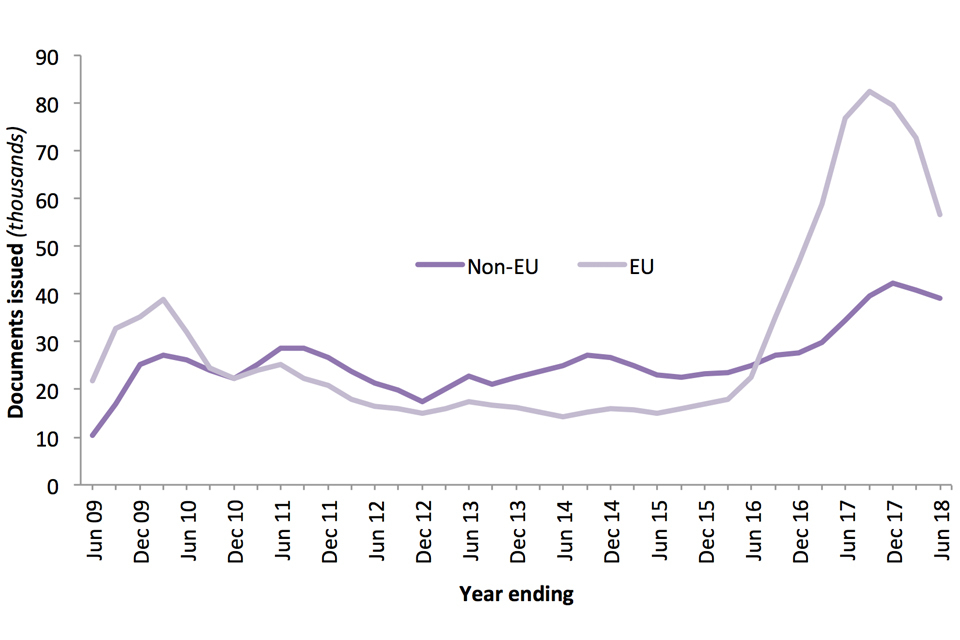
There were 116,323 documents certifying permanent residence and permanent residence cards issued in the year ending June 2018. The majority of these (85%) were issued to EU nationals. This is down from a peak in the year ending December 2017, following the EU referendum, when 168,413 documents were issued.
4.4 Documents issued certifying permanent residence and permanent residence cards for EEA nationals and their family members, year ending June 2009 to the year ending June 20181

The chart shows numbers of EEA permanent residence documents issued to EU and non-EU nationals over the last 10 years.
Source:
Table ee 02 q, (EEA tables)
Chart note:
- Non-EU includes non-EEA family members of EEA nationals and small numbers of EEA nationals from Iceland, Lichtenstein and Norway, and Swiss nationals.
4.5 Documents certifying permanent residence and permanent residence cards by nationality
There were 116,323 documents certifying permanent residence and permanent residence cards issued in the year ending June 2018. The nationalities that were issued the highest numbers were:
- Polish (19,059)
- Italian (11,218)
- Romanian (10,658)
- Portuguese (7,856)
- French (7,373)
These top 5 nationalities accounted for 48% of total issues in the year ending June 2018.
The following diagram illustrates the latest nationality trends in documents certifying permanent residence and permanent residence cards issued.

Not supplied by author.
Source:
Table ee 02 q, (EEA tables)
Table note:
- Documents certifying permanent residence are issued to EEA and Swiss nationals. Permanent residence cards are issued to non-EEA family members.
5. Citizenship
British citizens can live and work in the UK free of any immigration controls. They can apply for a British passport, register to vote in all forms of election and referenda and share in all the other rights and responsibilities of their status.
Dual citizenship (also known as dual nationality) is allowed in the UK. This means people can be a British citizen and also a citizen of other countries.
If someone is not already a British citizen based on where and when they were born, or their parents’ circumstances they can apply to become one.
There are different ways to become a British citizen. The most common is called ‘naturalisation’. To apply for British citizenship by naturalisation applicants must usually have:
- lived in the UK for at least the 5 years before the date of your application
- spent no more than 450 days outside the UK during those 5 years
- spent no more than 90 days outside the UK in the last 12 months
- had settlement in the UK for the last 12 months if you are from outside the EEA
- had permanent residence status for the last 12 months if you are a citizen of an EEA country
- not broken any immigration laws while in the UK
There are different requirements if the applicant is a spouse or civil partner is a British citizen.
5.1 Applications for British citizenship
There were 143,686 applications for British citizenship in the year ending June 2018, up 5% compared to the previous year.
In the year ending June 2018, applications for citizenship made by EU nationals increased by 47% to 42,037 compared to the previous year. Applications have increased sharply since the EU referendum. EU nationals now account for 29% of all citizenship applications, compared with 11% in the year ending June 2016.
Applications from non-EU nationals have fallen by 6% in the most recent year to 101,649, a fall for the second consecutive year.
Applications for British citizenship, EU and non-EU nationals1, year ending June 2009 to the year ending June 2018
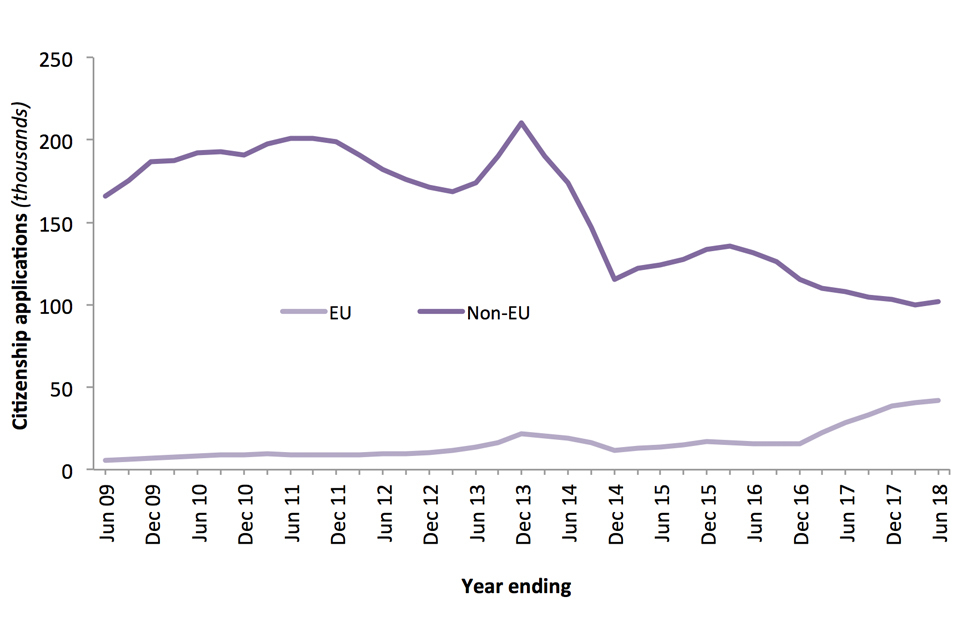
The chart shows numbers of applications for British citizenship made by EU and non-EU nationals over the last 10 years.
Source:
Table cz 01 q a, (Citizenship tables)
Chart note:
- Series are based on current EU membership, i.e. Croatians are included in EU total throughout the time series.
Increases in applications from EU nationals in recent years are likely to reflect immigration in earlier years, while the most recent rise may be partly due to the impact of rule changes and perceived uncertainty following the 2016 EU referendum. After 12 November 2015, a person applying for citizenship who is claiming to have permanent residence as an EEA national or the family member of an EEA national has been required to provide a document certifying permanent residence or a permanent residence card as evidence that they meet the requirement to be free of immigration time restrictions.
Variations in numbers of applications can be affected by policy and other changes in earlier periods.
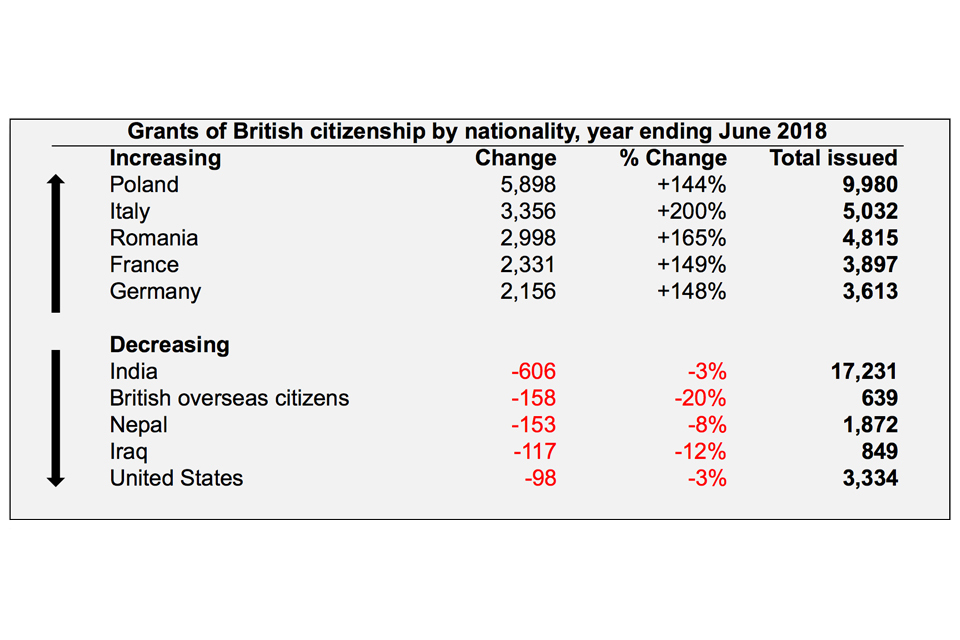
5.2 Grants of British citizenship by previous nationality
There were 150,729 grants of British citizenship in the year ending June 2018. The former nationalities that were granted the highest numbers were:
- India (17,231)
- Pakistan (12,293)
- Poland (9,980)
- Nigeria (8,436)
- Italy (5,032)
Former Indian and Pakistani nationals had the highest numbers of citizenship grants in most years from 1998 to 2018 – and together accounted for 20% of grants in the year ending June 2018.
The diagram below illustrates the latest nationality trends in grants of British citizenship.
Not supplied by author.
Source:
Table cz 06 q, (Citizenship tables)
5.3 Citizenship by reason for grant
Outcomes of citizenship applications, by category, year ending June 2018 compared to the year ending June 2017
| Year ending | Total decisions | Total grants | Residence | Marriage | Children | Other1 | Refusals and withdrawals |
|---|---|---|---|---|---|---|---|
| June 17 | 126,027 | 116,486 | 61,972 | 18,108 | 28,728 | 7,678 | 9,541 |
| June 18 | 159,595 | 150,729 | 85,785 | 22,519 | 34,199 | 8,226 | 8,866 |
| Change: latest year | +33,568 | +34,243 | +23,813 | +4,411 | +5,471 | +548 | -675 |
| Percentage change | +27% | +29% | +38% | +24% | +19% | +7% | -7% |
Source:
Table cz 02 q, (Citizenship tables)
Table note:
- ‘Other’ includes Entitlement and Discretionary registration as an adult, Entitlement and Discretionary registration on other grounds, and registration under Section 5 of the British Nationality Act 1981. See Citizenship table cz 07 and the User Guide to Home Office Immigration Statistics for more detail.
Outcome of applications for citizenship, by category, year ending June 2009 to the year ending June 20181
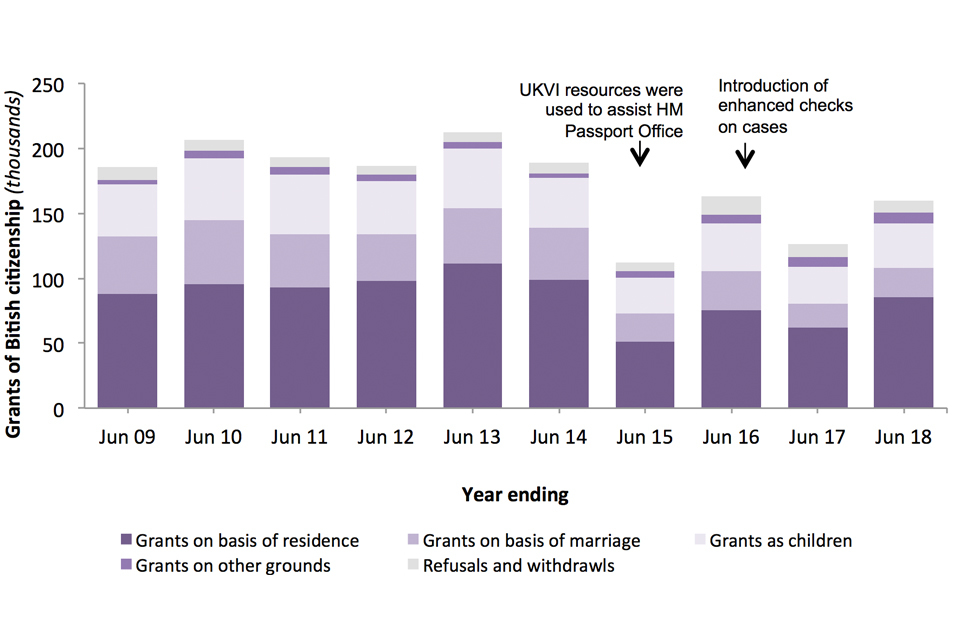
The chart shows the number of grants and refusals of British citizenship over the last 10 years.
Source:
Tables cz 01 q and cz 02 q, (Citizenship tables)
Chart note:
- In 2014 UK Visas and Immigration (UKVI) resources were used to assist HM Passport Office. In 2015 enhanced checks on cases were introduced.
6. Data tables
Data referred to here can be found in the following tables:
Extensions tables
Settlement tables
Citizenship tables
European Economic Area (EEA) tables