Why do people come to the UK? To work
Published 27 February 2020

© Crown copyright 2020
This publication is licensed under the terms of the Open Government Licence v3.0 except where otherwise stated. To view this licence, visit nationalarchives.gov.uk/doc/open-government-licence/version/3 or write to the Information Policy Team, The National Archives, Kew, London TW9 4DU, or email: psi@nationalarchives.gov.uk.
Where we have identified any third party copyright information you will need to obtain permission from the copyright holders concerned.
This publication is available at https://www.gov.uk/government/statistics/immigration-statistics-year-ending-december-2019/why-do-people-come-to-the-uk-to-work
Back to ‘Immigration statistics, year ending December 2019’ content page.
This is not the latest release. View latest release.
Data relate to the year ending December 2019 and all comparisons are with the year ending December 2018, unless indicated otherwise. A more detailed annual summary can be found in ‘Immigration statistics, year ending June 2019 second edition’.
This section contains data for non-European Economic Area (EEA) nationals on:
- Work-related visas, including Skilled (Tier 2) work visas
- Sponsored work visa applications from different economic sectors
1. Immigration for work
There were 193,517 work-related visas granted in 2019 (including dependants), 10% higher than 2018, and the highest level since 2007, before the ‘points-based system’ (PBS) was introduced. Most of the rise was accounted for through increases in grants of Skilled (Tier 2) work visas, which increased by 11% to 113,958, the highest level on record. The Tier 2 category accounts for 59% of work-related visas granted.
There were also increases in the number of grants in all other work categories:
- Youth mobility and temporary worker (Tier 5) visas, up 5% to 43,576
- High value (Tier 1) visas, up 7% to 5,664
- Non-PBS work categories, up 13% to 30,319
Figure 1: Work-related visas granted by visa type1, 2010 to 2019
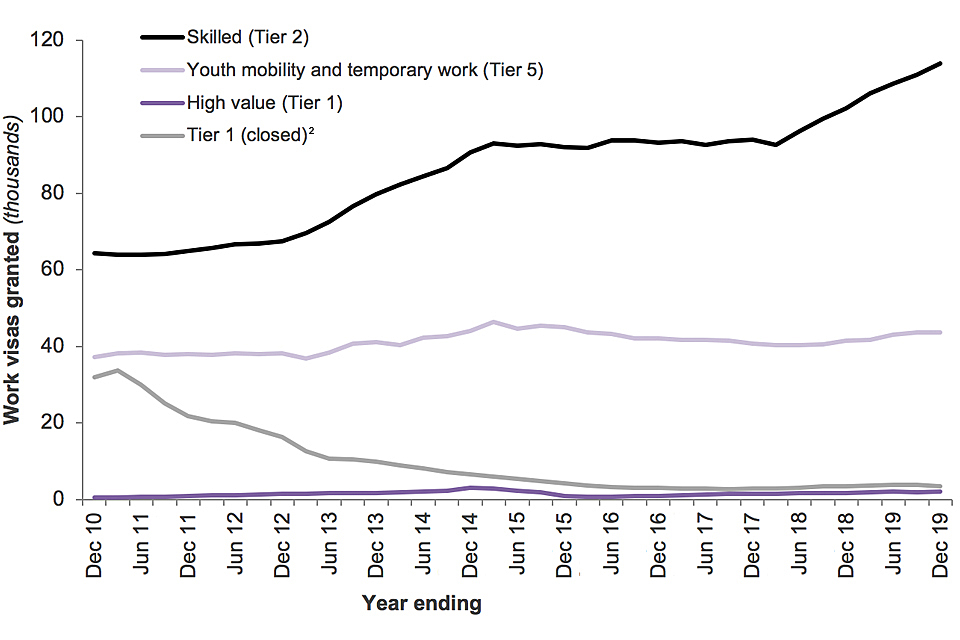
The chart shows the number of work-related Entry clearance visas granted by type of visa over the last 10 years.
Source: Entry clearance visa applications and outcomes – Vis_D02
Notes:
- Non-PBS visas are not included in the chart.
- ‘Tier 1 (closed routes)’ includes the ‘Tier 1 – General’, ‘Tier 1 – Post study’, ‘Tier 1 – Entrepreneur’, and ‘Tier 1 – Graduate entrepreneur’ categories. The General and Post study categories were closed to new entrants following operational evidence that these routes were not working as intended. These routes are not included in the ‘Tier 1 (High value)’ category in the chart.
Table 1: Work-related visas granted, by visa type
| Visa type | 2018 | 2019 | Change | Percentage change |
|---|---|---|---|---|
| Skilled (Tier 2) | 102,249 | 113,958 | +11,709 | +11% |
| Youth mobility and temporary workers (Tier 5) | 41,417 | 43,576 | +2,159 | +5% |
| Non-PBS work1 | 26,864 | 30,319 | +3,455 | +13% |
| High value (Tier 1) | 5,282 | 5,664 | +382 | +7% |
| Total | 175,812 | 193,517 | +17,705 | +10% |
Source: Entry clearance visa applications and outcomes – Vis_D02
Notes:
- The ‘Non-PBS work’ category includes routes such as European Community Association Agreement (ECAA) businessperson, domestic workers in private households, UK Ancestry visas and pre-PBS routes that are now closed.
According to Labour Force Survey estimates from October to December 2019 published in the ONS ‘UK and non-UK people in the labour market: February 2020’ release, there were 2.31 million EU nationals working in the UK, 36,000 more than a year earlier. The number of EU nationals working in the UK has generally increased, reflecting the admission of Poland and other East European countries to the EU in 2004. However, the series has been broadly flat since the latter half of 2016, at around 2.30 million. At the same time there were 1.34 million non-EU nationals working in the UK, 49,000 more than a year earlier. Between early 2009 and early 2018, the number of non-UK nationals from outside the EU working in the UK was broadly flat (at around 1.20 million); however, there has been a slight increase since. There were an estimated 29.33 million UK nationals working in the UK, a record high and 227,000 more than a year earlier.
1.1 Skilled (Tier 2) Work
In 2019, there was an 11% increase in Tier 2 work visas granted (to 113,958), the highest level on record. The increase was due to a rise in grants in the ‘Tier 2 – General’ category (up 49% to 36,237) and the ‘Tier 2 – Dependant’ category (up 41% to 25,912), both of which have been rising steadily since July 2018 when doctors and nurses were removed from the Tier 2 visa cap.
Almost half (45%) of the Tier 2 visas granted were ‘Intra-company transfers’; however, there has been a fall in grants in this category over the last year (down 13% to 51,283) following a stable trend since the end of 2014.
Indian nationals account for half of all Tier 2 visas granted, and the number of grants increased by 3% to 57,199 in 2019. There were also notable increases in grants for nationals of the Philippines (up 2,420 or 62%), Nigeria (up 1,432 or 57%) and Egypt (up 942 or 57%).
Table 2: Top 51 nationalities granted Skilled (Tier 2) Work visas
| Nationality | 2018 | 2019 | Change | Percentage change |
|---|---|---|---|---|
| India | 55,479 | 57,199 | +1,720 | +3% |
| United States | 9,730 | 9,240 | -490 | -5% |
| Philippines | 3,910 | 6,330 | +2,420 | +62% |
| Nigeria | 2,513 | 3,945 | +1,432 | +57% |
| Australia | 3,002 | 3,319 | +317 | +11% |
| Other nationalities2 | 27,615 | 33,925 | +6,310 | +23% |
| Total | 102,249 | 113,958 | +11,709 | +11% |
Source: Entry clearance visa applications and outcomes – Vis_D02
Notes:
- Top 5 nationalities in the most recent year.
- ‘Other nationalities’ includes those that do not feature in the top 5 in the latest year.
In the year ending September 2019 (the latest available data – see ‘About these statistics’ below for details), there were 63,510 certificates of sponsorship applications for Tier 2 work, a 12% increase on the previous year. This included a 72% increase in applications in the ‘Human health and social work activities’ sector to 15,348, which is likely related to the removal of doctors and nurses from the Tier 2 cap.
Five sectors accounted for 87% of sponsored Tier 2 work visa applications:
- Information and communication (31%)
- Human health and social work activities (24%)
- Professional, scientific and technical activities (16%)
- Financial and insurance activities (10%)
- Education (6%)
Figure 2: Certificate of sponsorship applications for Tier 2 (Skilled) work, by sector, comparing years ending September 2018 and 2019
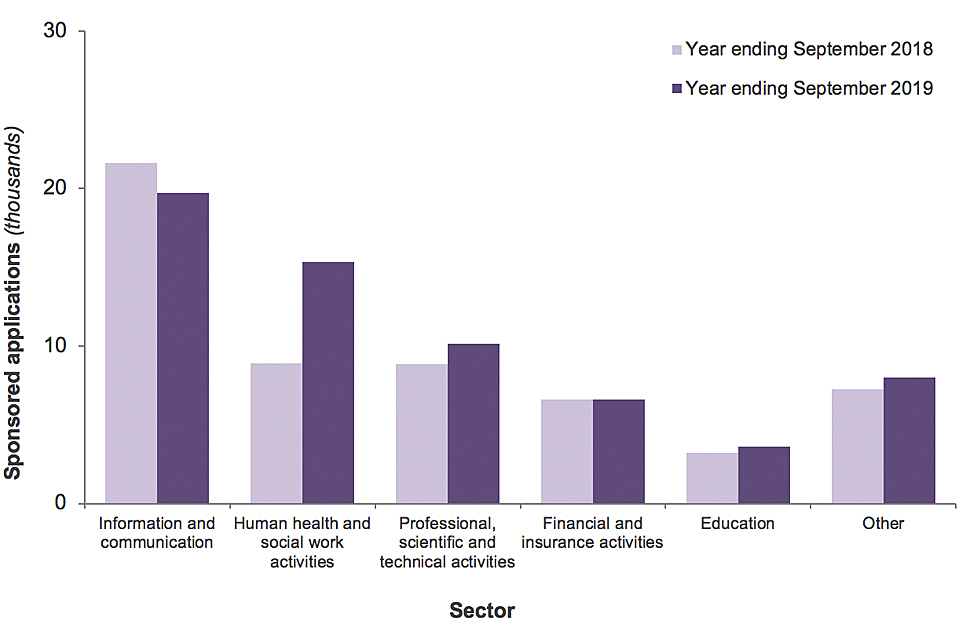
The chart shows the number of Tier 2 certificate of sponsorship applications by sector in the last two years.
1.2 Other work-related visas
In 2019, there was a 7% increase in High value (Tier 1) visas granted to 5,664; however, this category accounts for a small proportion of total Work visas. The majority (59%) of Tier 1 visas granted were ‘Entrepreneurs’ visas, which increased by 8% to 3,342. There was also a 50% increase in visas granted on the ‘Exceptional talent’ route to 1,176. This route has since been replaced by an expanded ‘Global Talent’ route in February 2020.
There was a 5% increase in Youth mobility and temporary worker (Tier 5) visas in 2019 to 43,576. The rise was due to the introduction of the temporary ‘Seasonal Workers Pilot’ scheme in March 2019, which accounted for 2,493 visas by the end of the year – close to the 2,500 cap. Of those granted a visa on the Seasonal Workers Pilot, 91% were Ukrainian nationals, which has led to more than a sevenfold increase in Tier 5 grants to Ukrainian nationals between 2018 and 2019, from 304 to 2,627.
The ‘Youth mobility’ route was the largest of all Tier 5 routes, accounting for 46% of the total, and remained broadly stable in 2019 following falls since 2016. More than 4 in 5 (81%) Youth mobility visas were granted to nationals of three countries – Australia (47%), New Zealand (18%) and Canada (16%).
2. About these statistics
The statistics in this section provide an indication of the number of people who have an intention to enter the UK for work reasons. This includes both highly-skilled non-EEA workers, investors and entrepreneurs, temporary workers, and those employed in sports, the arts and other sectors.
Entry clearance visas allow an individual to enter and stay in the UK within the period for which the visa is valid. EEA nationals do not require a visa to enter the UK.
Data in this section refer to the number of Entry clearance visas granted for work reasons within the period. If an individual was granted a visa more than once in a given period, this has been counted as multiple grants in the statistics. If an individual entered the UK multiple times within the period for which a visa was valid, this has been counted as one grant in the visa statistics.
The data do not show whether, or when, an individual arrived in the UK, what they did on arrival to the UK, or how long they stayed in the UK.
Year-on-year comparisons of the number of decisions can be affected by quarterly fluctuations in the data. These fluctuations can be examined in the quarterly data available in the published tables.
2.1 Tier 1 (High value)
Tier 1 of the PBS was phased in between February and June 2008 as a general route. However, from 2010, Tier 1 has focused on providing visas for ‘High value’ migrants only, including the exceptional talent route, investors and entrepreneurs.
The Tier 1 Entrepreneur route was closed to most new applicants in March 2019 and replaced by the non-PBS Innovator route.
The Tier 1 Graduate Entrepreneur route was closed to new applicants in July 2019 and replaced by the non-PBS Start-up route.
The Tier 1 Exceptional Talent route was closed to new applicants in February 2020 and replaced by the Tier 1 Global Talent route.
2.2 Tier 2 (Skilled)
Tier 2 of the PBS is the primary route for economic migration to the UK. Broadly, the route is for skilled workers from outside the EEA who have an offer of employment in the UK in an occupation classed as skilled to NQF6 or above.
Tier 2 was implemented in November 2008. There are four routes within Tier 2: General, Intra-company transfer, Minister of religion and Sportsperson.
2.3 Tier 5 (Youth mobility and temporary workers)
Tier 5 (Youth mobility and temporary workers) was implemented in November 2008 to provide a route for those coming to the UK for primarily non-economic reasons.
The Tier 5 Seasonal workers route was open to new applicants from January 2019.
2.4 Certificate of sponsorship (CoS)
Due to changes to the casework system in October 2019, for 2019 quarter 4 it has not been possible to break down the number of Certificates of Sponsorship (CoS) used in ‘out of country’ (visa) applications or ‘in-country’ (extension) applications. As a result, the latest available data relate to the year ending September 2019. The issue will affect the data provided in tables CoS_D01 and CoS_D02. These statistics will be updated in due course.
Applicants for visas (and extensions) for Tier 2 (Skilled) work and for Tier 5 (Youth mobility and temporary worker) must obtain a certificate of sponsorship (CoS) from a registered employer. Any organisation that wishes to sponsor a worker must be registered on the Home Office’s Register of Sponsors.
Tier 2 (General) is currently subject to a cap on the number of CoSs that can be allocated to employers for newly-hired employees earning less than £159,600 per year, or for dependants of Tier 4 Students who wish to switch into the Tier 2 ‘General’ category. The sponsor must apply for an allocation for these ‘restricted’ CoSs on a case-by-case basis to be considered at a monthly allocation meeting held by the Home Office. Details of the outcome of the monthly allocation process are published by UK Visas and Immigration (UKVI). On 15 June 2018, the government announced that doctors and nurses are to be excluded from the cap on Skilled worker visas.
Further information about the CoS allocation process is given in the user guide and on the UK visa sponsorship for employers section of GOV.UK.
2.5 Other sources
The Office for National Statistics (ONS) publishes long-term international migration (LTIM) estimates in its ‘Migration Statistics Quarterly Report’. The report includes estimates from the International Passenger Survey (IPS) on the number of people coming to the UK with the intention of staying for 12 months or more for work, study, family and other reasons. Estimates are available for EU, non-EU and British nationals. IPS data are not directly comparable with Home Office visa data for several reasons. See the ONS article ‘Comparing sources of international migration statistics’ for details.
3. Data tables
Data on immigration for work can be found in the following tables:
- Sponsorship summary tables
- Detailed sponsorship datasets
- Entry clearance visas summary tables
- Detailed Entry clearance visas datasets
- Admissions tables
- Extensions tables
- Detailed Extensions datasets
We welcome your feedback
If you have any comments or suggestions for the development of this report, please provide feedback by emailing MigrationStatsEnquiries@homeoffice.gov.uk. Please include the words ‘PUBLICATION FEEDBACK’ in the subject of your email.
See section 7 of the ‘About this release’ section for more details.