Summary of latest statistics
Published 24 August 2017

© Crown copyright 2017
This publication is licensed under the terms of the Open Government Licence v3.0 except where otherwise stated. To view this licence, visit nationalarchives.gov.uk/doc/open-government-licence/version/3 or write to the Information Policy Team, The National Archives, Kew, London TW9 4DU, or email: psi@nationalarchives.gov.uk.
Where we have identified any third party copyright information you will need to obtain permission from the copyright holders concerned.
This publication is available at https://www.gov.uk/government/statistics/immigration-statistics-april-to-june-2017/summary-of-latest-statistics
Immigration statistics April to June 2017 content page.
This is not the latest release. View latest release.
1. How many people come to the UK each year?
There were 133.3 million passenger arrivals in the year ending June 2017, including returning UK residents: a record number and an increase of 7.3 million compared to the year ending June 2016. This increase was divided between 5.0 million (+5% to 115.6 million) more arrivals by British, other EEA and Swiss nationals and 2.3 million by non-EEA nationals (+15% to 17.7 million). These numbers represent the number of occasions when a person entered the UK, not the number of distinct individuals.
The following flow chart illustrates the type and volume of entry clearance visas granted in the year ending June 2017. The data measure permissions to visit rather than confirmed arrivals.
Visas, year ending June 2017, thousands
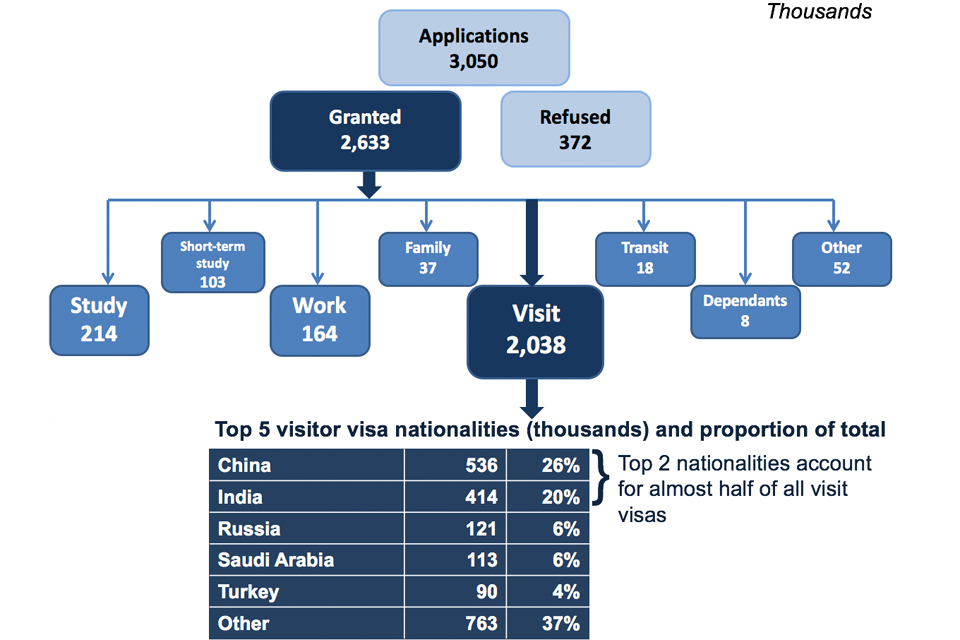
The chart shows the number and type of visas granted for the latest year available. The data are available in Visas tables vi 01 q and vi 06 q o.
Chart notes
Source: Home Office, Immigration Statistics April to June 2017, Visas table vi 01 q (Visas volume 1) and Visas table vi 06 q o (Visas volume 3).
For further details see ‘How many people come to the UK each year? and the data tables.
2. Why do people come to the UK?
2.1 To visit
In 2016, the number of non-EEA visitor arrivals increased by 0.7 million (7%) to 10.1 million. Over a quarter (26%) of all non-EEA visitor arrivals were United States (US) nationals.
A number of nationalities, including US nationals, do not normally require a visa to visit the UK. Consequently the number of Visitor visas granted is much lower than the total number of arrivals. Over 2.5 million visas were granted in the year ending June 2017 and, of these, over 2 million (77%) were to visit.
There were 150,225 (8%) more Visitor visas granted in the year ending June 2017. There were notable increases in Visitor visas granted to Chinese nationals, up by 103,929 (24%) to 536,125 (excluding Hong Kong), and Indian nationals, up 37,840 (10%) to 414,331.
For further details see ‘Why do people come to the UK? (1) To visit’ and the data tables.
2.2 To work
Including dependants, there were 92,805 Tier 2 Skilled work visas granted in the year ending June 2017, 1% lower than the previous year (93,980).
Of the 55,118 Tier 2 sponsored skilled work visa applications in the year ending June 2017, there was a 25% increase (1,091 more visas) in the Human health and social work activities sector, which is largely likely to reflect the addition of nurses to the government’s shortage occupation list in November 2015. The largest fall was in applications for the Professional, scientific and technical activities sector (-1,552; -14%).
For further details see the Work section and the data tables.
2.3 To study
Aside from visitors, the most common visa granted to non-EEA nationals was for study (8% of total visas granted to non-EEA nationals). In the year ending June 2017, there were 213,729 study-related visas granted, an increase of 4%.
In the year ending June 2017, there were increases for the three largest non-EEA student nationalities: Chinese (+17% to 82,200), United States (+1% to 14,400) and Indian (+10% to 11,700) nationals.
Over the same period, the number of university-sponsored study visa applications (main applicants) rose 5% to 170,929. Within the University sector there was a 9% increase for Russell Group universities to 82,521. There were falls for the Further education (-9% to 14,445) and Independent school (-6% to 12,895) sectors; however sponsored applications to English Language schools rose 20% to 2,940. Most of the fall in the Further education sector’s sponsored visa applications since the peak in mid-2011 was accounted for by licenses which have since been revoked.
Sponsored applications from students to study at universities in the UK are 19% higher in year ending June 2017 than in 2010. Use of Confirmation of Acceptance for Study (CAS) by sponsoring educational institutions became mandatory from February 2010, therefore comparisons with the calendar year 2010 should be viewed with caution.
Study-related sponsored visa applications by sector
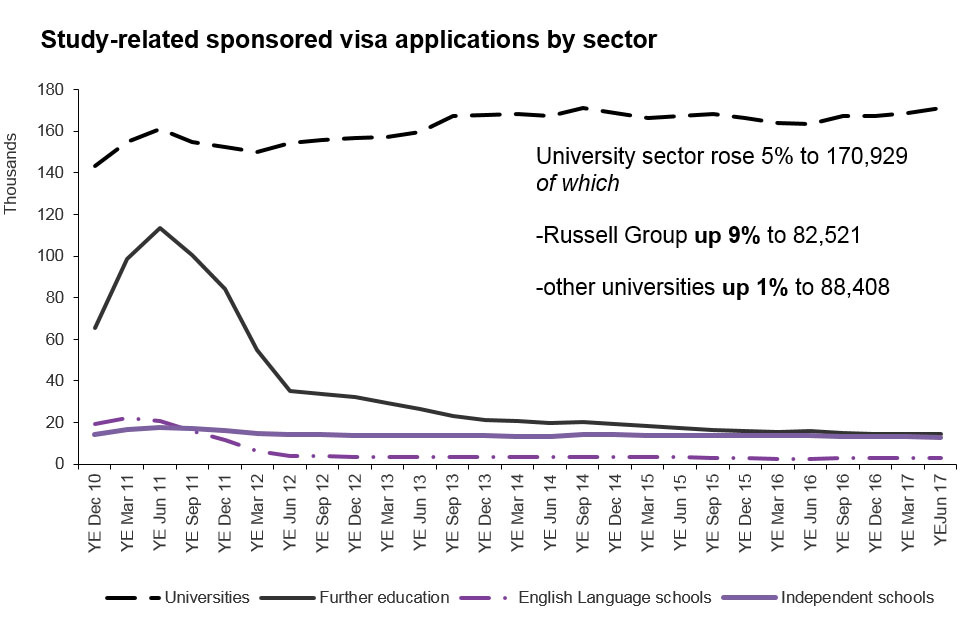
The chart shows the trends in confirmations of acceptance of studies used in applications for visas by the education sector since 2010 to the latest data available. The chart is based on data in Table cs 09 q.
Chart notes
Source: Home Office, Immigration Statistics April to June 2017, Sponsorship table cs 09 q.
‘Universities’ relate to UK-based higher education institutions.
‘Further education’ relates to tertiary, further education or other colleges.
In the year ending March 2017, the Office for National Statistics (ONS) estimates that there were 93,000 non-EU long-term immigrants coming to study and who had an intention to remain a year or more, an 18% fall (-20,000), which is statistically significant. There were also 37,000 non-EU former students departing, although they relate to different cohorts of students.
Over the same period, the number of long-term (1 year or more) study-related visas granted (main applicants) was 5% higher at 142,128. Although the trends in the long-term estimates and comparable visa numbers can differ, they are fairly close given the definitional differences and the inherent variation in the ONS survey based estimates.
For further details see the ‘Why do people come to the UK? (3) To study’ and the data tables.
2.4 For family reasons
The combined total number of family-related visas granted, including European Economic Area (EEA) family permits granted to non-EEA nationals, and visas granted to dependants of other visa holders (excluding visitors) fell by 6,400 (5%) to 130,569 in the year ending June 2017.
For further details see ‘Why do people come to the UK? (4) For family reasons’ and the data tables.
3. How many people do we grant asylum or protection to?
In the year ending June 2017, 16,211 people were granted asylum, resettlement or an alternative form of protection. There were 9,350 grants of asylum or an alternative form of protection following an in-country application, and an additional 6,861 people were provided with protection and support under a resettlement scheme in the UK. In total, this is a 7% increase from 15,108 in the previous year.
Of the 22,982 initial decisions on asylum applications from main applicants, 34% were grants of asylum or an alternative form of protection, compared to 38% in the previous year. A separate Home Office analysis shows that for the years 2013 to 2015, on average 37% of decisions were granted initially, but this figure rose to 52% after appeal.
There were 1,096 grants of asylum or an alternative form of protection to Syrian nationals at initial decision in the year ending June 2017 and an additional 5,637 Syrian nationals were granted humanitarian protection under the Vulnerable Persons Resettlement Scheme (VPRS). Since this scheme began in 2014, a total of 8,535 people have been resettled.
For further details see How many people do we grant asylum or protection to? and the data tables.
4. How many people continue their stay in the UK?
Depending on the conditions of entry or visa, individuals inside the UK may extend or change the status of their stay in the UK, or apply to stay permanently. There are a number of ways for people to extend their stay in the UK. This includes applying for a temporary visa extension, applying to stay permanently (also known as ‘settlement’) and applying for British citizenship.
Under European law, EEA nationals do not need to obtain documentation confirming their right of residence in the UK. However, EEA nationals and their non-EEA family members can apply in the UK for a registration certificate (issued to EEA nationals), residence card or derivative residence card (issued to non-EEA family members) to confirm rights of residence.
In the year ending June 2017, 145,433 documents certifying permanent residence and permanent residence cards were issued. This is the highest recorded annual figure and more than 5 times the figure for the previous 12 months (27,162).
Total applications for British citizenship fell by 11,225 (8%) to 135,912 in the year to June 2017 compared to the previous year, and 41% (96,350) lower than the peak in 2013 (232,262) but up on the corresponding figure of 131,558 for the year to March 2017. Applications made by non-EU nationals fell by 23,856 to 107,410, and applications by EU nationals rose by 12,631 (80%) to 28,502.
For further details see How many people continue their stay in the UK?.
5.How many people are detained or returned?
An individual may be held and remain in immigration detention for a variety of reasons, including reasons within and outside the control of the Home Office. In addition, the Home Office seeks to return people who do not have any legal right to stay in the UK.
As at the end of June 2017, 2,994 people were in immigration removal centres (IRCs), short-term holding facilities (STHFs) and pre-departure accommodation (PDA). In addition, as at 26 June 2017, there were 360 detainees held in prison establishments in England and Wales solely under immigration powers.
The proportion of detainees being returned or voluntarily departing from the UK on leaving detention increased from 44% in year ending June 2016 to 48% in year ending June 2017.
The total number of enforced returns from the UK, including those not directly from detention, decreased by 3% to 12,542 in the year ending June 2017 compared with 12,944 in the previous year.
In the year ending June 2017, provisional data show that 6,071 Foreign National Offenders (FNOs) were returned compared to 6,064 in the previous year (see Returns table rt_06q). This is the one of the highest number since the series began in 2009 and reflects increasing use of other forms of FNO returns, including those where an offence was committed outside the UK.
For further details see How many people are detained or returned? and the data tables.