Why do people come to the UK? (3) To study
Published 24 August 2017

© Crown copyright 2017
This publication is licensed under the terms of the Open Government Licence v3.0 except where otherwise stated. To view this licence, visit nationalarchives.gov.uk/doc/open-government-licence/version/3 or write to the Information Policy Team, The National Archives, Kew, London TW9 4DU, or email: psi@nationalarchives.gov.uk.
Where we have identified any third party copyright information you will need to obtain permission from the copyright holders concerned.
This publication is available at https://www.gov.uk/government/statistics/immigration-statistics-april-to-june-2017/why-do-people-come-to-the-uk-3-to-study
Immigration statistics April to June 2017 content page.
This is not the latest release. View latest release.
Data relate to the year ending June 2017 and all comparisons are with the year ending June 2016, unless indicated otherwise.
This section includes figures on study visas granted to non-European Economic Area (EEA) nationals. It also includes estimates of non-EU long-term immigration to study (i.e. those intending to stay for at least 12 months to work).
According to the latest figures from the Organisation for Economic Co-operation and Development (OECD), Education at a Glance 2016, the UK maintained the second largest international student market share behind the USA. In addition, Home Office figures show that, after visitors, study is the most common reason for visas granted to non-EEA nationals.
Home Office figures in this section relate to study visa applications and grants for non-EEA nationals.
The Higher Education Statistics Agency, publishes data on new entrants to UK higher education providers. The ONS publish figures on long-term immigration to study (i.e. those intending to stay for at least 12 months to study) for EU and non-EU nationals. ONS data is published in the Migration Statistics Quarterly Report.
1. Key facts
Aside from visitors, the most common visa granted was for study (8% of all visas granted).
In the year ending June 2017, there were 213,729 study-related visas granted, excluding the unsponsored Short-term student category (formerly known as Student visitors), an increase of 4% (8,914). Over the same period, the number of university-sponsored study visa applications (main applicants) rose 5% to 170,929. Within the University sector there was a 9% increase for Russell Group universities to 82,521. There were falls for the Further Education (-9% to 14,445) and Independent school (-6% to 12,895) sectors; however English Language schools rose (20% to 2,940) Most of the fall in the Further Education sector’s sponsored visa applications since the peak in mid-2011 was accounted for by licenses which have since been revoked.
In the year ending March 2017, the Office for National Statistics (ONS) estimates that there were 93,000 non-EU long-term immigrants coming to study and who had an intention to remain a year or more, an 18% fall (-20,000), which is statistically significant. There were also 37,000 non-EU former students departing, although they relate to different cohorts of students.
Five non-EU nationalities accounted for the majority (59%) of the 213,729 study-related visas granted in the year ending June 2017, with the largest number going to Chinese nationals (82,241 or 38% of the total). There were higher numbers of study visas granted for Chinese (+12,060 or +17%), India (+1,040; +10%), Pakistan (+850; +29%); Kuwait (+548; +22%) and Indonesian (+529; +20%) nationals; and fewer issued to Nigerian (-2,135; -25%), Malaysian (-1,497; -16%), Brazilian (-1,270; -62%) nationals.
There were 250,000 Short-term student category admissions in the calendar year 2016, much higher than the numbers of Short-term student category visas granted (87,353 over the same period). This was due to many Short-term student admissions being from nationalities who were not required to obtain a visa if they wished to come to the UK as a Short-term student for up to a maximum of 6 months. Slightly less than half (46%) of the Short-term student admissions are accounted for by US nationals (115,000) who do not require a visa for these short visits.
2. Study immigration: latest trends
| Year ending June 2016 | Year ending June 2017 | Change | Percentage change | |
|---|---|---|---|---|
| Study-related visas granted, excluding Short-term students (1) | 204,815 | 213,729 | +8,914 | +4% |
| of which (Top 5): | ||||
| China | 70,181 | 82,241 | +12,060 | +17% |
| United States | 14,241 | 14,408 | +167 | +1% |
| India | 10,662 | 11,702 | +1,040 | +10% |
| Hong Kong | 9,067 | 9,059 | -8 | -0% |
| Saudi Arabia | 8,678 | 8,532 | -146 | -2% |
| Short-term study visas (1) (main applicants only) | 82,504 | 103,456 | +20,952 | +25% |
| Year ending March 2016 | Year ending March 2017 | Change | Percentage change | |
|---|---|---|---|---|
| Long-term immigration for study, excluding dependants (2) | 113,000 | 93,000 | -20,000 | -18% |
| Long-term (1 year or more) study-related visas, excluding dependants | 135,623 | 142,128 | +6,505 | +5% |
Table notes
Source: Home Office, Immigration Statistics April to June 2017, Visas table vi 04 q and Visas table vi 06 q s, International Passenger Survey, Office for National Statistics, Migration Statistics Quarterly Report Statistical bulletins.
(1) The Short-term study category (previously described as Student visitor) allows individuals to come to the UK for 6 months (or 11 months if they will be studying an English Language course) and cannot extend their stay (further details at Short-term study visa). For consistency and comparability over time Short-term study visas have been excluded from study-related totals.
(2) The fall of 20,000 in non-EU study-related immigration for the year ending March 2017 had an estimated confidence interval of +/-20,000.
(3) Immigration for study data are estimates of the number of non-EU nationals intending to change their residence to the UK for at least 12 months based on the International Passenger Survey.
3. Long-term trends in student immigration
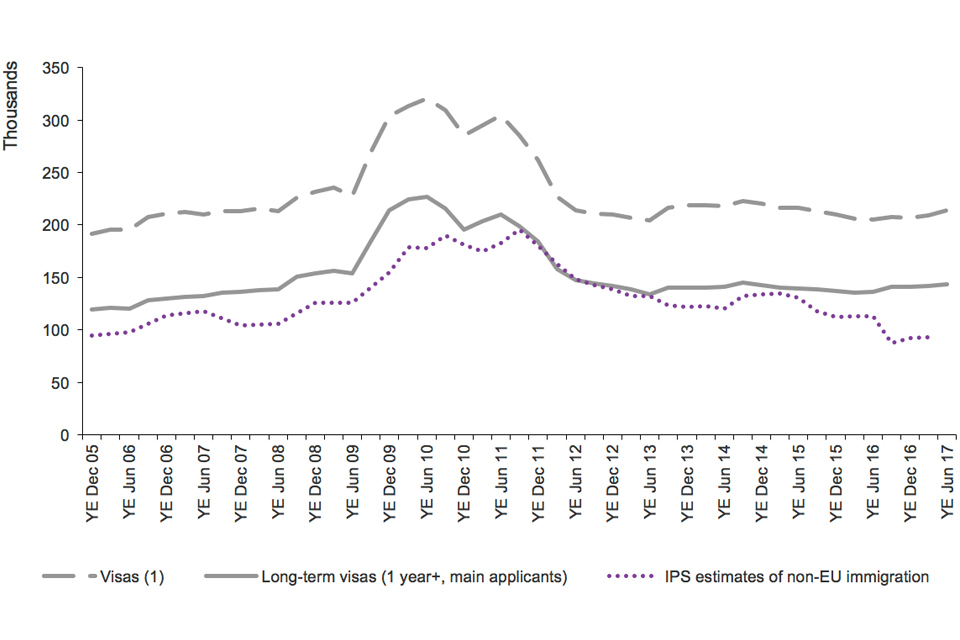
The chart shows the trends for study of visas granted and International Passenger Survey (IPS) estimates of non-EU immigration, between 2005 and the latest data published. The data are sourced from Table vi 04 q and corresponding datasets.
Chart notes
Source: Home Office, Immigration Statistics April to June 2017, Table vi 04 q (Visas volume 1) and corresponding datasets; Office for National Statistics, Population and migration.
(1) Excludes Short-term students (previously referred to as Student visitors) who are allowed to come to the UK for 6 months (or 11 months if they will be studying an English Language course) and cannot extend their stay. A proportion of Tier 4 student visas are also short-term (under 1 year), see ‘Entry clearance visas by length’, but are not included within the Short-term students category.
The above chart shows that IPS long-term immigration estimates, while being substantially lower as they cover only those intending to remain a year or more, have followed a broadly similar trend to student visas granted and passenger arrivals over the longer-term.
There are a range of potential reasons why IPS figures for long-term migrants may be different from figures for study visas granted or passenger arrivals, and hence why the trends in the different series do not match, including:
- sampling variation in the IPS (for example, the fall of 20,000 in study-related immigration for the year ending March 2017 had an estimated confidence interval of +/-20,000)
- IPS data for study relate to individuals whose main reason for migration was study so (unlike visas data) are likely to exclude their dependants; IPS data are likely to be more comparable with visa totals for main applicants than with the total for all study-related visas (e.g. including dependants)
- differences between intentions and visa length
- individuals may migrate for multiple different reasons
- timing differences between when visas are granted and when an individual actually travels
- visa and admissions data include dependants, and both short-term and long-term migrants.
Further comparison of the data is described in the ONS publication, ‘International student migration - what do the statistics tell us?’ and the user guide.
4. Register of sponsoring educational institutions
On 3 July 2017, there were 1,282 educational institutions on the UK Visas and Immigration register of sponsoring educational institutions. This was eight fewer than the number on 3 April 2017 (1,290), and 7% lower than a year earlier when on 30 June 2016 there were 1,380 institutions on the register. This continues the reduction in numbers seen since the published series began in October 2011 (2,370). The long-term reduction in the number of sponsoring educational institutions is consistent with the introduction of new accreditation criteria and conditions of status for educational sponsors from April 2011, as well as the removal from the list of sponsors of organisations which have since ceased operation.
5. Sponsored study visa applications by education sector
The number of study-related sponsored visa applications (main applicants) rose 3% in the year ending June 2017 to 203,816, compared with the previous 12 months (197,974). There was a rise in sponsored visa applications for the university sector as a whole (to 170,929; +5%), this included a 9% increase for Russell Group universities to 82,521 and a 1% rise for other universities to 88,408. There were falls in the Further Education (to 14,445, -9%) and Independent school (to 12,895; -6%) sectors; but a rise in English Language schools (to 2,940, +20%) sector.
Sponsored applications from students to study at universities in the UK are 19% higher in year ending June 2017 than in 2010. Use of Confirmation of Acceptance for Study (CAS) by sponsoring educational institutions became mandatory from February 2010, therefore comparisons with the calendar year 2010 should be viewed with caution.
Study-related sponsored visa applications by sector
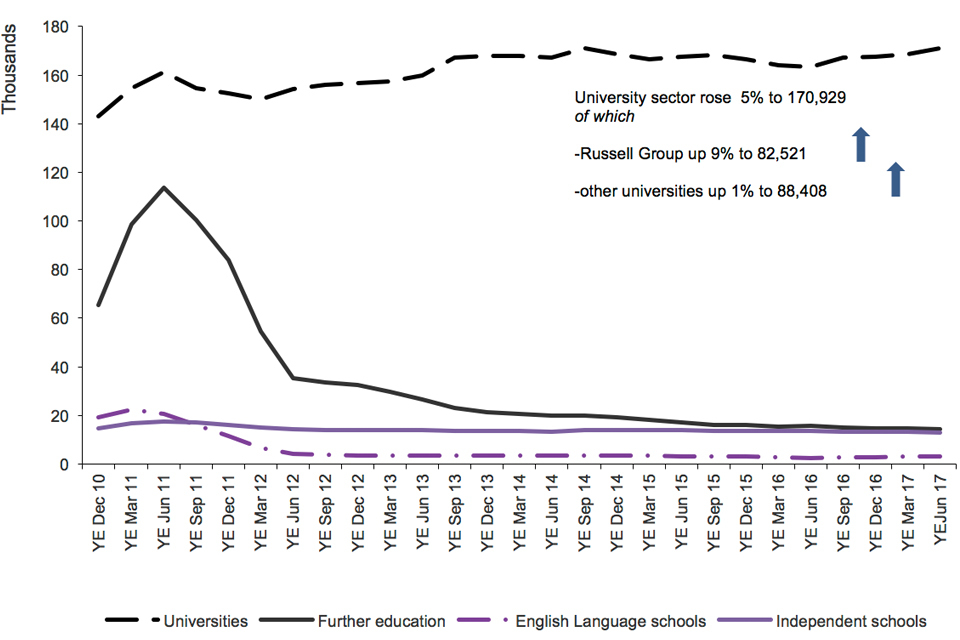
The chart shows the trends in confirmations of acceptance of studies used in applications for visas by education sector since 2010 to the latest data available. University sector rose 5% to 170,929. The chart is based on data in Table cs 09 q.
Chart notes
Source: Home Office, Immigration Statistics April to June 2017, Sponsorship table cs 09 q.
‘Universities’ relate to UK-based Higher Education Institutions.
‘Further education’ relates to tertiary, further education or other colleges.
5.1 New entrants to UK Higher Education
In separate statistics published by the Higher Education Statistics Authority (HESA), it has been previously reported that between the 2014/15 and 2015/16 academic years the number of non-EU new entrants to universities decreased by 1% (to 172,910 students). The number of UK new entrants increased by 1% (to 760,635), whilst other EU new entrants increased by 2% (to 59,100) in the same year.
Over the last five years, comparing 2015 to 2016 with 2010 to 2011 in the HESA data, the total number of non-EU students was 1% lower, compared to a reduction of 16% for UK students and 10% other EU students (source: HESA), ’ Higher education student enrolments and qualifications obtained at higher education providers in the United Kingdom 2015/16’.
6. Immigration for study, and emigration of former students
In the year ending March 2017, the Office for National Statistics (ONS) estimates that there were 93,000 non-EU long-term immigrants coming to study and who had an intention to remain a year or more, an 18% fall (-20,000), which is statistically significant. There were also 37,000 non-EU former students departing, although they relate to different cohorts of students.
Over the same period, the number of long-term (1 year or more) study-related visas granted (main applicants) was 5% higher at 142,128. Although the trends in the long-term estimates and comparable visa numbers can differ, they are fairly close given the definitional differences and the inherent variation in the ONS survey based estimates.
The Office for National Statistics (ONS) has published additional analyses of data relating to student migration that compares these figures with those derived from Home Office exit checks, this indicating that estimates for emigration of former students are some way below exit checks estimates for the number of students who leave at the end of their studies.
Source: ONS, International Passenger Survey, Migration Statistics Quarterly Report Statistical bulletins.
7. Short-term students
The Short-term student category (previously referred to as Student visitors) includes significant numbers admitted for up to 6 months as non-visa nationals without a visa in order to study shorter courses. Visas are granted for a maximum of 6 months in duration or in a very small number of cases for 11 months if studying an English Language course. Short-term students are not counted as long-term migrants and cannot extend their stay, so they are not included within the references to study visas in this section. Additionally some students in the study category (Tier 4 of the Points Based System) have short-term visas (under 1 year), see ‘Entry clearance visas by length’, but are not included within the Short-term students category.
There were 250,000 Short-term student admissions in the calendar year 2016, much higher than the numbers of student visitor visas granted (87,353 over the same period). This is due to many student visitor admissions being from nationalities who are not required to obtain a visa if they wish to come to the UK as a short-term student for up to a maximum of 6 months. Slightly less than half (46%) of the short-term student admissions are accounted for by US nationals (115,000) who do not require a visa for these short visits. Other non-visa countries using the Short-term student admission route in 2016 include Japan (11,600) and Brazil (8,740).
The number of Short-term student visas granted rose by 25% to 103,456 in the year ending June 2017. The majority of the increase was to Chinese (+ 7,859, or +50%); Russian (+ 7,497, or +78%) and Turkish (+ 1,351,or +12%) nationals. For further information on short-term students see Short-term study visa and the Home Office research report, “Student visitors’.
8. Staying on in the UK
Analysis of administrative records for migrants granted visas in 2010 have been published in the ‘Statistics on changes in migrants’ visa and leave status: 2015’ report and this shows that around one fifth (19%) of migrants issued a study visa in 2010 still had valid leave to remain in the UK or had been granted settlement 5 years later. This proportion has decreased from 31% of those issued a study visa in 2004. Nonetheless, 29% of the total grants of settlement in 2015 were issued to people who had originally come to the UK on a student visa.
The proportion of migrants who gained settlement within 5 years of entering on a study visa also decreased over the same period. For people issued a study visa in 2004, 4% had gained settlement 5 years later, compared with just 1% of those issued a study visa in 2009.
These changes are consistent with the tightening of the Immigration Rules for students since September 2007. They may also be partly related to the economic recession that occurred towards the end of the period analysed here, which may have reduced the incentive for students to remain and seek work in the UK. The study group reported on here excludes student visitor visas that cannot be extended and normally only have validity of 6 months or, in some cases, up to 11 months.
Source: Home Office, ‘Statistics on changes in migrants’ visa and leave status: 2015’ report.
9. Data tables
Data on student immigration, sourced from Home Office administrative systems, can be found in the following tables:
Sponsorship tables
Visas tables volume 1
Visas tables volume 2
Visas tables volume 3
Admissions tables
Extensions tables