How many people continue their stay in the UK?
Published 24 August 2017

© Crown copyright 2017
This publication is licensed under the terms of the Open Government Licence v3.0 except where otherwise stated. To view this licence, visit nationalarchives.gov.uk/doc/open-government-licence/version/3 or write to the Information Policy Team, The National Archives, Kew, London TW9 4DU, or email: psi@nationalarchives.gov.uk.
Where we have identified any third party copyright information you will need to obtain permission from the copyright holders concerned.
This publication is available at https://www.gov.uk/government/statistics/immigration-statistics-april-to-june-2017/how-many-people-continue-their-stay-in-the-uk
Immigration Statistics April to June 2017 content page.
This is not the latest release. View latest release.
Data relate to the year ending June 2017 and all comparisons are with the year ending June 2016, unless indicated otherwise.
This section relates to people extending their temporary stay in the UK, staying permanently (settlement) and applying for British citizenship. It also covers residence documentation issued to EEA nationals and their family members.
1. Key facts
There were 36,946 or 15% fewer decisions on extensions in the year ending June 2017. Of the 211,796 decisions, 91% were grants (192,577) and 9% (19,219) were refusals.
There were 57,553 people granted permission to stay permanently in the year ending June 2017, 16% or 10,834 fewer than the previous year. The number of grants is low relative to the peak number of grants in the year ending September 2010 (241,586).
In the year ending June 2017, 145,433 documents certifying permanent residence and permanent residence cards were issued. This is the highest recorded annual figure and more than 5 times the figure for the previous 12 months (27,162).
Total applications for British citizenship fell by 11,225 (8%) to 135,912 in the year to June 2017 compared to the previous year, and 41% (96,350) lower than the peak in 2013 (232,262) but up on the corresponding figure of 131,558 for the year to March 2017. Applications made by non-EU nationals fell by 23,856 to 107,410, and applications by EU nationals rose by 12,631 (80%) to 28,502.
2. Extension grants
Extensions of stay relate to individuals inside the UK extending or changing the status of their stay in the UK. An individual is required to apply for an extension or change in status before their existing permission to enter or stay expires.
There were 36,946 or 15% fewer decisions on extensions in the year ending June 2017. Of the 211,796 decisions, 91% were grants (192,577) and 9% (19,219) were refusals. There were 1% increases in grants for both work and family reasons, but a 26% fall in extensions for study reasons and 22% for other reasons.
Grants of extensions by reason, and refusals
| Year | Total decisions | Total grants | Work | Study | Family (1) | Other (1) | Refusals |
|---|---|---|---|---|---|---|---|
| Year ending June 2013 | 348,484 | 291,814 | 145,904 | 100,470 | 30,788 | 14,652 | 56,670 |
| Year ending June 2014 | 328,176 | 255,713 | 92,032 | 96,249 | 36,742 | 30,690 | 72,463 |
| Year ending June 2015 | 282,214 | 228,237 | 83,874 | 70,149 | 40,005 | 34,209 | 53,977 |
| Year ending June 2016 | 248,742 | 209,957 | 78,180 | 55,489 | 56,001 | 20,287 | 38,785 |
| Year ending June 2017 | 211,796 | 192,577 | 79,146 | 40,908 | 56,715 | 15,808 | 19,219 |
| Change: latest 12 months | -36,946 | -17,380 | 966 | -14,581 | 714 | -4,479 | -19,566 |
| Percentage change | -15% | -8% | +1% | -26% | +1% | -22% | -50% |
Table notes
Source: Home Office, Immigration Statistics April to June 2017, Extensions table ex 01 q.
(1) The introduction of the new Family life (10-year) route in July 2012 ‘Statement of intent: Family Migration’ means that the total number of family and other category grants are not fully comparable over time.
Additional detailed analysis on extension grants in 2016 by previous category of leave were included in the Immigration Statistics January to March 2017 release How many people continue their stay in the UK? Topic.
Long-term trends in grants of extensions of stay
The chart below illustrates longer-term trends in grants to extend stay by calendar year from 2008 to 2016.
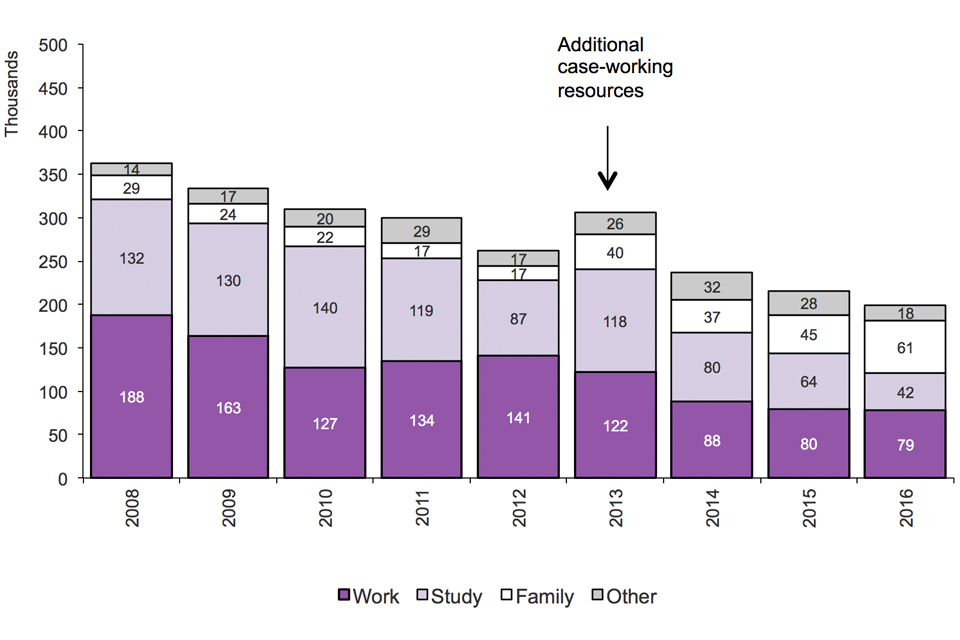
The chart shows grants and refusals of an extension of stay between 2005 and the latest calendar year. Additional case-working resources in 2013. The chart is based on data in Table ex 01.
Chart notes
Source: Home Office, Immigration Statistics April to June 2017, Extensions table ex 01.
The fall in work-related grants of extensions partly reflect falls in two categories that had been closed to new entrants: Tier 1 General and Tier 1 Post-Study. These falls have been partly offset by an increase in Tier 2 Skilled work.
The falls in study-related grants of extensions are likely to reflect previous falls in the numbers granted visas, together with tightening of the rules, such as the use of the ‘genuineness’ test.
Family-related grants of extensions have risen. The latest increases are likely to reflect a longer residence eligibility period before it was possible to apply to stay in the UK permanently (settlement), and a requirement to obtain an extension after 2.5 years, both implemented under new family Immigration Rules from 9 July 2012.
3. Nationalities granted an extension
(excludes dependants)
Top 5 nationalities granted an extension to stay, 2016
(Total number of grants 152,044, excludes dependants)
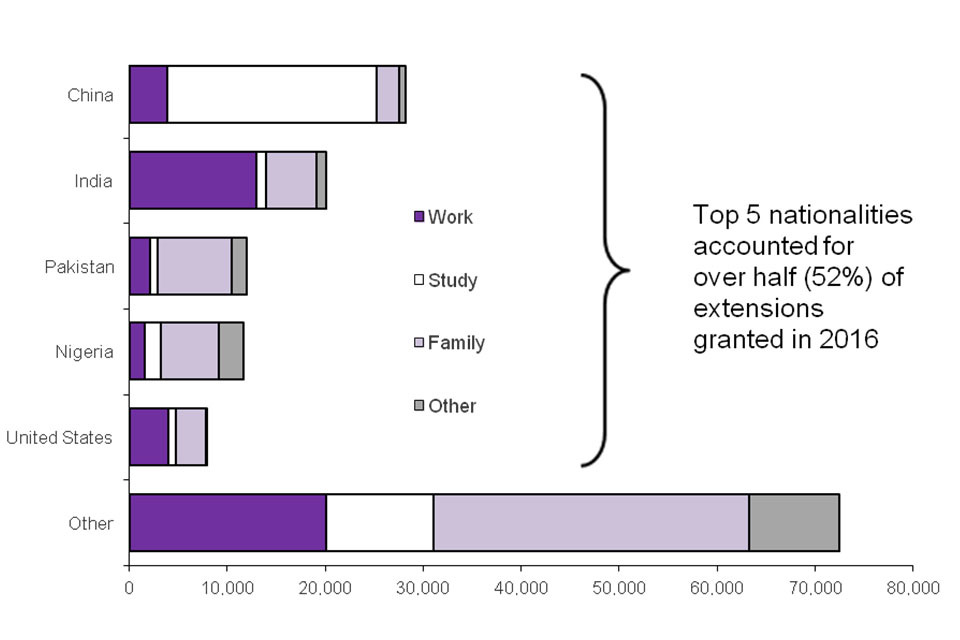
The chart shows grants of extension of stay by nationality in 2016. Top 5 nationalities accounted for over half (52%) of extensions granted in 2016. The chart is based on data in Table ex 02.
Chart notes
Source: Home Office, Immigration Statistics April to June 2017, Extensions table ex 02.
4. Settlement grants and refusals
Settlement relates to people, subject to immigration control, given permission to stay permanently in the UK. The number of years an individual must have been here in the UK before they can apply for settlement varies depending on the type of visa currently held. Those granted settlement are able to, without restriction: work or study; travel into and out of the UK; access state benefits; and register their UK-born child as a British citizen. It does not entitle the person to a British passport (which requires British citizenship) or to vote in general elections, which requires Commonwealth or Irish Republic citizenship.
There were 57,553 people granted permission to stay permanently in the year ending June 2017, 16% fewer than the previous year. The majority of the decrease was accounted for by a fall in work grants (by 45% or -14,139). There were falls in grants to Tier 1 High-value individuals (by 10,524 to 4,894) and in the Tier 2 Skilled work category (by 2,983 to 9,488).These decreases are likely in part to reflect changes in the Immigration Rules. For details see the Policy and legislative changes affecting migration to the UK: timeline.
Family-related grants of permission to stay permanently fell by 3,548 (42%) to 4,993 in the year ending June 2017. This continues the overall downward trend since the year ending March 2010 (75,852). The latest decreases are likely in part to reflect changes to the family Immigration Rules in July 2012. For details see the Family section of the User Guide to Home Office Immigration Statistics.
Grants to stay permanently for other reasons rose by 7,200 (+55%) to 20,344 but remain significantly lower than in 2010 (82,686).
Grants to stay permanently by reason, and refusals
| Year ending | Total decisions | Total grants | Work | Asylum | Family | Other | Refusals |
|---|---|---|---|---|---|---|---|
| Year ending June 2013 | 159,131 | 154,174 | 60,994 | 20,860 | 60,286 | 12,034 | 4,957 |
| Year ending June 2014 | 125,704 | 119,095 | 48,459 | 14,806 | 41,228 | 14,602 | 6,609 |
| Year ending June 2015 | 109,448 | 104,978 | 40,935 | 20,856 | 27,696 | 15,491 | 4,470 |
| Year ending June 2016 | 74,349 | 68,387 | 31,582 | 15,120 | 8,541 | 13,144 | 5,962 |
| Year ending June 2017 | 61,575 | 57,553 | 17,443 | 14,773 | 4,993 | 20,344 | 4,022 |
| Change: latest 12 months | -12,774 | -10,834 | -14,139 | -347 | -3,548 | +7,200 | -1,940 |
| Percentage change | -17% | -16% | -45% | -2% | -42% | +55% | -33% |
Table notes
Source: Home Office, Immigration Statistics April to June 2017, Settlement table se 02 q.
These year-on-year comparisons of decisions numbers can be affected by changes in case-work resource allocation. Such fluctuations can be examined in more detail in the quarterly data that are also available in the published tables.
Long-term trends in grants to stay permanently
The chart below illustrates longer-term trends in grants to stay permanently for the calendar years back to 2004.
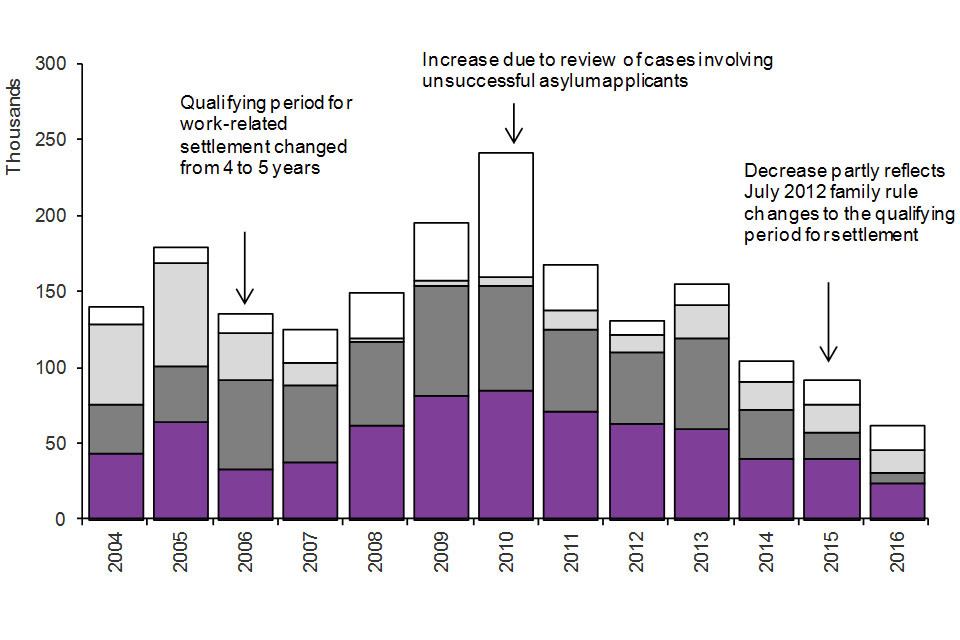
The chart shows the number of people granted settlement by calendar year from 2004. The data are available in Table se 02.
Chart notes
Source: Home Office, Immigration Statistics April to June 2017, Settlement table se 02.
5. Nationalities granted permission to stay permanently
Of the total 60,670 grants of permission to stay permanently in 2016, over a third (36% or 21,619) were to nationals of South Asia (with India and Pakistan accounting for 9,956 and 7,024 of grants, respectively) and over a fifth (22% or 13,578) were to nationals of Sub-Saharan Africa (with Nigeria accounting for 3,319 grants).
Top 5 nationalities granted permission to stay permanently, 2016
(Total number of grants: 60,670, includes dependants)
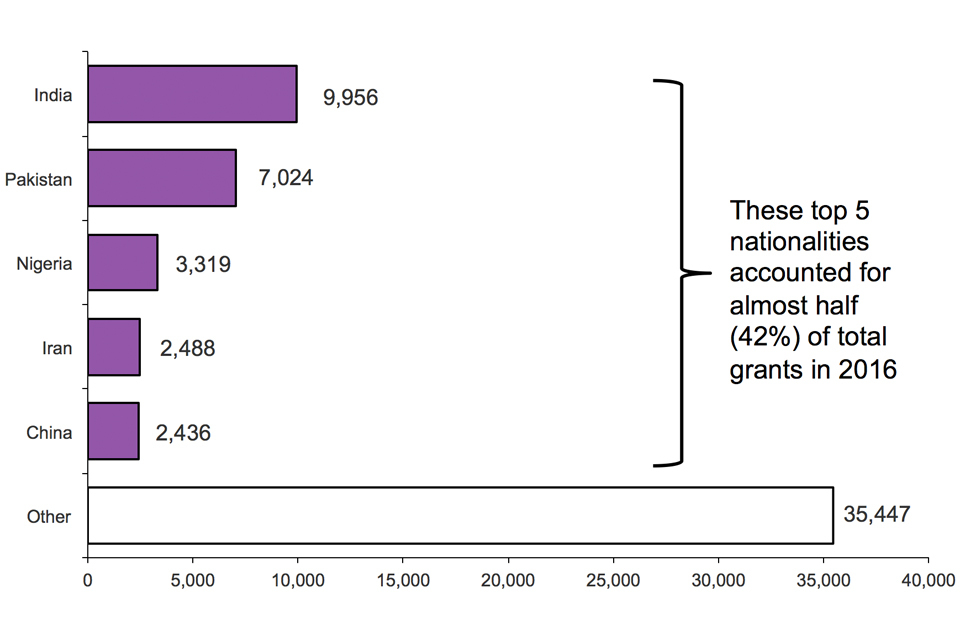
The chart shows grants of settlement by nationality in 2016. These top 5 nationalities accounted for almost half (42%) of total grants in 2016. The chart is based on data in Table se 03.
Chart notes
Source: Home Office, Immigration Statistics April to June 2017, Settlement table se 03.
6. EEA nationals and their family members
Under European law, EEA nationals do not need to obtain documentation confirming their right of residence in the UK.
EEA nationals and their family members can apply for documents certifying permanent residence and permanent residence cards, as confirmation of a right of permanent residence in the UK. There is no need to apply for a residence card as a family member but it can:
- help residence card holders to re-enter the country more quickly and easily if travelling abroad
- show employers that residence card holders are allowed to work in the UK
- help prove residence card holders qualify for certain benefits and services
EEA nationals only need to apply for a permanent residence document if they want to either:
- apply for British citizenship
- sponsor their partner’s visa application under the Immigration Rules
After 12 November 2015, a person applying for citizenship who is claiming to have permanent residence as an EEA national or the family member of an EEA national has been required to provide a permanent residence card or a document certifying permanent residence as evidence that they meet the requirement to be free of immigration time restrictions. These rule changes, along with EEA national’s response to recent events, have resulted in a steep increase in demand for EEA residence documentation during 2016 and the first half of 2017.
In the year to June 2017, a total of 341,992 decisions were made in applications for residence and additionally for permanent residence documents from EEA nationals and their non-EEA family members. Taken together this is almost 3 times the number in the previous 12 months (115,844).
Within this total there were 111,386 issues of registration certificates and registration cards made, more than double the previous 12 months (47,528). This is the highest recorded annual figure. Most of the rise is attributed to EU nationals (76,857 certificates issued, up 54,317) rather than non-EEA family members (34,529 registration cards issued, up 9,541).
Issue of EEA residence documents, EU and non-EU nationals
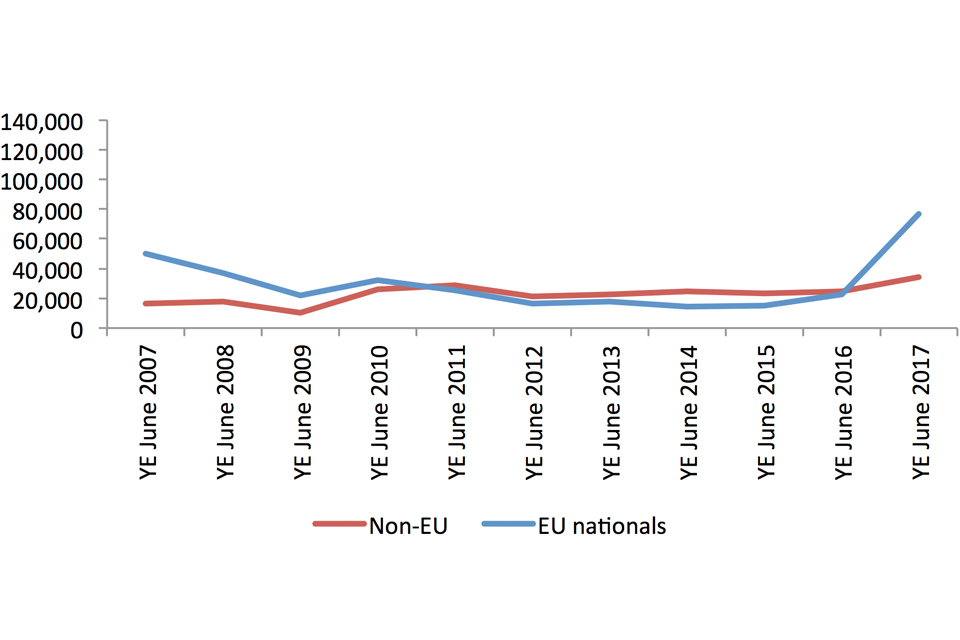
The chart shows Issue of EEA residence documents to EU and non-EU nationals. The chart is based on data in Table ee 02 q.
Chart notes
Source: Home Office, Immigration Statistics April to June 2017, European Economic Area table ee 02_q.
Also in the year ending June 2017, 145,433 documents certifying permanent residence and permanent residence cards were issued. The majority of these (90%; 130,434) were issued to EU nationals. This is the highest recorded annual figure and more than 5 times the figure for the previous 12 months (27,162).
Issue of EEA permanent residence documents, EU and non-EU nationals
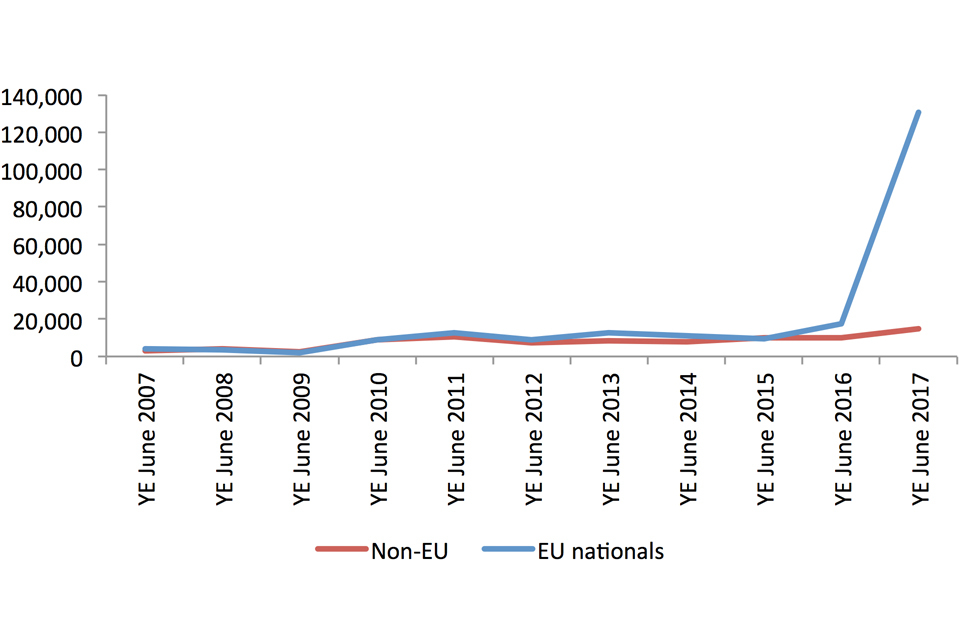
The chart shows Issue of EEA residence documents to EU and non-EU nationals. The chart is based on data in Table ee 02 q.
Chart notes
Source: Home Office, Immigration Statistics April to June 2017, European Economic Area table ee 02_q.
7. Citizenship grants and refusals
There are different ways to become a British citizen. The most common is called ‘naturalisation’. To apply for British citizenship by naturalisation you must usually have:
- lived in the UK for at least the 5 years before the date of your application
- spent no more than 450 days outside the UK during those 5 years
- spent no more than 90 days outside the UK in the last 12 months
- had settlement in the UK for the last 12 months if you are from outside the European Economic Area (EEA)
- had permanent residence status for the last 12 months if you are a citizen of an EEA country
- not broken any immigration laws while in the UK
There are different requirements if your spouse or civil partner is a British citizen.
Total applications for British citizenship fell by 11,225 (8%) to 135,912 in the year to June 2017 compared to the previous year, and 41% (96,350) lower than the peak in 2013 (232,262). Within the total, applications made by non-EU nationals fell by 23,856 to 107,410, and applications by EU nationals rose by 12,631 (80%) to 28,502.
Applications for citizenship, EU and non-EU nationals
| Year ending | Total applications | Non-EU | EU nationals | EU nationals as % of total |
|---|---|---|---|---|
| Year ending June 2012 | 191,698 | 182,285 | 9,413 | 5% |
| Year ending June 2013 | 187,335 | 173,786 | 13,549 | 7% |
| Year ending June 2014 | 193,282 | 174,308 | 18,974 | 10% |
| Year ending June 2015 | 137,680 | 124,057 | 13,623 | 10% |
| Year ending June 2016 | 147,137 | 131,266 | 15,871 | 11% |
| Year ending June 2017 | 135,912 | 107,410 | 28,502 | 21% |
| Change: latest year | -11,225 | -23,856 | +12,631 | |
| Percentage change | -8% | -18% | +80% |
Table notes
Source: Home Office, Immigration Statistics April to June 2017, Citizenship table cz 01 q a.
Series are based on current EU membership, i.e. Croatians included in EU total throughout.
See Citizenship table cz 01 q a and the User Guide to Home Office Immigration Statistics for more details.
Increases in applications from EU nationals in recent years are likely to reflect immigration in earlier years while the most recent rise may be partly due to the impact of rule changes and recent events.
| Geographical region | 2015 Q3 | 2015 Q4 | 2016 Q1 | 2016 Q2 | 2016 Q3 | 2016 Q4 | 2017 Q1 | 2017 Q2 |
|---|---|---|---|---|---|---|---|---|
| *Total EU | 4,235 | 5,418 | 2,978 | 3,240 | 4,130 | 5,112 | 9,547 | 9,713 |
| EU 14 | 1,561 | 1,688 | 1,141 | 1,356 | 2,059 | 2,334 | 4,790 | 4,738 |
| EU 2 | 782 | 1,147 | 616 | 572 | 632 | 855 | 1,522 | 1,401 |
| EU 8 | 1,825 | 2,508 | 1,184 | 1,255 | 1,384 | 1,852 | 3,130 | 3,475 |
| EU Other | 67 | 75 | 37 | 57 | 55 | 71 | 105 | 99 |
| Other regions | 30,133 | 35,553 | 38,165 | 27,415 | 25,280 | 24,670 | 32,164 | 25,296 |
| Total all regions | 34,368 | 40,971 | 41,143 | 30,655 | 29,410 | 29,782 | 41,711 | 35,009 |
Table notes
Source: Home Office, Immigration Statistics April to June 2017, Citizenship table cz 01 q a.
Series are based on current EU membership, i.e. Croatians included in EU total throughout.
See Citizenship table cz 01 q a and the User Guide to Home Office Immigration Statistics for more details.
Applications received from nationals of most EU states increased in the latter half of 2015, particularly in the fourth quarter, possibly due to people anticipating a change in the rules. After 12 November 2015, a person applying for citizenship who is claiming to have permanent residence as an EEA national or the family member of an EEA national has been required to provide a permanent residence card or a document certifying permanent residence as evidence that they meet the requirement to be free of immigration time restrictions, and this may have reduced numbers eligible to apply in the first half of 2016.
The increase in applications from both non-EU and EU nationals in the first quarter of 2017 may also partly reflect people anticipating increases in nationality fees from 6 April 2017.
In the year to June 2017 the largest increase in applications from EU nationals was from Poland (up 44% to 6,179 - included in EU 8) while applications from nationals of Romania (included in EU 2) increased to 2,713 and Italy, France and Germany (included in EU 14) increased to 2,950, 2,508 and 2,338 respectively.
7.1 Long-term trends in applications for citizenship and grants and refusals
The chart below illustrates longer-term trends in applications for citizenship and grants and refusals.
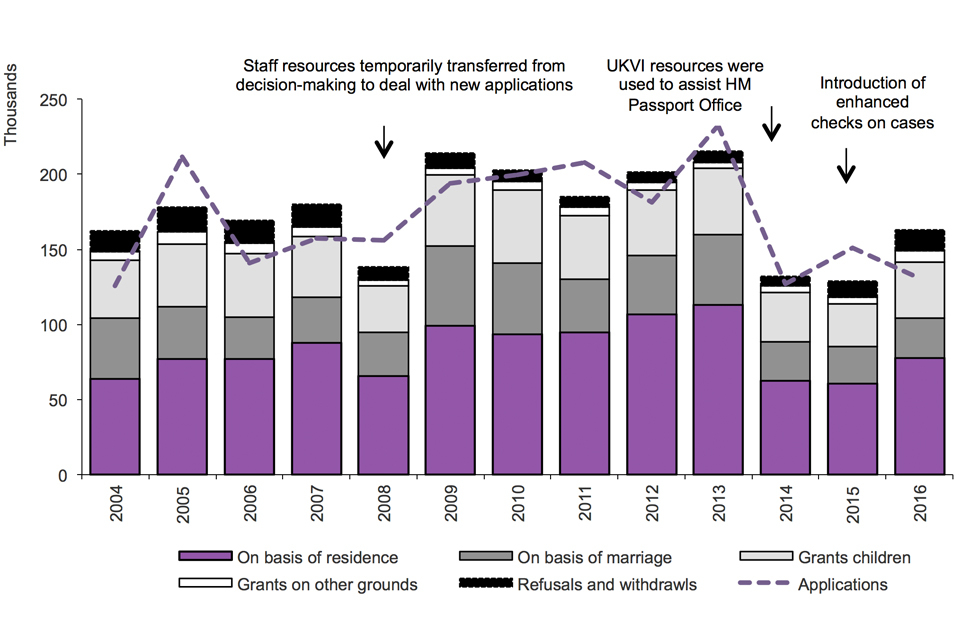
The chart shows the number of applications for grants and refusals of British citizenship between 2004 and the latest calendar year. The data are available in Tables cz 02 and cz 03.
Chart notes
Source: Home Office, Immigration Statistics April to June 2017, Citizenship tables cz 02 and cz 03. In 2008 staff resources were temporarily transferred from decision-making to deal with new applications. In 2014 UK Visas and Immigration (UKVI) resources were used to assist HM Passport Office. In 2015 enhanced checks on cases were introduced.
The increase in applications received during 2005 may have reflected people anticipating the introduction of the Life in the UK test on 1 November that year. Between 2009 and 2013 there was a general increase in applications and grants, which is likely in part to reflect the rise in non-European Economic Area (EEA) migration and increased grants of permission to stay permanently (known as ‘settlement’) in the period up to 2010. The peak in 2013, when there were 232,262 applications, may have been partly due to some people anticipating the rule change to the English language element of the Life in the UK test as of 28 October 2013. See the Policy and Legislative Changes Timeline for further information.
Grants and refusals of citizenship, by reason
| Year ending | Total decisions | Total grants | On basis of residence | On basis of marriage | As children | Other grounds | Refusals and withdrawals |
|---|---|---|---|---|---|---|---|
| Year ending June 2016 | 162,800 | 148,795 | 75,153 | 30,124 | 36,651 | 6,867 | 14,005 |
| Year ending June 2017 | 126,246 | 116,541 | 62,004 | 18,116 | 28,735 | 7,686 | 9,705 |
| Change: latest year | -36,554 | -32,254 | -13,149 | -12,008 | -7,916 | +819 | -4,300 |
| Percentage change | -22% | -22% | -17% | -40% | -22% | +12% | -31% |
Table notes
Source: Home Office, Immigration Statistics April to June 2017, Citizenship tables cz 01 q and cz 02 q.
‘Other grounds’ includes Entitlement and Discretionary registration as an adult, Entitlement and Discretionary registration on other grounds, and registration under Section 5 of the British Nationality Act 1981. See Citizenship table cz 07 and the User Guide to Home Office Immigration Statistics for more detail.
The 32,254 fall in grants of British citizenship reflects reductions in numbers of people granted citizenship in all broad categories (residence, marriage, as children) apart from ‘Other grounds’.
Grants on ‘Other grounds’ rose by 12% (819) to 7,686, mostly due to increases in decisions under section 1(4) of the British Nationality Act 1981 relating to persons who had spent the first 10 years of their life in the UK, and section 4G (implemented in April 2015), which refers to persons born before 1 July 2006 to a British father, where their parents were unmarried at the time of their birth. See the user guide and the Policy and Legislative Changes Timeline for more details.
Variations in numbers of decisions can be affected by changes in resources and the mix of cases, as well as policy changes and application levels in earlier periods.
Grants of citizenship, by previous nationality
The chart below shows grants in the year to June 2017
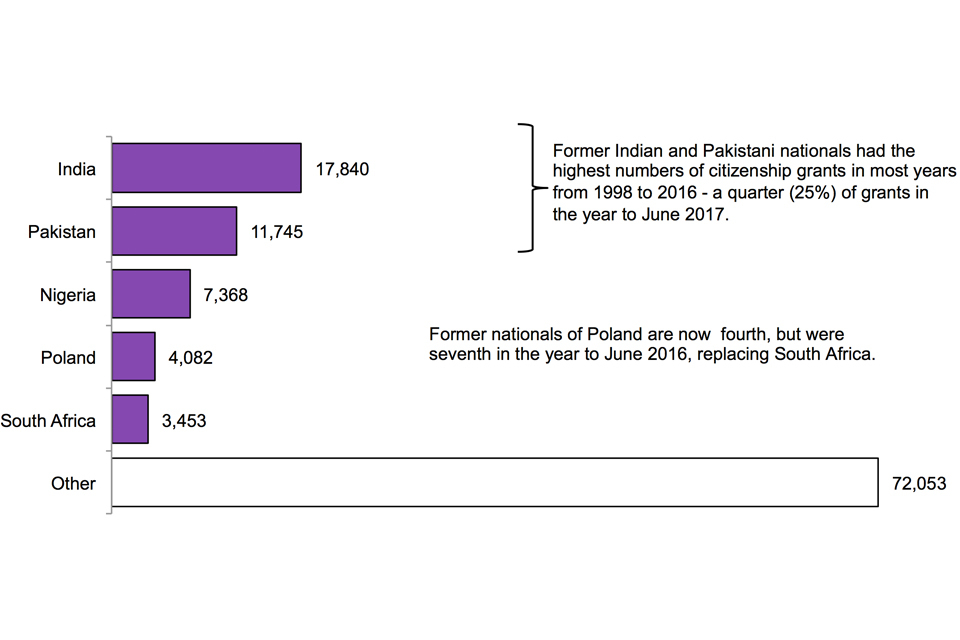
The chart shows grants of citizenship by previous nationality in the year to June 2017. The chart is based on data in Table cz 06 q.
Chart notes
Source: Home Office, Immigration Statistics April to June 2017, Citizenship tables cz 06 q. Former Indian and Pakistani nationals had the highest numbers of citizenship grants in most years from 1998 to 2016 - a quarter (25%) of grants in the year to June 2017. Former nationals of Poland are now fourth, but were seventh in the year to June 2016, replacing South Africa.
8. Staying in the UK
In February 2017 the Home Office published ‘Statistics on changes in migrants’ visa and leave status: 2015‘, which shows how non-European Economic Area (EEA) migrants change their immigration status or achieve settlement in the UK or have their status expire.
This analysis shows that the majority (69%) of migrants issued a Study visa in 2004 no longer had valid leave to remain in the UK 5 years later. This proportion has increased in each cohort arriving from 2005, to 81% for those issued a study visa in 2010. Conversely, the proportion of migrants who gained settlement 5 years after entering on a study visa declined over the same period.
Over a quarter (30%; 21,507) of those issued a skilled work visa (which has a potential path to settlement) in 2010 had been granted settlement 5 years after their initial visa had been granted; a further 14% (10,255) still had valid leave to remain in the UK.
The analysis also showed that most people who arrive on a family visa end up applying for and being granted settlement; around 4 out of 5 people (80% or 32,377) issued a family visa in the 2010 cohort had been granted settlement 5 years later, with a further 5% recorded as still having valid leave to remain in the UK.
9. Data tables
Data referred to here can be found in the following tables:
Extensions tables
Settlement tables
Citizenship tables
European Economic Area (EEA) tables