How many people come to the UK each year?
Published 24 August 2017

© Crown copyright 2017
This publication is licensed under the terms of the Open Government Licence v3.0 except where otherwise stated. To view this licence, visit nationalarchives.gov.uk/doc/open-government-licence/version/3 or write to the Information Policy Team, The National Archives, Kew, London TW9 4DU, or email: psi@nationalarchives.gov.uk.
Where we have identified any third party copyright information you will need to obtain permission from the copyright holders concerned.
This publication is available at https://www.gov.uk/government/statistics/immigration-statistics-april-to-june-2017/how-many-people-come-to-the-uk-each-year
Immigration statistics April to June 2017 content page.
This is not the latest release. View latest release.
This section relates to:
- the number of arrivals by people entering the UK (where an individual enters the country more than once, each arrival is counted): for non-EEA nationals who are subject to immigration control, more detailed information is available on their nationality and purpose of their journey
- grants of entry clearance visas to individuals outside the UK; including dependants but excluding visitor and transit visas unless stated otherwise.
1. Key facts
There were 133.3 million passenger arrivals in the year ending June 2017, including returning UK residents – a record number and an increase of 7.3 million compared to the year ending June 2016. This increase was divided between 5.0 million (+5% to 115.6 million) more arrivals by British, other EEA and Swiss nationals and 2.3 million by non-EEA nationals (+15% to 17.7 million). These numbers represent the number of occasions when a person entered the UK, not the number of distinct individuals.
Over a quarter (26%) of all non-EEA visitor arrivals in 2016 were United States (US) nationals.
In addition, there were over 2.6 million visas granted in the year ending June 2017. Of these, just over 2 million (77%) were to visit and 8% were for study.
Passenger arrivals
The diagram below illustrates the type and volume of arrivals in 2016 (thousands).
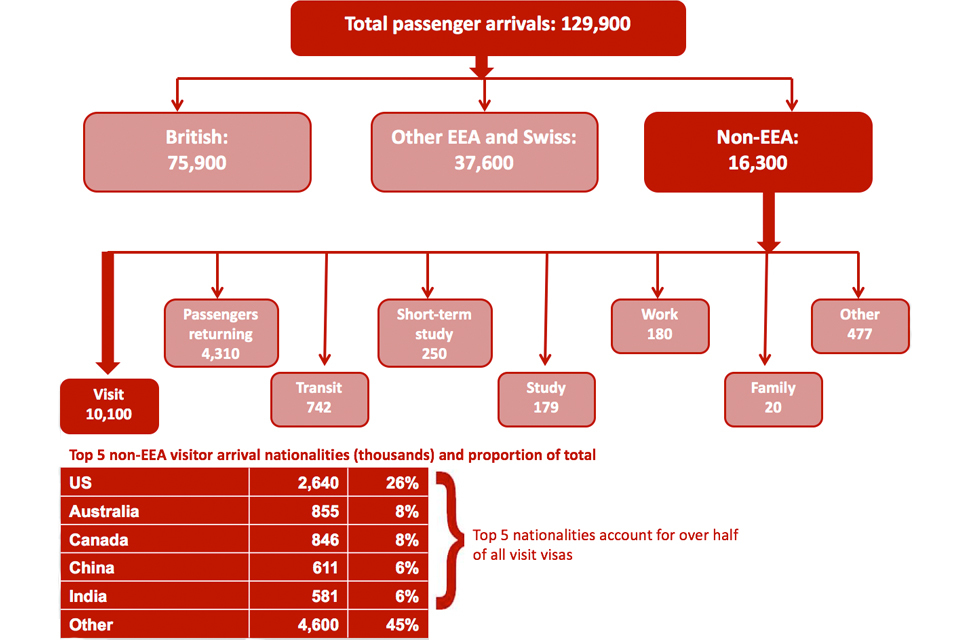
The chart shows the number and type of arrivals into the UK in the latest calendar year available. The data are available in Tables ad 01, ad 02 and ad 03 o.
Chart notes
Source: Home Office, Immigration Statistics April to June 2017, Admissions tables ad 01, ad 02 and ad 03 o.
(1) Passengers returning are people who have previously arrived in the UK on a non-visit visa, including people who came in the current and previous years and people who are long term residents in the UK. They include those settled in the UK and who have been absent for less than two years (who do not need a visa), and those subject to a limited leave to enter (such as workers or students) who have returned within the time limit of that leave. Their initial arrival will have been counted in one of the specific arrival categories in the relevant time period.
Long-term trends in passenger arrivals
The chart below illustrates longer-term trends in passengers entering the UK by year.

The chart shows the total number of arrivals made into the UK by broad nationality between 2004 and the latest calendar year available. Global recession starts in 2008 and continues into 2009. The data are available in Admissions table ad 01.
Chart notes
Source: Home Office, Immigration Statistics April to June 2017, Admissions table ad 01.
Passenger arrivals (non-EEA nationals) by purpose of journey
| 2012 | 2013 | 2014 | 2015 | 2016 | Change: latest year | Percentage change | |
|---|---|---|---|---|---|---|---|
| Total arrivals (thousands) | 12,900 | 14,000 | 14,600 | 15,300 | 16,300 | +1,010 | +7% |
| Work | 143 | 156 | 163 | 171 | 180 | +9 | +6% |
| Study (excl short term) | 211 | 199 | 193 | 185 | 179 | -6 | -3% |
| Short-term study (2) | 299 | 263 | 280 | 306 | 250 | -56 | -18% |
| Family | 32 | 23 | 22 | 22 | 20 | -1 | -6% |
| Visitors | 7,690 | 8,690 | 9,160 | 9,440 | 10,100 | +702 | +7% |
| Persons in-transit | 1,100 | 1,190 | 1,200 | 1,190 | 742 | -451 | -38% |
| Passengers returning (1) | 3,130 | 3,130 | 3,240 | 3,510 | 4,310 | +800 | +23% |
| Other | 313 | 351 | 398 | 462 | 477 | +15 | +3% |
Table notes
Source: Home Office, Immigration Statistics April to June 2017, Admissions table ad 01.
(1) Passengers returning are people who have previously arrived in the UK on a non-visit visa. They include those settled in the UK and who have been absent for less than two years, and those subject to a limited leave to enter who have returned within the time limit of that leave. Their initial arrival will have been counted in one of the specific arrival categories in the relevant time period.
(2) The Short-term study category (previously described as ‘Student visitor’) allows individuals to come to the UK for 6 months (or 11 months if they will be studying an English Language course) and cannot extend their stay (further details at Short-term study visa and the Study section). For both visitors and short-term study, non-visa nationals do not require a visa for visits of up to 6 months, so total figures for arrivals are not directly comparable with total visitor or student visitor visas.
2. Visas
The following diagram illustrates the type and volume of visas granted in the year ending June 2017. The volume of visas granted is much lower than non-EEA arrivals as some nationalities do not need a visa (for a visit of 6 months or less) to enter the UK.
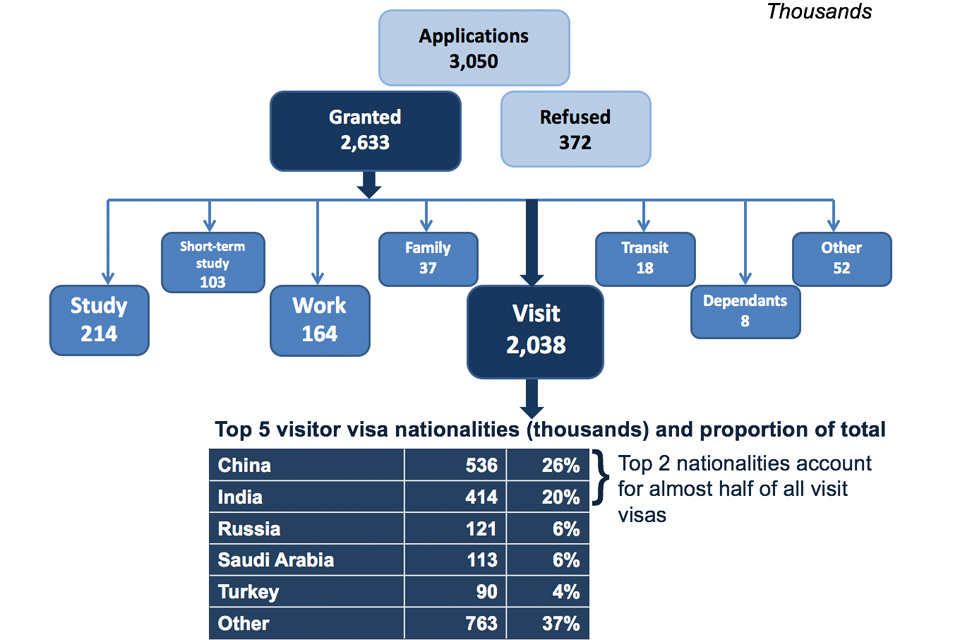
The chart shows the number and type of visas granted for the latest year available. The data are available in Visas tables vi 01 q and vi 06 q o.
Chart notes
Source: Home Office, Immigration Statistics April to June 2017, Visas table vi 01 q and Visas table vi 06 q o.
3. Data tables
Further data on arrivals are available in Admissions tables ad 01 to ad 04.
Further data on entry clearance visas and sponsored visa applications for the work, study and family routes (described further in the Work topic, Study topic and Family topic) can be found in the following tables:
Visas tables volume 1
Visas tables volume 2
Visas tables volume 3
Sponsorship tables