Why do people come to the UK? (2) To work
Published 24 August 2017

© Crown copyright 2017
This publication is licensed under the terms of the Open Government Licence v3.0 except where otherwise stated. To view this licence, visit nationalarchives.gov.uk/doc/open-government-licence/version/3 or write to the Information Policy Team, The National Archives, Kew, London TW9 4DU, or email: psi@nationalarchives.gov.uk.
Where we have identified any third party copyright information you will need to obtain permission from the copyright holders concerned.
This publication is available at https://www.gov.uk/government/statistics/immigration-statistics-april-to-june-2017/why-do-people-come-to-the-uk-2-to-work
Immigration statistics April to June 2017 content page.
This is not the latest release. View latest release.
Data relate to the year ending June 2017 and all comparisons are with the year ending June 2016, unless indicated otherwise.
This section includes figures on work-related visas granted to non-European Economic Area (EEA) nationals. It also includes estimates of non-EU long-term immigration to work (i.e. those intending to stay for at least 12 months to work).
1. Key facts
There were 55,118 Tier 2 Skilled work-sponsored visa applications in the year ending June 2017 (non-EEA main applicants, Certificates of Sponsorship (CoS) used), lower than year ending June 2016 (56,914). This included a 25% increase (1,091 more visas) in the Human health and social work activities sector, which is largely likely to reflect the addition of nurses to the government’s shortage occupation list in November 2015. The largest fall was in applications for the Professional, scientific and technical activities sector (-1,552; -14%).
Including dependants, there were 92,805 Tier 2 Skilled work visas granted in the year ending June 2017, 1% lower than the previous year (93,980). Indian nationals accounted for 53,366 (58%) of Skilled work visas granted in year ending June 2017, with US nationals the next largest group (9,144 or 10% of the total).
There were also 41,731 Tier 5 Youth mobility and temporary visas granted, down 1,611 (4%)
In the year ending March 2017, the Office for National Statistics (ONS) estimates there were 72,000 non-European Union (EU) long-term immigrants for work, the same level as the previous year.
Additionally, according to the latest estimates from the Labour Force Survey, the number of people employed in the UK increased by 347,000 to 32.0 million, the highest since the series began in 1981. Over two-thirds of the increase was accounted for by UK nationals (around 69%). There were 2.4 million EU nationals in employment in the UK (up 126,000; highest since series began) and 1.2 million non-EU nationals (down 18,000).
2. Work immigration: latest trends
| Year ending June 2016 | Year ending June 2017 | Change | Percentage change | |
|---|---|---|---|---|
| Work-related visas granted | 166,590 | 163,594 | -2,996 | -2% |
| of which: | ||||
| High value (Tier 1) visas | 4,531 | 4,729 | +198 | +4% |
| Skilled (Tier 2) visas | 93,980 | 92,805 | -1,175 | -1% |
| Youth mobility and temporary workers (Tier 5) visas | 43,342 | 41,731 | -1,611 | -4% |
| Non-PBS/Other work visas | 24,737 | 24,329 | -408 | -2% |
| Year ending March 2016 | Year ending March 2017 | Change | Percentage change | |
|---|---|---|---|---|
| Long-term immigration for work (1), excluding dependants | 72,000 | 72,000 | 0 | 0% |
| Long-term (1 year or more) work-related visas, excluding dependants | 81,926 | 71,714 | -10,212 | -12% |
Table notes
Source: Home Office, Immigration Statistics April to June 2017, Visas table vi 04_q (Visas volume 1), International Passenger Survey (IPS), ONS Migration Statistics Quarterly Report.
(1) Immigration for work data are estimates of the number of non-EU nationals intending to change their residence to the UK for at least 12 months based on the IPS.
2. Long-term trends in work-related immigration
There was a long-term reduction in work-related visas granted and non-EU immigration from 2006 to 2012. Since 2013, increases have been seen in all groups, with some fluctuations.
The chart below shows that IPS estimates of non-EU work immigration are substantially lower as these include only those migrants who state they intend to remain in the UK for a year or more. However, the two series show broadly similar trends with falls from 2006 followed by increases from the middle of 2013 and relative stability over the latest two years.
Long-term trends in work-related immigration
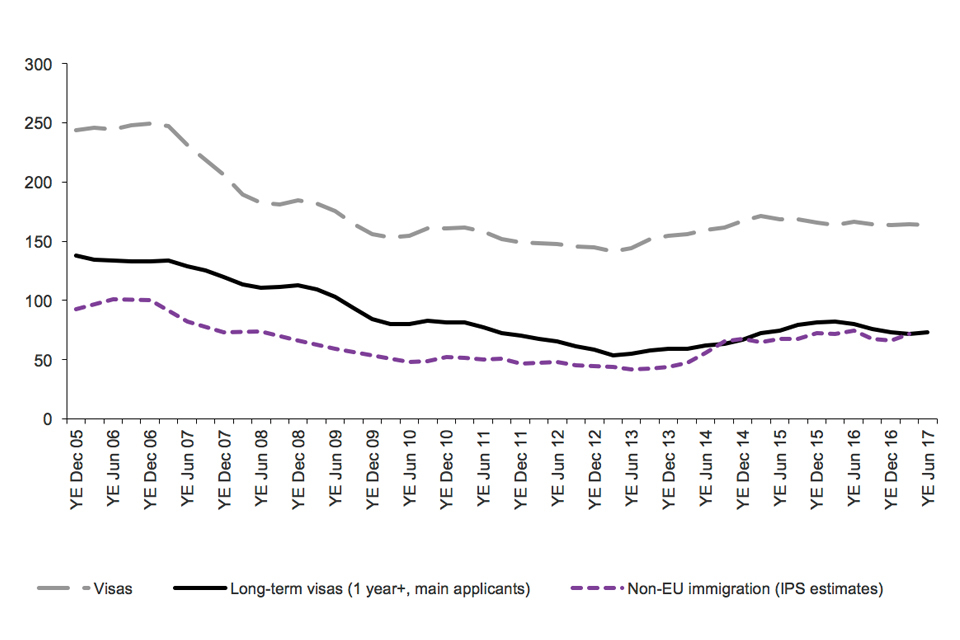
The chart shows the trends for Work visas granted and IPS estimates of non-EU immigration between 2005 and the latest data published. The data are sourced from Visas table vi 04 q and corresponding datasets.
Chart notes
Source: Home Office, Immigration statistics April to June 2017, Visas table vi 04 q [Visas volume 1], and corresponding datasets; ONS, Migration Statistics Quarterly Report.
There are a range of potential reasons why IPS figures differ from figures for work visas granted or passenger arrivals, and hence why the trends in the different series do not always correspond. Further comparisons of the data are described in the User Guide to Home Office Immigration Statistics.
2.1 Entry clearance visa applications and resolution, including dependants: Work
There were small falls in work visa applications, resolved and granted in the year ending June 2017 and refusal rates have remained fairly similar over the last few years. Figures for those refused and withdrawn/lapsed had greater proportionate falls for the year ending June 2017 but the numbers are small relative to grants.
| Year ending | Applications | Resolved | Granted | % | Refused | % | Withdrawn or lapsed |
|---|---|---|---|---|---|---|---|
| Year ending June 2013 | 155,450 | 154,958 | 144,503 | 93% | 9,593 | 6% | 862 |
| Year ending June 2014 | 168,978 | 169,652 | 159,231 | 94% | 9,576 | 6% | 845 |
| Year ending June 2015 | 179,993 | 180,078 | 168,505 | 94% | 10,635 | 6% | 938 |
| Year ending June 2016 | 176,730 | 178,077 | 166,590 | 94% | 10,843 | 6% | 644 |
| Year ending June 2017 | 175,782 | 173,502 | 163,594 | 94% | 9,425 | 5% | 483 |
| Change: latest 12 months | -948 | -4,575 | -2,996 | -1,418 | -161 | ||
|---|---|---|---|---|---|---|---|
| Percentage change | -1% | -3% | -2% | -13% | -25% |
Table notes
Source: Home Office, Immigration Statistics April to June 2017, Visas table vi 01 q (Visas volume 1).
3. Skilled work
In the year ending June 2017, almost all (97%) of the 95,295 decisions made on entry clearance applications for Skilled work were grants (92,805). The fall in Skilled (Tier 2) grants was more than accounted for by an overall decrease in main applicant Intra-company transfers of -1,856 (-5%), but within this there was an increase of 3,405 (26%) in long-term Intra-company transfers that was more than offset by other decreases.
Indian nationals accounted for 58% of skilled work visas granted in the year ending June 2017.
Skilled work: latest trends in visa grants
| Year ending June 2016 | Year ending June 2017 | Change | Percentage change | |
|---|---|---|---|---|
| Skilled (Tier 2) visas granted | 93,980 | 92,805 | -1,175 | -1% |
| of which: | ||||
| Main applicants | 55,601 | 54,158 | -1,443 | -3% |
| of which | ||||
| Tier 2: General | 18,238 | 18,689 | +451 | +2% |
| Tier 2: Intra-company transfers | 36,808 | 34,952 | -1,856 | -5% |
| of which | ||||
| Tier 2: Intra-company transfers (1) | 2,125 | 1,086 | -1,039 | -49% |
| Tier 2: Intra-company transfers short term (2) | 21,602 | 17,380 | -4,222 | -20% |
| Tier 2: Intra-company transfers long term | 13,081 | 16,486 | +3,405 | +26% |
| Tier 2: Ministers of religion | 363 | 347 | -16 | -4% |
| Tier 2: Sportsperson | 116 | 120 | +4 | +3% |
| Work Permit holders | 76 | 50 | -26 | -34% |
| #Dependants | 38,379 | 38,647 | +268 | +1% |
| of which | ||||
| Tier 2: Dependant | 14,746 | 14,043 | -703 | -5% |
| Tier 2: Intra-company transfers short term | 9,098 | 8,166 | -932 | -10% |
| Tier 2: Intra-company transfers long term | 14,506 | 16,409 | +1,903 | +13% |
| Work Permit holders | 29 | 29 | 0 | 0% |
Table notes
Source: Home Office, Immigration Statistics April to June 2017, Visas table vi 04 q (Visas volume 1).
(1) From 6 April 2011, the Tier 2 Intra-company Transfer category was split into sub-categories. Most Intra-company transfers could then be identified by the visa endorsement as being short-term or long-term. Intra-company transfers not identified as long-term or short-term in this visa categorisation relate to categories for graduate trainees and skills transfer.
(2) The short term Tier 2 Intra-company Transfer route was closed to new applications from 6 April 2017.
3.1 Sponsored visa applications, by nationality and industry sector
The number of sponsored visa applications for Skilled work was 55,118 in the year ending June 2017 (main applicants, CoS used), 3% lower than year ending June 2016 (56,914). The largest change was in the Human health and social work activities sector, an increase of 1,091 (25%), which is largely likely to reflect the addition of nurses to the government’s shortage occupation list in November 2015.
There were 22,878 applications from the Information and Communication sector in the year ending June 2017, and this sector alone accounted for 42% of all Skilled work-sponsored visa applications. However, applications from this sector have decreased (by 948; -4%) in the year ending June 2017.
Sponsored visa applications by industry sector, year ending June 2017

The chart shows the sponsored visa applications by industry sector for the year ending June 2017. The data are sourced from the Sponsorship tables. The top 5 sectors accounted for the large majority (86%) of sponsored Skilled work visa applications.
Chart notes
Source: Home Office, Immigration Statistics April to June 2017, Sponsorship tables.
Main applicants only.
3.2 Sponsored Skilled work visa applications, by nationality, year ending June 2017
Indian nationals account for 29,800 (54%) of Skilled work sponsored visa applications in year ending June 2017, with US nationals the next largest group (5,686 or 10% of the total). The number of sponsored visa applications for Indian nationals was 4% lower in year ending June 2017 and applications for US nationals were 9% lower.
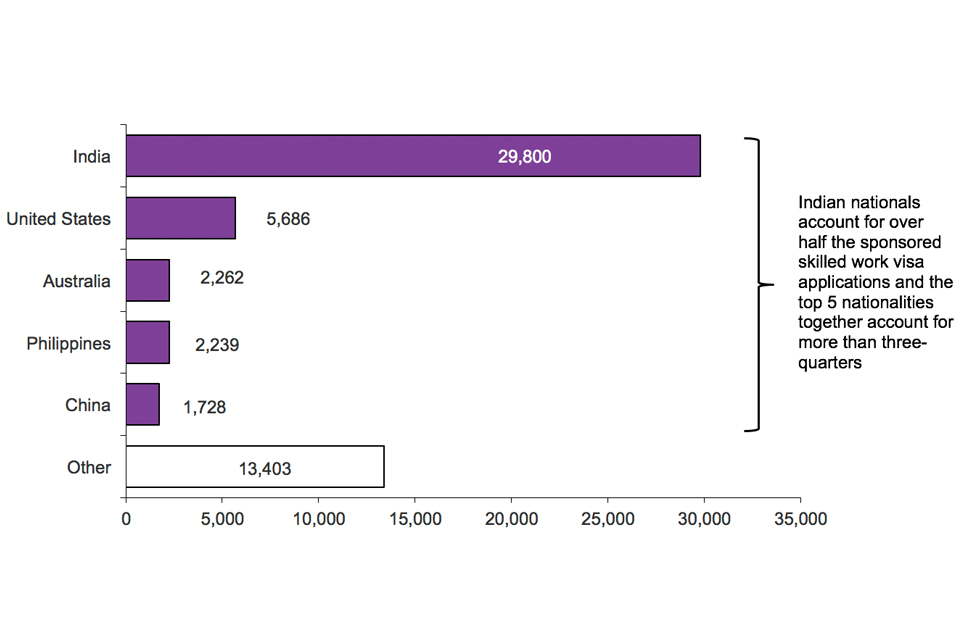
The chart shows the sponsored visa applications by nationality for year ending June 2017. The data are sourced from the Sponsorship tables.
Chart notes
Source: Home Office, Immigration Statistics April to June 2017, Sponsorship tables.
4. Data tables
Data on immigration for work, sourced from Home Office administrative systems, can be found in the following tables:
Sponsorship tables
Visas tables volume 1
Visas tables volume 2
Visas tables volume 3
Admissions tables
Extensions tables
Settlement tables
European Economic Area (EEA) tables