How many people do we grant asylum or protection to?
Published 24 August 2017

© Crown copyright 2017
This publication is licensed under the terms of the Open Government Licence v3.0 except where otherwise stated. To view this licence, visit nationalarchives.gov.uk/doc/open-government-licence/version/3 or write to the Information Policy Team, The National Archives, Kew, London TW9 4DU, or email: psi@nationalarchives.gov.uk.
Where we have identified any third party copyright information you will need to obtain permission from the copyright holders concerned.
This publication is available at https://www.gov.uk/government/statistics/immigration-statistics-april-to-june-2017/how-many-people-do-we-grant-asylum-or-protection-to
Immigration statistics April to June 2017 content page.
This is not the latest release. View latest release.
Data relate to the year ending June 2017 and all comparisons are with the year ending June 2016, unless indicated otherwise.
This section covers asylum applications, initial decisions, estimated final outcomes, resettlement, unaccompanied asylum-seeking children (UASC), international comparisons and support.
1. Key facts
In the year ending June 2017, 16,211 people were granted asylum, resettlement or an alternative form of protection. There were 9,350 grants of asylum or an alternative form of protection following an in-country application, and an additional 6,861 people were provided with protection and support under a resettlement scheme in the UK. In total, this is a 7% increase from 15,108 in the previous year.
Asylum applications in the UK from main applicants decreased by 25% to 27,316 in the year ending June 2017.
There were 2,944 asylum applications from UASC in the year ending June 2017, a 17% decrease compared to the previous year (3,545). Overall, UASC applications represented 11% of all main applications for asylum.
Of the 22,982 initial decisions on asylum applications from main applicants, 34% were grants of asylum or an alternative form of protection, compared to 38% in the previous year. A separate Home Office analysis shows that for the years 2013 to 2015, on average 37% of decisions were granted initially, but this proportion rose to 52% after appeal.
There were 1,096 grants of asylum or an alternative form of protection to Syrian nationals at initial decision in the year ending June 2017 and an additional 5,637 Syrian nationals were granted humanitarian protection under the Vulnerable Persons Resettlement Scheme (VPRS). Since this scheme began in 2014, a total of 8,535 people have been resettled.
2. Long-term trends in asylum applications for main applicants
The chart below shows the annual number of asylum applications made since 2001.
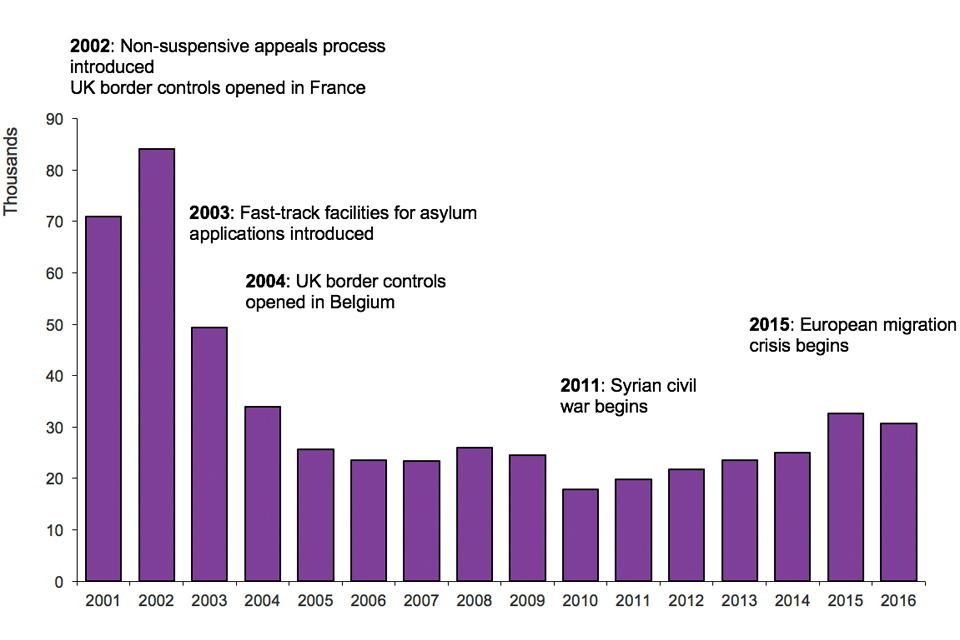
The chart shows the number of asylum applications made between 2001 and the latest calendar year. The data are available in Asylum table as 01.
Chart notes
Source: Home Office, Immigration Statistics April to June 2017, Asylum table as 01 (Asylum volume 1).
3. Asylum applications by nationality in 2016
In 2016, the largest number of applications for asylum came from nationals of Iran (4,184), followed by Pakistan (2,870), Iraq (2,672), Afghanistan (2,329), and Bangladesh (1,944).
Countries with highest number of applications for asylum in the UK, 2016 compared to 2015
| Ranking in 2016 (2015) | Nationality | 2015 | 2016 | Grant rate based on initial decisions (%) |
|---|---|---|---|---|
| 1 (2) | Iran | 3,242 | 4,184 | 37% |
| 2 (5) | Pakistan | 2,470 | 2,870 | 14% |
| 3 (7) | Iraq | 2,216 | 2,672 | 12% |
| 4 (6) | Afghanistan | 2,261 | 2,329 | 35% |
| 5 (9) | Bangladesh | 1,110 | 1,944 | 6% |
Table notes
Source: Home Office, Immigration Statistics April to June 2017, Asylum table as 01 q (Asylum volume 1).
(1) Grant rates relate to the number of grants for asylum, humanitarian protection, discretionary leave, or other grants of stay, as a proportion of all initial decisions made in 2016.
(2) Initial decisions do not necessarily relate to applications made in the same period and exclude the outcome of appeals or other subsequent decisions.
World events have an effect on who applies for asylum at any particular time. For example, the number of applicants from Syria increased sharply following the outbreak of the Syrian civil war in early 2011. The 1,376 applications for asylum from Syrian nationals in 2016 compares with 125 in the year ending March 2011. In addition, increasing numbers of people have sought asylum from other countries where there have been concerns over human rights. For example, in 2016, there were 1,230 asylum applications from nationals of Eritrea compared to 797 in 2011.
Grant rates for asylum and other forms of protection vary considerably between nationalities. For example, at initial decision, the grant rate for Iranian nationals was 37% (1,456 grants), compared with 12% (285 grants) for Iraqi nationals. Overall, there were 8,465 grants at initial decision for all nationalities in 2016, which corresponds to an overall grant rate of 34%. Further analysis on grant rates post-appeal is available in Outcome of asylum applications.
There were 1,767 grants of asylum or an alternative form of protection to Syrian nationals (including dependants) at initial decision in 2016 (a grant rate of 87%). (This is in addition to the 4,369 people, including dependants, who were granted humanitarian protection under the Vulnerable Persons Resettlement Scheme (VPRS) during this period.) Refused asylum applications for Syrians will include cases that have been transferred to be assessed by another EU member state (third country), and may include some where it was found that the applicant did not hold Syrian nationality.
Countries with highest number of applications for asylum in the UK by rank, 2010 to 2016
The chart below shows the top 5 nationalities by number of applications for asylum in 2010 and 2016.
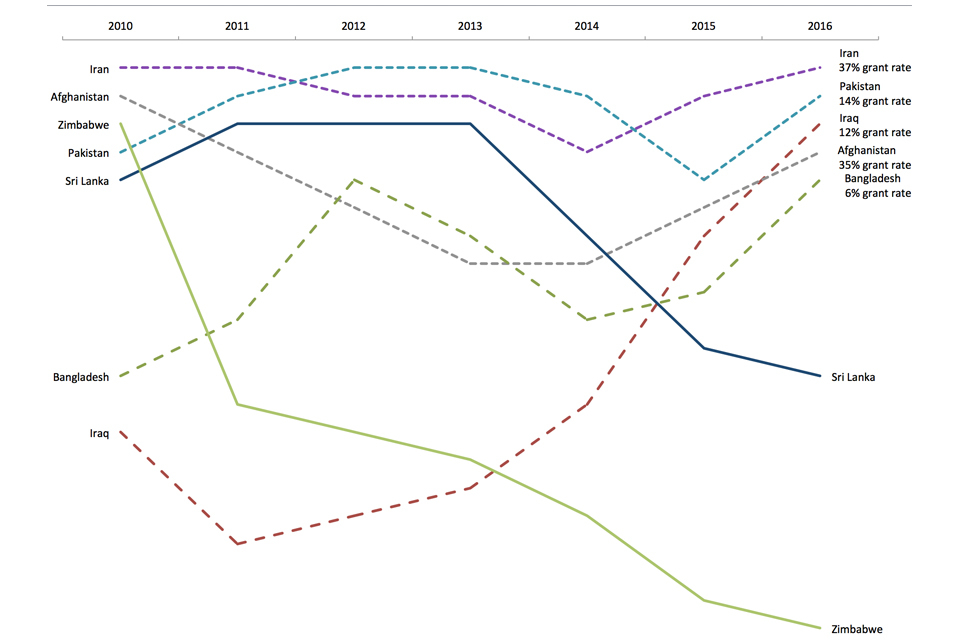
The chart shows the top 5 ranked nationalities for asylum applications between 2010 and 2016. The data are available in table as 01.
Chart notes
Source: Home Office, Immigration Statistics April to June 2017, Asylum table as 01 (Asylum volume 1).
Three of the top 5 nationalities applying for asylum in 2010 were still present in the top 5 in 2016 (Afghanistan, Iran and Pakistan). Zimbabwe was ranked third for asylum applications in 2010, but fell to 21st in 2016. Iraq is now ranked third for asylum applications, up from the series low of 18th in 2011.
4. Unaccompanied asylum-seeking children
A UASC is a person under 18, or in the absence of documentary evidence establishing age, appears to be under 18, who is applying for asylum in his or her own right and has no relative or guardian in the United Kingdom.
There were 2,944 asylum applications from UASC in the year ending June 2017, a 17% decrease compared to the previous year (3,545). Overall, UASC applications represented 11% of all main applications for asylum.
Of the 1,691 initial decisions relating to UASC made in the year ending June 2017, 50% were grants of asylum or another form of protection, and 29% were grants of temporary leave (UASC leave). UASC applicants that are refused will include those from countries where it is safe to return children to their families, as well as some applicants who were determined to be over 18 following an age assessment.
5. Support provided to asylum seekers
At the end of June 2017, a total of 38,954 people were receiving a cash allowance, somewhere to live, or both, in the UK (under Section 95 of the Immigration and Asylum Act 1999). This number has increased from 37,030 at the end of June 2016. The total figure remains considerably below that for the end of 2003 (the start of the published data series), when there were 80,123 people in receipt of Section 95 support.
People in receipt of Section 95 support, by local authority, per million population, as at the end of 2016
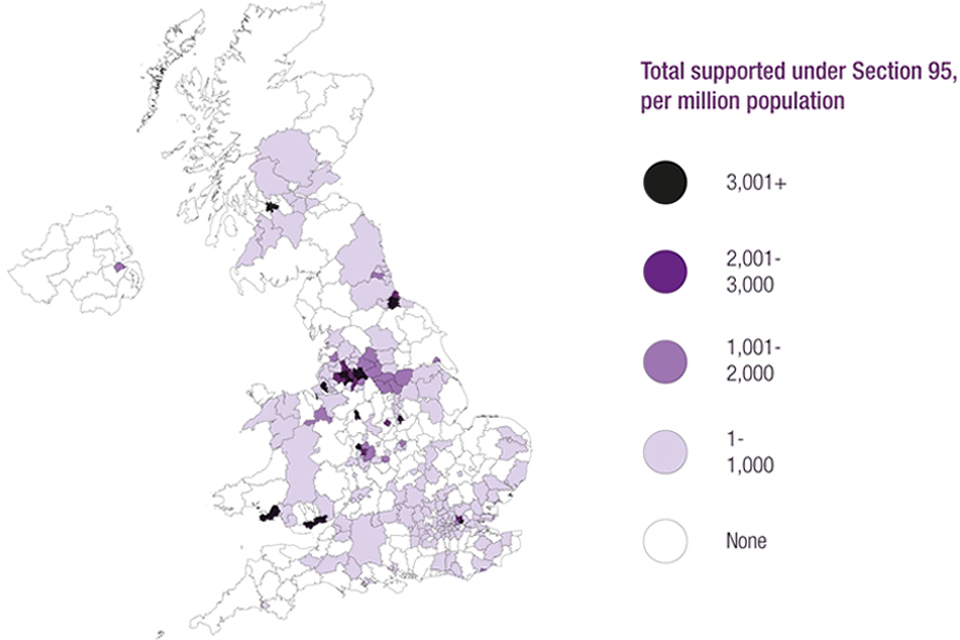
This map shows the number of asylum seekers in receipt of Section 95 support, by local authority, per million population, as at end of 2016.
Chart notes
Source: Home Office, Immigration Statistics April to June 2017, Asylum table as 16 q (Asylum volume 4); population figures sourced from the ONS 2015 mid-year population estimates, published 23 June 2016 Population Estimates for UK, England and Wales, Scotland and Northern Ireland.
The number of asylum seekers in receipt of Section 95 support by local authority, as at the end of each quarter, is available in Asylum table as 16 q (volume 4 of the Asylum data tables).
Separately, at the end of June 2017, there were 3,876 people receiving support under Section 4 of the Immigration and Asylum Act 1999.
6. Resettlement
In addition to those asylum seekers who apply in the UK, resettlement schemes are offered to those who have been referred to the Home Office by The United Nations Refugee Agency (UNHCR).
On 7 September 2015, an expansion to the existing VPRS was announced. Through this expansion, it was proposed that 20,000 people in need of protection be resettled in the UK by 2020. So far 8,535 people have been granted humanitarian protection under the VPRS since the scheme began, and in the year ending June 2017, 5,637 people were resettled under the VPRS across 246 different local authorities. Around half (51%) of those resettled under the VPRS were under 18 years old (2,872), and around half (47%) were female (2,670).
7. International comparisons
Figures in this section are based on data supplied by the individual countries to the Intergovernmental Consultations on Migration, Asylum and Refugees (IGC), UNHCR and Eurostat. Not all countries provide the latest data in time for each Immigration Statistics release. Where a figure is unavailable for a given month, we estimate it using the average of the last 3 months available, unless the time series is erratic, when we use the average of the last 12 months.
Including dependants, there were an estimated 914,900 asylum applications to the EU in the year ending June 2017, a decrease of 40% compared to the year ending June 2016 (1,536,400).
Top EU countries receiving asylum applications, 2016
| Country of application | Total applications | Total positive decisions |
|---|---|---|
| Germany | 722,265 | 433,910 |
| Italy | 121,185 | 35,400 |
| France | 75,990 | 28,750 |
| Greece | 49,875 | 2,710 |
| Austria | 39,860 | 30,370 |
| United Kingdom (HO data) | 39,357 | 9,944 |
Table notes
Source: Eurostat Asylum quarterly report.
(1) Figures are rounded to the nearest 5.
(2) Figures were extracted from Eurostat in May 2017.
Top EU countries resettling refugees, 2016
| Country | Total resettled |
|---|---|
| United Kingdom (HO data) | 5,212 |
| Sweden | 1,890 |
| France | 1,420 |
| Germany | 1,240 |
| Italy | 1,045 |
Table notes
Source: Eurostat Resettled persons annual data.
(1) Figures are rounded to the nearest 5.
(2) Figures were extracted from Eurostat in August 2017.
(3) Figures exclude individuals relocated.
Note: countries may include different types of protection (e.g. humanitarian protection).
8. Outcome of asylum applications
The most recent data report on the initial decisions made on asylum applications by the Home Office. However, some decisions will be challenged at the HM Courts and Tribunals Service (HMCTS), an executive agency of the Ministry of Justice, which considers appeals against the asylum decisions made by the Home Office.
The Home Office produces an analysis of applications for whole year cohorts of asylum seekers, in order to calculate the overall success rates following appeal. For most years, this will provide the most complete description of the outcome for asylum seekers; however, for the most recent years some cases will still be outstanding, as not all cases will have had sufficient time to be completed. The analysis therefore only provides a ‘snapshot’ of the recorded outcomes of the group (or cohort) of asylum applicants in any one year, at a particular time. This dataset is updated, in full, annually and is currently available up to 2016.
8.1 Outcome of applications made between 2013 and 2015
The following chart gives an illustration of outcomes in the asylum system in the UK, for applications made in the years 2013 to 2015 (inclusive), where the outcome is known.
Indicative flows through the UK asylum system, where outcomes known, 2013 to 2015 data
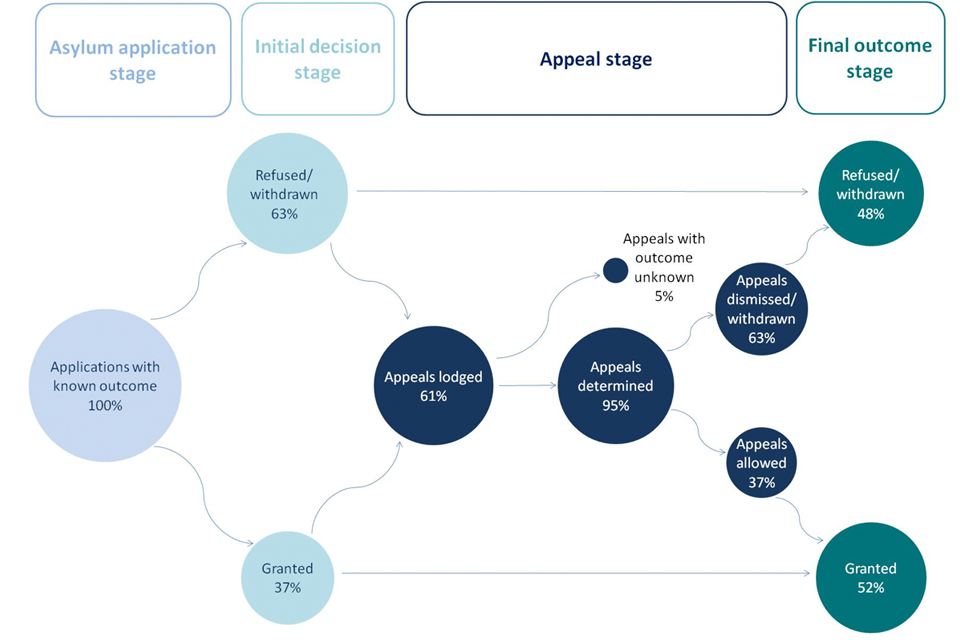
This flow chart shows indicative flows through the UK asylum system, where outcomes known, 2013 to 2015 data.
Chart notes
Source: Home Office, Immigration Statistics April to June 2017, Asylum table as 06 (Asylum volume 2).
(1) Appeals lodged are represented as a proportion of all initial decisions (except grants of asylum) and withdrawn applications.
(2) Figures are derived by combining data from the 2013, 2014 and 2015 cohort data from Table as 06.
(3) Cases where initial decision is unknown are not included in this analysis.
(4) Grant rates shown here relate to the outcomes of total applications made in each cohort year, and take withdrawn applications into account. They are therefore not directly comparable with the annual grant rates shown in the earlier table ‘Countries with highest number of applications for asylum in the UK, 2016 compared to 2015’, which gives grants as a percentage of total initial decisions made each year.
8.2 Currently recorded outcomes for 2016 applications
The outcomes for the 30,747 main applicants who applied for asylum in 2016, as with previous cohorts, will be updated in subsequent annual reports. However, as at May 2017, it is estimated that 7,370 (24%) main applicants were ultimately granted asylum, humanitarian protection or discretionary leave, either at initial decision or after appeal; 11,163 (36%) were refused or withdrawn; and two-fifths (40%; 12,214) were awaiting confirmation of an initial decision or appeal outcome.
Outcome of asylum applications, by year of application
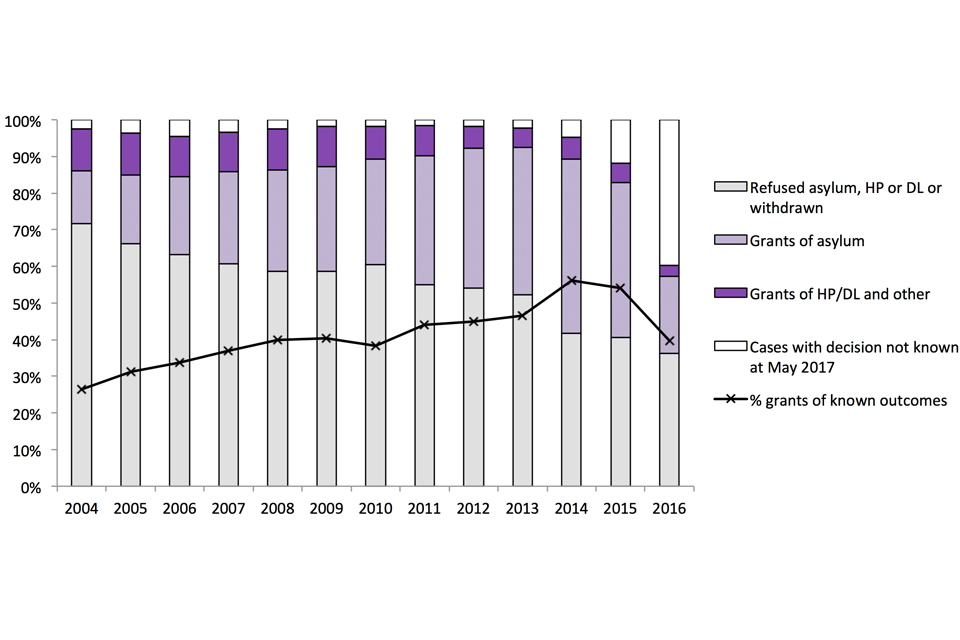
The chart shows the outcome of asylum applications made between 2004 and the latest calendar year as at May 2017. The data are available in Table as 06.
Chart notes
Source: Home Office, Immigration Statistics April to June 2017, Asylum table as 06 (Asylum volume 2).
(1) Chart shows the proportion of recorded outcomes of applications made in each year from 2004 to 2016, as at May 2017.
(2) Due to the large variety of routes that an asylum application can take to a final outcome, the analysis of the outcomes of asylum applications in any one year requires interpretation for a small percentage of cases. The proportions and underlying figures for final outcomes of the analysis of applications for the group (or cohort) of applicants in any one year, are therefore estimated.
(3) The proportion of applications awaiting the outcome of an initial decision or an appeal will inherently be lower in earlier years as there has been longer for the cases to be processed than those from more recent years.
The overall proportion of applications granted asylum or a form of temporary protection, either at initial decision or after having an appeal allowed, was estimated to be 26% in 2004; this proportion has steadily increased to 56% of applications made in 2014 (where the outcome is known).
In addition, the outcome analysis also shows how the final grant rates vary by country of nationality. For example, of known outcomes for 2016 applicants, it is estimated that 80% of Syrians were granted asylum or another form of protection following initial decision and appeal, compared with 29% of Iraqi nationals.
The recorded outcomes of asylum applications made in 2017 are due to be published in August 2018.
9. Data tables
Data referred to here can be found in the following tables:
Asylum tables volume 1
Asylum tables volume 2
Asylum tables volume 3
Asylum tables volume 4