HPR volume 14 issue 16: news (14 and 15 September)
Updated 23 December 2020

© Crown copyright 2020
This publication is licensed under the terms of the Open Government Licence v3.0 except where otherwise stated. To view this licence, visit nationalarchives.gov.uk/doc/open-government-licence/version/3 or write to the Information Policy Team, The National Archives, Kew, London TW9 4DU, or email: psi@nationalarchives.gov.uk.
Where we have identified any third party copyright information you will need to obtain permission from the copyright holders concerned.
This publication is available at https://www.gov.uk/government/publications/health-protection-report-volume-14-2020/hpr-volume-14-issue-16-news-14-and-15-september
Annual STI and chlamydia screening report for England in summary
Public Health England (PHE) has published its latest annual report on Sexually transmitted infections and screening for chlamydia in England.
The report provides a comprehensive overview of trends to end-December 2019 in the sexually transmitted infections (STIs) of most concern: gonorrhoea, syphilis, chlamydia, genital herpes and genital warts. The overall number of new STI diagnoses increased by 5% in 2019, compared with 2018 (from 447,522 to 468,342).
The increase in the total number of new STIs was due to a large increase in gonorrhoea (26%; from 56,232 to 70,936) and more moderate increases in syphilis (primary, secondary and early latent stages: 10%; from 7,260 to 7,982) chlamydia (5%; from 218,881 to 229,411) and genital herpes (2%; from 33,734 to 34,570) diagnoses.
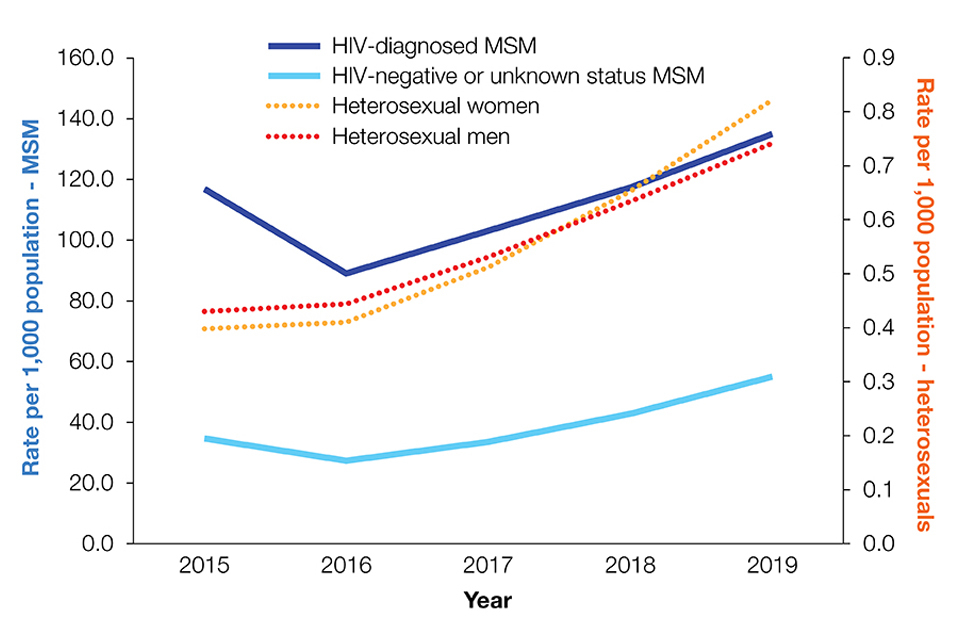
The number of gonorrhoea diagnoses in 2019 was the largest annual number ever recorded. The marked rise was observed in both gay, bisexual and other men who have sex with men (referred to collectively as ‘MSM’) and heterosexuals.
This is of particular concern as the effectiveness of first-line treatment for gonorrhoea continues to be threatened by the development of antimicrobial resistance. Population diagnosis rates of gonorrhoea continue to be highest among HIV-diagnosed MSM compared to other men or women. This is shown in the figure below. (Note the different scales on the primary and secondary y-axes. The primary y-axis depicts the rate per 1,000 population MSM, while the secondary y-axis shows the rate per 1,000 population heterosexuals. The data on diagnosis rates are obtained from routine specialist and non-specialist sexual health services’ returns to the GUMCAD STI Surveillance System.)
There were continued falls in genital warts diagnoses (a decrease of 11%, from 57,311 to 51,274 between 2018 and 2019, largely due to the substantial declines in young people).
In 2019, the rate of genital warts diagnoses among girls aged 15 to 17 years attending sexual health services was 91% lower compared to 2015 (16.9 versus 193.5 per 100,000 population). The fall is attributed to HPV vaccination, as most of these girls would have been offered the quadrivalent HPV vaccine (which offers protection against genital warts as well as cervical cancer) when aged 12 to 13 years old. A decline of 81% (10.0 versus 53.3 per 100,000 population) was seen in same-aged heterosexual boys over the same period, suggesting substantial herd protection.
Chlamydia was the most commonly diagnosed STI in 2019, accounting for 49% (229,411) of all new STI diagnoses. The annual report presents data from the National Chlamydia Screening Programme (NCSP), which provides opportunistic screening to sexually active young people aged 15 to 24 years. In 2019, more than 1.3 million chlamydia tests were reported, representing a 2% increase since 2018.
While the number of chlamydia tests carried out increased in the past year, there has been a 13% decline in the number of tests since 2015. Between 2018 and 2019, the number of chlamydia diagnoses in people aged 15 to 24 years increased by 2% (from 132,136 to 134,418) and testing positivity remained stable at 10%. Chlamydia screening activity among people aged 15 to 24 years continued to increase in online testing services with a 22% rise in the number of tests carried out by these services between 2018 and 2019. Online testing services now account for 20% of chlamydia tests and 17% of chlamydia diagnoses reported in this age group.
The annual STI/NCSP report emphasises the disproportionate impact of STIs in young heterosexuals aged 15 to 24 years, black ethnic minorities and MSM, and concludes by highlighting several initiatives that PHE is supporting to address these inequalities in sexual health.
The report has been published alongside the STI and NCSP data tables and slide sets, and an infographic is also available. Data on diagnosis and chlamydia detection rates at local authority level have been published in PHE’s Sexual and Reproductive Health Profiles.
PHE is undertaking analyses of STI surveillance data reported during the first part of 2020 to understand the impact of service disruption due to the COVID-19 pandemic response on the provision of HIV/STI services and the effect that social distancing measures may have had on the epidemiology of STIs. Provisional findings will be published within the coming months.
COVID-19 surveillance update
The latest UK weekly statistics from the NHS Test and Trace service, covering the period 27 August to 2 September 2020, indicated that 82.7% of individuals testing positive and being transferred to the contact tracing system were reached and asked to provide information about their contacts.
In the service’s 14th week of operation:
- 4,389,503 people were newly tested under pillar 1 (in hospitals and outbreak locations) and pillar 2 (national swab testing)
- 358,294 people were reached (including both those testing positive and their contacts)
- 79.4% of contacts where communication details were given were reached and told to self-isolate
- 89.6% of in-person tests results were received the next day after the test was taken
- capacity for pillar 1 testing was at 575,381, an increase of 0.08% since the previous week
- capacity for pillar 2 testing was at 1,001,500, an increase of 12.7% since the previous week
- capacity for pillar 3 testing (mass antibody testing) was at 840,000, the same as the previous week
- capacity for pillar 4 testing (prevalence studies) was at 82,700, an increase of 93.7% since the previous week
Since the start of its operation:
- 358,294 people have been reached by the service; this includes both those testing positive and their contacts
- 87% of all contacts where communication details were given have been reached and told to self-isolate
National Weekly Surveillance Report (NWSR)
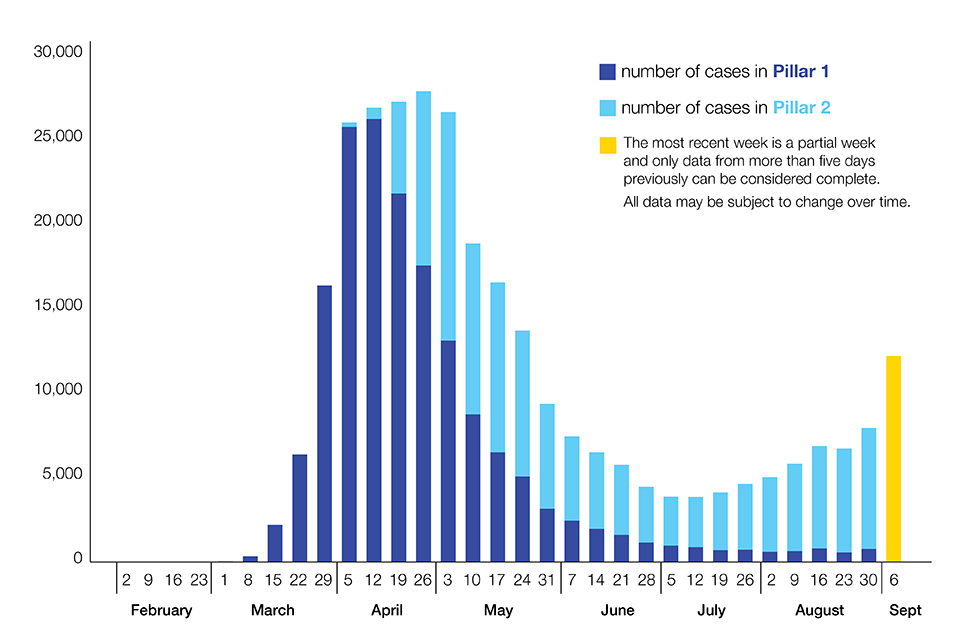
Summarising the national epidemiological picture, the latest NWSR (including data to 6 September 2020) stated:
‘Case detections in England increased from 7,955 in week 35 to 12,217 in week 36. Case rates were highest in North West and Yorkshire and Humber. At a local authority level, incidence was highest in Bolton. Case rates continued to be highest in the 20 to 29 year age group. Positivity rates have increased in all age groups and regions, with a particularly steep increase in positivity seen in over-85s tested through Pillar 2. Among young adults, there has been a shift in the demographic of cases in recent weeks from the highest rates among those in the most deprived groups towards those in the least deprived groups.’
The latest NWSR epidemic curve for England (below) shows laboratory-confirmed COVID-19 cases in England, as at 6 September 2020 (by date of specimen collection).
The infographic that accompanies the NWSR provides more detailed national trend information, across a wider range of parameters, than the Coronavirus Cases in the UK: daily updated statistics.
Since the beginning of August, in addition to national data, PHE has published, weekly, detailed localised epidemiological data – visualised as maps and epidemic curves – that have underpinned local interventions in recent weeks. These reports, titled ‘Contain framework lower tier local authority watchlist: maps’, are available on the National COVID-19 Surveillance Reports, alongside the weekly COVID-19 surveillance report.
A significant uptick in daily case detections (which could not be wholly attributed to increased testing) had initially been registered in the first days of September.
In the week ending 6 September (covered by the latest NWSR), case rates continued to rise and remained highest in the North West of England and in Yorkshire and Humber.
The following local authorities remain subject to ‘intervention’ (including, in many wards, the prohibition of any inter-household mixing) in view of their having the highest rates of positive testing in England (per 100,000 population, 7-day average):
- Bolton
- Birmingham, Sandwell and Solihull
- Blackburn with Darwen, Oldham and Pendle
- Leicester
- Bradford, Salford, Preston, Rochdale, Tameside, Manchester, Bury, Kirklees, Solihull, Calderdale and Trafford
A further 30 local authorities are currently listed on the NWSR Watchlist as either ‘of concern’ or subject to ‘enhanced support’.
In the case of some local authorities, spikes in August were related to workplace outbreaks: one at a Norfolk poultry farm (affecting Norwich, King’s Lynn and West Norfolk, South Norfolk, North Norfolk, Breckland and Broadland); another in Northampton that generated a large spike in cases in the early part of August.
However, overall, household and community transmission were identified as significant transmission pathways underpinning high infection rates recorded since August in the north of England. This was particularly the case for parts of Greater Manchester, East Lancashire, Preston and West Yorkshire, which continued to be the subject of the various special measures developed jointly by central government and relevant local authorities.
The overall number of acute respiratory infection incidents reported to PHE Health Protection Teams increased in week 36, compared with the previous week, particularly in care homes, food outlets, restaurants and workplaces. Schools reopened in week 36 and there has been an increase in incidents in educational settings.
COVID-19 testing guidance for employers
On 10 September, the Department of Health and Social Care (DHSC) published guidance for employers and third-party healthcare providers on voluntary coronavirus testing in the workplace for those considering introducing internal testing programmes outside the NHS Test and Trace service.
This significant new guidance is intended to ensure such programmes are as reliable and effective as possible. It covers:
- relevant legislation, regulations and guidance for employers and third-party healthcare providers
- virus and antibody testing
- how test results should be interpreted and what steps should be taken after a positive or negative test
Impact of COVID-19 on childhood vaccination programmes
Childhood vaccination coverage in the UK is routinely monitored quarterly. However, more timely monitoring has been required during the COVID-19 pandemic and a first report on the impact of physical distancing measures is published in this issue of HPR.
Impact of physical distancing measures due to COVID-19 pandemic in England on childhood vaccination counts reviews aggregated childhood vaccination counts as a means of assessing diminution of vaccination delivery between January and April 2020.