Implementation and 4-month outcomes report: Evaluation of the Health-led Employment Trials
Updated 8 April 2024
Applies to England, Scotland and Wales

© Crown copyright 2024
This publication is licensed under the terms of the Open Government Licence v3.0 except where otherwise stated. To view this licence, visit nationalarchives.gov.uk/doc/open-government-licence/version/3 or write to the Information Policy Team, The National Archives, Kew, London TW9 4DU, or email: psi@nationalarchives.gov.uk.
Where we have identified any third party copyright information you will need to obtain permission from the copyright holders concerned.
This publication is available at https://www.gov.uk/government/publications/health-led-trials-impact-evaluation-reports/implementation-and-4-month-outcomes-report-evaluation-of-the-health-led-employment-trials
DWP research report no.1033
A report of research carried out by the Institute for Employment Studies on behalf of the Department for Work and Pensions.
You may re-use this information (not including logos) free of charge in any format or medium, under the terms of the Open Government Licence.
To view this licence, visit the National Archives
Or write to:
Information Policy Team
The National Archives
Kew
London
TW9 4DU
Email: psi@nationalarchives.gov.uk
This document/publication is also available on our website at: Research at DWP
If you would like to know more about DWP research, email: socialresearch@dwp.gov.uk
First published July 2023.
ISBN 978-1-78659-545-4
Views expressed in this report are not necessarily those of the Department for Work and Pensions or any other government department.
Executive summary
This report provides detailed insights into the implementation of the Health-led Employment Trial and a descriptive analysis of respondents to the survey that was undertaken 4 months post randomisation. It then explores the counterfactual impacts that could be discerned at this intermediate measurement point.
Four months after randomisation, the impact evaluation observed improvements in the treatment group’s confidence in their ability to look for and obtain employment, and small positive effects on the health and wellbeing primary outcome measures – all factors on the causal pathway established for the trial. The survey showed high degrees of satisfaction with the service provided.
The process evaluation provided insights into how the trial was implemented in each area, the issues and challenges encountered and factors that supported effective delivery. Some key lessons included the importance of ongoing staff training and particularly focusing on building capability for employer engagement, as employment specialists could struggle with this; continued attention to relationships with GPs and health partners to foster support; the importance of location in community settings as well as being able to co-locate with other services which supported integration. Equally, if recruits in future are sourced from Jobcentre, findings indicated the importance of continued briefing on the voluntary nature of IPS support.
Throughout the report, references are made to information and tables contained in the appendices report, ‘Evaluation of the Health-led Employment Trials: Appendices to the 4-month outcomes report’ – which is the companion piece to this, the main report from the 4-month evaluation. These references take the form of (Appendices, Chapter x, Table x:x).
The final report series for the trials covers:
- synthesis report – a high-level, strategic assessment of the achievements of the trial, drawing together the range of analyses from the evaluation.
- four-month outcomes report covering: an analysis of implementation, a descriptive analysis of the survey findings 4 months post-randomisation, and an assessment of impact at 4 months following randomisation.
- 12-month survey report providing a descriptive analysis of the final survey, based on the theory of change for those in the treatment group.
- context-mechanism-outcome (CMO) report, reporting evidence on outcomes from the trials and relating these to its theories of change.
- 12-month impact report covering the net effect on employment, health and wellbeing resulting from the trials 12 months after randomisation drawing on administrative and survey data.
- economic evaluation report exploring the costs and benefits arising from trial delivery, drawing on the administrative and survey data.
- the pandemic and the trial – an analysis of how the trial outcomes may have been affected by the onset of COVID-19.
Authors’ credits
Becci Newton is Director of Public Policy Research at the Institute for Employment Studies and specialises in research on unemployment, inactivity, health, skills and labour market transitions. Becci has managed the evaluation since its design and contributed to the process evaluation. She has led multiple evaluations for DWP including of the 2015 ESA Reform Trials and the Work Programme.
Rosie Gloster is a Senior Research Fellow at the Institute for Employment Studies. She supported the management of the evaluation consortium and contributed to the process evaluation. She is a mixed-methods researcher specialising in employment, and careers. She has authored several reports for the Department for Work and Pensions (DWP), including the Evaluation of Fit for Work.
Richard Dorsett is Professor of Economic Evaluation at the University of Westminster. He has worked on numerous impact evaluations, mostly in the fields of employment, welfare and education/training. He led on the statistical design of the trials and the impact analysis.
James Cockett is a Research Fellow (Economist) at the Institute for Employment Studies. He has supported the 4-month impact analysis of the Health-led Trials. He is a Labour Economist with a particular interest in labour market transitions of disadvantaged groups. James has authored reports for both the Low Pay Commission and the Social Mobility Commission in his early career.
Matthew Gould is a Lecturer in Economics at Brunel University London. His research specialises in applying theory and computation to a range of economic problems. He has worked on several projects focussed on education, employment and taxation. He led on the development and maintenance of the randomisation tool.
Dr Karen Windle is Director of Health and Social Care at NatCen Social Research. She has extensive experience of complex research and evaluation assessing effectiveness and cost-effectiveness of a range of innovative programmes and interventions. Karen is programme director of the Health-led Trials at NatCen, responsible for supporting the delivery and analysis of the 4-month and Final Surveys. Joe Crowley is a Senior Researcher in the Health and Social Care team at NatCen Social Research. His main methodological expertise lies in survey data collection and analysis. He has worked across a variety of large-scale surveys, including NatCen’s flagship British Social Attitudes survey and Family Resources Survey.
Amelia Benson is a Senior Researcher in the Health and Social Care team at NatCen Social Research. Her primary areas of research cover health, welfare and the labour market. Recent projects include an evaluation of the Personal Support Package for DWP and a National Institute for Health Research (NIHR)-funded report into tobacco control measures in Europe and the UK.
James Yarde is a Senior Statistician at NatCen Social Research. He has supported the weighting of the surveys for the Health-led Trials. In his role at NatCen he is responsible for the sampling and weighting of surveys, as well as undertaking analytical work. His work covers a range of random probability surveys, including British Social Attitudes and the National Travel Survey.
Imogen Martin is a Research Assistant in the Health and Social Care team at NatCen Social Research. She has worked on areas across the policy spectrum including healthcare, disabilities and welfare. As part of the Health-led Trials, Imogen has assisted with the delivery and analysis of the 4-month and Final Surveys.
Becca Gooch is a Research Manager at Learning and Work Institute. She managed part of the process evaluation. She is a mixed-methods researcher who has worked on a range of research and evaluation projects, with a focus on employment, equalities and disadvantage within employment.
Jess Elmore is a Researcher at Learning and Work Institute. She contributed to the process evaluation. She is a qualitative researcher who has worked across a range of projects with a focus on disadvantaged or hard-to-reach groups and their access to education and employment.
Seana Friel is a Researcher at Learning and Work. She contributed to the process evaluation. Seana works on a range of research and evaluation projects at L&W, and has experience of conducting research with a variety of populations including disadvantaged groups such as care leavers, disabled people, people experiencing multiple disadvantage as well as people experiencing homelessness.
Joanna Hofman is a Research Leader at RAND Europe focusing on research and evaluation in the fields of employment and social policy. She has led several evaluations of the Individual Placement and Support (IPS) including of IPS for Alcohol and Drug Dependence for Public Health England (PHE). She contributed to evidence reviews that informed the trial design and this synthesis report and advised throughout the evaluation.
Rebecca Duffy is a Project Support Officer at IES who led proofing and formatting of this report.
Glossary of terms
| Term | Definition |
|---|---|
| Area | A defined, geographic area within a trial site |
| Base | The number of observations or cases in a sample. For example, a survey may have a base=2,300 respondents. During analysis the base may become smaller, e.g. if not all respondents answer a question, or when analysing responses a subset of the full sample. |
| Baseline data collection | Data from the baseline assessment completed by provider staff who recruited people to the trial. |
| Binary variable | A variable measured with only two possible values: hot and cold, 0 and 1, or happy / unhappy. More complex variables (such as a happiness scale from 1 to 7) are sometimes re-coded as binary values during analysis. |
| Bivariate analysis | The analysis of two variables for the purpose of determining the statistical relationship between them. |
| Causal link | The connection between a cause and an effect. |
| Controlling for | In statistical modelling with multiple variables and factors, keeping one variable constant so to examine and test the relationship and effect between other variables in the model. |
| Correlation | In statistics, the association or relationship between two variables, not necessarily causal. For example, the rings in a tree trunk increasing with the age of the tree is an example of positive correlation. |
| Dataset | A collection of data or information such as all the responses to a survey or all the recordings from a set of research interviews. |
| Demographic | A particular section of the population. Also refers to characteristics of an individual of interest for research, such as age, gender, and ethnicity. |
| Derived variable | A variable that was not directly asked in a survey, but created at analysis stage, for example by merging two or more variables. |
| Descriptive analysis | Producing statistics that summarise and describe features of a dataset such as the mean, range and distribution of values for variables. |
| EuroQol-5D-5L (EQ5D5L) | Descriptive system for health-related quality of life states in adults, consisting of five dimensions (Mobility, Self-care, Usual activities, Pain & discomfort, Anxiety & depression), each of which has five severity levels described by statements appropriate to that dimension |
| Employment specialists | Staff employed by the trials to undertake randomisation appointments, provide IPS support to the treatment group, and undertake employer engagement. |
| Final survey | The survey completed by recruits 12 months after randomisation. |
| Health-led Employment Trials | Two trials, funded by the Work and Health Unit, to test a new model of employment support for people with long term health conditions. |
| 4-month survey | The survey completed by trial recruits four months after starting the trial. |
| Intervention | The work and health support provided in Sheffield City Region and the West Midlands Combined Authority as part of the trial. |
| In employment/working | Those in employment full-time, part-time, or less than 16 hours a week; those who are self-employed. |
| In paid work | Those in employment full-time, part-time, or less than 16 hours a week, not those who are self-employed |
| Individual Placement and Support (IPS) | IPS is a voluntary employment programme that is well evidenced for supporting people with severe and enduring mental health needs in secondary care settings to find paid employment. |
| IPS fidelity scale | A scale developed to measure the degree to which IPS interventions follow IPS principles and implement evidence-based practice. |
| Job search self-efficacy | Nine item scale to measure self-efficacy relating to finding employment. |
| Longitudinal surveys | Repeated surveys that study the same people over time. |
| Multi-morbidity | The occurrence of multiple chronic conditions within the same individual where no single condition holds priority over the co-occurring conditions. This term was selected as the evaluation does not hold information about the main condition affecting recruits. |
| Participants | Recruits allocated to treatment, who had 2+ meetings with an employment specialist. This is used in the 4-month impact analysis to differentiate between those who experienced limited support beyond randomisation, as in the impact evaluation intention to treat is the basis for analysis. Other terms are used to describe people taking part in the trial (recruits) and people taking part in the surveys (respondents) – see below. |
| Prevalence | The extent to which something occurs in a population or group, often expressed as a percentage. |
| Provider staff | Those working in provider organisations including employment specialists delivering IPS support, as well as managers and administrators |
| p-value | A measure of statistical significance. Low p-values indicate results are very unlikely to have occurred by random chance. p<0.05 is a commonly cited value, indicating a less than 5 per cent chance that results obtained were by chance. Research findings can be accepted with greater confidence when even lower p-values are cited, for example p<0.01 or p<0.001. |
| Randomised controlled trial | A study to test the efficacy of a new intervention, in which recruits are randomly assigned to two groups: the intervention group receives the treatment, the control group receives either nothing or standard treatment. |
| Recruits | People who agreed to take part in the trials and who were randomised to either the treatment or control group |
| Refer / referral | A recommendation that an individual should be considered for the trial, facilitated by a means to directly connect them to a trial provider |
| Respondents | Trial recruits who took part in the evaluation surveys. As such the descriptive analysis of the survey identifies treatment group respondents and control group respondents |
| Self-refer / self-referral | Individual applies for more information about the trial via the trial website or helpline and uses information there (phone number, web form, email) to make contact with the trial provider and request support. |
| Signpost | Recommendation to an individual from a support organisation that they consider joining the trial, by providing them with information (leaflets, reference to website or helpline) leading potentially to the individual self-referring into the trial |
| Site | The trials were delivered in two combined authorities, termed sites. |
| Statistical significance | This indicates that a result is unlikely to be caused by chance (to a specified degree of confidence) and can be accepted as valid. The significance level is the probability of the study rejecting the null hypothesis (that there is no relationship between two variables), demonstrated by the p-value of the result. |
| Short Warwick-Edinburgh Mental Well-being Scale | SWEMWBS is a short version of the Warwick–Edinburgh Mental Wellbeing Scale (WEMWBS). It was developed to enable the monitoring of mental wellbeing in the general population. |
| Survey | A research tool used to collect data by asking scripted questions or using lists or other items to prompt responses. |
| Tenure | Housing arrangement or status of an individual, for example owner occupier, private renter, or local authority or housing association renter. |
| Theory of Change (ToC) | A description and illustration of how and why a desired change is expected to happen in a particular context. It sets out the planned major and intermediate outcomes and how these relate to one another causally. |
| Thrive into Work | The name given to the trial in WMCA |
| Trial arm | This denotes the allocation of recruits to the treatment or control group, with these groups known as the trial arms |
| Trial group(s) | There are three trial groups: two out-of-work (OOW) groups (one in each combined authority), an in-work (IW) group in Sheffield City Region (SCR). Groups are pooled as All OOW and All SCR in the analysis |
| Variable | A variable is defined as any individual or thing that can be measured. |
| Weighting | During analysis of survey data, adjusting for over- or under-representation of particular groups, to ensure that the results are representative of the wider population. |
| Working Win | The name given to the trial in SCR. |
1. Process evaluation findings: Sheffield City Region
This chapter presents findings from the process evaluation of the Health-led Employment Trials in the Sheffield City Region (SCR)[footnote 1]. It documents recruitment to the trial and the delivery of support. It also covers intermediate outcomes, and the causal mechanisms it was possible to detect for these.
1.1. Introduction
The research reported in this chapter is based on the mix of interviews shown in Table 1-1. The analysis focuses on capturing information on implementation in order that lessons for delivery can be learned.
Table 1-1: Interviews in SCR
| Fieldwork period | Respondent type | SCR interviews |
|---|---|---|
| – | Recruits: treatment group | 24 |
| September to November 2018 | Staff | 14 |
| September to November 2018 | Stakeholders and partners | 5 |
| April to June 2019 | Recruits: treatment group | 11 |
| April to June 2019 | Recruits: Control group | 8 |
| April to June 2019 | Treatment group: Longitudinal panel 1 | 10 |
| April to June 2019 | Treatment group: Longitudinal panel 2 | 12 |
| April to June 2019 | Staff | 9 |
| January to March 2020 | Recruits: treatment group | 13 |
| January to March 2020 | Recruits: control group | 9 |
| January to March 2020 | Treatment group: longitudinal | 12 |
| January to March 2020 | Staff | 11 |
1.1.1. Local context in the site
The trials were designed differently in WMCA and SCR. These different approaches made it more challenging to separate out the impact of local contextual factors from the impact of the different approaches to commissioning. In SCR, the five local authorities and health bodies (CCGs) in the region came together to design the trial. This partnership commissioned a single provider – South Yorkshire Housing Association (SYHA) – to deliver the trial. A key difference was that in SCR the trial accepted people who were out-of-work (OOW) as well as people who were in-work (IW) who needed support to move roles or return to work after a period of sickness, whereas the trial in WMCA recruited only people who were unemployed.
1.2. Accessing the trial
Staff across SCR sought to raise awareness with potential recruits, healthcare professionals, and other organisations that could make referrals. These activities continued throughout the trial, and intensified in the run up to the end of the referral period in October 2019.
1.2.1. Awareness raising
The main referral routes planned for the trial were primary care (e.g. through GPs), community care (e.g. Increasing Access to Psychological Therapies (IAPT) services), and self-referral. All promotional materials and messaging were approved by the Health Research Authority (HRA) to ensure they were clear, balanced and ethical in approach. In SCR, the trial was branded Working Win and the marketing strategy was developed by staff at the city region level.
Figure 2.1: Referral sources in SCR
| Referral source | % |
|---|---|
| Local GP | 18 |
| Specialist care service | 26 |
| Other or self referral | 56 |
Source: Service provider MI
Figure 1-1 shows the sources of referral in SCR; just under a fifth of recruits were referred by their GP, a quarter by a specialist care service, and more than half either self-referred or were referred by another organisation, a pharmacist for example. Recruits interviewed for the process evaluation had been referred by sources, including primary and community health services, or had self-referred after finding out about the trial through marketing materials or at local job fairs.
Engaging and activating primary and community care providers on recruitment
The trial planned for primary and community care providers to be the main source of referrals. The goal of raising awareness with these providers was to initiate an ongoing relationship whereby healthcare providers would refer patients to the trial, and integrate their work to enable individuals’ complex needs to be supported in a co-ordinated way.
The trial in SCR was commissioned via the CCG, and representatives from the CCGs and Integrated Care System (ICS) sat on the steering group. This supported SYHA to build links and access healthcare settings. This strategic level engagement and integration was supported by direct communications to healthcare staff. For example, provider staff used information sheets to outline the referral process and the support available for those in the treatment group. The information sheets were also used to answer a series of frequently asked questions including details of eligibility, potential benefits and a diagram explaining the RCT process[footnote 2].
The trial marketing team created webpages and videos targeted at healthcare professionals, providing a general introduction to the trial and how it worked. The use of key facts relating to the welfare benefit, Employment and Support Allowance (ESA), and mental health at work aimed to demonstrate to professionals the importance and local need for the trial. The website also contained short videos of healthcare professionals encouraging their colleagues to refer, making use of peer-to-peer messaging. Messages in these videos included the perception among health professionals that employment is significant for rehabilitation, that the trial could fill gaps in what health services can deliver, and that the trial provided a positive alternative to supplying Fit Notes.
How messages were received by health referrers
Staff felt that GPs were receptive to success case studies for the treatment group although several spoke of challenges in engaging GPs, noting variations between GP practices. Some GPs were reported to have had previous negative experiences of the Fit for Work service[footnote 3] which made them cautious about referring into the trial. Others were reluctant to ‘recommend’ another organisation to patients in case it negatively affected the patient relationship. Delays to trial launch meant some early momentum was lost, and relationships with some GPs were also lost. Some staff perceived that the delays to the launch caused some reputational issues about their delivery capability with healthcare providers.
There was also a lack of understanding about the trial among some healthcare professionals. One healthcare provider explained that at the start of the referral period they did not understand what the trial entailed, which meant they could not fully explain it to their patients and make referrals. Over time, repeated face-to-face contact between the SCR staff and healthcare partners was viewed as valuable by healthcare professionals and enabled them to better understand the trial and the eligibility criteria.
Time pressures in health referrers
Staff reported that it was easier to access receptionists and practice managers than GPs given the pressures on GPs’ time. These time pressures also manifested through limited appointment times with patients, such that GPs were not always able to refer directly during an appointment. The issue of limited time within appointments was not unique to GPs. For example, one healthcare partner identified that time was also limited in their patient appointments, making it challenging to fully introduce and discuss the trial with a potential recruit.
SCR Healthcare partner said:
We only have a 30-minute assessment with a patient and that’s quite a complex assessment. There is a lot that has to be done in that 30 minutes. I think a lot of people within our team really struggled to get a conversation into that 30 minutes that was adequate to inform that patient enough for them to make a decision as to whether that’s a service that they wanted to access or not.
Healthcare partners reported that a lack of time within appointments led them to provide potential recruits with information leaflets about the trial rather than make a direct referral. These would have been recorded as self-referrals at baseline, hence the true number of referrals from health settings is likely to be under-estimated.
Some concerns about the RCT
Some healthcare providers were concerned about the randomised controlled trial (RCT) and were reluctant to refer patients for fear of them being randomised into the control group. Their main concerns centred on patients with mental health issues and low confidence having their hopes raised about additional support, then dashed when randomised into the control group. Allocation to the control group was sometimes viewed by those recruits as rejection, which health partners feared would negatively impact their patients.
SCR healthcare partner said:
One of the main concerns is about the randomised control nature of it… we’re working with patients with depression and anxiety, low confidence, low self-esteem, and when you tell the patients that they might get the intervention or they might not get the intervention, and then they’re being referred through, and people do get their hopes up, and then they’re assessed, and [allocated to the control group]…it is like another rejection…with very vulnerable people…And as a result, the therapists have actually been quite reluctant to refer.
Maintaining health partner relationships was time-consuming
Once health settings were engaged, provider staff found it time-consuming to maintain this engagement, particularly where they were not co-located. This required greater efforts and ongoing engagement to remind GPs of the trial, speak to them about referrals and keep the trial on their agenda. To help combat the issue of time-limited appointments, SCR staff worked with GP practices to staple leaflets about the trial to Fit Notes. Some staff noted that this had worked well because messages were delivered to potential recruits at an appropriate time, and in a way that did not require time from GPs.
Part way through the delivery period a number of additional measures were put in place to help increase referrals from GPs. Staff worked with some GP practices to identify relevant patients from their caseload to be sent a text message introducing the trial and signposting patients to further information. Where this happened, staff felt it was an effective way to generate referrals, particularly in large practices, as GPs lists could identify eligible people without relying on GPs to engage with patients directly. However, some GP practices did not want to undertake this approach because they felt it crossed into marketing rather than patient care.
Provider staff noted examples of co-location in healthcare settings, such as with IAPT teams, and reported that there was an increased likelihood of referrals from these sources. Where co-location happened, SCR staff had closer relationships with healthcare teams and were able to speak to them about the trial and individuals they referred. Another factor which was seen to generate referrals was the IAPT teams’ understanding of IPS and the benefits of employment support more generally. Co-location with healthcare providers, such as physiotherapists, who support people with physical health conditions, was highly variable.
SCR Staff member said:
Physical health has worked brilliantly in some settings… it almost depends on where people feel their capacity is at to engage.
Staff felt that the trial was more successful at integrating and encouraging referrals from IAPT services and less so from musculoskeletal (MSK) services, although there were differences within, not just between, sites. The relative strengths of the links are likely to have affected not only the referral sources of recruits, but also the types of health conditions trial recruits experienced.
Referrals from community organisations and employers
Staff felt that they had built good partnerships with a range of community organisations to encourage referrals, including Jobcentre Plus, training providers, community groups and libraries. In some cases, this was fostered by co-location.
Provider staff worked from a variety of venues, which helped to nurture relationships and maintain continued engagement and referrals throughout the delivery period. Staff felt that where partner organisations understood the trial well, they were able to make relevant and effective referrals because of their existing knowledge about the needs and experiences of the community.
The trial in SCR aimed to build relationships with local employers both to gain access to job vacancies and for employers to refer employees who might need support to the trial. For example, staff worked jointly with one large service sector employer that advertised the trial to their staff, to encourage employees with health issues to self-refer. This included employees managing a health condition while continuing to work, as well as those on sick leave. The employer already offered an Employee Assistance Programme (EAP) and had well-developed line management practices, but felt there would be value to including Working Win as part of their ‘employee offer’ to help them to retain staff. A provider staff member was co-located at the company one day a week to brief potential recruits and meet with treatment group members to deliver support on the company’s premises during the working day. The employer described how they promoted the trial:
SCR employer and delivery partner said:
The agreement between us was that we’ll promote Working Win as part of our toolkit for our employees if you’ll come to site and make it easy for our employees to access you… And obviously we encourage them [employees] to get involved; we did quite a big comms drive about Working Win, and we did that at senior leadership team level, to get buy in and support for HR. And then we took it down to the office and managers and the team mangers were the people that we wanted to reach to.
Self-referrals
Self-referrals were the largest source of referrals, although it was not always possible to accurately determine where self-referrers first heard about the trial. The marketing campaign targeting potential referrals from the general public included adverts on buses and bus shelters, as well as local radio and TV, to encourage self-referrals via the website. The website also presented information about how employment can benefit mental and physical health, including case studies from recruits. Provider staff also attended job fairs and handed out leaflets in supermarkets to try to generate community awareness. This enabled the trial to access recruits who might otherwise have been missed, including people not already in contact with healthcare services or community organisations. However, staff reflected that it was challenging to communicate the RCT effectively through a poster/website campaign, which then affected recruits’ understanding of the trial. The general view was that the RCT needed to be explained in person for people to fully comprehend the offer.
1.2.2. Referral processes
There were two referral processes in SCR. Referrals from individuals or referring organisations, including self-referrals, were accepted via the website. Primary care services could also refer people directly using the EMIS system, the most widely used clinical record system for primary care in the UK. This process was designed to be as light-touch as possible to encourage referrals, especially by GPs and clinicians who had limited time. Staff believed that this helped with generating referrals. The online referral form for individuals and third sector organisations was designed to take around one minute to complete. There was consensus amongst staff that the referral process worked well and contributed positively to the number of referrals.
SCR staff member said:
What’s really helped is investing in our technology, our referral website, trying to keep the amount of information on that referral website to what we needed to know rather than everything we could possibly be interested to know to try and minimise the burden on people self-referring themselves or referrers signposting, referring in their patients.
One drawback, however, was that its ease and simplicity resulted in some inappropriate referrals, both from community organisations and through self-referrals. When staff followed up on referrals, they found some individuals did not want to work, and others were people with high English language needs who staff felt, despite the accommodations they might make in translating documents and ensuring they had someone to support them during the initial appointment, would not be able to participate fully without language support, which was not available for service delivery under the contract. This practice was in accordance with the process approved by HRA.
Because of the different ways in which people both found out about and were referred to the trial, there was significant variation in how the trial was understood among potential recruits. This varied understanding meant that staff needed to offer an initial phone call to discuss the trial and confirm interest and suitability prior to the initial appointment. Whether recruits had referred themselves or had been referred by others impacted on their engagement and motivation to join the trial. Staff felt self-referrals were more likely than those referred by others to be motivated to engage.
1.2.3. Reasons recruits engaged
The main reasons recruits – people who agreed to randomisation - reported joining the trial were a desire to re-enter the workforce and/or a need for support managing their health condition. Their priority in joining depended on their health and employment situation, and the information they had about the trial prior to the initial appointment. The eligibility which included people who were in employment (SCR IW) and those who were not (SCR OOW) meant reasons for engaging also varied between these groups.
Some of the OOW recruits engaged because they wanted support to manage their health condition(s); others joined to gain support to find work. The SCR IW group included some people who wanted support in managing a difficult situation in their current employment, whereas others sought help to understand their career options with a view to changing jobs. Some recruits believed the trial only offered employment support; others thought it primarily offered health support.
Recruits’ understanding of the trial fed through into their expectations and motivations. As such, some were motivated by the opportunity to receive health support, and others primarily focused on the chance to receive employment and job search support.
SCR OW treatment group said:
Well, at first, I thought it was about, you know, about my health, I thought it was about me getting help so when I went down to see, you know, the job worker it was about jobs and it was to do about my health as well.
SCR IW treatment group said:
Well, I was applying for all these jobs and really not getting anywhere and because of that, I thought my confidence was getting knocked. I thought it was me and I thought I was doing something wrong. I couldn’t understand why I wasn’t getting anywhere
Recall of information about the trial varied
The information that recruits could recall from the point of referral was very varied. Some had inaccurate views of the trial, such as one who was motivated to take part because they understood the trial to offer a befriending role. Some had an accurate but incomplete perception, while others had a very detailed understanding of the trial, positively impacting their motivations to engage.
SCR control group said:
To me it was an absolute no brainer, this is what people in my position need, somebody to actually help them to do what they want to do…and have the support ongoing as well over a long period of time…as well as the joined up thinking between the different organisations, contact with the CAB and the DWP and employers and everything.
Several recruits expected more support with job search. IPS is designed to support people with sourcing ‘hidden’ jobs – those which are not advertised online or on public jobs boards – alongside regular job search activities. However, some recruits were either unaware or did not seem to understand that this was something IPS could support them with.
SCR OOW treatment group said:
When I eventually did a couple of sessions it was quite clear that you were just… all you were doing was what you could do yourself, look on the internet and look for jobs. There were no insider deals or anything like that. They didn’t know…They couldn’t find jobs that we couldn’t.
Core to the IPS ‘place then train’ model is a focus on finding a job quickly and then continuing to provide support for people in their new role. As such, IPS recipients are encouraged to commence job search activities soon after starting to receive IPS support. Staff felt that this message was not impressed strongly enough during awareness raising and recruitment, which meant that some recruits were not necessarily ready for work in the short term, and thereby inappropriate for the trial.
SCR staff member (focus group) said:
Because some of our customers might have had a background from sickness benefits of ten years, they’ve had no interactions of job search with the Jobcentres of this world, so they’re coming absolutely raw. What their perception of the trial probably was, was about helping them around their health first and then get a job
Recruits who were not working, particularly those receiving benefits with conditionality, were not always clear that engagement was voluntary. Several recruits had been mandated to employment programmes before or were being supported by Jobcentre Plus and were concerned that the terms of engagement would be similar on the trial. For example, they thought they would be required to take any job offer. The culture of the referring organisation and the ways it engaged with recruits affected perceptions of the trial. Some recruits felt pressure to join the trial because of their benefits claim with Jobcentre Plus. In contrast, others believed they would not be pressurised to find work because they had been referred by an IAPT team.
SCR recruit said:
I just felt it was another hoop I had got to jump through for the DWP… I just thought I would try it because at least then if I wasn’t coming up with interviews for jobs, it was the DWP’s view when I went to sign on that I was with Working Win and they might leave me alone.
SCR recruit said:
So knowing that it’s been recommended from an IAPT team and that people would have more of an understanding regarding mental health, I just thought at least I’m going to be dealing with people that weren’t going to be pressuring me [to find work].
In-work recruits tended to have a different set of expectations and motivations for engaging with the trial than out-of-work recruits. These motivations included wanting support managing work situations or changing job roles. Some in-work recruits expressly reported that the confidentiality of the trial was important because they did not want their employer to know they were accessing support.
SCR recruit said:
I wanted somebody there that would help me, because it got to a point with work where I was going to quit… because I couldn’t cope, because I had a lot going on at home…And she sort of gave me that boost to say ‘no, come on, you need to do it. If you don’t like it, let’s have a look at what other options you’ve got’.
1.2.4. Views and experiences of the initial meeting
Waiting times and location
Nearly all of the recruits interviewed reported being contacted by a member of provider staff soon after their referral. Typically, this was less than two weeks and, in some cases, just a few days. Recruits felt that this amount of time was reasonable and felt they were engaged in a timely manner. Staff believed that arranging appointments quickly after a referral and holding subsequent ongoing support appointments as soon as possible was key to engagement. This was enabled by staff having sufficient capacity in their caseload to arrange and hold appointments:
SCR staff member said:
We know if we got customers in quicker they’re more likely to engage…We’ve been able to capitalise on the staffing numbers that we’ve had and get people actively going out and promoting the trial and talking to referrers and then being able to contact customers really quickly but also being able to see them really quickly as well.
Initial meetings were held in a variety of locations based on staff and recruits’ availability and preferences. Staff spoke of the importance of meeting people in places where they felt comfortable and which were convenient. These spaces included cafés as well as organisations where provider staff were co-located. In SCR, towards the latter part of the trial, staff were also able to offer initial appointments via Skype which better suited the needs of some recruits. Generally, recruits welcomed the choice and flexibility staff demonstrated in agreeing where to meet, although some, with hindsight, did not like responding to the baseline data collection and discussing personal and sensitive issues in an open space:
SCR recruit said:
It was a bit awkward because where we had it wasn’t private… it was in a big area where people were waiting to be seen and they just went into cubicles, so everybody could hear.
Understanding it was an RCT
Staff were aware that referral partners had limited time to explain the trial to potential recruits, and there were also limitations in the information that publicity materials such as posters could convey. This meant that recruits did not always know at the point of referral that the trial was an RCT and not a service. Staff noted the importance of providing clear information about the trial and what people could expect, in order to secure engagement. When an initial appointment was made, staff included the information sheet and materials explaining the trial as part of an email confirming the appointment. This meant potential recruits could read and digest this information before the initial meeting. In addition, staff tended to call recruits before their initial appointment to introduce themselves, discuss the trial and confirm the meeting:
SCR staff member said:
I always give them a courtesy call just to introduce myself, so they’ve always spoken to me. I confirm where we’re meeting that it’s going to be suitable for them…and usually just have a little chat while they’re on the phone so I actually know all that connection there’s a rapport starting up before that first meeting.
However, several recruits who had been allocated to the control group, said they had not understood that it was a trial rather than a service at the point at which they joined, which was a source of disappointment. Other recruits allocated to the control group remained unclear about their role on the trial when interviewed and believed that the member of staff would be in touch again to offer support. Others thought they were not eligible for the support based on their answers to questions at the initial meeting. However, some recruits allocated to the control group were able to clearly explain the process and result.
Baseline data collection and the randomisation process
The randomisation process included the collection of baseline information on characteristics, health and wellbeing, individual circumstances and barriers to employment. Several staff believed this was in conflict with the IPS strength-based approach which characterised on-going support appointments, but recruits did not particularly set out concerns.
Generally, recruits allocated to the treatment group found the randomisation process and initial meeting to be satisfactory, with information clearly explained:
SCR In-work treatment group said:
So everything was explained on that first session but explained at a good pace and they said even if we need to take two sessions to do this explanation we will do because obviously they wanted me to understand what I was getting into and what the pilot was for as well.
Disappointment at being allocated to the control group was expressed by several control group recruits and even where they understood that allocation was random, they felt dejected. For example, one recruit described being given a piece of paper with information of other services but said that she did not want to contact them and felt “very lost”. Some staff found the process of allocating recruits into the control group challenging, because they found it difficult to not support people whom they believed could benefit from being part of the treatment group.
To address this, part way through the delivery period the staffing structure was changed to have a member of the team dedicated to completing the initial appointment and randomisation process. Where this happened, the treatment group experienced a change in employment specialist between the initial appointment and further meetings. Some staff reported liking the new structure, both as it removed the RCT appointments for those who found them hardest, and made balancing different aspects of the job role easier. However, having tested this approach the trial reverted back to consistency between the employment specialists undertaking the initial appointment and on-going support for the treatment group, as this made caseload management easier and improved continuity for those receiving support.
1.3. Delivery of support
This section explores the support provided to the treatment group in SCR. The views and experiences of staff and the treatment group are explored in relation to caseload management, the types of support offered, the relationship between staff and the treatment group, as well as employer engagement and job brokerage. It considers the support offered in relation to the key elements of IPS and explores whether the experience of delivering and receiving support was different for those who are working and those who are not and for people with mental and physical health conditions.
1.3.1. Caseload management
Caseloads varied
Employment specialists had target caseloads of 30, in line with IPS models. However, they reported a wide variation, with 15 to 20 at the start and end of the trial, and peaks above 30 in the middle stages. Some reported caseloads significantly above target, in the mid-40s. This was mainly due to variations in both staff and recruitment. Employment specialists with higher caseloads reported finding their workload difficult to manage, making it challenging to fully implement IPS.
SCR staff member said:
I kind of feel as though following the IPS model I think to engage with 35 customers I think is quite challenging…in terms of meeting targets, meeting customers I don’t feel as though it’s enough time.
Some staff also reported that managing a high caseload was affecting their own work-life balance and was a source of stress and anxiety.
SCR staff member said:
Which… I mean it’s nice to support more people but it’s also quite stressful because I sometimes worry that the quality of service that I can provide people will be compromised because I have less time to prep.
Managers allocated those allocated to IPS support to staff based on their availability, their location and their referring organisation. However, sometimes it was not possible to keep within a geographical location, placing additional strains on staff time management. This was a particular issue in one local area in this site where at one stage referrals were made from Sheffield due to challenges in recruiting locally.
Flexibility was important
Staff were keen to meet flexibly with those receiving IPS and this could also create a challenge in terms of planning contact. As caseloads increased, some staff reported moving to a more structured approach and becoming more effective in caseload management.
SCR staff member said:
When I started the job, I’d just meet people whenever could suit them. Now I block certain days out for certain areas of the city and I’ll only offer them an appointment on that day.
Some staff found it particularly challenging to manage mixed IW and OOW client lists, where working people receiving IPS support required evening and weekend meetings while those who were not in employment could prefer daytime meetings.
COVID-19 placed constraints on operation
Before the move to remote support in March 2020 outreach was a significant feature, with appointments held close to people’s homes. While some support was delivered remotely prior to the COVID-19 lockdown, it was normally offered in addition to face-to-face support, often for shorter catch-ups. The effects of the pandemic on delivery are fully explored in the report in this series covering the pandemic and the trial.
High levels of engagement
Staff reported a high level of engagement from those in the treatment group – referring to the uptake of support and meetings[footnote 4], which generally only dropped on return to work or due to worsening health. Contact was most often fortnightly. However, contact was sometimes less frequent, particularly as the SCR IW group who were working or once the SCR OOW had started a job. Contact in these cases was sometimes only by phone, email or text message rather than face-to-face.
Those receiving IPS support were generally very satisfied with the regularity of contact with their employment specialists. They also reported regular contact between meetings by email, text or telephone with nearly all saying they felt staff were responsive to their needs. Contact was generally fortnightly, though this varied between weekly and monthly dependent on individual needs. Contact was also often different for those who were working and those who were not, with those who were working sometimes receiving less frequent support due to the demands of work. Frequency also often varied over time with more meetings at first or at critical times.
SCR treatment group said:
So, when things were quite bad it was weekly and then we dropped it down to fortnightly and then down almost to monthly, or just telephone calls, I think.
However, some people in the treatment group felt that contact was not frequent enough as it meant progress was too slow. This was more commonly cited by those who reported monthly meetings but also included some who met fortnightly.
The only significant issue reported by treatment group members in relation to case management was when there was a change in employment specialist. While handover was generally smooth, a small number reported sustained interruptions in their support with an unexplained loss of contact – either temporary or permanent. In cases where the handover was clearly explained and well managed, they did not feel their support was disrupted.
1.3.2. Types of support provided
Following on from initial appointments, provider staff completed a vocational profile with the treatment group. This involved capturing information to identify individual strengths and previous experience, so they could create an action plan of support.
Specialists offered employment support such as: supporting CV development, discussing career goals and identifying skills, help to search and apply for jobs, advice about interview techniques, and advice about declaring health conditions and/or disabilities at work and accessing reasonable adjustments. Health and wellbeing support included: ongoing advice and support about work and health issues, challenging the treatment group about what was possible with their condition, and support to negotiate a better relationship with their GP. This could include encouragement from employment specialists for individuals to ask their GP for help with changing medication, or more generally to ask their GP questions so they could get the help they needed.
SCR treatment group said:
I’m aware of different opportunities and I’m more aware of what employers are looking for. I think when I first met [employment specialist] I had a very fixed opinion of what employers were looking for… I think I was a little bit behind the times. I was locked in a time when people didn’t talk about health regarding work, you just kind of soldiered on regardless, you know
People in the treatment group also reported tailored support such as helping with homelessness, anger management techniques, accessing funding for interview clothes, and support using social media to promote self-employment.
From a research perspective, it was often difficult to isolate differences in support for physical and mental health conditions because many people with physical conditions also reported having depression, stress or anxiety. However, while mentoring and confidence building was important for everyone, those with physical conditions sometimes had more specific needs. For example, someone who had epilepsy needed help getting their driving licence back, while someone with a musculoskeletal condition needed physical adjustments at work such as a seated rather than standing role.
It is also important to note that some receiving IPS support found it difficult to recall and/or discuss the kinds of support they were receiving due to their own health conditions or disabilities that affected memory, concentration or communication. It is therefore challenging to build a full understanding of the experience of all those interviewed. This was also the case with one who spoke English as an additional language. Staff identified that they sometimes found it difficult to support members of the treatment group with language needs; however, other communication challenges were not raised. A staff member reported that the contract allowed them to commission interpreters for the initial meeting but not for the support experience and that some people had been recruited when their language needs meant delivering support was not possible. This suggests those leading the recruitment process had not been effective in assessing ability to engage in support in all cases.
More broadly, staff consistently reported following IPS principles and rapidly progressing the treatment group towards work. This was reflected in the interviews, where many members of the treatment group described action planning focused on their individual circumstances and a rapid move to targeted job search.
SCR staff member said:
From the first appointment we’d get their CV… all updated, all online if possible and then the next session after that we’ll just start applying for jobs, so it’s pretty much go from the beginning.
Where people were not moved towards job searching quickly, it was primarily due to having high needs and not yet being ready for employment. In line with this, a significant minority of the treatment group described themselves as not being ready to work, either from their perspective or from that of other professionals in their life, including their doctors. One identified that the support provided did not cater for her complex needs, again suggesting that some people were accepted onto the trial whose needs were not well aligned with the eligibility criteria (which focused on mild to moderate conditions).
SCR treatment group said:
I wasn’t sure what kind of support she was offering because I know that my support needs at work… it is not just that I need a different kind of chair to sit on, you know, or I can’t climb stairs. It is emotionally and physically… there are all sorts of things that employers in the past have refused, they just won’t budge, you can either do the job or you can’t.
Much of the employment support reported by staff and the treatment group was based around basic job search and application activities. This clearly met the needs of many; however, this was quite different to the aims of IPS in respect of sourcing ‘hidden’ jobs. Some staff saw their role as developing these basic job search skills as support for the long term, rather than carrying out job search activity on their behalf. They felt this would better equip the treatment group to find work after finishing the time-limited IPS support.
SCR staff member said:
I had a guy who had not worked for 16 years and he’d not got a CV. In the first three meetings it was literally talking about how to go and apply for a job and doing a CV and taking it step by step …. He’s now learned that technique. What we’re trying to do is empowering people. We’re giving them the skills even if they don’t get a job in the nine months, they’re with us they’ve got the skills to go forward and that will help them in the future.
However, there was some evidence that recruits in the treatment group with more established work histories felt that this basic level of employment support was limited and did not meet their needs.
SCR treatment group said:
I was getting no practical support. I was just being told, “You’re doing everything you can, you’re doing all the right stuff, I’m just not quite sure what’s happening. Just keep on doing what you’re doing, you’ll get something in the end.
People in the treatment group generally felt that they were being advised to get the right kind of job for them and placed a high value on this, often contrasting this to the approach of Jobcentre Plus staff. However, staff identified that supporting them to get the right job for them could be challenging when there was a mismatch between career ambitions or experience and a health condition or disability. Part of the support provided was to navigate this.
SCR treatment group said:
I felt a connection there in terms of somebody trying to help to not just get me a job but get me a job that I felt comfortable with.
SCR staff member said:
The individuals themselves don’t realise that perhaps although they are already in a job, that job isn’t going to be suitable for them in the future and they might need to readjust their career paths as well so sometimes that can be quite difficult for them to deal with because they have been continually in work and then all of a sudden they have a health condition that means they can’t go back into that type of work and that is all they have ever known.
There was a perception amongst some staff that the trial was better suited to support people who were not working as opposed to those in work, although this is not borne out in the wider evaluation data. These staff identified that some expectations for IPS such as rapid job search were not necessarily well aligned to the needs of people in the SCR IW group who were already working on joining the trial. This view was shared by some in the SCR IW treatment group who felt that the initial stages of the trial was not tailored to their needs. Again, this latter point was not supported in the surveys where the SCR IW group demonstrated some of the highest levels of satisfaction.
SCR staff member said:
I feel like maybe IPS is more aligned to out-of-work support than in-work support, perhaps. But it still is IPS in the fact that we engage with their employer and we try and become a middleman almost between the employer and the customer.
Mentoring or coaching was identified as the most significant element of support by many in the treatment group and staff. This applied to helping them achieve employment, health and wellbeing outcomes. Staff also saw this as a core component in a strength building approach to help them identify their strengths and develop their confidence.
SCR staff member said:
I think it is for the person to recognise their own strengths. Because no matter how good a CV is, or how good a covering letter is, or what job you apply for if you don’t feel your self-worth and you attend that interview and you can’t project that and you have never heard anybody tell you how well you are already doing, and the skills you need to be sharing with people you won’t pass that hurdle.
Some in the treatment group were able to articulate this approach as strength building, mentoring, or career counselling, while others focused on the value of having someone to talk to. Some felt this was likely to extend beyond the aims of the service, though using it in this way was helpful as other employment providers (such as Jobcentre Plus and other providers of employment services) were less responsive to their needs. This support to build confidence was often highly effective with those who reported low level mental health issues.
SCR treatment group said:
I’ve been using Working Win for more than really I should be using it for because I’m using it from a kind of counselling perspective but they’re not really counsellors. That’s because I get more response out of them than I do other providers.
However, others with higher needs felt that while this friendly approach was supportive, it did not help them with the systemic barriers they faced. Some who were dissatisfied felt that the support they received was too focused on mentoring and conversation rather than action such as referrals to health support services.
Health support often seemed secondary to employment support apart from the mentoring. Some in the treatment group, particularly those with physical conditions, believed the trial was concerned with their health only where it directly impacted on work. This was sometimes because they did not feel they needed health support rather than because it was not available.
SCR recruit said:
It’s mainly to do with work because that’s been the issue that I’ve had. The day to day management of the health is really more the doctor’s part, rather than her advice.
Support for those in the treatment group who were working often appeared more focused on health as they needed support managing their condition at work, while those who were out-of-work were focused on job search. Some staff also felt that it was easier to achieve positive outcomes for those who were working as they already had a connection to an employer and only needed limited intervention.
SCR staff member said:
In terms of keeping people in work to get the outcome of three months and job return can be easier as well because it can be that they just need a conversation to get things off their chest, you can do a wellness action plan and they can return to work within two weeks.
For SCR IW and OOW trial groups, some described receiving very useful support on managing their condition. However, others found the focus to be solely on employment and felt that they would have welcomed more discussion and support with their health. In addition, some staff were less confident in discussing and understanding health and disability as they felt they lacked knowledge on this and would have welcomed further training. This was particularly true for staff who had a background in employment support, rather than a focus on health and wellbeing. Some in the treatment group could, however, be referred to a health and wellbeing specialist within the service for additional support.
1.3.3. The advisory relationship
The positive relationships between staff and the treatment group were key to successful support, with many in the treatment group seeing this relationship as the most valuable part of the support they received. Relationships were seen as positive where people felt understood and supported. It was also seen as important that their specialist had a flexible, tailored approach that was responsive to their needs.
SCR treatment group said:
It’s mentoring and support from somebody who had an understanding of what it was actually really like to have health issues, physical or mental, and from a person who’s actually sympathetic to those issues as well.
SCR treatment group said:
She also has a very individualised approach as well because she often sends things that she says to me, “I saw this and thought of you”.
Some in the treatment group felt that it was important that their specialist had a good understanding of their specific health condition. This could be because they came from a health background or because they had personal experience of an issue.
SCR treatment group said:
Also, my Working Win advisor was previously a nurse so she could comment a little bit on the medical issues that I was having and maybe some advice into that as well, because I was still receiving treatment for the cellulitis and lymphoedema.
Staff felt confident that they were able to maintain positive relationships with those receiving IPS support. They said that they needed to understand their situations and respond to them on an individual basis to foster this positivity. The vocational profiling and the strengths-based approach they adopted was seen as an important part of this.
SCR staff member said:
There are challenges, you know, in keeping people engaged and motivated and keeping that hope alive but, you know, that is why some of the training that is offered to staff in terms of motivational interviewing, self-based approaches and sharing stories with customers about other customers’ outcomes.
One staff member identified that personality was also important, identifying some cases where in the treatment group were moved to a new specialist if they ‘didn’t click’. Beyond this staff did not discuss where relationships broke down; if someone stopped engaging in the trial it was generally attributed to their own circumstances such as worsening health. This was reflected in some of the treatment group interviews where an event such as an accident or a behaviour such as anger issues could be seen to impact on their relationship with their employment specialist.
Nearly all members of the treatment group taking part in interviews were very positive about their relationship with their employment specialist even where they may have been more critical of other parts of the support. In the very few cases where issues were identified, some believed their employment specialist was not proactive enough or did not have the relevant experience to understand their situation. In other cases, issues were due to a range of individual factors, for example one who had unspecified support needs reported a lack of understanding on both sides.
Consistency of support was important for many. Those in the treatment group who stayed with the same specialist saw this as an important part of their experience. When they were moved to a new specialist, the treatment group sometimes expressed anxiety and frustration at having to build a trusting relationship again. However, most who were moved to a new employment specialist managed to foster a good relationship, with some feeling that the second relationship was better. Some staff also commented that a lack of information in the handover process meant it could be more challenging to build relationships with those they took on mid-trial.
SCR treatment group said:
You know, you get to know each other, and you get this trust between each other as well, that’s very important, you know, being able to trust and understand each other.
1.3.4. Delivery partners
Staff worked with a range of national and local partners across SCR. Case conferencing was not evident to any real extent in the qualitative research. This was acknowledged by staff as perhaps the most significant variation from IPS and its fidelity scale. This was partly due to issues with co-locating due to a lack of physical space and infrastructure as well as the time it took to establish effective partnerships. Where staff described successful interactions with clinicians, co-location was seen as an essential tool in building relationships. Not all staff put the same emphasis on partnership working, and there were some indications that some preferred referring to in-house resources which included specialists such as wellbeing coaches and established, longstanding partners such as Citizens Advice Bureau (CAB).
Two of the most significant partnerships were intended to be with GPs and IAPT providers. While some in the treatment group described how the service helped them improve their relationship with their GP, this did not involve direct intervention or case conferencing in the qualitative sample. The relationship with IAPT providers was one of the most significant partnerships, with referrals in both directions. The only issue raised other than the challenge of co-location was that the those in the treatment group tended only to receive short-term IAPT support. This meant it was difficult for staff to fully engage with therapists in the way expected by IPS.
Staff also co-located in local community organisations such as employment support or health charities. The challenge of finding space within these organisations to hold these meetings was again identified, as well as the additional challenge of the trial as being seen as competition. One staff member described investing considerable time in building friendly relationships.
SCR staff member said:
So, I kind of worked with that and made sure that they were informed, and I made sure I referred into their services…I attended the services. I went to the running groups. I went to the cooking groups, the exercise classes. Like I was kind of just making myself part of the team.
Co-location in workplaces was seen as positive where it was in place and in one case contributed to a change in workplace culture. Through support gained through Working Win a person in the treatment group reported how their employer had embedded a strategy focused on health and wellbeing and ensured Wellness Action Plans were in place.
SCR treatment group said:
I mean the other positive thing is the wellness action plan has triggered changes at work which should have happened months and months ago but now they’ve put out a document saying that employee wellbeing is priority for this year…all that’s happened as a result of that action plan and me being ill. So it’s all good. It’s all gone in the right direction.
However, few of the treatment group reported meeting in their workplace. For some, this carried a risk of disclosure and concerns about confidentiality.
Being based in the community was welcomed by those in the treatment group, with many appreciating the convenience and the opportunity to leave the house. These meetings most commonly took place in cafes and libraries, rather than in community organisations themselves. However, where some expressed concerns with the location of meetings, they cited a lack of privacy to discuss what they felt were sensitive issues.
Beyond co-location, provider staff referred the treatment group to a range of different services and most regularly to CAB for support with debt or benefit claims. Other referrals varied significantly by individual with some referred to a wide range of services. These included referrals to counselling and therapy services, leisure centres, gardening or writing groups, and self-employment business support.
Most of the treatment group taking part in interviews who had been referred to external services were positive about the value this added, saying that these referrals had helped them address difficult issues in their lives such as how to manage their finances. For one member of the treatment group the referrals made by her specialist were a catalyst for significant changes to her wellbeing.
SCR treatment group said:
Because I literally couldn’t get anyone to help me [before the referral], I was just constantly beating my head against a brick wall.
A high number of the treatment group in qualitative interviews were receiving therapy or counselling, although this often pre-dated their time on the trial. For some, therapy was the most significant support they received, while for others their employment specialist was more important and the IPS employment support was seen as a better fit to their needs. Where they were unhappy with their referral to external services, it was generally because a referral had been made that was not followed up, or that was not suitable. The qualitative data suggested that these were often those in the treatment group with the highest level of need.
SCR treatment group said:
She’s offered me loads of things but nothing ever come about so she offered me a chiropractor appointment, she offered me a gym like a 12 week gym membership but at the time I did go and I spoke to the guy at the gym, but I was so ill or felt so ill that I no longer do a 20 minute walk and he basically said I can’t do ought for you basically because you can’t do anything without hurting so I said well no it doesn’t make a lot of sense to me really I don’t really know why so I kind of postponed that and I’ve tried to contact him since and nobody rings me back about that either.
1.3.5. Employer engagement and job brokerage
Employer engagement and job brokerage is another core aspect of the IPS service. There was a recognition from staff at all levels that this was not delivered frequently enough and they were not always able to follow IPS principles. In recognition of the challenges of employer engagement, a specialist member of staff was appointed to focus on this role. However, staff and managers felt that employer engagement became more of a focus once the recruitment and referral stage of the trial had finished giving them more time to dedicate to this aspect of delivery. Because of these factors, measures such as a central jobs website and other employment engagement activities were only introduced from October 2019.
Staff identified several barriers to employer engagement with many believing the IPS weekly target of six face-to-face interactions was too challenging, Firstly, staff felt that the fidelity model did not necessarily reflect working culture in England and that many employers were too busy to engage.
SCR staff member said:
[The treatment group] wanted to approach employers themselves or apply to jobs themselves and I think with the model being an American model, I think in America are probably more set to that sort of thing, and they are a bit more on the ball with it. I think, I hate to say this, but British employers can be a bit more dismissive of helping people and you are dealing with people, an individual manager’s perception of somebody’s health condition.
Some staff, typically those from a health background, found employer engagement difficult. Staff who had previously worked in employment support were more confident in engaging with employers and described a wider range of networking strategies. However, the most significant barrier to employer engagement was a lack of time; when caseloads were high, staff were not able to prioritise this part of their role. Nonetheless, some in the treatment group provided examples of employer engagement leading to them finding work; - an approach which was highly valued where it had been successful.
SCR treatment group said:
He said I’ll get cracking with getting in contact with some companies. It just happened the way it happened. The first company he rang to ask what qualifications I needed and what experience they were looking for, they said they wanted to see my CV. He sent it through and that’s who I got the job with.
However, others felt that their specialist did not support them enough through employer engagement, instead sourcing jobs from internet searches only. They were disappointed when they did not receive direct referrals to work that suited their needs.
Evidence of job brokerage beyond the recruitment stage was limited for those in the OOW treatment group. A significant barrier was that many either did not want to disclose their conditions to potential or current employers or did not want their specialist to directly intervene. However, they generally reported that they were supported to raise issues themselves and advised on discussing their rights.
SCR treatment group said:
We’ve talked about the Equalities Act… She explained my rights. She advised me to… because she’s always empowered me to do it myself and I am a person to do things myself, like to contact ACAS and get my rights, contact work. She would go with me and if I wanted her at any point, she would attend meetings, she would do the meetings without me there.
While evidence of job brokerage was limited, there were a small number of good examples, including an example of a treatment group member being recruited to work for the trial. The trial provider was supportive in adjusting hours to better suit the individual and provided additional training to support the individual in aspects of the role they were less confident with. Additionally, colleagues were so supportive that the individual concerned reported that they ‘feel like I have six work coaches’.
The most prominent way in which staff helped treatment group members to have reasonable adjustments at work was through supporting them through disclosure. In cases where staff did intervene directly either through providing in-work support or when they moved into new jobs, they were often successful in asking for reasonable adjustments.
SCR staff member said:
I’m spending more time at their workplace doing assessments at work, speaking to their managers, talking about phased returns and how they may work, making sure occupational therapy visits are met and any other support that needs to be in place is in place, so that the employer doesn’t get any surprises basically about what I’m doing, and the process that we’re doing helps save their staff, and that’s been a real eye opener for me and one that I’ve truly enjoyed.
There were a small number of instances where the treatment group described their specialist as being unable to advocate effectively for them in the workplace. One attributed this to a lack of experience, although also said their company’s HR was able to take over this role.
In addition, contextual factors or issues outside of staff’s control prevented successful job brokerage or reasonable adjustments. For example, some in the treatment group would need funding to remain in their jobs or to take up a new role, which is not always available. One example involved an individual requiring funding for private transport to work, but being unsuccessful with an access to work application. Other examples include lack of funding available for training courses, and changing rules to apprenticeship funding meaning they were unable to secure the skills needed for certain jobs.
1.4. Outcomes
This section explores intermediate and job outcomes achieved by the treatment group between May 2018 and April 2020, using both qualitative data and management information.
1.4.1. Mechanisms leading to outcomes
Staff and members of the treatment group were asked to comment on key elements of support that help people progress on the trial and into employment. It was generally felt that there is not one established route to an outcome(s). Rather, a combination of factors interact together in different ways for different people. Qualitative analysis shed light on factors that are common mechanisms to outcomes.
Positive relationships between provider staff and the treatment group were considered key to achieving both intermediate and major outcomes. This finding was established through interviews with staff and individuals in the treatment group, with the latter in particular highlighting that relationships with staff have been central to their development and to achieving intermediate and employment outcomes.
Staff identified increased confidence as a vital intermediate outcome. Staff reported that those in the treatment group who increased their confidence and belief in their abilities were more likely to achieve both health and employment outcomes. In addition, staff believed that this increased confidence and self-belief led to more sustained outcomes being achieved. The process of identifying both long- and short-term goals was reported as a key element of support. Using action plans also helped in measuring and demonstrating progress throughout the trial – points confirmed by individuals. Some in the treatment group also explained that the voluntary nature of the trial facilitated their engagement with it, helping them to trust that the support they were receiving was beneficial. This in turn empowered them to decide what is right for them, and to engage more fully with the service.
SCR treatment group said:
He gave me the confidence to take it on at the time, so something came up at about the same time, an opportunity out of the blue, and he just encouraged me and said, “You are capable of doing that,” so I did it.
SCR treatment group said:
The most useful parts are the action tracker that we used…. really keeps me on the path where we know we’re going to have an outcome and within that action tracker we had things like CV and LinkedIn profiles and agencies and registering with agencies and stuff like this. So it’s all on the V and the wellness action plan was on the action tracker. Everything is on the action tracker, so you could see that you’d made progress.
Staff also emphasised that identifying and increasing awareness of transferable skills is key for the treatment group to increase their confidence in themselves, and in their ability to add value to a workplace.
SCR staff member said:
With the way that we work, with us doing that strengths-based approach, we’re saying look, there’s no reason why you can’t do it, we’re not telling you you can’t. It’s what you’ve been told previously, and we’re tearing that rule book up. And we work in a different way. I think that’s really key.
1.4.2. Outcomes achieved
In addition to primary outcomes such as entering or returning to employment, people in the treatment group experienced a range of intermediate outcomes through their support on the trial. They felt these intermediate outcomes were necessary steps towards achieve their longer-term health and career goals. These included increased confidence and sense of direction, improved self-efficacy in job search, improved understanding of skills and career goals, increased views that work is feasible, and improvements in health and wellbeing. They often described their progress as spanning the full range of these outcomes.
In interviews, the majority of those in the treatment group talked about improvements to their self-confidence and self-esteem through participating in the trial. They felt more able to set goals and could more easily see the steps needed to be taken to reach these goals. Many felt that increased self-esteem and confidence occurred as a result of the trusted relationship with and support from their specialist. Through this support, they felt more able to take steps such as applying for jobs and attending interviews. Provider staff emphasised the importance of using their role to instil confidence and self-belief in those they supported. This was key to helping individuals to trust the support and their employment specialist, and to progress towards employment.
SCR treatment group said:
I think also that the fact that with [staff member] with Working Win has helped me develop the mental fortitude to take rejection on the chin and know that there is other stuff out there.
SCR staff member said:
The intermediate results are more in like a change in the person and their confidence and the way that they view their abilities. That’s sort of the most… I think that’s the most important change that needs to happen before they can actually go on and get a job. So that might not just be confidence in themselves that might be confidence in a specific skill that they require to do the job that they’re really interested in.
Some in the treatment group reported having extremely low confidence prior to accessing the trial due to difficult life circumstances, and that the trial had a significant impact - it had increased their confidence by giving them a sense of purpose and clear goals, and provided structure and support, where previously there had been none.
SCR treatment group said:
Working Win helped me. They helped me realise that you are allowed to work with mental health and you shouldn’t let anyone make you think you can’t work.
Some who had entered work or were successfully returning to work reported that this had in turn further increased their confidence and belief in their ability to work. The qualitative accounts of treatment group recruits who were not working indicated they had significantly improved their job search techniques, and gained better knowledge of how and where to source opportunities. They also described how they were better able to prepare and adapt CVs and application forms, with the trial having supported them in being able to describe their skills and experience. Consequently, they felt more confident in their ability to submit successful job applications.
Staff reported that intermediate outcomes of increased efficacy in job searching, and increased motivation occurred very early on in the support experience. This also increased individuals’ confidence in their ability to gain employment.
SCR staff member said:
From the first appointment we’d get their CV kind of, you know, all updated, all online if possible and then the next session after that we’ll just start applying for jobs, so it’s pretty much go from the beginning.
Those in the treatment group reported an improved understanding of their skills and assets, as well as increased clarity in their career goals and the steps needed to achieve these. They explained how staff worked with them to understand the relationship between skills gained in previous employment or wider life experience, and how these transfer to alternative job roles and sectors. Some realised they had skills and qualities they were previously unaware of. Staff emphasised that an important outcome was this increased awareness of transferable skills and abilities, identifying the roles that would be suitable to their needs, and how they could add value in the workplace.
SCR treatment group said:
I think maybe the discussion around me and my skills and kind of realising what I do have to offer because of the circumstances that I was in you don’t really think about how good you are so that was useful and just being very positive about you know it’s ok to change its alright to do things that you want to instead of what you should do and that kind of thing.
Some in the treatment group reported improvements in their health and wellbeing. This included improved mental health and improvements in health conditions and physical health.
SCR treatment group said:
It’s made me happier and made me think about what’s going off, instead of just being stuck doing nothing, so the support has been there and it’s been nice.
A large number reported that engaging with the trial, including regular appointments, and a positive one-to-one relationship with the employment specialist, increased their motivation which in itself improved their health and wellbeing.
SCR treatment group said:
I think the every two weeks and just having that check up of what have you been up to? How’s work? How is this? How is that? Has been massively… has been my saving grace, really
People in the treatment group reported how the trial had helped them to seek help and engage with health services to address their mental or physical health needs. Some explained how this was a significant change for them in that they normally do not engage with services or would lack confidence to open up to health professionals about their conditions or needs.
Gaining or retaining employment itself had positive impacts for many. For example, moving into or returning to work had further increased confidence and wellbeing. In addition, an improved financial situation dramatically improved health for some in the treatment group, especially through removing the stress associated with money worries.
1.4.3. Control group outcomes were limited
The extent of outcomes reported in interviews with treatment group was not echoed by recruits randomised into the control group. The majority spoken to, had not followed up with any of the services provided on the control group leaflet at the initial appointment. This was often because they felt unable to, or because they were already aware of these services. This meant they had not received any support, beyond any existing services such as JCP that they were already in touch with.
Many of the control group members flagged up that they had no recollection of receiving any further information upon randomisation.
Where interviewees in the control group had followed up with alternative services, there were mixed responses. Some found the other services were not useful, and did not maintain this relationship. Some others were able to access health and wellbeing support, or some employment support, but very few reported receiving both types of support. This led to some examples of improvements to health and wellbeing, and so feeling more ready to work, but not feeling equipped with the skills to find a job. There were a small number of examples of job outcomes being achieved amongst the control group interviewees. It was often not clear how these jobs had been found or what had contributed to readiness to enter the job search process. There were slightly more examples of job returns for the SCR IW control group where it could be established it was achieved through support from HR and occupational health departments in the companies they were working for.
2. Process evaluation findings: The trial in the West Midlands Combined Authority
This chapter presents process evaluation of the Health-led Employment Trials in West Midlands Combined Authority (WMCA). It documents trial recruitment and delivery of support. It covers outcomes, and the causal mechanisms we are able to detect for these.
2.1. Introduction
The research reported below is based on the mix of interviews shown in Table 2-1. The analysis focuses on capturing information on implementation in order that lessons for delivery can be learned. The final report, due in late 2021, will present the findings of the process evaluation through a full Context, Mechanism, Outcome (CMO) analysis of the data, interrogating the theories of change in greater detail.
Table 2-1: Interviewees in WMCA
| Fieldwork period | Respondent type | WMCA interviews |
|---|---|---|
| September to Nov 2018 | Recruits: treatment group | 23 |
| September to Nov 2018 | Staff | 15 |
| September to Nov 2018 | Stakeholders and partners | 4 |
| April to June 2019 | Recruits: treatment group | 11 |
| April to June 2019 | Recruits: Control group | 9 |
| April to June 2019 | Treatment group: Longitudinal panel 1 | 10 |
| April to June 2019 | Treatment group: Longitudinal panel 2 | 12 |
| April to June 2019 | Staff | 10 |
| January to March 2020 | Recruits: treatment group | 14 |
| January to March 2020 | Recruits: control group | 9 |
| January to March 2020 | Treatment group: longitudinal | 10 |
| January to March 2020 | Staff | 11 |
2.1.1. Local context in the site
In WMCA trial design was outsourced to Social Finance, a not-for-profit organisation. Three main providers allocated to three ‘lots’ across the region were commissioned. Remploy delivered support in Birmingham South Central and Wolverhampton CCG areas; Dudley and Walsall Mental Health Partnership Trust delivered in the Dudley CCG area; and Prospects, along with a supply chain, delivered across the Sandwell and West Birmingham CCG area. The central team at WMCA worked closely with providers throughout the trial. All recruits in WMCA were unemployed.
2.2. Accessing the trial
Awareness raising took place on commencement of the trial with provider staff working to engage potential recruits, healthcare organisations, and other partners that could make referrals. These activities continued throughout the trial, and intensified towards the end of the referral period. This section details the approaches taken in WMCA to raising awareness and developing referral partnerships with primary and community healthcare providers, and wider community organisations.
2.2.1. Awareness raising
The main referral routes planned for the trial were primary care (for example, through GPs), community care (such as Increasing Access to Psychological Therapies (IAPT) services), and self-referral. In WMCA, the trial was branded Thrive into Work. All promotional materials and messaging were approved by the Health Research Authority (HRA) to ensure they were clear, balanced, and ethical in approach. Management information shows that in WMCA 16% of recruits were referred by their GP, with a further four% referred by a specialist care service. The remaining 80% were from an ‘other’ referral source, including pharmacists, community organisations, Jobcentre Plus and self-referrals. Recruits interviewed for the process evaluation had been referred by a range of these sources.
Figure 2-1: Referral sources in WMCA
| Referral source | % |
|---|---|
| Local GP | 16 |
| Specialist care service | 4 |
| Other or self referral | 80 |
Source: Service provider MI
Figure 2-2: Referral sources by WMCA provider
| Referral source | Dudley and Walsall % | Prospects % | Remploy (all) % | Remploy (BSC) % | Remploy (Wolves) |
|---|---|---|---|---|---|
| Local GP | 28 | 14 | 9 | 11 | 6 |
| Specialist care service | 6 | 4 | 2 | 2 | 4 |
| Other or self referral | 66 | 82 | 89 | 87 | 90 |
Source: Service provider MI
GPs and healthcare providers
As noted, the trial design identified GPs and other healthcare services as the main source of referrals. The goal of raising awareness with these was to garner referrals and initiate ongoing relationships with healthcare staff. It was anticipated that healthcare providers would refer patients to the trial, and continue to work with staff to provide joined up care for those randomised into the treatment group.
In practice, GPs and specialist care services made 20% of the WMCA referrals. Staff from all WMCA providers agreed that it had been more challenging and time consuming to engage GPs to generate referrals than anticipated. However, many healthcare providers displayed posters and other materials to encourage self-referrals, so the full extent of healthcare referrals is unknown. Some staff believed that the delays to the trial launch meant that groundwork to engage GPs had lost momentum by the time the trial opened for referrals. Other staff reported that there had been insufficient activity with healthcare providers and GPs to build their awareness and engagement at the early stage, and believed more intensive relationship building and contact was needed in order to gain the number of anticipated referrals from GPs.
WMCA provider staff member said:
There was a lot of engagement with the doctors and the practices around the October [2017] time and I think the lack of going live for the remaining six months or so, it’s probably dissipated their interest in it.
A briefing sheet targeted at health professionals was created, outlining the trial including the RCT, the role of IPS, patient eligibility details, and the referrals process. It also set out why the NHS was involved in the trial and evidenced the link between health and employment outcomes. This was supplemented by a regular newsletter shared with healthcare providers by the central WMCA team. The newsletters provided trial updates and case-studies of those receiving IPS support, alongside encouraging engagement and referrals, using a leader board of GP practices by number of referrals. The newsletters also reminded providers of the referrals process and highlighted the financial incentive available to GPs for referrals.
Engagement amongst healthcare providers was varied
Staff within the three main WMCA providers reported different experiences engaging with healthcare partners, and referenced the effect of their organisational context in relation to this. One provider was part of the NHS, which staff believed had helped to break down barriers to engagement with healthcare organisations. In contrast, staff in providers specialising in employment services spoke of difficulties with becoming familiar with NHS systems and processes, and differences in language used.
The perceived differences in ease of access to healthcare settings and the related number of referrals is borne out in the management information (see Figure 3-2). In Dudley and Walsall (where the NHS provider operated) 28% of referrals were from GPs, and a further 6% were from specialist healthcare organisations, compared to 16% from GPs and 4% from specialist healthcare organisations across the whole region. However, it is also likely that some referrals from the healthcare sector were masked as self-referrals. To encourage empowerment and ownership over their health, some partners encouraged potential recruits to refer themselves rather than make direct referrals.
Improved engagement strategy for health partners
Provider staff communicated their concerns about the lack of engagement with GPs to the central WMCA team. In May 2019, one year into delivery, the central team developed and implemented a targeted GP engagement strategy. In this, GPs were set a target number of referrals, based on their patient population and the number of potential recruits within this. To encourage engagement, GPs were paid for their time and/or room hire, as well as for referrals made via the Clinical Research Network (CRN). The team also offered training to GP staff, and aimed to create closer working relationships across the four CCG areas and to encourage greater co-location. Some GP practices sent invitation letters to eligible patients providing basic information about the trial and details about how to sign up. Provider staff generally felt that the GP engagement strategy had made a difference. The proportion of referrals from the healthcare sector increased although remained below expectations.
The challenges gaining referrals from GPs were also experienced in SCR and were also reflected in the qualitative interviews with recruits, where few noted that they had been referred via a GP. There were instances where recruits had heard about the trial from another source and then sought reassurance from their GP that participation was suitable given their health condition. Unfortunately, many found their GP lacked awareness, which could undermine the credibility of the trial. Staff said that a physical presence in GP surgeries to remind staff of the trial and improve communication was important. This included the use of pop-up stands in reception areas and co-locating, to hold appointments.
WMCA staff members said:
We are there [in GP surgeries] every single week. We are starting to see that reflected in the referrals generating starting to come through. So I think that’s worked well. Visibility, regular communication.
I had regular appointments in a GPs where I had a desk or a room in the surgery, and they could send people to see me after an appointment if they thought we could help… so even without time in a 10 minute GP appointment to actually do the referral, they were referred to me.
Referrals from other organisations
The challenges in engaging healthcare settings resulted in a greater reliance on non-healthcare organisations for referrals than planned. The providers that traditionally delivered employment services tended to have established working relationships with Jobcentre Plus, which were used to boost referral numbers. Staff reported that other key referral partners in WMCA included a local college and foodbanks. Unlike GPs, these organisations did not have referral integrated into their IT system, so tended to promote the trial and encourage potential individuals to self-refer via the website. The MI shows that in total, 80% of referrals were from ‘other sources’ which include referrals from non-health partners and self-referrals.
Provider staff reported that the range of support organisations referring to the trial led to a diverse group of potential recruits with needs that varied in complexity. Their engagement and particularly motivation to work also varied. For example, those referred by local foodbanks often experienced housing issues, including homelessness, alongside requiring health and employment support. Some people signposted by Jobcentre Plus only engaged because they believed that the trial was mandatory and would impact their benefits; this could result in potential recruits not attending initial appointments or a lack of motivation to rapidly look for work for those allocated to the IPS service.
As with healthcare settings, staff felt that the relationships with wider organisations to generate referrals needed to be established at the outset. This approach helped to ensure there was shared responsibility to promote the trial and create partnerships to support referrals. Staff had targets for the number or type of organisations to engage in WMCA. Although resource intensive, this approach was believed to have facilitated the promotion of Thrive into Work across the combined authority.
WMCA provider staff member said:
I think it’s been working really well…because we’ve all been involved in the promotion of it and we’ve all been allowed to run with it with making contacts with services. So going out and meeting services, looking at how we can work together. Looking at the promotion of our service via their services and then look at how we continue that partnership working.
Randomisation was a problem for some referrers
In common with staff in SCR, those in WMCA believed that the risk of being allocated to the control group was a reason why some potential partners were reluctant to make referrals. The primary concern emerging from interviews with referral partners was about the impact of control group allocation on individuals’ mental health. Some referral partners had concerns about people not being able to access the IPS support, and they worried that their service users could feel rejected or in a worse place as a result of being allocated to the control group. Some partners said that messaging to emphasise the benefits of involvement for residents, linked to local challenges, such as unemployment, would have made the trial more appealing to them as a potential referral partner. These felt that the engagement should have been more strategic, with tailored and nuanced messages.
WMCA partner said:
More process-driven, rather than a kind of random… people turning up saying, you know, “We’ve got this project, we’ve been to other places, some people have said ‘yes’, some people have said ‘no’, what do you think?“ …. I would have liked somebody to have come and say, “Look, you’ve got a very high unemployment rate compared to your area. This is the type of intervention that we think would benefit for you.
Self-referrals
Staff generally believed there was good local visibility of the Thrive into Work brand which helped generate self-referrals. The team distributed leaflets and posters to community organisations including libraries, while the website provided more information on the trial, eligibility criteria and how to sign-up, alongside what would happen if recruits were assigned to the treatment group. The staff perception of good local visibility was reflected in the qualitative research with recruits, who said that they had noticed Thrive into Work materials in many locations. One who self-referred, recalled that Thrive into Work posters were ‘everywhere’.
WMCA treatment group said:
Initially it was the poster in the health centre. I thought, “Well, that looks interesting,” and just forgot about it, but then the letter came from the GP. Then I thought, “Well, okay, I need to do something about this,” and then it’s when the Jobcentre said. So, it was the health centre, doctors, and then the Jobcentre.
The providers hosted Thrive into Work coffee mornings, so that provider staff could offer information about the trial in an informal setting to potential recruits. Some recruits attended these events and said they found them an effective way of learning more about the trial and what it would involve.
WMCA treatment group said:
They could explain more about how Thrive worked and what support you would get and how they would help you. It was actually meeting people at the coffee event … who could tell me more about how it worked and how you were supported. When they told me about it, I thought, right, well, that sounds really good, I’ll actually sign up while I was there.
Staff reported that the amount of information provided to potential recruits about the trial prior to referral was varied, meaning some attended initial appointments without sufficient understanding of the trial, or without understanding that accessing the IPS support was not guaranteed because of the RCT. Ensuring that people understood the trial and could agree to taking part took time. To help resolve this, part way through delivery the WMCA providers started to telephone referred individuals prior to initial appointments to explain the trial and check expectations.
2.2.2. Referral processes
Two referral processes were used for the trial in WMCA. Individuals and community organisations could make referrals for themselves or others by completing the referral form online or contacting providers by phone or email (where a member of staff completed the online form by proxy). Primary care services could also refer people directly using the EMIS system, the most widely used clinical system for primary care in the UK. This was designed to be as light-touch as possible to encourage referrals by time constrained health professionals, especially by GPs. Staff believed that this helped with generating referrals.
Staff who had completed referral forms on behalf of potential recruits stressed the importance of explaining the trial clearly. In particular, it was vital to make clear that it was a randomised controlled trial and therefore there was no guarantee of support. The staff and partners interviewed agreed that the referral process was straightforward. For example, one community care partner said that they phoned provider staff to make referrals over the phone. They preferred this to filling in paper-based referral forms as this was viewed as ‘laborious’.
2.2.3. Reasons recruits engaged
Recruits randomised into the treatment group reported that they welcomed the trial and were motivated to participate because they wanted support with finding work. Some mentioned that the key benefit was working with an employment specialist who understood their health condition and how it might affect their work. Others felt that the voluntary nature of the engagement and focus on finding sustainable work and work of interest would suit them better than the ‘work first’ approach taken by Jobcentre Plus.
The availability of in-work support during the trial was also given as a reason why some recruits had engaged with the trial. They were reassured that support would be available if they experienced issues once they had entered employment.
WMCA treatment group said:
The big part was also with this trial that even if you get a job, they don’t just cut contact with you, but they stay in touch afterwards. Because sometimes you get a job and two weeks later it doesn’t work out or something happens and then what?
2.2.4. Views and experiences of the initial meeting
Waiting times and location
Nearly all recruits interviewed were contacted promptly – often within a week - by WMCA staff to arrange an initial appointment soon after their referral, which meant they were generally positive about the experience.
WMCA treatment group said:
I mean this never happens. Usually you wait for weeks and weeks, if they ever call you. And so I got an appointment so fast, and then I went and I had the randomisation. And the girl who did it, she was so nice and she had smiling eyes and all that; it wasn’t weird or anything, even though there was a bazillion questions. And she was just really nice and made me feel at ease. And luckily, believe it or not, I got picked.
Recruits also appreciated the flexibility to pick an appointment time that was suitable for them. The location of initial appointments was determined by provider staff’s access to spaces, as well as individuals’ preferences. Where possible, meetings were held within services already used by recruits, as staff reported this helped make them feel at ease. These spaces also tended to have a quiet space in which to undertake the initial appointment.
Appointments were sometimes undertaken in the community, for example in the library or in cafes. Some interviewees were really pleased to be meeting their employment specialists in these informal settings, reporting that it set the trial apart from other employment support services. However, others reported that they could be uncomfortable about a lack of privacy.
Understanding Thrive into Work was an RCT
Staff made an initial telephone call to explain the trial to potential recruits ahead of the initial appointment. The aim of this was to ensure understanding of the offer before the initial appointment where they would be asked for their formal agreement to participate. With recruits coming from multiple referral sources, this telephone call also aimed to ensure that the information provided was uniform and consistent.
There were no apparent differences by referral source in the qualitative accounts of recruits’ understanding of the trial. The initial explanation conversation potentially helped that. Recruits to the treatment and control groups tended to demonstrate a reasonable awareness that Thrive into Work was an RCT and two groups were involved - one that would get support from an employment specialist and one that would not. However, there were exceptions and misunderstandings in interviewees’ accounts. For example, a recruit in the treatment group thought that there were two groups and that they had been allocated to one-to-one support, whereas those in the control group would receive support as part of group sessions.
Some control group recruits felt that they had answered the questions during the initial appointment in such a way that meant they were ineligible or did not qualify for support. They did not understand that the allocation to IPS support or to business-as-usual (BAU) was random. Control group recruits could be upset by the randomisation result because they needed support to find work and their hopes had been dashed by the random allocation. This suggests that some had not understood the implications of the RCT and that providers might have, in these cases, managed expectations better.
Baseline data collection and the randomisation process
The providers changed the staffing structure for the delivery of randomisation appointments during the recruitment phase. Initially each staff member was responsible for undertaking the baseline data collection and randomisation of recruits, before taking those allocated into the treatment group onto their caseload.
However, part way through the delivery period this changed to a centralised model, with randomisation appointments undertaken by one member of staff, and others managing caseloads formed of the treatment group.
This change was implemented in response to a high rate of non-attendance at initial appointments and associated unused staff time, alongside reservations among some staff about administering the baseline data collection and randomisation. It also relieved pressures on staff who found it difficult to tell people that they had been allocated to the control group. This change in practice was considered by staff to have improved delivery as it was more efficient. They also believed it led to higher quality delivery, because staff conducting the initial meeting were able to match those in the treatment group to employment specialists according to the need and the specialist’s skill set. It also enabled employment specialists to focus on their caseload. However, some providers reverted back to staff completing both the randomisation process and having a caseload in order to prioritise continuity of employment specialist for those in the treatment group.
Often people who were randomised to treatment found the initial appointment to be a positive experience. They were grateful to be able ask questions about the trial and address concerns they had. Recruits who were less positive about the initial appointment said it was because they found it robotic and generic. This often occurred as a result of mismatched expectations for the initial meeting. The nature of the RCT and randomisation process necessitated a focus on data collection in this meeting. However, recruits were not necessarily expecting this, instead believing this meeting would identify their support needs. As well as completing the necessary processes, baseline data collection and randomisation, building a relationship with recruits during the initial meeting was believed to be key to enabling those going on to receive support to feel comfortable, engage with the service and remain on the trial.
WMCA treatment group said:
I did have my reservations but after the first appointment that was pretty much cleared up… it seemed like a positive move for me, so I grabbed it!
Staff said that when recruits were randomised to the control group, they needed to re-emphasise that this was a facet of a trial. Staff emphasised to control-allocated recruits the importance of a control group in learning about whether or not something works, and that their involvement could ultimately improve knowledge about supporting people to attain health and employment outcomes in the long term.
WMCA staff member said:
We explain how crucial the control group is in terms of this study and a lot of clients have agreed… The majority of people tend to understand, although I’m not part of the service, I’m part of something that’s going to change for other people who are in similar circumstances like me, who are sort of going to be in a better position in about 24 months when the government decides that this is the model to use.
2.3. Delivery of support
This section explores the support provided to the treatment group in West Midlands Combined Authority. The views and experiences of staff and individuals are explored in relation to caseload management, the types of support offered, the relationship between staff and those receiving support, as well as employer engagement and job brokerage. It considers the support offered in relation to IPS principles and explores whether the experience of delivering and receiving support was different for people with mental and physical health conditions.
2.3.1. Caseload management
Employment specialists had target caseloads of 30 but reported a wide variation in actual caseload size depending on trial stage, recruitment stage and staffing structure. It was common for staff to report caseload sizes of around 15 to 20 at the start and end of the trial, and peaks above 30 and in some cases mid-40s in the middle stages. There were similarities and differences in how caseloads were allocated and managed across the providers in WMCA. In Dudley and Walsall Health Trust the main factors were current caseload size and maintaining the fidelity of delivering IPS LITE. In the Prospects supply chain, allocation depended on geography and whether those in the treatment group had long-term health conditions, as one provider specialised in this. At Remploy, caseloads were allocated based on geography and caseload size.
A small number of staff reported that managing a high caseload alongside their other responsibilities sometimes had a negative impact on their work-life balance. Some reported that it was challenging to incorporate administrative tasks into normal working hours. Sometimes they worked evenings or weekends on administration so their working hours could be dedicated to client meetings. This highlights the importance of the principle within IPS of limited caseloads, as this has an impact on how responsive employment specialists can be to their clients, and therefore the effectiveness of the support.
As in SCR, WMCA staff reported a high level of engagement from the treatment group[footnote 5]. Where people disengaged from the service, this was said to be as a result of returning to work or due to worsening health. Contact between staff and the treatment group was most often fortnightly, but sometimes less, particularly once people were working when it was sometimes maintained by phone, email or text message rather than face-to-face. Individuals were mostly positive about the level and frequency of contact with their employment specialist. They also reported regular contact between meetings by email, text or telephone.
The only significant issue reported by those in the treatment group in relation to case management was when there was a change in employment specialist. This handover was generally smooth, but some in the interviews noted sustained interruptions in their support with unexplained losses of contact. Where the handover was clearly explained and well managed, they remained satisfied with the service they were receiving.
2.3.2. Types of support provided
Following the initial appointments, staff completed a vocational profile with those in the treatment group. The vocational profile captured information about individuals to identify individual strengths and previous experience. This informed the development of an action plan, covering roles and organisations that could provide suitable employment and what activities could help individuals prepare for the work. The action plan was a live document, to be augmented and amended as part of support. It often took a few meetings to build rapport and for staff to elicit all necessary information. Some identified the focus on aspirations and finding the right job as unique and positive aspects of the support.
As noted above, support was delivered in a range of locations. This included libraries, coffee shops and primary and community care settings as well as homes and remotely. The vast majority of those in the treatment group received some of their support face-to-face at a location other than their work, home or clinical setting (89%) and also received support over the telephone (90%) . Giving people choice in where to meet was said to help with attendance because they could have a say in where meetings were held, and agree to meet in places that minimised their travel costs and time.
Employment support
WMCA staff reported that vocational profiles were helpful for understanding individual motivations to which they could then tailor employability support. This normally began with the development of CVs, before moving on to identifying suitable roles and working together on job applications. Other forms of employment support included offering help to search for and identify suitable roles, helping the treatment group to apply for jobs, contacting employers about potential vacancies, giving advice about interview techniques, completing Better-Off calculations, and giving advice on declaring health conditions and/or disabilities at work and accessing reasonable adjustments.
Those in the treatment group placed high value on this needs-led employment support as it provided structure and clarity to their job search. Staff reported that the tailored career-focused approach helped to uncover their aspirations and enabled discussion of what was realistic for their circumstances.
WMCA treatment group said:
It was a massive help in giving a lot of structure to how I was going about looking for a job. Just having someone to run goals and ideas past and just sort of state intent out loud to someone and have them check in how things are going… it was nice to be able to bring up any minor concerns I had about like, the phrasing for answering this question, “What do you think they are looking for there?” or, when they are asking for hours like how honest should I be or how pessimistic should I be answering it.
It was common for members of the treatment group who were interviewed to describe how their employment specialist had supported them with job searching and writing applications, and to say that the proactive and targeted approaches – such as getting references from previous employers, contacting prospective employers and identifying roles that aligned with their aspirations - were useful and made the job search process less overwhelming. Those with poor language, literacy and digital skills found support with CV writing and applications particularly helpful.
Whilst often the treatment group reported positive views of the employment support, some were less satisfied. These had positive relationships with WMCA staff, but felt the trial had not offered support above and beyond their normal job search activity. Someone taking part who was long-term unemployed suggested that he would have benefitted from more direct exposure to employers and experience of the workplace, such as work tasters or job sampling.
Health and wellbeing support
Health and wellbeing support provided in WMCA included providing ongoing advice and support about work and health issues; supporting the treatment group to be aspirational whilst managing expectations around suitable roles; supporting them to be more effective in their relationship with their GP such as explicitly asking GPs questions or telling GPs about their experience of medication; and providing referrals to local health support, such as counselling. In interviews, the treatment group commonly cited the role of their employment specialist in supporting them with their physical and mental health needs. Some recognised that staff were well placed to deliver support through their prior professional and personal experiences. They valued this – it helped to open up about their health needs and enabled them to identify how their needs impact on their daily life and ability to work, and the conditions that would make work realistic for them.
WMCA treatment group said:
I think he understood a lot from people he’s worked with and his own past experiences, so he straightaway put me at ease with being able to confide in him, different things that you wouldn’t necessarily confide in a normal sort of job coach… Because obviously if you’re talking about mental health it’s very personal, there’s a lot of taboo, like, judgements around that kind of thing and that just wasn’t there, so that was really good.
Some in the treatment group reported that provider staff would share resources with guidance on how to cope with mental health needs. Others recalled that being signposted by staff to wider opportunities had significantly improved their outlook and motivation which in turn had positive implications for their health and wellbeing. These reported that staff would regularly check in about wider health and wellbeing support services they were accessing, for example encouraging them to keep in touch with their GP about depression or anxiety. Others reported that staff helped them address practical barriers surrounding their mental health and access to work. For example, one who experienced anxiety about using public transport was signposted to a service which now pays for their taxi fare to and from work.
Some in the treatment group reported that while they had not directly engaged with health-related support on the trial, they were aware this was available. Likewise, some reported that they would feel comfortable asking for additional advice and guidance around their mental health if this was needed. Those with physical health conditions taking part in interviews did not see a need for health support from their employment specialists as a range of clinicians were already involved in their case. They therefore viewed the trial as primarily an employment support intervention.
In-work support
There were two main times when in-work support was particularly important for the treatment group: in the early days of employment; and at ‘crunch times’, directly resulting from the transition to employment. Provider staff described how continued and pro-active support during the transition to employment for some was just as important as pre-employment support.
Practical support in the initial stages of employment involved helping to source appropriate clothing for the job role, financial help with transport or help to bridge the gap between coming off benefits and receiving the first wage, and financial guidance given the change in circumstances on entering employment. Staff reported that without this, it would have been difficult for some people to sustain employment. Staff also provided ongoing social and emotional support for issues which could impact on individuals; ability to sustain employment, including continuing contact as a source of emotional support. Staff noted that entry to work could happen sooner than the treatment group expected due to the rapid job search IPS principle. Consequently, when they were offered a job, staff sometimes needed to build up people’s confidence and reassure them that accepting the position was the right thing.
Staff also provided support once people moved into work to progress to better employment. This was particularly useful for those in the treatment group where the priority was to secure immediate income before focusing on wider employment goals.
WMCA staff member said:
I’ve got a couple of people on my caseload who, they were in work but they wanted to continue to work towards their end goal. So they’ve got a goal but if they just say they want money at the minute, money is their motivation but they don’t want to forget about their end goal. We’ll find them something that they’re happy to do … and we’ll support them towards that end goal … I’ll continue to see them weekly.
In-work support most often included supporting changes to shift patterns, small tweaks to job descriptions, or adjusting working hours to fit around individuals’ medication needs or the inclusion of more frequent breaks. Provider staff sometimes worked with employers to encourage the use of buddies or mentors in the workplace.
Staff also supported the treatment group on disclosing health needs to employers, where they asked for this. This could focus on the decision process - whether, why, when and how to share information about their health - and with whom - when considering returning to work or, with permission, disclosing on individuals’ behalf. However, making a disclosure to employers was a sensitive issue which required choice and consent as they feared being stigmatised because of mental health conditions.
Often those in the treatment group said that they had stayed in touch with their employment specialist after they had entered work. This ranged from informal check-in telephone calls, practical support such as travel assistance, to more formal appointments. Some had been supported to enter a short, temporary contract and said they had continued to receive support after their contract ended to update their CV and resume job search activity.
Where members of the treatment group were not working at the time of interviews they were aware that their employment specialist could offer some in-work support later on. Some had clear ideas about what support they would find useful which included advocacy with employers about the occupational implications of health conditions. Some who were interviewed appeared unaware of the in-work support offer, but indicated that they would like to receive this from their employment specialist once they found work.
2.3.3. The advisory relationship
Individuals in the treatment group and staff agreed that the positive relationships were key to successful support. During interviews treatment group members highlighted the importance of their employment specialist’s approach and characteristics, such as friendliness, helpfulness and trustworthiness. They appreciated engaging with someone who listened to their concerns, understood their priorities, and valued them as a person. Some particularly appreciated when their employment specialist shared their own personal experiences of mental health needs during support.
WMCA treatment group said:
So, because he’s non-judgemental we’ve got to know each other quite well, and I would say I’ve got to the point where I can ask him his opinion on how I am if I can’t tell how I am myself, he knows me quite well.
The treatment group also valued being supported to be aspirational in their job search, and in interviews discussed how their employment specialist had helped them to build their self-belief in their ability to work, and to negotiate working conditions that suited their skills and needs. They valued staff being proactive in their approach and going out of their way to help them in their job search.
WMCA treatment group said:
He had also made me feel that I could talk to him regarding the situation that I was in. He made me feel that I could conquer anything, really. I can look for any job regarding the hours that I wanted and do any job. Which was fantastic, because some consultants…they don’t instil that sort of passion to work. it’s like ‘you have to do it and you have to get on with it’.
Some indicated they were dissatisfied with their relationship with WMCA staff. This stemmed from feeling that their health needs or need for work adjustments were not considered, or that suggested vacancies were unsuitable, such as where they didn’t meet the recruitment criteria. Other reasons for dissatisfaction included regularly rearranging appointments or suggesting locations that were inconvenient.
Continuity of employment specialist leading the support relationship was important in building trusting relationships and making progress on the trial. However, this was impacted by staff turnover and by the handover from initial appointment to being allocated to an employment specialist, and some in the treatment group had been supported by several employment specialists. Some found this inconsistency had a negative impact on their engagement with the trial. Where there was no handover, or the individual was unaware of a handover, this negatively impacted their experience of the trial. Those who had built a trusting relationship with their original employment specialist were disappointed to lose this relationship and some had lost motivation. In contrast, where this was carefully managed, new relationships could work well, particularly where individuals had not ‘gelled’ with their initial employment specialist.
2.3.4. Delivery partners
Provider staff in WMCA worked with range of local services to ensure that the treatment group could access tailored and specialist support to meet their individual needs. This included primary care organisations; organisations specialising in benefits advice, debt advice, and mental health provision; local authorities; and job centres. Significant partnerships were intended to be with GPs and IAPTs. Interviews with staff in the early stage of delivery highlighted various difficulties engaging with primary care providers, including GPs. Staff interviews in the later phase of delivery suggested progress, with staff beginning to see increased partnership working with GPs as a result of the GP engagement strategy (see section 4.2.1 – awareness raising). Staff working in the providers with an employment support background explained that working in partnership with primary care was initially difficult in the absence of the NHS brand. However, with the implementation of the GP engagement strategy, greater integration emerged. Staff working in the health-setting provider acknowledged that their association with the NHS had enabled them to effectively build a network of partners from the outset to facilitate referrals, co-locate, and signpost the treatment group to specialist support.
Maintaining relationships with referral partners was felt to be mutually beneficial for both the trial and referral organisations, whilst also enabling people to receive a holistic support offer. The trial design enabled staff to work in partnership with organisations involved in people’s wider lives, to provide holistic support to individuals. Staff working on the trial highlighted the importance of working in partnership with external organisations as they saw a growing number of people with more complex needs that required specialist support to address.
WMCA staff member said:
We’ve got people with substance misuse issues, severe debt problems, are homeless and severe mental health issues. So I think there’s quite a variety of barriers to work other than health.
WMCA staff highlighted a range of benefits and challenges around co-location. Examples were offered of how working in partnership with other support organisations to address needs in the treatment group had enabled progress amongst those with mental health needs. In one example, a staff member had attended an individual’s counselling session with them to discuss work and health with the counsellor. This was particularly effective where co-location enabled a degree of case conferencing.
WMCA staff member said:
Some of my clients are actually under IAPT … so obviously we keep things confidential but it’s good to be able to have a chat with their worker as well so that you’re consistent with their progress. So we had somebody who I was seeing weekly and so was his therapist, so we could monitor his progress week by week… there was a massive improvement with him and then he was eventually discharged from, like, from his therapist and he just continued to see me and now he’s actually in work.
Working in partnership allowed WMCA staff to achieve a more holistic view of an individual’s support needs, help individuals to navigate multiple services, and allocate resources effectively. This type of working was particularly beneficial for those with multiple needs and delivered the case conferencing model that is envisaged by IPS. Staff reported that co-location facilitated a community-based approach. One staff member reported that housing and debt support was a priority as many in the treatment group were experiencing poverty – regardless of whether household members were in work.
WMCA staff member said:
I’ve got somebody who there was about five workers involved with him so I called a meeting at the start so that we could get an action plan together so that we all know what’s happening and so nothing has a detrimental effect on this gentleman’s care.
Community-based meetings often took place in local venues such as in cafes or libraries. Many receiving support were very satisfied with the option to meet in a convenient and informal location, and some viewed these meetings as an opportunity to socialise and “get out of the house”. The treatment group were commonly given the option to choose where their meeting took place. In the best instances, they felt empowered to tell their employment specialist if they wanted to change venue or end the meeting.
2.3.5. Employer engagement and job brokerage
Employer engagement is a core aspect of delivering IPS support, opening up the potential to ‘tap in’ to job opportunities within ‘the hidden job market’. In WMCA, Social Finance delivered employer engagement training to the staff. Nonetheless and in common with the experience in SCR, staff identified several barriers to employer engagement with many reporting that it was difficult to build in sufficient time to interact with employers. Staff who had previously worked in employment support were more confident in engaging with employers and described a wider range of networking strategies. Others found employer engagement more difficult.
Some WMCA staff interviewed felt that the target of six face-to-face interactions with employers each week was difficult to manage among other commitments. Some reported having limited time for employer engagement compared to previous experiences of delivering IPS. They felt that having a smaller caseload would enable them to engage more with employers. Common concerns were that communication for many vacancies took place online and not in person; alongside this, employers were often said to lack interest in ‘work trials’ as a means to test the suitability of the treatment group for any posts.
Employer engagement activity varied extensively from light touch communication with employers - including making phone calls and attending Jobcentre Plus employer networking events - to more intense employer engagement such as job brokerage. There was a general consensus amongst staff that cold calling employers is an ineffective method of employer engagement. The approach to job brokerage, in particular, was strongly individually-led. Some in the treatment group had a very clear idea about an employer they would like to work for, whereas others had a good sense of the type of work they would like to do. Staff adjusted their approach to employer engagement or job brokerage depending on this, and the type of employer.
Staff reported that it worked well to approach employer engagement with the same needs-led approach they took with individuals. In practice, staff could work with employers to understand their hiring and business needs. This helped to foster good relationships with employers, and to create a good match between the treatment group and employers which in turn led to ongoing working relationships with the employer.
Staff also reported that employer engagement was much more than sharing people’s CV or disclosing a particular health issue. They emphasised the importance of taking a more personal approach and sharing the life story with employers, with consent. Taking this more empathetic approach was thought to be more successful than others and could lead to more effective job brokerage such as negotiating working conditions for those receiving support.
WMCA staff member said:
I would tell their story, basically, because I tend to get a lot of empathy which if you just lay a CV out which has got a gap of five/ten years or whatever, it’s not going to work. Yes, if you actually tell the person’s story then get the employers on side. In terms of sustaining employment, it’s just a case of, just as far as I’m concerned, asking if there’s anything that I need to do, keeping in touch in the most unobtrusive way possible.
Staff reported some examples of how good working relationships with employers could lead to additional opportunities for others in the treatment group, highlighting the importance of a good match between individuals and employers. In this way, they could act as a recruitment agent for the employer placing suitable candidates from their caseload.
Similarly, some in the treatment group provided examples of where their employment specialist had played an instrumental role in ensuring their job was suitably matched and adapted. For example, one explained that their employment specialist matched them with an employer in their desired sector who provided a pre-employment training course, an interview upon completion and a potential job opportunity. Another secured a position in administration shortly after joining the trial. The employment specialist offered them suggestions for job carving to put to the employer, which could make work more suitable for her needs. This led to the reasonable adjustments being put in place.
Intense employer engagement, such as job brokerage, was mentioned much less in the qualitative interviews with the treatment group and there was limited reference to specific employer engagement activity. Some felt that the support should place greater emphasis on job brokerage, matching them with appropriate opportunities which link to their existing skills and experience. Nonetheless, while there were not many examples of successful job brokerage, and only some examples of advisors liaising with employers to successfully support reasonable adjustments, there were general feelings that staff did everything they could in most circumstances.
WMCA treatment group said:
He bent over backwards and he did everything within his power.
2.4. Outcomes
This section explores intermediate and job outcomes achieved by the treatment group between May 2018 and April 2020 using qualitative data.
2.4.1. Mechanisms leading to outcomes
Staff and treatment group members were asked to comment on key elements of support that helped the treatment group make progress towards and into employment. Their views indicated that a combination of factors interacted in different ways for different people and led to outcomes. However, some factors were common mechanisms to outcomes.
As outlined earlier, individuals and staff shared the view that positive relationships between employment specialists and individuals receiving support were considered a key facilitator to achieving intermediate and major outcomes. Members of the treatment group particularly highlighted their relationships with employment specialists as being central to their progression on the trial and to achieving employment outcomes.
WMCA treatment group said:
The most beneficial bit was probably just being able to share what I was feeling about work rather than what you would do in a Jobcentre, to maybe do your CV, but, I don’t have a problem with that, I am a very intelligent person who is able to do certain things, it is the motivation behind things and someone with depression, to understand you if they have been through it themselves or they have had the training to be able to work with you, if they are that good then they are going to have the benefit and he had a beneficial effect on me.
Increased confidence was cited as a crucial intermediate outcome for individuals. Staff reported that those who experienced an increase in confidence and self-belief on the trial were most likely to achieve employment outcomes. They added that increased confidence and self-belief helped people to become more independent so that outcomes achieved could also be sustained without support.
The process of uncovering and establishing goals was central. Action planning further helped to measure and demonstrate progress to the treatment group. Staff emphasised that this increased awareness of transferable skills and abilities in turn boosted individuals’ confidence and started a process of realisation of how they could add value to a workplace.
WMCA treatment group said:
He even went to the point of going through some research too and when I got to the point of saying that I was interested in doing some lifeguarding work he had gone and went and researched on what lifeguarding needed to do and what kind of skills were required to be able to work in that role. He’s gone to the extent of finding what was necessary for that individual.
Some in the treatment group explained that the voluntary nature of the trial facilitated their engagement and helped them to trust the support and their employment specialist. This in turn empowered them to decide whether the trial was right for them and therefore engage with the service more fully.
Two major wider contexts to achieving outcomes were also highlighted in interviews with staff and the treatment group. The first was the impact of Universal Credit, which was introduced in the WMCA areas around the start of the trial. Universal Credit has an effect on the rate of Housing Benefit and Council Tax when someone enters work. Staff attempted to mitigate against this by conducting ‘better off’ assessments, helping them to see they would be better off working. The second context highlighted was a view that labour market opportunities exist within WMCA. New vacancies have become available linked to the Commonwealth Games, which Birmingham is hosting in 2022, and the development of HS2.
2.4.2. Outcomes achieved
The treatment group achieved a range of the expected intermediate outcomes and attributed these to the support. They felt these were necessary steps to achieving their longer-term goals. These intermediate outcomes included increased confidence and sense of direction, improved self-efficacy in job search, improved understanding of skills and career goals, views that work is feasible, and improvements in health and wellbeing. Members of the treatment group often described their progress as spanning all of these outcomes.
In interviews, often they talked about improvements to their self-confidence and self-esteem from participating in the trial. They felt more able to set goals and could more easily see the steps needed to be taken to reach these goals. Many felt that increased self-esteem and confidence occurred as a result of the trusted relationship and support accessed from their employment specialist. Through this support, individuals felt more able to take steps to better their circumstances, such as applying for jobs and attending interviews.
Provider staff emphasised the importance of their role in instilling confidence and self-belief in the treatment group from the outset. This, in turn, helped people to trust the support and to progress towards employment. Some who had entered work told how this had further increased their self-confidence and belief in their ability to work, as well as overcoming perceived barriers to work such as their ability to commute to the workplace.
WMCA treatment group said:
Just the fact of getting back into work has been a real confidence booster and, you know, my wellbeing has just come on leaps and bounds because you’ve got a reason to get up and go out in the morning, you know, which is a big factor. I just… It’s great to be able to go out and just be a part of society again.
Another common view amongst the treatment group was that the support had significantly improved their job search techniques, so that they had better knowledge of how to search for opportunities and where to source them. They also described how they were better able to prepare effective CVs and application forms. They reported that the trial had improved their ability to describe and clearly set out their skills and experience in response to job adverts, and to make effective applications. Consequently, they reported that they felt more confident in their ability to submit a successful job application. Staff reported that the intermediate outcomes of job searching and increased motivation tended to occur very early on in the treatment group’s time on the trial.
WMCA staff member said:
Outcomes we’re looking at immediately, people doing things that they would not ordinarily be doing, job searching and looking for applying for jobs, getting dressed and coming out of the house, getting motivated to get out of bed and come to meet someone… Absolutely, if anyone is engaging, they’re going to get that outcome.
Support in developing high quality job applications, such as a strong CV or cover letter, also increased the treatment group’s confidence in their ability to gain employment. One had noticed improvements in his ability to job search and felt a greater sense of direction in terms of his career.
Members of the treatment group also reported an improved understanding of their skills and assets, as well as increased clarity in their career goals and the steps needed to achieve these. They explained how provider staff worked with them to understand the relationship between skills gained in previous employment or wider life experience, and how these transfer to alternative job roles and sectors. Some realised they had skills and qualities they were previously unaware of.
WMCA treatment group said:
I started to see some that I never saw before, ones I wouldn’t have thought of, to be fair, just from all the different things I’ve done in my career path. I want to go into traffic management, but before I can do that, I need to get a driving licence. Before I can do that, I need to get a contracted job, so I’ve got an income.
Several treatment group members articulated how their employment specialist played a key role in supporting them to identify their skillset, and how to link these to the job roles and vacancies of interest to them. Staff emphasised that an important outcome was this increased awareness of transferable skills and abilities. This helped identify the roles that would be suitable to people’s needs, and how they could add value to a workplace.
Many in the treatment group spoke about how they have gained an increased sense that work was feasible for them, including improved attitudes towards work and an increased readiness to enter work. Gaining new employability skills was an important factor in this. For example, some discussed learning more about how to apply for jobs, improving their CV and developing their interview skills. Others were more confident about the feasibility of work as they gained a better understanding of the types of reasonable adjustments that employers can make to facilitate a good working environment.
WMCA treatment group said:
I definitely feel more able to work. I want to get into work now, rather than like I couldn’t be bothered kind of before, do you know what I mean? It was like half hearted, I’d look every now and again.
Members of the treatment group also reported general improvements in their health and wellbeing. This included improved mental health as well as improvements in physical health conditions. It was common for them to say that the trial, including regular appointments and a positive one-to-one relationship with provider staff, increased their motivation. This in turn improved their health and wellbeing. For others, the trial provided a sense of routine and stability which in turn brought about positive changes to mood and opportunities to relieve stress. As one said, attending routine appointments with their employment specialist and other associated activities contributed to improvements in their wellbeing.
WMCA treatment group said:
I’ve quit smoking, and then with the boxing, and then eating better, and now I don’t have high blood pressure anymore, I’m not at risk for Type 2 Diabetes anymore, my cholesterol is perfect, and everything else is good. I mean, yes I have an irregular heartbeat and some other things. However, physically this is the best shape I’ve been in in over 20 years. And Thrive has a lot to do with that as well because it’s kept my motivation.
Others reported how the trial helped them to seek help and engage with health services to address their mental or physical health needs. Some explained how this was a significant change for them, in that they would normally not engage with services or would lack confidence to open up to health professionals about their conditions or needs.
WMCA treatment group said:
I was rather shut off before I started this whole process so I was tending not to engage with anything that would help me really, including the medical side of it, like because I had back problems and all sorts so I was just sitting in my flat in a boat load of pain…But, yes, it has encouraged me to try and seek help where it is available.
Gaining employment had additional positive impacts for some in the treatment group. For example, entering employment had further improved their confidence, increased wellbeing, and some particularly commented on their improved financial situation. There were a number whose wider life circumstances had vastly improved, such as improved housing conditions.
2.4.3. Control group outcomes were more limited
Recruits randomised to the control group who were interviewed in WMCA reported fewer outcomes compared to those in the treatment group. Most had not followed up with the services on the control group leaflet supplied to them following randomisation at the initial appointment. This was often because they felt unable to, or because they were already aware of these services. This meant they had not received any support, beyond any existing services such as JCP that they were already in touch with. Others reported that the list of other services was not fit for purpose for all recruits – which could be judged to signal that the trial was filling a gap in local services.
WMCA control group recruit said:
When I looked at the lists I found them to be either for a lot younger people than me, it was apprenticeships and, you know, student kind of things, or then there were some that were kind of severely disabled. So I found that apart from one or two of the list, there wasn’t really much that would really shout out at me, you know, that would be in my category.
Where recruits followed up with other services, there were mixed responses. Some found the other services were not useful or not appropriate for them and did not progress beyond first contact. Where they did take up support their commentary indicated that they could find either health and wellbeing support, and improve in these areas but this was not combined with employment support.
There were a very small number of job outcomes achieved by the control group interviewees. These tended to be found by recruits themselves, using standard online job search methods.
3. 4-month survey descriptive analysis
This chapter reports a descriptive analysis of the 4-month survey data, comparing results between areas, trial groups and treatment and control. The early section focuses on the full respondent group. The later section explores the service experience of respondents in the treatment groups.
3.1. Introduction
The 4-month survey (i.e. four months after initial randomisation of recruits) was placed in the field on 17 October 2018 and was issued to the full sample of recruits (those randomised for the trials) on a monthly rolling basis (see Appendices, Chapter 6). The final response rate, 55%, was calculated based on recruits represented in the dataset. A total of 17 batches were delivered, with the final batch completing at the end of March 2020.
In reporting the survey, comparisons are drawn between different trial groups or between the two sites only where differences were statistically significant at the 95% level. In other words, differences as large as those reported have no more than a 5% probability of occurring by chance. The term ‘significant’ refers to statistical significance (at the 95% level) and is not intended to imply substantive importance.
This chapter highlights the overarching demographics (Section 3.3)[footnote 6], the type and extent of health problems (and multi-morbidity) that respondents reported they are living with (Section 3.4), the range of health and wellbeing measures (Section 3.5), respondents’ perceived barriers to employment (Section 3.6), and perceptions of the support provided within each of the interventions (Sections 3.7 and 3.8).
A comparison of the three main trial groups is given:
- SCR respondents who joined the trial’s in-work service (SCR IW group)
- SCR respondents who joined the trial’s out-of-work service (SCR OOW group)
- the WMCA group, all of whom were not working on joining the trial (WMCA OOW).
Using these groups, differences between the trials are explored but also consider the disparities between SCR IW and OOW respondents. There are important differences between these groups, owing to their employment status on joining the trial, which may have implications for how well the trial works with them and how they feel about the support they receive.
Wherever we have found important differences between the control and treatment groups we have also reported on these. If no differences were observed, then we have not commented on this but have provided the tables in the appendices to this report.
To provide further insight into the descriptive analysis, we have also provided additional comparisons by trial site. This is done in two ways:
- a comparison of all respondents in SCR (SCR all), regardless of their work status when entering the trials, to all respondents in WMCA; and,
- the comparison of the SCR IW with both out-of-work groups (OOW all), to further identify the differences between these two groups as the trial progressed.
These additional data can be found in Chapters 9 and 10 of the ‘Evaluation of the Health-led Employment Trials: Appendices to the Implementation and 4-month outcomes report’.
3.1.1. Notes to Text and Tables
1. Tables accompanying this chapter can be found in the appendices. The chapter text includes references to the relevant tables.
2. The data used in the report have been weighted. All percentages are based on the weighted data. Only the unweighted sample sizes are shown at the foot of each table.
3. Unless otherwise stated, where comparisons are made in the text between different population groups or variables, only those differences found to be statistically significant at the 95% level are reported. In other words, differences as large as those reported have no more than a five% probability of occurring by chance. The term ‘significant’ refers to statistical significance (at the 95% level) and is not intended to imply substantive importance. P-values that are below or equal to 0.05 are significant.
4. The following conventions have been used in tables:
- 0 indicates no observations (zero value)
- *indicates non-zero values of less than 0.5%
- N/A indicates where no significance test has been run
5. Owing to rounding, column percentages may not add exactly to 100 per cent. For questions where respondents could give more than one response, the percentages will add up to more than 100 per cent.
6. ‘Missing values’ occur for several reasons, including refusal or inability to answer a particular question/section and cases where the question is not applicable to the respondent.
7. Where a table contains more than one variable, the bases may not be the same.
3.2. Defining the trial groups for reporting
This section explains how the different trial groups have been used throughout this report. The two sites operated different eligibility criteria for recruits which led to three trial groups for reporting purposes: SCR IW, SCR OOW and WMCA OOW. The table below gives further details on the health conditions and work status of respondents within each group.
Table 3-1: Trial group health conditions and work status
| Trial group | Health condition | Work status |
|---|---|---|
| SCR in-work (SCR IW) | Mild to moderate physical or mental health condition or disability (excluding those on a Care Programme, receiving Community Mental Health Team support or identified on a Serious Mental Illness register) | In any kind of employment for 16 or more hours of work a week, including those who were self-employed but struggling or off sick due to their condition(s) |
| SCR out-of-work (SCR OOW) | Mild to moderate physical or mental health condition or disability (excluding those on a Care Programme, receiving Community Mental Health Team support or identified on a Serious Mental Illness register) | Out-of-work with an interest in moving into employment |
| WMCA (WMCA OOW) | Any health condition or disability (excluding those with a moderate to severe learning disability or dementia) | Out-of-work for over four weeks prior to the trial |
3.3. Demographics
3.3.1. Work history
Figure 3.3.1 demonstrates the variance in employment histories over the two years before entering the trial between different trial groups. Those in the SCR trial were more likely to have always been in paid employment (34%), in comparison to those in the WMCA region (3%), although this was strongly driven by the experience of the SCR IW group where 75% had always been in employment. This compares with 4% in the SCR OOW group. The WMCA group (none of whom were working on joining the trial) had the least number of respondents who had always been in paid employment in the two years before entering the trial (3%), as well as the highest number of respondents who had never been in paid employment (59%). This was significantly different to those in the SCR IW and SCR OOW trial groups (Figure 4:3:1; Appendices, Chapter 2, Table 2:1).
Figure 3.3.1: Work history before entering the trial, by trial group (%)
| Work history | All % | SCR IW % | SCR OOW % | WMCA OOW % |
|---|---|---|---|---|
| Always been in paid employment | 23 | 75 | 4 | 3 |
| Been in paid emloyment for more than half the time | 17 | 13 | 20 | 16 |
| Been in paid emloyment for less than half the time | 19 | 9 | 25 | 21 |
| Never been in paid employment | 40 | 1 | 49 | 59 |
| Don’t know/Prefer not to say | 1 | 1 | 1 | 1 |
Base: baseline data from all 4-month survey respondents (All respondents: 5,407, SCR IW: 1,480, SCR OOW: 1,984, WMCA OOW: 1,943).
3.3.2. Employment status at the 4-month survey
Figure 4:3:2 shows the employment status of respondents approximately four months following randomisation. Those in the SCR OOW group and the WMCA group were significantly more likely to be unemployed and seeking work than those in the SCR IW group. Among the SCR OOW group, 60% of respondents were unemployed and seeking work, similar to 65% of respondents in the WMCA group, and much higher than the 12% of the SCR IW group (Appendices, Chapter 2, Table 2:2).
Figure 3.3.2: Employment status at 4-month survey, by trial group (%)
| Employment status | All % | SCR IW % | SCR OOW % | WMCA OOW % |
|---|---|---|---|---|
| Employed full-time (30+ hours a week) | 18 | 49 | 8 | 8 |
| Employed part-time (16 to 29 hours a week) | 9 | 23 | 4 | 4 |
| Employed part-time (16 hours or less a week) | 5 | 7 | 4 | 3 |
| Unemployed – seeking work | 49 | 12 | 60 | 65 |
| Unemployed – not seeking work | 13 | 4 | 17 | 17 |
| Other | 14 | 10 | 15 | 14 |
Base: 4-month survey respondents (All respondents: 5,407, SCR IW: 1,480, SCR OOW: 1,984, WMCA OOW: 1,943). Note: ‘Other’ includes: Training, education or apprenticeship (full or part-time); Volunteering or work experience; Self-employed (full or part-time); Carer (adult or child); Other activity; None.
3.3.3. Work history between baseline and 4-month survey
Among those in employment at the time of the 4-month survey, 44% of SCR IW respondents, 73% of SCR OOW respondents and 66% of WMCA respondents had been out of employment at some point in the last four months. There were also significant differences between the two trial sites, with 50% of all respondents in SCR reporting time spent not in employment in the past four months, compared to 66% of those in WMCA (Figure 4:3:3; Appendices, Chapter 2, Table 2:3).
Figure 4:3:3 Proportion of respondents in work at the 4-month survey who had been out of employment in the last four months, by trial group (%)
| Out-of-work status | All % | SCR IW % | SCR OOW % | WMCA OOW % |
|---|---|---|---|---|
| Been out-of-work in the last 4 months (including time on sick leave while in employment) | 53 | 44 | 73 | 66 |
Base: all respondents who were in employment at the time of the 4-month survey (All respondents: 1,840, SCR IW: 1,210, SCR OOW: 346, WMCA OOW: 284).
Those who were not in employment at the time of the 4-month survey were asked whether they had undertaken any work during that time period. Those in the SCR IW group were more likely to have been employed in this period (48%) (Figure 5:3:4; Appendices, Chapter 2, Table 2:4).
Respondents who were in employment at the time of the 4-month survey were asked to indicate the number of weeks that they had been in employment during that time period. Of those in employment in the SCR IW group, 55% reported being in employment 13-16 weeks in the past four months, compared to 17% of those in the SCR OOW group and 14% of those in the WMCA group. (Figure 4:3:5; Appendices, Chapter 2, Table 2:5).
Figure 4:3:4 Proportion of people out-of-employment at the 4-month survey who had been in work at any point over the last four months, by trial group (%)
| Employment status | All % | SCR IW % | SCR OOW % | WMCA OOW % |
|---|---|---|---|---|
| Done any paid work in the last 4 months | 11 | 48 | 8 | 7 |
Base: all respondents who were not in employment at the time of the 4-month survey (All respondents:3,507, SCR IW: 270, SCR OOW: 1,603, WMCA OOW: 1,634).
Figure 3.3.5: Number of weeks respondents worked during the past four months, by trial group (%)
| Number of weeks worked | All % | SCR IW % | SCR OOW % | WMCA OOW % |
|---|---|---|---|---|
| Not worked any weeks during past 4 months | 9 | 6 | 12 | 13 |
| 1 to 4 weeks | 19 | 9 | 31 | 36 |
| 5 to 8 weeks | 14 | 8 | 21 | 21 |
| 9 to 12 weeks | 13 | 11 | 17 | 16 |
| 13 to 16 weeks | 39 | 55 | 17 | 14 |
| 17+ weeks | 6 | 9 | 2 | 0 |
Base: all 4-month survey respondents in employment at any point in the last 4 months (All respondents: 2,114, SCR IW: 1,277, SCR OOW: 462, WMCA OOW: 375).
3.3.4. Age
Figure 4:3:6 demonstrates that there was a broadly even distribution by age across the trial groups, although a small number of significant differences were identified. In the SCR IW group, 12% of respondents were aged between 17 and 24 which is significantly different to the 18% in the SCR OOW group and 17% in the WMCA group. The SCR IW also had a greater number of respondents in the older 45 to 54 age group: 28% were aged between 45 and 54 compared to 22% in the SCR OOW group and 24% in the WMCA group (Figure 4:3:6; Appendices, Chapter 2, Table 2:7).
Figure 4:3:6: Age range, by trial group (%)
| Age range | All % | SCR IW % | SCR OOW % | WMCA OOW % |
|---|---|---|---|---|
| 17 to 24 | 16 | 12 | 18 | 17 |
| 25 to 34 | 21 | 22 | 22 | 20 |
| 35 to 44 | 19 | 21 | 19 | 19 |
| 45 to 54 | 24 | 28 | 22 | 24 |
| 55+ | 19 | 17 | 19 | 20 |
Base: baseline data from all 4-month survey respondents (All respondents: 5,407, SCR IW: 1,480, SCR OOW: 1,984, WMCA OOW: 1,943).
3.3.5. Housing tenure
Across all groups, the most common form of housing tenure was renting: 40% among SCR IW respondents, 57% among SCR OOW respondents and 56% among WMCA respondents. (Figure 4:3:6; Appendices, Chapter 2, Table 2:8).
Figure 4:3:7: Housing tenure, by trial group (%)
| Housing tenure | All % | SCR IW % | SCR OOW % | WMCA OOW % |
|---|---|---|---|---|
| Own it outright | 11 | 15 | 10 | 10 |
| Buying it with the help of a mortgage or loan | 14 | 30 | 9 | 8 |
| Part own and part rent (shared ownership) | 1 | 1 | 0 | 1 |
| Rent it | 52 | 40 | 57 | 56 |
| Other | 22 | 15 | 23 | 26 |
Base: baseline data from all 4-month survey respondents (All respondents: 5,364, SCR IW: 1,466, SCR OOW: 1,969, WMCA OOW: 1,929).
Due to low numbers of squatters this category was not included in this figure.
3.3.6. Gender
The distribution by gender differed across the trial groups. SCR IW respondents were less likely to be men (43%), and SCR OOW and WMCA group were more likely to be men (56% and 53% respectively) (Figure 4:3:8, Appendices, Chapter 2, Table 2:9).
Figure 4:3:8: Gender, by trial group (%)
| Gender | All % | SCR IW % | SCR OOW % | WMCA OOW % |
|---|---|---|---|---|
| Male | 51 | 43 | 56 | 53 |
| Female | 48 | 57 | 44 | 47 |
Base: baseline data from all 4-month survey respondents (All respondents: 5,399, SCR IW: 1,478, SCR OOW: 1,982, WMCA OOW: 1,939).
3.3.7. Dependent children
Across all trial groups, around a quarter of respondents had dependent children living with them when they were randomised into the trial. SCR IW respondents were as likely to have dependent children (27%) as those in the OOW groups (24%) (Figure 4:3:9; Appendices, Chapter 2, Table 2:10).
Figure 4:3:9: Presence of dependent children, by trial group (%)
| Dependent children | All % | SCR IW % | SCR OOW % | WMCA OOW % |
|---|---|---|---|---|
| Dependent children | 25 | 27 | 24 | 24 |
| No dependent children | 75 | 73 | 76 | 76 |
Base: baseline data from all 4-month survey respondents (All respondents: 5,391, SCR IW: 1,474, SCR OOW: 1,979, WMCA OOW: 1,938).
3.3.8. Ethnic group
The proportion of respondents from minority ethnic backgrounds differed by location and group. In SCR, the majority of respondents were from white ethnic backgrounds (90% in the IW group and 86% in the OOW group). In the WMCA group, a substantially higher proportion of respondents were from a minority ethnic group. In the WMCA group, 64% of respondents were from white ethnic backgrounds; the second largest ethnic group was Asian or Asian British (17%) followed by Black, African, Caribbean and Black British (13%) (Figure 4:3:10; Appendices, Chapter 2, Table 2:11). Respondents in the SCR IW group (90%) were significantly more likely to be from a white ethnic background than those in the SCR OOW group (86%). The SCR OOW group also had a higher proportion of respondents from an Asian or Asian British background (6% compared to 4% for the SCR IW group).
Figure 4:3:10: Ethnicity, by trial group (%)
| Ethnicity | All % | SCR IW % | SCR OOW % | WMCA OOW % |
|---|---|---|---|---|
| White | 79 | 90 | 86 | 64 |
| Asian or Asian British | 3 | 4 | 6 | 17 |
| Black/African/Caribbean/Black British | 9 | 3 | 4 | 13 |
| Mixed/multiple ethnic groups | 7 | 2 | 2 | 4 |
| Other ethnic group | 2 | 1 | 2 | 2 |
Base: baseline data from all 4-month survey respondents (All respondents: 5,383, SCR IW: 1,476, SCR OOW: 1,977, WMCA OOW: 1,930).
3.3.9. Relationships
In the SCR IW group, 48% of respondents were married, in a civil partnership or living with a partner. This was lower for the SCR OOW group (25%) and the WMCA group (26%) (Figure 4:3:11; Appendices, Chapter 2, Table 2:13).
Figure 4:3:11: Relationship status, by trial group (%)
| Relationship status | All % | SCR IW % | SCR OOW % | WMCA OOW % |
|---|---|---|---|---|
| Married | 21 | 31 | 16 | 18 |
| Living with partner | 10 | 17 | 9 | 7 |
| Single | 55 | 40 | 60 | 61 |
| Widowed, divorced, separated | 13 | 10 | 13 | 14 |
Base: baseline data from all 4-month survey respondents (All respondents: 5,407, SCR IW: 1,480, SCR OOW: 1,984, WMCA OOW: 1,943). Owing to low numbers reporting civil partnerships this response is not included.
3.3.10. Education
Respondents were asked about their highest qualifications at baseline. In all trial groups, 60% of respondents reported GCSEs (A-C), A-Levels or other higher education (below degree) qualifications as their highest qualifications. The SCR IW respondents were more likely to hold a degree-level or higher qualification (26%) and less likely to have no formal qualifications (6%) than the combined OOW respondents, 13% of whom had a degree-level or higher qualification and 14% no formal qualifications. (Figure 4:3:12; Appendices, Chapter 2, Table 2:14).
Figure 4:3:12: Education, by trial group (%)
| Education | All % | SCR IW % | SCR OOW % | WMCA OOW % |
|---|---|---|---|---|
| Degree, higher degree, or equiv | 17 | 26 | 13 | |
| A-Levels, GCSEs (A-C), or equiv | 60 | 60 | 60 | |
| GCSEs (D-G), NVQ or SVQ level 1, or equiv | 11 | 13 | 13 | |
| No formal qualifications | 12 | 13 | 15 |
Base: baseline data from all 4-month survey respondents (All respondents: 5,320, SCR IW: 1,460, SCR OOW: 1,948, WMCA OOW: 1,912).
3.4. Health conditions
3.4.1. Type of health condition
The 4-month survey did not ask people about their health condition. Consequently, we report (below) those conditions that respondents mentioned at their baseline interview.
A majority of respondents reported a mental health condition. Significant differences were found when comparing the SCR IW group, the SCR OOW group, and the WMCA group. More respondents in the SCR IW group (88%) reported a mental health condition compared to respondents in the SCR OOW group (86%) and the WMCA group (80%).
Conditions related to fatigue, concentration or memory were widely reported. Over two-thirds of respondents in the SCR IW group (72%) and slightly under two-thirds of respondents in the SCR OOW (61%) and WMCA groups (60%) reported this type of health condition. Pain and discomfort were reported by over half of respondents: 57% of the SCR IW group, 54% of the SCR OOW group and 59% of the WMCA group.
Conditions related to arms, hands, legs, feet, neck or back were reported by more than half of respondents (56% in the SCR IW group, 56% in the SCR OOW group and 60% in the WMCA group). Coronary, lung or vascular conditions were similarly widely reported: significant differences were found, with more WMCA respondents (39%) reporting this type of health condition compared to SCR OOW respondents (36%) and SCR IW respondents (34%).
Respondents in the SCR IW group were significantly more likely than others to have skin conditions or allergies. In comparison, those in WMCA group were more likely than others to have communication challenges including: conditions related to vision, hearing or speaking; learning difficulties; or other health and disability issues (Table 3-2).
Table 3-2: Health conditions, by trial group
Trial group
| Health conditions | SCR IW % | SCR OOW % | WMCA OOW % | Total % | p-value |
|---|---|---|---|---|---|
| Mental health condition: depression, stress, anxiety, or other mental health condition | 88 | 86 | 80 | 84 | 0.000 |
| Conditions related to fatigue, concentration or memory | 72 | 61 | 60 | 64 | 0.000 |
| Pain or discomfort | 57 | 54 | 59 | 57 | 0.022 |
| Conditions related to arms, hands, legs, feet, neck or back | 56 | 56 | 60 | 58 | 0.008 |
| Coronary, lung or vascular conditions | 34 | 36 | 39 | 37 | 0.007 |
| Dizziness or balance | 32 | 33 | 36 | 34 | 0.079 |
| Gastrointestinal or Renal conditions | 27 | 24 | 24 | 25 | 0.103 |
| Skin conditions or allergies | 25 | 21 | 20 | 22 | 0.004 |
| Communication challenges: conditions related to vision, hearing or speaking | 22 | 24 | 29 | 25 | 0.000 |
| Arthritis | 21 | 20 | 23 | 21 | 0.104 |
| Other health or disability issue | 13 | 14 | 16 | 15 | 0.025 |
| Learning difficulties | 12 | 19 | 21 | 18 | 0.000 |
| Progressive illness not covered above | 7 | 7 | 7 | 7 | 0.879 |
| No health conditions | 1 | * | * | * | N/A |
| Base: | 1,479 | 1,982 | 1,941 | 5,402 | – |
Base: baseline data from all 4-month survey respondents.
3.4.2. Multi-morbidity
Multi-morbidity was common amongst respondents. Over half of the SCR IW group (52%), the SCR OOW group (51%) and the WMCA group (53%) reported six or more long-term health conditions. Over a third of all trial groups reported three to five long-term health conditions. No respondents in any trial group reported having no health conditions although this was to be expected given the eligibility criteria for the trials (Table 3-3).
Table 3-3: Number of health conditions, by trial group
Trial group
| Number of health conditions | SCR IW % | SCR OOW % | WMCA OOW % | Total % | p-value |
|---|---|---|---|---|---|
| No Long term conditions | * | * | * | * | N/A |
| 1 Long term condition | 3 | 4 | 5 | 4 | 0.102 |
| 2 Long term conditions | 7 | 8 | 7 | 7 | N/A |
| 3 – 5 Long term conditions | 37 | 37 | 35 | 36 | N/A |
| 6+ Long term conditions | 52 | 51 | 53 | 52 | N/A |
| Base: | 1,467 | 1,977 | 1,940 | 5,384 | – |
Base: baseline data from all 4-month survey respondents.
3.4.3. Musculoskeletal health
Respondents were asked about their musculoskeletal health. Around seven in ten respondents reported good musculoskeletal health (69% of SCR IW respondents, 73% of SCR OOW respondents and 71% of WMCA respondents). Those in the SCR IW group (31%) were significantly more likely to have poor musculoskeletal health than those in the SCR OOW group (27%) or WMCA group (29%) (Table 3-4). No significant differences were found between treatment and control group respondents in any trial group (Appendices, Chapter 3, Table 3:21-Table 3:23).
Table 3-4: Musculoskeletal health, by trial group
Trial group
| Musculoskeletal health | SCR IW % | SCR OOW % | WMCA OOW % | Total % | p-value |
|---|---|---|---|---|---|
| Good MSK health | 69 | 73 | 71 | 71 | 0.019 |
| Poor MSK health | 31 | 27 | 29 | 29 | N/A |
| Base: | 1,478 | 1,980 | 1,940 | 5,398 | – |
Base: baseline data from all 4-month survey respondents.
3.5. Health and wellbeing
3.5.1. EQ5D5L dimensions
Respondents experienced difficulties across all dimensions of the EQ5D5L, although the severity of these difficulties varied by dimension and trial group. When looking at problems with self-care, such as washing or dressing, 69% of those in the SCR IW group, 68% of those in the SCR OOW group, and 67% of those in WMCA had no problems washing or dressing and no significant differences were identified between these groups. Only 1% of respondents in each trial group reported being unable to wash or dress themselves, and less than 5% in all trial groups reported severe problems (Table 3-5). There were no significant differences by whether a respondent was in treatment or control group (Appendices, Chapter 3, Table 3:15-Table 3:17).
Table 3-5: EQ5D5L Self-care, by trial group
Trial group
| EQ5D5L Self-care | SCR IW % | SCR OOW % | WMCA OOW % | Total % | p-value |
|---|---|---|---|---|---|
| No problems washing or dressing | 69 | 68 | 67 | 68 | 0.47 |
| Slight problems washing or dressing | 18 | 16 | 17 | 17 | N/A |
| Moderate problems washing or dressing | 9 | 13 | 12 | 11 | N/A |
| Severe problems washing or dressing | 3 | 2 | 4 | 3 | N/A |
| Unable to wash or dress | 1 | 1 | 1 | 1 | N/A |
| Base: | 1,478 | 1,976 | 1,939 | 5,393 | – |
Base: all 4-month survey respondents.
Another dimension focuses on anxiety and depression. Among survey respondents, 25% of the SCR IW group, 30% of the SCR OOW group and 25% of the WMCA group reported being either extremely or severely anxious or depressed. At the other end of the spectrum, 13% of respondents in the SCR IW group were not anxious or depressed, which differed significantly from 17% of respondents in the SCR OOW group and 20% of respondents in WMCA (Table 3-6). There were no significant differences by whether a respondent was in the treatment or control group (Appendices, Chapter 3, Table 3:24-Table 3:26).
Table 3-6: EQ5D5L Anxiety/depression, by trial group
Trial group
| EQ5D5L Anxiety/depression | SCR IW % | SCR OOW % | WMCA OOW % | Total % | p-value |
|---|---|---|---|---|---|
| Not anxious or depressed | 13 | 17 | 20 | 17 | 0.000 |
| Slightly anxious or depressed | 27 | 22 | 23 | 24 | N/A |
| Moderately anxious or depressed | 34 | 32 | 31 | 32 | N/A |
| Severely anxious or depressed* | 16 | 19 | 17 | 17 | 0.005 |
| Extremely anxious or depressed* | 9 | 11 | 8 | 10 | 0.005 |
| Base: | 1,475 | 1,970 | 1,919 | 5,364 | – |
Base: all 4-month survey respondents. *Significance test run on ‘severely anxious or depressed’ and ‘extremely anxious or depressed’ categories combined.
A majority of respondents reported experiencing some pain and discomfort, with only around a third of the respondents saying that they experienced none at all (31% of those in SCR IW, 34% in SCR OOW, and 32% in WMCA). When comparing trial groups for this dimension, there were no significant differences (Table 3-7). There were no significant differences by whether a respondent was in the treatment or control group (Appendices, Chapter 3, Table 3:27-Table 3:29).
Table 3-7: EQ5D5L Pain/discomfort, by trial group
Trial group
| EQ5D5L Pain/discomfort | SCR IW % | SCR OOW % | WMCA OOW % | Total % | p-value |
|---|---|---|---|---|---|
| No pain or discomfort | 31 | 34 | 32 | 33 | 0.222 |
| Slight pain or discomfort | 26 | 25 | 25 | 25 | N/A |
| Moderate pain or discomfort | 26 | 26 | 25 | 26 | N/A |
| Severe pain or discomfort | 13 | 11 | 13 | 12 | N/A |
| Extreme pain or discomfort | 4 | 4 | 5 | 5 | N/A |
| Base: | 1,477 | 1,973 | 1,929 | 5,379 | – |
Base: all 4-month survey respondents.
Differences between the groups emerged in the responses regarding individuals’ daily activities. In the WMCA group, 36% of respondents reported no problems with performing usual activities, compared to 32% in the SCR OOW group and 29% in the SCR IW group (Table 3-8). There may be several reasons for these differences. Firstly, interpretation of ‘usual activities’ may differ between the groups, particularly as those who are in employment may have to set a clear routine, commute to work, and carry out work-related tasks, in comparison to those who are receiving other support or looking for work. Secondly, it is difficult to know how respondents may understand this question. Some respondents may be unable to complete certain activities but as these are not ‘usual’ (for example, daily) they may report no problems. There were no significant differences between the treatment or control group (Appendices, Chapter 3, Table 3:30-Table:32).
Table 3-8: EQ5D5L Usual activities, by trial group
Trial group
| EQ5D5L Usual activities | SCR IW % | SCR OOW % | WMCA OOW % | Total % | p-value |
|---|---|---|---|---|---|
| No problems with performing usual activities | 29 | 32 | 36 | 32 | 0.000 |
| Slight problems with performing usual activities | 30 | 28 | 28 | 28 | N/A |
| Moderate problems with performing usual activities | 28 | 27 | 24 | 26 | N/A |
| Severe problems with performing usual activities | 10 | 10 | 9 | 10 | N/A |
| Unable to perform usual activities | 3 | 3 | 3 | 3 | N/A |
| Base: | 1,478 | 1,961 | 1,917 | 5356 | – |
Base: all 4-month survey respondents.
There were differences in level of mobility, with the SCR IW group being least likely to experience problems walking about (57% reporting no problems) compared to the SCR OOW group (52% reporting no problems) and the WMCA group (50% reporting no problems) (Table 3-9). Again, there were no significant differences by whether a respondent was in the treatment or control group (Appendices, Chapter 3, Table 3:33-Table 3:35).
Table 3-9: EQ5D5L Mobility, by trial group
Trial group
| EQ5D5L Mobility | SCR IW % | SCR OOW % | WMCA OOW % | Total % | p-value |
|---|---|---|---|---|---|
| No problems in walking about | 57 | 52 | 50 | 53 | 0.000 |
| Slight problems in walking about | 19 | 21 | 20 | 20 | N/A |
| Moderate problems in walking about | 17 | 19 | 19 | 19 | N/A |
| Severe problems in walking about | 7 | 7 | 9 | 8 | N/A |
| Unable to walk about | * | 1 | 1 | 1 | N/A |
| Base: | 1,476 | 1,974 | 1,936 | 5,386 | – |
Base: all 4-month survey respondents.
EQ5D5L Index Scores
The utility scores of the EQ5D5L were calculated (see Table 3-10)[footnote 7]. These range from zero (theoretical ‘death’) to one, theoretical ‘perfect health’. The mean EQ5D5L Index scores were similar across all groups, with a mean score of 0.58 among SCR IW respondents, 0.57 among SCR OOW respondents and 0.57 among WMCA respondents. This can be equated to approximately 60% of perfect health. No comparator population data is, as yet, available for EQ5D5L. However, looking at the EQ5D3L (an earlier version of the score), for the UK population the index value was 0.856 in 2014[footnote 8]. This suggests the scores reported by trial respondents are likely to be lower than overall population levels, which is plausible given that the trial populations are people with health conditions.
Table 3-10: EQ5D5L Index value, by trial group
Trial group
| EQ5D5L Index value | SCR IW % | SCR OOW % | WMCA OOW % | Total % | p-value |
|---|---|---|---|---|---|
| Mean* | 0.58 | 0.57 | 0.57 | 0.58 | 0.786 |
| Base: | 1,469 | 1,936 | 1,885 | 5,290 | – |
Base: all 4-month survey respondents.
EQ-VAS Score
The EQ5D5L incorporates a visual analogue scale. Represented as a thermometer and ranging from zero (worst imaginable health state) to 100 (best imaginable health state), respondents are asked to indicate on the scale how good or bad they perceived their health state to be on the day that they completed (or were supported to complete) the 4-month survey. The highest mean score was 58.3 for SCR IW respondents, which was significantly higher than the 55.3 for SCR OOW and 56.4 amongst WMCA respondents (Table 3-11), with no significant differences between treatment or control groups (Appendices, Chapter 3, Table 3: 39-Table 3:41).
Table 3-11: EQ-VAS, by trial group
Trial group
| EQ-VAS | SCR IW % | SCR OOW % | WMCA OOW % | Total % | p-value |
|---|---|---|---|---|---|
| Mean | 58.3 | 55.3 | 56.4 | 56.5 | 0.002 |
| Base: | 1,470 | 1,973 | 1,921 | 5,364 | – |
Base: all 4-month survey respondents.
3.5.2. How much health condition limits every day activities
In addition to EQ5D5L, respondents were asked about the extent to which their health condition affected their ability to carry out everyday activities. Overall, 30% of respondents in the SCR IW group, 32% of the SCR OOW group, and 32% of the WMCA group reported that their health conditions or disabilities limited their ability to carry out everyday activities ‘a great deal’ (Table 3-12). There was a significant difference when comparing control and treatment status in the SCR IW group. Those respondents in the SCR IW control group were more likely (32%) to report that their everyday activities were limited ‘a great deal’ compared to SCR IW treatment group respondents (27%) . There were no significant differences between control and treatment respondents for the SCR OOW or WMCA groups (Appendices, Chapter 3, Table 3:42-Table 3:44).
Table 3-12: The extent to which health conditions or disabilities limit ability to carry out everyday activities, by trial group
Trial group
| Extent health conditions/disabilities limit ability to carry out everyday activities | SCR IW % | SCR OOW % | WMCA OOW % | Total % | p-value |
|---|---|---|---|---|---|
| A great deal | 30 | 32 | 32 | 31 | 0.309 |
| To some extent | 42 | 40 | 39 | 40 | N/A |
| A little | 24 | 22 | 23 | 23 | N/A |
| Not at all | 5 | 6 | 6 | 6 | N/A |
| Base: | 1,349 | 1,832 | 1,790 | 4,971 | – |
Base: all 4-month survey respondents.
3.5.3. Wellbeing
4-month survey respondents were asked a series of questions drawn from the Short Warwick Edinburgh Mental Wellbeing Scale (SWEMWBS). Answers to these questions were used to create three groups of ‘high’, ‘average’, and ‘low’ mental wellbeing.
Low mental wellbeing was reported by 64% of those in SCR IW, 63% of those in SCR OOW, and 61% in WMCA, which was not significantly different. Nearly a third of the SCR IW and OOW respondents (31%) and a third of WMCA respondents (33%) reported average mental well-being. Less than one in ten respondents in SCR IW (5%), SCR OOW (7%) and WMCA (6%) reported high mental wellbeing (Table 3-13).
There were significant differences in the SCR IW group by treatment and control status (Table 3-14). Overall, 60% of those receiving IPS in this group had low mental wellbeing, compared to 68% of those who were in the control group. There were no significant differences in the SCR OOW group or the WMCA group (Appendices, Chapter 3, Table 3:45-Table 3:46).
Table 3-13: Mental wellbeing (SWEMWBS), by trial group
Trial group
| Mental wellbeing (SWEMWBS) | SCR IW % | SCR OOW % | WMCA OOW % | Total % | p-value |
|---|---|---|---|---|---|
| Low mental wellbeing | 64 | 63 | 61 | 62 | 0.113 |
| Average mental wellbeing | 31 | 31 | 33 | 31 | N/A |
| High mental wellbeing | 5 | 7 | 6 | 6 | N/A |
| Base: | 1,458 | 1,920 | 1,899 | 5,277 | – |
Base: all 4-month survey respondents.
Table 3-14: Mental wellbeing (SWEMWBS), among the SCR IW trial group
SCR IW group
| Mental wellbeing (SWEMWBS) | Treatment % | Control % | Total % | p-value |
|---|---|---|---|---|
| Low mental wellbeing | 60 | 68 | 64 | 0.001 |
| Average mental wellbeing | 35 | 27 | 31 | N/A |
| High mental wellbeing | 5 | 5 | 5 | N/A |
| Base: | 778 | 680 | 1,458 | – |
Base: all SCR IW trial group respondents.
Satisfaction with life
Life satisfaction varied significantly between the different groups of respondents: 28% of respondents in SCR IW and 29% of those in WMCA had no or little life satisfaction, compared to 32% of SCR OOW respondents. Over a third of SCR IW (39%), SCR OOW (37%) and WCMA (39%) respondents had neutral life satisfaction. General or complete satisfaction was reported by 33% of SCR IW respondents, 31% of respondents in the SCR OOW group and 32% of those in WMCA (Table 3-14).
Within the SCR OOW group, there were significant differences between treatment and control groups, with respondents in the control group (34%) being more likely to report little or no life satisfaction compared to those in the treatment group (30%) (Appendices, Chapter 3, Table 3:48). There were no significant differences within other trial groups (Appendices, Chapter 3, Table 3:47 and Table 3:49). Comparing respondents’ self-reported life satisfaction at the baseline to the 4-month survey, there was only a change among SCR IW respondents, who became less likely to have low life satisfaction (falling from 32% to 28%) . There were no significant differences among the other trial groups (Appendices, Chapter 3, Table 3: 50).
Table 3-15: Satisfaction with life (ONS1), by trial group
Trial group
| Satisfaction with life (ONS1) | SCR IW % | SCR OOW % | WMCA OOW % | Total % | p-value |
|---|---|---|---|---|---|
| No or little satisfaction | 28 | 32 | 29 | 30 | 0.024 |
| Neutral satisfaction | 39 | 37 | 39 | 38 | N/A |
| General or complete satisfaction | 33 | 31 | 32 | 32 | N/A |
| Base: | 1,476 | 1,960 | 1,926 | 5,362 | – |
Base: all 4-month survey respondents.
3.6. Barriers to employment
3.6.1. How health influences people’s readiness for work
All respondents who were not in employment at the time of the 4-month survey were asked how they felt their health affected their ability to return to work. The most common response in all trial groups was that ‘on some days’ they could think about returning to paid employment, reported by 48% of both the WMCA group and the SCR OOW group, compared to 39% of the SCR IW group. The SCR IW group respondents were correspondingly more likely to say their health problem ‘ruled out work’, reported by a quarter (24%) compared to 17% of the SCR OOW group and 15% of the WMCA group. Among all the different trial groups, slightly more than a third said that, despite their health problems, they could ‘consider returning to work right now’ (Table 3-16).
Table 3-16: How much health condition affects ability to return to work, by trial group
Trial group
| How much health condition affects ability to return to work | SCR IW % | SCR OOW % | WMCA OOW % | Total % | p-value |
|---|---|---|---|---|---|
| My health condition/disability rules out work as an option | 24 | 17 | 15 | 17 | 0.004 |
| On some days I could consider a return to work | 39 | 48 | 48 | 47 | N/A |
| I could consider returning to work right now | 36 | 35 | 37 | 36 | 0.758 |
| Base: | 209 | 1,475 | 1,496 | 3,180 | – |
Base: all respondents not in employment at the time of the 4-month survey who reported at least one health condition in the baseline data collection.
Comparing the treatment and control groups, across all trial groups, the treatment respondents were less likely to feel their health would prevent them returning to employment. In the SCR IW group, 31% of control group respondents felt their health ‘rules out work’ compared to 17% in the treatment group (Table 3-17). A similar pattern was seen for WMCA respondents, where 18% of the control group felt their health ruled out a return to work compared to 12% in the treatment group (Table 3-19). Among SCR OOW respondents there was no significant difference between the control and treatment groups in the proportion of people whose health ‘rules out work’, although the treatment group was more likely to feel ready to return to employment (38% compared with 33% in the control group) (Table 3-18).
Table 3-17: How much health condition affects ability to return to work, among the SCR IW group
SCR IW group
| How much health condition affects return to work (SCR IW group) | Treatment % | Control % | Total % | p-value |
|---|---|---|---|---|
| My health condition/disability rules out work as an option | 17 | 31 | 24 | 0.016 |
| On some days I could consider a return to work | 39 | 40 | 39 | N/A |
| I could consider returning to work right now | 45 | 29 | 36 | 0.021 |
| Base: | 104 | 105 | 209 | – |
Base: all SCR IW trial group respondents not in employment at the time of the 4-month survey who reported at least one health condition in the baseline data collection.
Table 3-18: How much health condition affects ability to return to work, among the SCR OOW trial group
SCR OOW group
| How much health condition affects return to work (SCR OOW trial group) | Treatment % | Control % | Total % | p-value |
|---|---|---|---|---|
| My health condition/disability rules out work as an option | 16 | 18 | 17 | 0.172 |
| On some days I could consider a return to work | 46 | 49 | 48 | N/A |
| I could consider returning to work right now | 38 | 33 | 35 | 0.048 |
| Base: | 773 | 702 | 1,475 | – |
Base: all SCR OOW trial group respondents not in employment at the time of the 4-month survey who reported at least one health condition in the baseline data collection.
Table 3-19: How much health condition affects ability to work, among the WMCA trial group
WMCA Combined Authority group
| How much health condition affects ability to work (SCR OOW trial group) | Treatment % | Control % | Total % | p-value |
|---|---|---|---|---|
| My health condition/disability rules out work as an option | 12 | 18 | 15 | 0.002 |
| On some days I could consider a return to work | 50 | 46 | 48 | N/A |
| I could consider returning to work right now | 37 | 36 | 37 | 0.553 |
| Base: | 775 | 721 | 1,496 | – |
Base: all WMCA respondents not in employment at the time of the 4-month survey who reported at least one health condition in the baseline data collection.
3.6.2. Barriers to finding work
All respondents in the 4-month survey were asked about a range of different barriers to finding work, either in the present or the past. The vast majority (85%) of respondents reported facing more than one barrier, with a majority of people in all trial groups reporting difficulty finding a suitable job, mental health problems, and a lack of confidence in their abilities and skills (Table 3-20). The most common reason selected by respondents in the SCR OOW and WMCA groups was difficulty finding a suitable job, reported by roughly three-quarters compared to 59% of people in the SCR IW group. Mental health was reported as a barrier by nearly two-thirds (64%) of SCR OOW respondents, 61% of the SCR IW respondents, and 55% of those in WMCA group. Lack of confidence in abilities and skills was noted by 61% of the SCR OOW group, 58% in the WMCA group and 56% in the SCR IW group (Table 3-20).
A lack of qualifications and experience was more common amongst those who were not in employment on joining the trial, i.e. the WMCA and the SCR OOW groups (57% in both groups), than SCR IW group (41%) . Having a physical health condition was also more common in these groups (52% of WMCA respondents and 50% of SCR OOW respondents) than in the SCR IW respondent group (42%) . Finally, transport problems as a barrier to work were reported by nearly half (47%) of WMCA respondents and 45% of SCR OOW respondents, compared to only 28% of SCR IW respondents (Table 3-20).
Across all trial groups, nearly 4 in 10 respondents reported that becoming financially worse off was a barrier to employment. Less common, but still reported by approximately 15% of respondents in all trial groups, were caring responsibilities (for example, for an elderly relation, disabled adult or child). Around one in 10 people across all trial groups said that a lack of childcare, or the cost of childcare, was a barrier to their moving into work. This should be seen in the context that around a quarter of respondents reported having dependent children at the baseline data collection (Table 3-20).
There were relatively few significant differences between the treatment and control groups in terms of how likely they were to report the different barriers to work. Where there were differences, the treatment group was more likely to report the barrier to finding work in question than the control group. This is counterintuitive, but it may be these groups are in some way more engaged in looking for work and so are more likely to report these barriers to moving into employment.
These differences were mainly in the SCR OOW group, where respondents from the treatment group were more likely to report a lack confidence in their abilities and skills (64% compared to 59% in the control group), a lack of qualifications/experience (60% compared to 54%) and being financially worse off (42% compared to 38%) (Table 3-22).
In the WMCA group, the only statistically significant difference between the treatment and control groups was in difficulty finding a suitable job. This was reported by 77% of treatment respondents compared to 73% of the control group (Table 3-23). Among SCR IW respondents there were no statistically significant differences between the treatment and control groups in the barriers to work they reported (Table 3-21).
Table 3-20: Barriers to work, by trial group
Trial group
| Barriers to work, by trial group | SCR IW % | SCR OOW % | WMCA OOW % | Total % | p-value |
|---|---|---|---|---|---|
| Difficulty finding a suitable job | 59 | 77 | 75 | 72 | 0.000 |
| Mental health condition | 61 | 64 | 55 | 60 | 0.000 |
| Lack of confidence in abilities or skills | 56 | 61 | 58 | 59 | 0.007 |
| Lack of qualifications or experience | 41 | 57 | 57 | 53 | 0.000 |
| Physical health condition | 42 | 50 | 52 | 48 | 0.000 |
| Availability or cost of transport to work | 28 | 45 | 47 | 41 | 0.000 |
| Being financially worse off | 38 | 40 | 37 | 39 | 0.137 |
| Caring for a child, or an elderly or disabled family member | 15 | 15 | 16 | 15 | 0.641 |
| Availability or cost of childcare | 9 | 10 | 11 | 10 | 0.550 |
| Personal circumstances (e.g. family difficulties, personal motivation) | 2 | 2 | 2 | 2 | N/A |
| Age related reasons | 2 | 2 | 2 | 2 | N/A |
| Other answer | 2 | 2 | 2 | 2 | N/A |
| Perceived stigmatisation or discrimination, or lack of understanding (from employers) | 2 | 2 | 3 | 2 | N/A |
| Lack of support and/or information | 1 | 1 | 1 | 1 | N/A |
| Not applicable | 8 | 1 | 1 | 3 | N/A |
| Nothing | 2 | 2 | 2 | 2 | N/A |
| Base: | 1,467 | 1,963 | 1,931 | 5,361 | – |
Base: all 4-month survey respondents.
Table 3-21: Barriers to work, among the SCR IW trial group
SCR IW group
| Barriers to work (SCR IW trial group) | Treatment % | Control % | Total % | p-value |
|---|---|---|---|---|
| Mental health condition | 62 | 59 | 61 | 0.197 |
| Difficulty finding a suitable job | 59 | 59 | 59 | 0.882 |
| Lack of confidence in abilities or skills | 57 | 55 | 56 | 0.430 |
| Physical health condition | 41 | 43 | 42 | 0.454 |
| Lack of qualifications or experience | 41 | 41 | 41 | 0.901 |
| Being financially worse off | 40 | 37 | 38 | 0.250 |
| Availability or cost of transport to work | 28 | 28 | 28 | 0.723 |
| Caring for a child, or an elderly or disabled family member | 14 | 15 | 15 | 0.570 |
| Availability or cost of childcare | 9 | 10 | 9 | 0.549 |
| Not applicable | 8 | 9 | 8 | N/A |
| Nothing | 3 | 2 | 2 | N/A |
| Age related reasons | 2 | 1 | 2 | N/A |
| Personal circumstances (e.g. family difficulties, personal motivation) | 2 | 2 | 2 | N/A |
| Perceived stigmatisation or discrimination, or lack of understanding (from employers) | 2 | 3 | 2 | N/A |
| Other answer | 2 | 2 | 2 | N/A |
| Lack of support and/or information | 1 | 2 | 1 | N/A |
| Base: | 784 | 683 | 1,467 | – |
Base: all SCR IW trial group 4-month survey respondents.
Table 3-22: Barriers to work, among the SCR OOW trial group
SCR OOW group
| Barriers to work (SCR OOW trial group) | Treatment % | Control % | Total % | p-value |
|---|---|---|---|---|
| Mental health condition | 65 | 63 | 64 | 0.225 |
| Lack of confidence in abilities or skills | 64 | 59 | 61 | 0.030 |
| Lack of qualifications or experience | 60 | 54 | 57 | 0.016 |
| Physical health condition | 50 | 50 | 50 | 0.876 |
| Availability or cost of transport to work | 47 | 44 | 45 | 0.163 |
| Being financially worse off | 42 | 38 | 40 | 0.049 |
| Caring for a child, or an elderly or disabled family member | 16 | 15 | 15 | 0.640 |
| Availability or cost of childcare | 10 | 11 | 10 | 0.651 |
| Personal circumstances (e.g. family difficulties, personal motivation) | 3 | 2 | 2 | N/A |
| Age related reasons | 2 | 2 | 2 | N/A |
| Other answer | 2 | 2 | 2 | N/A |
| Perceived stigmatisation or discrimination, or lack of understanding (from employers) | 2 | 2 | 2 | N/A |
| Not applicable | 1 | 1 | 1 | N/A |
| Nothing | 1 | 2 | 2 | N/A |
| Lack of support and/or information | 1 | 2 | 1 | N/A |
| Base: | 1,033 | 930 | 1,963 | – |
Base: all SCR OOW trial group 4-month survey respondents.
Table 3-23: Barriers to work, among the WMCA trial group
WMCA group
| Barriers to work (WMCA trial group) | Treatment % | Control % | Total % | p-value |
|---|---|---|---|---|
| Difficulty finding a suitable job | 77 | 73 | 75 | 0.046 |
| Lack of qualifications or experience | 59 | 56 | 57 | 0.178 |
| Lack of confidence in abilities or skills | 58 | 58 | 58 | 0.789 |
| Mental health condition | 55 | 54 | 55 | 0.673 |
| Physical health condition | 53 | 51 | 52 | 0.430 |
| Availability or cost of transport to work | 47 | 47 | 47 | 0.776 |
| Being financially worse off | 37 | 37 | 37 | 0.745 |
| Caring for a child, or an elderly or disabled family member | 16 | 16 | 16 | 0.625 |
| Availability or cost of childcare | 10 | 11 | 11 | 0.811 |
| Age related reasons | 3 | 2 | 2 | N/A |
| Perceived stigmatisation or discrimination, or lack of understanding (from employers) | 3 | 3 | 3 | N/A |
| Personal circumstances (e.g. family difficulties, personal motivation) | 2 | 2 | 2 | N/A |
| Other answer | 2 | 2 | 2 | N/A |
| Nothing | 1 | 2 | 2 | N/A |
| Not applicable | 1 | 1 | 1 | N/A |
| Lack of support and/or information | 1 | 2 | 1 | N/A |
| Base: | 1,000 | 931 | 1,931 | – |
Base: all WMCA 4-month survey respondents
3.6.3. Barriers to work at baseline and four months
The question about barriers faced in accessing work was asked in the baseline data collection and again in the 4-month survey, enabling changes to be detected.
In SCR, there were differences between the OOW and IW respondents. Among the SCR IW group, the only statistically significant difference between baseline and 4-month survey responses was in the proportion who reported mental health as a barrier to work, which fell from 65% to 61% (Table 3-24). This change was seen in both the control and treatment groups, suggesting that it was not a result of the trial support. In the SCR IW control group, the proportion who reported mental health as a barrier to work fell from 64% to 59% and in the treatment group from 67% to 62% (Table 3-25).
Among SCR OOW and WMCA respondents, the proportion who reported difficulty finding a suitable job as a barrier to work fell between the baseline to the 4-month survey; from 83% to 77% for the SCR OOW group, and among WMCA respondents from 83% to 75% (Table 3-26 and Table 3-27). When looking separately within the treatment and control groups, a similar fall was seen. Among the SCR OOW control group, 83% of respondents at baseline said difficulty finding a suitable job was a barrier to work compared to 76% at the 4-month survey. In the treatment group, 83% of respondents at baseline reported difficulty finding a suitable job was a barrier to work, which fell to 78% at the 4-month survey (Table 3-26). A similar difference was observed among WMCA respondents in the control and treatment groups (Table 3-27). This again suggests that the fall was not as a result of the IPS support.
Amongst the SCR OOW respondent group, there was a fall in the proportion noting that providing care for a child or elderly/disabled adult was a barrier to work, from 18% to 15 per cent. There was no similar difference in the other two trial groups (Table 3-26).
In the SCR OOW and WMCA respondent groups, two barriers to work became more prevalent. These were the availability or cost of transport to work and being financially worse off. Looking at the availability and cost of transport to work, in the SCR OOW group, 38% of respondents at baseline reported this was a barrier to work, and this increased to 45% at the 4-month survey. Similarly, among WMCA respondents, the proportion reporting transport related difficulties as a barrier to work rose from 38% to 47% (Table 3-27). This increase was present in both the control and treatment groups in both sites (Table 3-27). Turning to the proportion of respondents who said they would be financially worse off if they moved into work, among the WMCA group this was reported by 25% at baseline and 37% at the 4-month survey. Similarly, the proportion who reported that being financially worse off was a barrier to moving into work rose from 27% to 40% among SCR OOW respondents between baseline and the 4-month surveys (Table 3-26). Again, this increase was seen in both the treatment and control groups, suggesting that it was not a result of IPS support (Table 3-27).
It is not clear why a greater proportion of respondents reported these barriers at the 4-month survey than in the baseline data collection. That a similar increase took place in both the control and treatment groups suggests it is not related to the IPS support. It may be that as respondents spent more time looking for work, they began to identify with such barriers. For example, those looking for jobs may have found that a lack of suitable transport negated applying for certain roles. In the same way, as they became more familiar with how the benefit system would respond if they worked more hours, they realised that this may result in being financially worse off.
Table 3-24: Barriers to work at baseline and 4-month surveys, by trial group
Trial group
| Barriers to work | SCR IW: baseline % | SCR IW: interim % | p-value | SCR OOW: baseline % | SCR OOW: interim % | p-value | WMCA OOW: baseline % | WMCA OOW: interim % | p-value |
|---|---|---|---|---|---|---|---|---|---|
| Difficulty finding a suitable job | 61 | 59 | 0.318 | 83 | 77 | 0.000 | 83 | 75 | 0.000 |
| Availability or cost of transport to work | 26 | 28 | 0.083 | 38 | 45 | 0.000 | 38 | 47 | 0.000 |
| Availability or cost of childcare | 10 | 9 | 0.640 | 10 | 10 | 0.181 | 10 | 11 | 0.645 |
| Lack of qualifications or experience | 41 | 41 | 1.000 | 55 | 57 | 0.038 | 58 | 57 | 0.616 |
| Lack of confidence in abilities or skills | 56 | 56 | 0.755 | 59 | 61 | 0.167 | 59 | 58 | 0.639 |
| Physical health condition | 44 | 42 | 0.077 | 49 | 50 | 0.484 | 54 | 52 | 0.075 |
| Mental health condition | 65 | 61 | 0.001 | 66 | 64 | 0.155 | 56 | 55 | 0.230 |
| Caring for a child, or an elderly or disabled family member | 15 | 15 | 0.687 | 18 | 15 | 0.002 | 17 | 16 | 0.320 |
| Being financially worse off | 35 | 38 | 0.052 | 27 | 40 | 0.000 | 25 | 37 | 0.000 |
| Another reason | 12 | 2 | N/A | 10 | 2 | N/A | 12 | 2 | N/A |
| Nothing | 1 | 8 | N/A | * | 1 | N/A | * | 1 | N/A |
| Not applicable | 2 | 8 | N/A | * | 9 | N/A | * | 10 | N/A |
| Base: | 1,467 | 1,467 | 1,979 | 1,963 | 1,940 | 1,931 | – |
Base: all 4-month survey respondents.
Table 3-25: Barriers to work at baseline and 4-month surveys, among the SCR IW trial group
| Barriers to work (SCR IW trial group) | Control: Baseline % | Control: Interim % | p-value | Treatment: Baseline % | Treatment: Interim % | p-value |
|---|---|---|---|---|---|---|
| Difficulty finding a suitable job | 60 | 59 | 0.659 | 61 | 59 | 0.359 |
| Availability or cost of transport to work | 28 | 28 | 0.617 | 24 | 28 | 0.058 |
| Availability or cost of childcare | 11 | 10 | 0.712 | 9 | 9 | 0.888 |
| Lack of qualifications or experience | 40 | 41 | 0.466 | 42 | 41 | 0.480 |
| Lack of confidence in abilities or skills | 56 | 55 | 0.703 | 57 | 57 | 1.000 |
| Physical health condition | 45 | 43 | 0.518 | 44 | 41 | 0.077 |
| Mental health condition | 64 | 59 | 0.023 | 67 | 62 | 0.027 |
| Caring for a child, or an elderly or disabled family member | 16 | 15 | 0.637 | 14 | 14 | 1.000 |
| Being financially worse off | 35 | 37 | 0.318 | 36 | 40 | 0.095 |
| Another reason | 12 | 2 | N/A | 12 | 3 | N/A |
| Nothing | 1 | 9 | N/A | 1 | 8 | N/A |
| Not applicable | 2 | 9 | N/A | 1 | 7 | N/A |
| Base: | 683 | 683 | – | 784 | 784 | – |
Base: all 4-month survey respondents in the SCR IW trial group.
Table 3-26: Barriers to work at baseline and 4-month surveys, among the SCR OOW trial group
| Barriers to work (SCR OOW trial group) | Control: Baseline % | Control: Interim % | p-value | Treatment: Baseline % | Treatment: Interim % | p-value |
|---|---|---|---|---|---|---|
| Difficulty finding a suitable job | 83 | 76 | 0.000 | 83 | 78 | 0.002 |
| Availability or cost of transport to work | 37 | 44 | 0.000 | 40 | 47 | 0.000 |
| Availability or cost of childcare | 9 | 11 | 0.033 | 10 | 10 | 0.912 |
| Lack of qualifications or experience | 55 | 54 | 1.000 | 54 | 60 | 0.002 |
| Lack of confidence in abilities or skills | 59 | 59 | 1.000 | 60 | 64 | 0.055 |
| Physical health condition | 49 | 50 | 0.692 | 49 | 50 | 0.599 |
| Mental health condition | 63 | 63 | 0.790 | 68 | 65 | 0.092 |
| Caring for a child, or an elderly or disabled family member | 18 | 15 | 0.020 | 18 | 16 | 0.055 |
| Being financially worse off | 27 | 38 | 0.000 | 27 | 42 | 0.000 |
| Another reason | 9 | 2 | N/A | 11 | 1 | N/A |
| Nothing | 1 | 1 | N/A | * | 1 | N/A |
| Not applicable | * | 9 | N/A | 0 | 10 | N/A |
| Base: | 933 | 930 | – | 1,046 | 1,033 | – |
Base: all 4-month survey respondents in the SCR OOW trial group.
Table 3-27: Barriers to work at baseline and 4-month surveys, among the WMCA trial group
| Barriers to work (WMCA trial group) | Control: Baseline % | Control: Interim % | p-value | Treatment: Baseline % | Treatment: Interim % | p-value | |
|---|---|---|---|---|---|---|---|
| Difficulty finding a suitable job | 82 | 73 | 0.000 | 84 | 77 | 0.000 | |
| Availability or cost of transport to work | 38 | 47 | 0.000 | 39 | 47 | 0.000 | |
| Availability or cost of childcare | 10 | 11 | 0.362 | 11 | 10 | 0.917 | |
| Lack of qualifications or experience | 57 | 56 | 0.362 | 59 | 59 | 0.912 | |
| Lack of confidence in abilities or skills | 58 | 58 | 1.000 | 60 | 58 | 0.499 | |
| Physical health condition | 53 | 51 | 0.198 | 54 | 53 | 0.273 | |
| Mental health condition | 56 | 54 | 0.275 | 56 | 55 | 0.637 | |
| Caring for a child, or an elderly or disabled family member | 17 | 16 | 0.518 | 16 | 16 | 0.447 | |
| Being financially worse off | 24 | 37 | 0.000 | 26 | 37 | 0.000 | |
| Another reason | 11 | 2 | N/A | 14 | 1 | N/A | |
| Nothing | * | 1 | N/A | 0 | 1 | N/A | |
| Not applicable | * | 10 | N/A | * | 10 | N/A | |
| Base: | 935 | 931 | – | 1,005 | 1,000 | – |
Base: all 4-month survey respondents in the WMCA trial group.
3.6.4. The most important barrier to work
To further understand reported barriers, when respondents selected multiple barriers to work, they were asked to identify their ‘most important’ barrier. These have been combined with the responses of people who selected only one barrier to work to provide a summary of which barriers to working respondents felt were the most significant. The most commonly reported barrier in all trial groups was mental health, reported by 25% of SCR OOW respondents, 22% of SCR IW respondents and 20% of WMCA respondents. The second most important barrier was physical health, identified by 20% of WMCA respondents, 18% of SCR OOW respondents and 16% of SCR IW respondents. This suggests that addressing the health problems of trial recruits is crucial to moving many into work (Table 3-28). As noted in section 3.3.1, when asked how they felt about returning to work given their health problems, 15% of WMCA respondents, 24% of SCR IW respondents and 17% of SCR OOW respondents said that their health ruled out work as an option (Table 3-16).
The next two ‘most important’ barriers identified, were difficulty finding a suitable job (reported by 17% of WMCA respondents, 14% of SCR OOW respondents and 11% of SCR IW respondents) and a lack of confidence in skills and abilities (reported by 14% of SRW IW respondents, 12% of SCR OOW respondents, and 9% of WMCA respondents).
Table 3-28: Most important barrier to work, by trial group
Trial group
| Most important barrier to work, by trial group | SCR IW % | SCR OOW % | WMCA OOW % | Total % | p-value |
|---|---|---|---|---|---|
| Difficulty finding a suitable job | 11 | 14 | 17 | 14 | 0.000 |
| Availability or cost of transport to work | 2 | 4 | 4 | 3 | N/A |
| Availability or cost of childcare | 2 | 2 | 2 | 2 | N/A |
| Lack of qualifications or experience | 8 | 9 | 12 | 10 | 0.003 |
| Lack of confidence in abilities or skills | 14 | 12 | 9 | 11 | 0.000 |
| Physical health condition | 16 | 18 | 20 | 18 | 0.004 |
| Mental health condition | 22 | 25 | 20 | 22 | 0.001 |
| Caring for a child, or an elderly or disabled family member | 2 | 3 | 3 | 3 | N/A |
| Being financially worse off | 5 | 3 | 4 | 4 | N/A |
| Another reason | 6 | 8 | 8 | 8 | N/A |
| None | 3 | 2 | 2 | 2 | N/A |
| Not applicable | 8 | 1 | 1 | 3 | 0.000 |
| Base: | 1,439 | 1,912 | 1,887 | 5,238 | – |
Base: all 4-month survey respondents.
3.7. Perceptions of IPS support
This section reports attitudes to the IPS support amongst respondents allocated to the treatment group. It draws on a series of questions about their employment specialists’[footnote 9] skills and expertise and how well they understood individuals’ needs, how the support helped respondents with their health problems and whether the intervention was helpful to their management of their health conditions and disabilities. Respondents were also asked about how effectively the trial prepared them to return to work, including any effect on their confidence in their skills and abilities and motivation to work.
Along with the comparisons drawn between the various trial groups, respondents’ views are also analysed to see how they differ by their health, mental wellbeing, life satisfaction and educational level. Respondent health is measured by how much their health condition or disability limited their everyday activities. The indicator for life satisfaction is based on the ONS 1-10 scale of how satisfied people are with their life (described in section 3.3.5), with responses grouped into low, medium and high life satisfaction. Mental wellbeing is assessed using the Short Warwick Edinburgh Mental Wellbeing Scale, grouping people into low, neutral, or high mental wellbeing. Finally, people’s educational level is decided based on the highest qualification they hold, grouping people into those with:
- no formal qualifications
- qualifications up to GCSEs of D-G grade or equivalent
- qualifications up to A-levels or equivalent
- degree level qualifications and above
3.7.1. Employment specialist
This section explores views of the employment specialist across various dimensions including their understanding and skill set.
Employment specialist’s understanding of needs
A majority of respondents receiving IPS support in all trial groups were positive about the employment specialist’s understanding of their needs, although those in the SCR groups were more likely to say the specialist understood their needs ‘a lot’ than in the WMCA intervention. Among the SCR IW treatment group, 82% of respondents said the employment specialist understood their needs ‘a lot’, as did 76% of people in the SCR OOW treatment group, compared to 62% in the WMCA treatment group (Table 3-29).
Table 3-29: How much employment specialist understood people’s needs, by trial group
Trial group
| How much employment specialist understood people’s needs, by trial group | SCR IW % | SCR OOW % | WMCA OOW % | Total % | p-value |
|---|---|---|---|---|---|
| Not at all | 2 | 4 | 8 | 5 | N/A |
| A little | 16 | 20 | 30 | 22 | N/A |
| A lot | 82 | 76 | 62 | 73 | 0.000 |
| Base: | 773 | 1,024 | 975 | 2,772 | – |
Base: all 4-month survey respondents in the treatment group.
Who was more likely to feel employment specialists understood their needs?
- in the SCR OOW and WMCA treatment groups, respondents whose health limited their everyday activities less were more likely to say the employment specialist understood their needs.
- across all trial groups in the survey, those with higher life satisfaction and mental wellbeing reported that the specialist understood their needs better. There were no significant differences by education.
Health
Respondents with less serious health problems, measured by how much their health affected their everyday activities, were more likely to feel that the employment specialist understood their needs ‘a lot’, among both the SCR OOW group and the WMCA group. Among SCR OOW treatment group respondents whose everyday activities were affected ‘a little’ or ‘not at all’ by their health problems, 82% reported the employment specialist understood their needs ‘a lot’ compared to 70% among people whose everyday activities were affected a great deal. Similarly, among WMCA respondents 71% of people whose everyday activities were affected a little or not at all felt their employment specialist understood their needs ‘a lot’, compared to 55% of those whose everyday activities were affected ‘a great deal’. There was a similar difference among SCR IW respondents, although it was not statistically significant (Appendices, Chapter 3, Table 3:57-Table 3:59).
Life satisfaction and mental wellbeing
Higher life satisfaction and mental wellbeing were also associated with respondents having a more positive perception of how well the employment specialist understood their needs (Appendices, Chapter 3, Table 3:60-Table 3:65). For example, among respondents in the SCR IW treatment group, 73% with low life satisfaction said the employment specialist understood their needs ‘a lot’, compared to 89% among those generally or completely satisfied with life (Appendices, Chapter 3, Table 3:60). Turning to mental wellbeing, among WMCA respondents 54% of those with low mental wellbeing reported that the employment specialist understood their needs ‘a lot’ compared to 85% of those with high mental wellbeing (Appendices, Chapter 3, Table 3:65). There were similar, statistically significant differences in the other two trial groups by both life satisfaction and mental wellbeing.
Education
When level of education was explored, no statistically significant patterns were seen in any trial group and there did not seem to be consistent differences, by highest qualification held, in how well respondents in the treatment groups felt the employment specialist understood their needs (Appendices, Chapter 3, Table 3:6 5-Table 3:68). For example, among SCR IW treatment respondents, 82% of people with a degree level qualification or higher and 83% of people with A-level or equivalent qualifications felt their employment specialist understood their needs ‘a lot’. This proportion fell to 69% of people with GCSEs at D-G grade but rose again to 85% among those with no qualifications (Appendices, Chapter 3, Table 3:66). Similar patterns by education were seen in the other trial groups (Appendices, Chapter 3, Table 3:67-Table 3:68).
Employment specialist skills
Respondents’ attitudes towards the employment specialists’ skills and expertise reflected the above findings. A majority of treatment respondents across all groups agreed that the specialist had the right skills and expertise to support them. However, respondents in the SCR IW group were most likely to say that they thought the specialist had the right skills and expertise ‘a lot’, reported by 82% compared to 77% of the SCR OOW group and 67% of the WMCA group (Table 3-30).
Table 3-30: To what extent the employment specialist has the right skills and expertise to help respondents, by trial group
Trial group
| Extent the employment specialist has right skills and expertise to help respondents, by trial group | SCR IW % | SCR OOW % | WMCA OOW % | Total % | p-value |
|---|---|---|---|---|---|
| Not at all | 4 | 4 | 7 | 5 | N/A |
| A little | 15 | 19 | 26 | 20 | N/A |
| A lot | 82 | 77 | 67 | 75 | 0.000 |
| Base: | 769 | 1,012 | 954 | 2,735 | – |
Base: all 4-month survey respondents in the treatment group.
Who was more likely to feel employment specialists had the right skills and expertise?
- across all trial groups, treatment group respondents who reported higher life satisfaction and mental wellbeing were more likely to think the employment specialist had the right skills and expertise. Health-led Employment Trials Evaluation: Four-month outcomes report 105
- those with less severe health problems were also more likely to have a favourable view of the specialist’s knowledge, although this difference was only statistically significant in the SCR IW and the WMCA trial groups.
- among SCR OOW and WMCA respondents there were statistically significant differences by education in how positively respondents viewed their specialist’s skills and expertise.
- however, there was no clear pattern in these differences in terms of whether holding lower or higher qualifications was associated with respondents’ view of the specialist.
Health
In the SCR IW group, respondents whose health affected their everyday activities a great deal were least likely to think ‘a lot’ that the specialist had the right skills and expertise. This was reported by 74% compared to 83% of respondents whose everyday activities were affected a little or not at all (Appendices, Chapter 3, Table 3:69). Among WMCA respondents whose everyday activities were affected a great deal, 59% of respondents agreed ‘a lot’ that the employment specialist had the right skills and experience, compared to 74% of respondents affected a little or not at all by their health problem (Appendices, Chapter 3, Table 3:71). There was a similar pattern among the SCR OOW group although the difference was not statistically significant (Appendices, Chapter 3, Table 3:70).
Life satisfaction and mental wellbeing
High life satisfaction and high mental wellbeing were associated with respondents having positive attitudes towards the employment specialist, across all trial groups. Among treatment respondents in the SCR IW group, 87% of those with high life satisfaction agreed ‘a lot’ that the specialist had the right skills and experience, compared to 74% of those with low life satisfaction (Appendices, Chapter 3, Table 3:72). This pattern was repeated across both the SCR OOW and WMCA trial groups (Appendices, Chapter 3, Table 3:73-Table 3:74). To give an example of the trend by mental wellbeing, among SCR OOW respondents 88% of those with high mental wellbeing felt strongly that the employment specialist had the right skills and expertise comparted to 73% of respondents with low mental wellbeing. This pattern was repeated among SCR IW respondents and WMCA respondents (Appendices, Chapter 3, Table 3:75-Table 3:77).
Education
The pattern by respondents’ highest qualification was mixed and varied between the trial groups. It was significantly related to respondents’ assessment of the specialist’s skills and expertise among SCR OOW and WMCA respondents, but not among SCR IW respondents (Appendices, Chapter 3, Table 3:78-Table 3:80). Among SCR OOW respondents, those with no formal qualifications were most likely to agree ‘a lot’ that the specialist had the right skills and experience, reported by 87% compared to 71% of people with GCSEs of D-G grade, 77% of people with A-levels or equivalents, and 71% of respondents with a degree equivalent or above (Appendices, Chapter 3, Table 3:79).
This pattern was not repeated among WMCA respondents. In this group, 60% of those with no formal qualifications said they felt strongly that the employment specialist had the right skills and experience, similar to the proportion of respondents with a degree level qualification or higher (58%) . Those with qualifications at A-level grade or equivalent and GCSEs of D-G grade were most likely to report agreeing ‘a lot’ that the employment specialist had the right skills and experience (70% and 74% respectively) (Appendices, Chapter 3, Table 3:80).
3.7.2. Helpfulness of the support in managing health conditions and disabilities
A majority of respondents in the treatment group said the intervention helped their ability to manage their health condition or disability; across all groups less than 10% felt it had been unhelpful. Of the three trial groups, the SCR IW group and SCR OOW group were more likely to have found the support helpful than WMCA respondents. Among SCR IW respondents, 71% found the support helpful, as did 69% of SCR OOW respondents, compared to 63% in the WMCA group (Table 3-31).
Table 3-31: How much the intervention has helped people to manage their health condition/disability, by trial group
Trial group
| How much the intervention has helped people to manage their health condition/disability, by trial group | SCR IW % | SCR OOW % | WMCA OOW % | Total % | p-value |
|---|---|---|---|---|---|
| Quite helpful* | 32 | 32 | 36 | 33 | N/A |
| Neither helpful nor unhelpful | 20 | 24 | 28 | 24 | N/A |
| Quite unhelpful | 4 | 4 | 4 | 4 | N/A |
| Very unhelpful | 4 | 3 | 5 | 4 | N/A |
| Base: | 782 | 1,020 | 979 | 2,781 | – |
Base: all 4-month survey respondents in the treatment group. *Significance test run on ‘very helpful’ and ‘quite helpful’ categories combined.
Who was more likely to find the support helpful in managing their health?
- in all the trial groups, treatment group respondents less affected by their health, those with higher life satisfaction, and those with greater mental wellbeing were more likely to report the support helped their ability to manage their health conditions and disabilities.
- among SCR OOW respondents and WMCA respondents (but not the SCR IW group), those with lower levels of qualifications or no formal qualifications were also more likely to find the support more helpful in this area.
Health
Respondents whose health limited their ability to carry out their everyday activities less were consistently more likely to find IPS supportive to their ability to manage their health. Among respondents in the SCR IW group whose health limited their everyday activities a little or not at all, 80% found the intervention helpful compared to two-thirds (66%) of those whose health limited them a great deal (Appendices, Chapter 3, Table 3:81). There was a similar pattern among the other trial groups (Appendices, Chapter 3, Table 3:82-Table 3:83).
Life satisfaction and mental wellbeing
Higher life satisfaction and mental wellbeing were also associated with respondents in the treatment groups being more likely to report the support had been helpful in making them able to manage their health (Appendices, Chapter 3, Table 3:84-Table 3:89). For example, among SCR OOW respondents with high life satisfaction, nearly four-fifths (79%) said the support had been helpful, compared to 56% of people with low life satisfaction. Among those with low life satisfaction the proportion who found the support unhelpful was still quite low, with 6% finding it quite unhelpful and 3% very unhelpful (Appendices, Chapter 3, Table 3:85). To give an example by mental wellbeing, among those WMCA respondents with high mental wellbeing, 86% found the support helpful for their ability to manage their health problems compared to 54% of those with low mental wellbeing (Appendices, Chapter 3, Table 3:89). These differences were consistent across all trial groups (Appendices, Chapter 3, Table 3:87-Table 3:89).
Education
Respondents in the treatment group who held higher level qualifications seemed to find the support less helpful in managing their health problems than those with lower level qualifications. This pattern was not consistent and there was no statistically significant difference in the proportion who found the support helpful among the SCR IW group (Appendices, Chapter 3, Table 3:90). In the SCR OOW group, 79% of respondents with no formal qualifications found the support helpful, compared to 70% of respondents with qualifications up to GCSEs of grade D-G, 69% of those with qualifications up to A-levels, and 60% of those with a degree level qualification (Appendices, Chapter 3, Table 3:91).
In the WMCA group, 69% of those with no formal qualifications and 74% of those with GCSEs at D-G grade found the support helpful, compared to 60% of respondents with qualifications at up to A-Level and 57% of those with degree level qualifications (Appendices, Chapter 3, Table 3:92).
3.7.3. Work adaptations to manage health at work
The majority of respondents reported that they found the support helpful in identifying adaptations they could make at work to more effectively manage the challenges they experienced. SCR IW respondents in the treatment group were more likely to find it helpful - 65% of these respondents reported this compared to 59% in the SCR OOW and 57% of WMCA respondents who were in employment at the time of the 4-month survey. In no trial group did more than 10% of people find the support unhelpful in this area (Table 3-32).
Table 3-32: How much the support helped people identify work adaptations to enable them to better manage their health condition at work, by trial group
Trial group
| How much support helped people identify work adaptations to enable them to better manage their health condition at work, by trial group | SCR IW % | SCR OOW % | WMCA OOW % | Total % | p-value |
|---|---|---|---|---|---|
| Very helpful* | 32 | 28 | 23 | 27 | 0.004 |
| Quite helpful* | 33 | 30 | 34 | 32 | N/A |
| Neither helpful nor unhelpful | 28 | 34 | 33 | 32 | N/A |
| Quite unhelpful | 4 | 4 | 5 | 4 | N/A |
| Very unhelpful | 3 | 3 | 5 | 4 | N/A |
| Base: | 747 | 961 | 917 | 2,625 | – |
Base: all 4-month survey respondents in the treatment group. *Significance test run on ‘very helpful’ and ‘quite helpful’ categories combined.
Who was more likely to find the support helpful in identifying work adaptations?
- across the treatment trial groups, respondents with higher life satisfaction and mental wellbeing were more likely to find the support helpful in identifying work adaptations.
- in the SCR OOW and WCMA groups, respondents less affected by their health were more likely to say that the support had been helpful in identifying adaptations they could make at work to help them manage their health.
- there were significant differences among the WMCA and SCR OOW trial groups, which suggested respondents with higher level qualifications were less likely to report finding the support helpful than those who held lower level qualifications.
Health
In the SCR OOW and the WMCA groups, treatment group respondents whose health limited their everyday activities less were more likely to report that the support helped identify adaptations in the workplace. Among SCR OOW respondents whose health only affected their everyday activities a little or not at all, two-thirds (67%) found the IPS support helpful, compared to 49% of people whose everyday activities were affected a great deal (Appendices, Chapter 3, Table 3:94). Similarly, 65% of WMCA respondents whose everyday activities were limited only a little by their health found the IPS support was helpful, compared to 48% of those who had their activities restricted a great deal by their health (Appendices, Chapter 3, Table 3:95).
Life satisfaction and mental wellbeing
Greater life satisfaction and mental wellbeing was also positively associated with finding the support helpful to identify work adaptations. In terms of mental wellbeing, 82% of WMCA respondents with high mental wellbeing found the support had been helpful, compared to 49% of those with low mental wellbeing (Appendices, Chapter 3, Table 3:101). Among WMCA respondents with high life satisfaction 71% said the support had been very helpful to identify work adaptations, compared to 42% with low life satisfaction (Appendices, Chapter 3, Table 3:98).
Education
How helpful treatment group respondents found the intervention in identifying adaptations to make at work also varied by education. Overall, this pattern seemed to show that respondents with lower-level qualifications were more likely to find it helpful, although this pattern was clearer in the SCR OOW group (there was no significant difference in the SCR IW group) (Appendices, Chapter 3, Table 3:103). In the SCR OOW group, those with no formal qualifications were most likely to find the IPS support helpful to identify adaptations at work to manage their health. Slightly more than two-thirds (68%) of respondents with no qualifications reported this, compared with 66% of those with qualifications at up to GCSE D-G grade, 58% of those with qualifications at up to A-level or equivalents, and fewer than half (48%) of those with degree level qualifications or higher (Appendices, Chapter 3, Table 3:103).
The pattern among WCMA respondents was less clear. Slightly more than half (54%) of those with no formal qualifications reported the support had helped them to identify work adaptations to manage their health, while 67% of those with qualifications at GCSE level (grades D-G) found it helpful. This fell to 58% among respondents with A-levels or equivalents and 49% among those with a degree level qualification or above. While those with the highest levels of education remained least likely to find the support helpful, there was not a clear trend among the other educational levels (Appendices, Chapter 3, Table 3:104).
3.7.4. Referral to other health support
A majority of treatment group respondents in all trial groups reported finding the IPS intervention helpful in informing them about other sources of support for their health conditions or disabilities. Amongst the SCR IW treatment group, 74% of respondents found the support helpful, compared to 69% of SCR OOW respondents and 56% of WMCA respondents (Table 3-33). At the other end of the scale, 6% of SCR IW respondents, 7% of SCR OOW respondents and 13% of WMCA respondents found the support unhelpful.
Table 3-33: How helpful the support has been in informing people about other sources of health support, by trial group
Trial group
| How helpful the support has been in informing people about other sources of health support, by trial group | SCR IW % | SCR OOW % | WMCA OOW % | Total % | p-value |
|---|---|---|---|---|---|
| Very helpful* | 42 | 38 | 25 | 34 | 0.000 |
| Quite helpful* | 32 | 31 | 31 | 32 | N/A |
| Neither helpful nor unhelpful | 20 | 24 | 31 | 25 | N/A |
| Quite unhelpful | 4 | 4 | 6 | 5 | N/A |
| Very unhelpful | 3 | 3 | 7 | 4 | N/A |
| Base: | 766 | 1,018 | 970 | 2,754 | – |
Base: all 4-month survey respondents in the treatment group. *Significance test run on ‘very helpful’ and ‘quite helpful’ categories combined.
Who was more likely to find the support helpful in referring them to other sources of health support?
- among the SCR OOW and WCMA respondents, those who were healthier and with higher life satisfaction were more likely to find the support helpful in referring them to other forms support for their health.
- WMCA respondents with greater mental wellbeing were also more likely to find the support helpful.
- in both SCR OOW and WMCA respondent groups, respondents with higher levels of education were also less likely to find the support helpful, although this pattern was not consistent, particularly among WMCA respondents.
Health
Amongst the OOW groups, respondents whose health affected their everyday activities less were more likely to say the support had been helpful in informing them about other sources of health support. Nearly two-thirds (65%) of WMCA respondents whose health problems affect their everyday activities a little or not at all found the support had been helpful in referring them to other sources of support for their health, compared to 46% of those whose activities were affected a great deal by their health (Appendices, Chapter 3, Table 3:107). Similarly, among SCR OOW respondents the difference was 75% compared to 63% (Appendices, Chapter 3, Table 3:106). Among the SCR IW group there was no significant difference by how much people’s health is affected their everyday activities (Appendices, Chapter 3, Table 3:105).
Life satisfaction and mental wellbeing
For the OOW trial groups, higher life satisfaction was associated with respondents being more likely to find the support helpful in referring them to other health support (Appendices, Chapter 3, Table 3:108-Table3:110). In the SCR OOW group, 75% of treatment group respondents with high life satisfaction reported that support had been helpful, compared with 59% of those who had low life satisfaction. Similarly, two-thirds (67%) of WMCA respondents with high life satisfaction found the support helpful compared to 44% of those with low life satisfaction.
Reporting higher mental wellbeing was also associated with being likely to find the support helpful in referring respondents to other health support. This difference was only significant among WMCA respondents. In the WMCA respondent group, 77% of those with high mental wellbeing reported the support had been helpful in this way compared to 50% of those with low mental wellbeing (Appendices, Chapter 3, Table 3:113). The same pattern could be seen in the SCR groups, but the differences were not statistically significant (Appendices, Chapter 3, Table 3:111-Table 3:112).
Education
Treatment group respondents with higher levels of education seemed to be less likely to find the support helpful in referring them to other forms of health support. In the SCR OOW group, three-quarters (76%) of those with no formal qualifications reported finding the support helpful, 74% of those with qualifications at D-G grade, 70% of those with qualifications up to A-level equivalents and 59% of those with degree level or higher qualifications (Appendices, Chapter 3, Table 3:115). Among WMCA respondents, 47% of respondents with a degree or higher found the support helpful, compared to 57% of respondents with no formal qualifications, 66% with qualifications up to GCSE D-G grade, and 56% of those with qualifications up to A-level (Appendices, Chapter 3, Table 3:116). This suggested that those with degree level qualifications or higher were less likely to find the support useful, although the pattern was clear between the other qualification groups. There was no statistically significant difference in the SCR IW trial group (Appendices, Chapter 3, Table 3:114).
3.8. How much support helped people to return to work
3.8.1. Confidence in skills
A majority of treatment group respondents reported that the support had been helpful for their confidence in their skills, with three-quarters (75%) of both SCR groups and 67% of WMCA respondents reporting they found the support helpful. Around a fifth (across all groups) reported that the support had been neither helpful nor unhelpful, and not more than 10% reported that it had been unhelpful (Table 3-34).
Who was more likely to find the support helpful in increasing their confidence in their skills?
- across all trial groups, healthier respondents in the treatment group, and those with greater life satisfaction and better mental wellbeing, were all more likely to find the support helpful for their confidence in their own skills and abilities.
- education, however, was not a statistically significant predictor of respondents reporting favourable views of the support in this area.
Table 3-34: How helpful the support received was for people’s confidence in their skills, by trial group
Trial group
| How helpful the support has been in informing people about other sources of health support, by trial group | SCR IW % | SCR OOW % | WMCA OOW % | Total % | p-value |
|---|---|---|---|---|---|
| Very helpful* | 38 | 37 | 28 | 34 | 0.000 |
| Quite helpful* | 37 | 38 | 39 | 38 | N/A |
| Neither helpful nor unhelpful | 19 | 19 | 23 | 20 | N/A |
| Quite unhelpful | 3 | 4 | 6 | 4 | N/A |
| Very unhelpful | 3 | 3 | 4 | 3 | N/A |
| Base: | 778 | 1,026 | 971 | 2,775 | – |
Base: all 4-month survey respondents in the treatment group. *Significance test run on ‘very helpful’ and ‘quite helpful’ categories combined.
Health
Across all trial groups, treatment group respondents with less severe health problems were more likely to say the support had been very helpful in increasing their confidence in their skills. For example, in the SCR IW group, 81% of those whose health affected their abilities only ‘a little’ or ‘not at all’ found the support helpful, compared to 70% of people whose everyday activities were affected ‘a lot’. There was a similar pattern in the other two trial groups (Appendices, Chapter 3, Table 3:118-Table 3:119).
Life satisfaction and mental wellbeing
Again, respondents with higher life satisfaction and those with greater mental wellbeing were more likely to find the support helpful in increasing their confidence in their own skills. Among WMCA respondents with high life satisfaction, 81% reported the support had helped them compared to 54% of respondents with little or no life satisfaction. Similarly, for mental wellbeing, nearly 9 in 10 (87%) of WMCA respondents with high mental wellbeing found the support helpful compared to 58% of those with low mental wellbeing. These patterns were repeated among the other trial groups (Appendices, Chapter 3, Table 3:120-Table 3:121).
Education
Finally, there were no statistically significant differences by the highest qualification held in how likely respondents were to find the support helped them to have confidence in their abilities (Appendices, Chapter 3, Table 3:126-Table 3:128).
3.8.2. Deciding on the type of work they want to do
Around three-quarters of SCR IW and OOW treatment group respondents found the support helpful in deciding what type of work they would like to do (72% among SCR IW respondents and 75% among SCR OOW respondents). In contrast, two-thirds (67%) of WMCA respondents reported finding the support helpful. Across all respondent groups, roughly one-fifth in the survey found the support neither helpful nor unhelpful, and between 7% and 12% found the support unhelpful (Table 3-35).
Table 3-35: How helpful the support received has been for people’s ability to decide on the type of job they want, by trial group
Trial group
| How helpful support received has been for people’s ability to decide on the type of job they want, by trial group | SCR IW % | SCR OOW % | WMCA OOW % | Total % | p-value |
|---|---|---|---|---|---|
| Very helpful* | 37 | 39 | 32 | 36 | 0.001 |
| Quite helpful* | 35 | 36 | 35 | 35 | N/A |
| Neither helpful nor unhelpful | 21 | 19 | 21 | 20 | N/A |
| Quite unhelpful | 4 | 4 | 7 | 5 | N/A |
| Very unhelpful | 3 | 3 | 5 | 4 | N/A |
| Base: | 765 | 1,019 | 977 | 2,761 | – |
Base: all 4-month survey respondents in the treatment group. *Significance test run on ‘very helpful’ and ‘quite helpful’ categories combined; p=0.001.
Who found the support more helpful in deciding what type of job they want?
- healthier respondents, those with greater mental wellbeing and those with higher life satisfaction were more likely to find the support helpful in deciding what type of job they would like to do.
- education was not statistically significantly associated with the likelihood of respondents finding the support helpful in this area.
Health
Healthier respondents in all groups were more likely to report greater benefit in this area than those whose health affected their everyday activities more seriously. For example, among SCR IW treatment group respondents whose health affected their everyday activities a little or not at all, nearly four-fifths of respondents (79%) said the support was helpful in this area, compared to two-thirds (62%) of those whose health affected their everyday activities a great deal. This was consistent across the trial groups (Appendices, Chapter 3, Table 3:129-Table 3:131).
Life satisfaction and mental wellbeing
Respondents in the survey who reported higher life satisfaction and mental wellbeing, across all groups, were also more likely to find the support very helpful for deciding what type of work to do. Among the WMCA respondents, 80% of respondents with high life satisfaction found the support helpful compared to 49% of those with only a little or no life satisfaction. Similarly, among those with high mental wellbeing, 90% of respondents found the support helpful compared to 59% of respondents with low mental wellbeing. Again, these differences were consistent across the other two trial groups (Appendices, Chapter 3, Table 3:132-Table 3:133).
Education
When exploring education levels, no statistically significant differences were identified in the proportion of respondents who found the support helpful for deciding what type of work to do, in any of the trial groups (Appendices, Chapter 3, Table 3:138-Table 3:140).
3.8.3. Motivation to work
Three groupings were reviewed in respect of how the intervention support affected treatment group respondents’ motivation to return to work. These were:
- respondents who were not in employment at the time of the 4-month survey;
- respondents in employment at the 4-month survey, but who had not been working at some point in the last four months; and,
- respondents who were in employment at the 4-month survey but who were currently on sick leave.
This section describes how far each of these groups felt the intervention had increased or decreased their motivation to return. It also explores how this differed depending on their health, life satisfaction, mental wellbeing and education and by trial group (SCR IW, SCR OOW and WMCA).
Motivation to return to work among people who were not in employment
Those respondents who were not in employment at the time of the 4-month survey were asked whether their motivation to return to work had increased as a result of the IPS intervention. Across all groups, a majority reported that the intervention had increased their motivation to find employment, around a fifth said that it had no effect, and between 6% and 12% reported their motivation was decreased by the support. Comparing the groups, those in SCR were more likely to say their motivation to return to work had increased, with 74% of SCR IW respondents and 76% of SCR OOW respondents reporting this, compared to 68% of WMCA respondents (Table 3-36).
Table 3-36: How much the support increased or decreased motivation to find employment, by trial group, among respondents who were not in employment
Trial group
| How much support increased/decreased motivation to find employment, by trial group (unemployed) | SCR IW % | SCR OOW % | WMCA OOW % | Total % | p-value |
|---|---|---|---|---|---|
| Increased a lot* | 51 | 40 | 36 | 39 | 0.002 |
| Increased a little* | 23 | 35 | 32 | 33 | N/A |
| Decreased a little | 7 | 4 | 7 | 5 | N/A |
| Decreased a lot | 1 | 2 | 5 | 3 | N/A |
| No effect on motivation | 18 | 18 | 21 | 19 | N/A |
| Base: | 113 | 816 | 796 | 1,725 | – |
Base: all respondents not in employment at the time of the 4-month survey in the treatment group. *Significance test run on ‘increased a lot’ and ‘increased a little’ categories combined.
Whose motivation to work increased more amongst those not in employment?
- among those not in employment when the 4-month survey took place, respondents with greater life satisfaction, higher mental wellbeing and those whose health limited their everyday activities less strongly, perceived the intervention positively affected their motivation to work.
Health
In the SCR OOW and WMCA respondent groups, those whose health problems restricted their activities less were more likely to report their motivation increased ‘a lot’. Among SCR OOW respondents, 81% of those whose health affected their everyday activities only a little or not at all said their motivation had increased, compared to 68% of people whose everyday activities were affected a great deal by their health (Appendices, Chapter 3, Table 3:142). There was a similar difference among WMCA respondents (Appendices, Chapter 3, Table 3:143). There was no statistically significant difference among the SCR IW group, although the base at this question for the SCR IW group was much smaller than in the other two groups (n=113) (Appendices, Chapter 3, Table 3:141).
Life satisfaction and mental wellbeing
Among both the SCR OOW group and WMCA group, higher life satisfaction and higher mental wellbeing were associated with increased motivation to return to work, while there was no significant difference in the SCR IW group. In terms of life satisfaction, among the SCR OOW respondents 83% of those with high life satisfaction reported their motivation to work increased compared to 65% of those with low life satisfaction (Appendices, Chapter 3, Table 3:148). Among WMCA respondents, three-quarters of those with high life satisfaction reported their motivation to work had increased, as opposed to 57% of those with lower life satisfaction (Appendices, Chapter 3, Table 3:149).
In exploring mental wellbeing, among WMCA respondents, 83% of those with high mental wellbeing reported that their motivation to work increased compared to 63% of those with low wellbeing (Appendices, Chapter 3, Table 3:155). Similarly, among SCR OOW respondents, 83% of those with high life satisfaction reported an increase compared to 72% of people with low life satisfaction (Appendices, Chapter 3, Table 3:154). There were no statistically significant differences among the SCR IW respondents by either life satisfaction or mental wellbeing (Appendices, Chapter 3, Table 3:147 and Table 3:153).
Education
There were no statistically significant differences by highest qualification in the proportion of people whose motivation to return to work had increased (Appendices, Chapter 3, Table 3:159-Table 3:161).
Motivation to return to work among people on sick leave
Among those in employment but on sick leave, the only respondent group with a large enough number of responses to this question was the SCR IW group. For these, 37% said their motivation to return to work from sick leave had increased a lot, 38% that it increased a little, and 23% that the intervention had no effect. A small proportion said their motivation had decreased: by a lot (1%) and by a little (1%) (Table 3-37). There were no statistically significant differences by life satisfaction, mental wellbeing, education or how much respondents’ health conditions restricted their everyday activities in how IPS affected their motivation to return to work.
Table 3-37: How much the support increased or decreased motivation to return to work, by trial group, among respondents on sick leave
Trial group
| How much the support increased or decreased motivation to return to work, by trial group (respondents on sick leave) | SCR IW % | SCR OOW % | WMCA OOW % | Total % | p-value |
|---|---|---|---|---|---|
| Increased a lot* | 37 | 60 | 39 | 38 | N/A |
| Increased a little* | 38 | 15 | 29 | 36 | N/A |
| Decreased a little | 1 | 0 | 0 | 1 | N/A |
| Decreased a lot | 1 | 0 | 0 | 1 | N/A |
| No effect on motivation | 23 | 25 | 32 | 24 | N/A |
| Base: | 92 | 6 | 8 | 106 | – |
Base: all 4-month survey respondents in the intervention group on sick leave from work. Significance test not run due to low base sizes.
Motivation to return to work, when last not in employment
A strong majority of respondents who were in employment at the time of the 4-month survey but who were not in employment at some point in the last four months, reported that the intervention increased their motivation to return to work. However, when comparing the trial groups, the two OOW groups were more likely to benefit from the support in this regard than the SCR IW group. In the WMCA, 65% of respondents said their motivation to return to work had increased ‘a lot’, as did 64% of the SCR OOW group, compared to 44% in the SCR IW group.
This is the only area where the SCR IW respondents were not more likely to report positive attitudes towards the support than the OOW groups. However, given the better starting position of SCR IW respondents on entering the trial, this may be due more to these people feeling they were already motivated to return to work, rather than a negative perception of the support they were receiving (Table 3-38).
Whose motivation to return to work increased most?
It is not possible to report on most subgroup differences for this variable due to the low base sizes (<30 in some categories) (Appendices, Chapter 3, Table 3:165-Table 3:176). There were large enough bases in all categories to report on the differences by life satisfaction and by how much people’s health limits their everyday activities among SCR IW respondents. However, there were no statistically significant differences by these variables (Appendices, Chapter 3, Table 3:166).
Among these respondent groups, there seemed to be similar patterns to those identified elsewhere, with those who reported higher life satisfaction more likely to report increased motivation as a result of IPS support. For example, 76% of those with high life satisfaction reported increased motivation when last not in employment, compared to 62% of respondents with low life satisfaction, although the difference was not statistically significant.
Table 3-38: How much the support increased or decreased motivation to return to work when last out-of-work, by trial group (among people in employment)
Trial group
| How much support increased/ decreased motivation to return to work when last out-of-work, by trial group (in employment) | SCR IW % | SCR OOW % | WMCA OOW % | Total % | p-value |
|---|---|---|---|---|---|
| Increased a lot* | 44 | 64 | 65 | 54 | 0.000 |
| Increased a little* | 27 | 24 | 23 | 26 | N/A |
| Decreased a little | 1 | 2 | 3 | 2 | N/A |
| Decreased a lot | * | 0 | 0 | * | N/A |
| No effect on motivation | 28 | 10 | 8 | 18 | N/A |
| Base: | 247 | 133 | 108 | 488 | – |
Base: all 4-month survey respondents in the intervention group who were in employment but who had been out-of-work at some point in the trial. *Significance test run on ‘increased a lot’ and ‘increased a little’ categories combined.
4. 4-month impact analysis
This chapter presents estimated impacts of IPS support on outcomes collected using the survey administered four months post-randomisation. Survey interviews were attempted with all those recruited to the trials unless they withdrew between randomisation and advance letters being issued. In total, 5,407 survey responses were achieved, representing 55% of trial recruits. There was a statistically significantly higher response rate among the treatment group than the control groups. However, the treatment and control groups appeared observationally similar, once survey weights were applied.
4.1. Introduction
This section presents estimates of the impacts of IPS support delivered through the trials. These impacts are for outcomes observed in surveys conducted roughly four months post-randomisation. Intake to the trials ran between 8 May 2018 and 31 October 2019; the survey was conducted on a similar rolling intake. The next section begins with a brief re-cap of the evaluation design and an assessment of the quality of the underlying data. The main section presents estimated impacts. The final section offers some interpretation of the results.
4.2. Methodological approach
4.2.1. Description of the trials and survey populations
Table 4-1 shows that, of the 9,785 individuals randomised, 4,896 were assigned to the treatment group and 4,889 were assigned to the control group. Among recruits as a whole, this 50/50 split was visible within all trial groups: SCR IW, SCR OOW and WMCA OOW.
This balance between experimental groups is to be expected since it was hard-wired into the software used to conduct the allocation to treatment or control (the randomisation tool). However, this was not the case among the survey respondent sample. A total of 5,407 individuals were interviewed. This covers 55% of all those recruited to the trials. Care was taken to ensure that the same survey approach was used for treatment and control groups. For instance, while it would have been possible to update contact details of the treatment group using records from IPS providers, this was avoided so as not to introduce a systematic difference between treatment and control groups. Despite such precautions, it is clear from Table 4-1 that there was a higher tendency among the treatment group to respond to the survey. This difference was more pronounced in SCR, both for the IW and OOW groups, but in all cases, it is statistically significant.
Table 4-1 Numbers randomised and surveyed
| SCR: IW (Treatment) | SCR: IW (Control) | SCR: OOW (Treatment) | SCR: OOW (Control) | WMCA: OOW (Treatment) | WMCA: OOW (Control) | Total | |
|---|---|---|---|---|---|---|---|
| Total randomised | 1,260 | 1,259 | 1,799 | 1,792 | 1,837 | 1,838 | 9,785 |
| 4-month survey respondents | 780 | 683 | 1,057 | 944 | 1,007 | 936 | 5,407 |
| Respondent % | 61.9 | 54.2 | 58.8 | 52.7 | 54.8 | 50.9 | 55.3 |
Source: baseline and 4-month survey, all recruits
A difference in response rates can affect the ability of the trial data to provide unbiased estimates of programme impacts. The final evaluation dataset will draw on linked administrative records so that some outcomes can be observed for both respondents and non-respondents. This will allow a more direct means of assessing the biasing effect of non-response, at least as it relates to those outcomes available from administrative data.
Figure 4-1 shows the numbers recruited to the trials each month, by trial group. After initial growth, intake remained fairly steady, growing gently in later months before peaking sharply in the final month, October 2019, which accounted for 16% (1,597) of all recruits. This was more than double the number randomised in any other month. The number of OOW recruits was quite similar in SCR and WMCA, while the number of IW in SCR was consistently lower.
Figure 4-1 Recruitment to trials by month
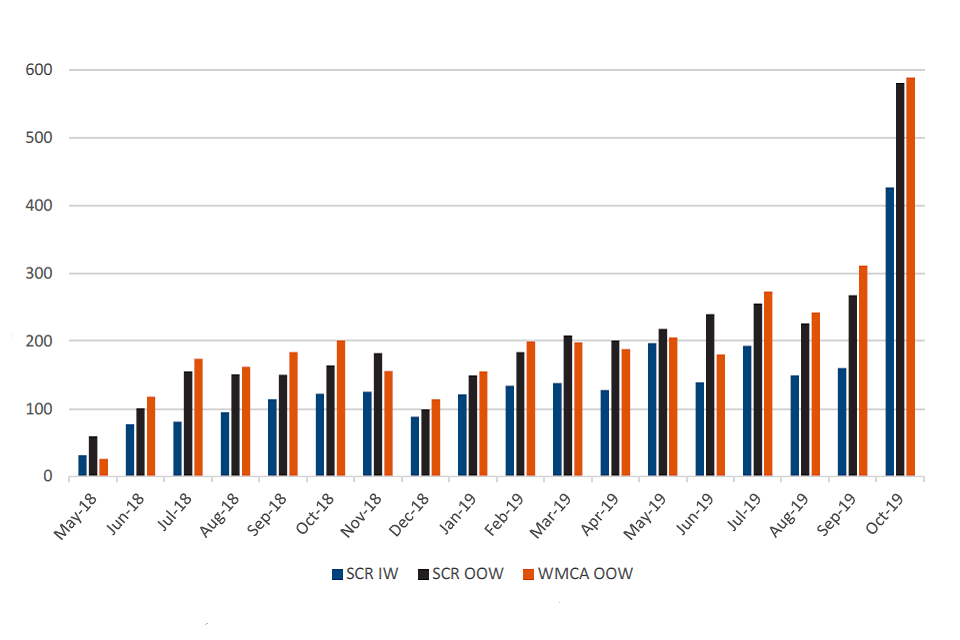
Source: randomisation tool, all recruits
Tables 4-2 to 4-4 summarise the baseline characteristics for each of the three trial groups. In each case, this is shown separately for the full population, the respondent sample, and the respondent sample broken down by control and treatment group. All characteristics (with the exception of age) are shown as proportions. While we would expect some differences between the treatment and control groups, we would hope that these were not substantial. To provide a more formal sense of this, we conducted statistical tests of similarity. The results of these tests are summarised using p-values, shown in the final column of each table.
For each variable, the p-value indicates how likely it is that the observed treatment-control difference would arise just by chance rather than reflecting a true underlying difference. A small p-value suggests the observed difference is unlikely to have arisen by chance and therefore gives grounds for thinking that the hypothesis of no difference is unlikely to hold; that is, that the difference is statistically significant. Conventionally, p-values of less than 0.05 are interpreted as being significant in a statistical sense.
The results show that it is only with regard to highest qualification that there appears to be a notable difference between treatment and control groups, and this itself is only seen among the SCR IW and WMCA OOW groups. However, when conducting multiple comparisons, a small proportion would be expected to register as statistically significant purely by chance. With this in mind, the baseline characteristics considered look quite similar across treatment and control groups in the respondent samples. This is the case across all trial groups.
Table 4-2 Baseline characteristics (SCR IW)
| characteristics | Full 4-month population: mean | 4-month sample, weighted: mean | 4-month sample (Control), weighted: mean | 4- month sample (Treatment), weighted: mean | Test of treatment-control difference: p-value |
|---|---|---|---|---|---|
| Age | 41.51 | 41.57 | 41.13 | 42.00 | 0.37 |
| Female | 0.57 | 0.57 | 0.57 | 0.57 | 0.98 |
| Non-white | 0.10 | 0.10 | 0.10 | 0.11 | 0.59 |
| Partner | 0.48 | 0.49 | 0.47 | 0.51 | 0.16 |
| Dep. children | 0.27 | 0.27 | 0.27 | 0.26 | 0.68 |
| Highest qual: | – | – | – | – | 0.06 |
| Below GCSE / Oth. quals | 0.18 | 0.17 | 0.15 | 0.18 | – |
| GCSE A-C | 0.24 | 0.26 | 0.26 | 0.26 | – |
| A level | 0.25 | 0.25 | 0.28 | 0.22 | – |
| Post A level | 0.33 | 0.32 | 0.31 | 0.34 | – |
| Health condition: | – | – | – | – | 0.09 |
| MH only | 0.06 | 0.05 | 0.05 | 0.05 | – |
| MSK only | 0.01 | (-) | (-) | (-) | – |
| Other only | 0.02 | 0.03 | 0.04 | 0.02 | – |
| MH & MSK | 0.01 | 0.01 | (-) | (-) | – |
| MH & oth. | 0.34 | 0.34 | 0.35 | 0.34 | – |
| MSK & oth. | 0.08 | 0.08 | 0.07 | 0.09 | – |
| MH, MSK & oth. | 0.49 | 0.48 | 0.47 | 0.49 | – |
| Area: | – | – | – | – | 0.88 |
| Barnsley | 0.14 | 0.14 | 0.14 | 0.14 | – |
| Bassetlaw | 0.10 | 0.10 | 0.10 | 0.10 | – |
| Doncaster | 0.19 | 0.19 | 0.18 | 0.20 | – |
| Rotherham | 0.17 | 0.17 | 0.17 | 0.16 | – |
| Sheffield | 0.39 | 0.41 | 0.42 | 0.40 | – |
| Sandwell & West B’ham | 0.00 | 0.00 | 0.00 | 0.00 | – |
| B’ham and Solihull | 0.00 | 0.00 | 0.00 | 0.00 | – |
| Dudley | 0.00 | 0.00 | 0.00 | 0.00 | – |
| Wolverhampton | 0.00 | 0.00 | 0.00 | 0.00 | – |
| Cohort: | – | – | – | – | 0.98 |
| May 2018-Jun 2018 | 0.04 | 0.03 | 0.02 | 0.03 | – |
| Jul 2018-Sep 2018 | 0.12 | 0.12 | 0.11 | 0.12 | – |
| Oct 2018- Dec 2018 | 0.13 | 0.14 | 0.14 | 0.14 | – |
| Jan 2019- Mar 2019 | 0.16 | 0.16 | 0.16 | 0.15 | – |
| May 2019-Jun 2019 | 0.18 | 0.20 | 0.21 | 0.19 | – |
| Jul 2019-Sep 2019 | 0.20 | 0.20 | 0.20 | 0.20 | – |
| Oct 2019- Dec 2019 | 0.17 | 0.16 | 0.16 | 0.17 | – |
| EQ5D5L | 0.57 | 0.58 | 0.58 | 0.58 | 0.13 |
| Base | 2,481-2,519 | 1,444-1,463 | 675-683 | 769-780 | – |
(-) Suppressed due to being based on less than 10 observations. The number of observations varies across variables due to missing values in some cases.
Source: baseline and 4-month survey
Table 4-3 Baseline characteristics (SCR OOW)
| characteristics | Full 4-month population: mean | 4-month sample, weighted: mean | 4-month sample (Control), weighted: mean | 4-month sample (Treatment), weighted: mean | Test of treatment-control difference: p-value | |
|---|---|---|---|---|---|---|
| Age | 40.25 | 40.32 | 40.17 | 40.47 | 0.56 | |
| Female | 0.44 | 0.44 | 0.45 | 0.43 | 0.41 | |
| Non-white | 0.14 | 0.14 | 0.14 | 0.14 | 0.98 | |
| Partner | 0.25 | 0.26 | 0.26 | 0.25 | 0.80 | |
| Dep. children | 0.23 | 0.23 | 0.23 | 0.24 | 0.58 | |
| Highest qual: | – | – | – | – | 0.56 | |
| Below GCSE/Oth. quals | 0.33 | 0.31 | 0.33 | 0.30 | – | |
| GCSE A-C | 0.29 | 0.30 | 0.28 | 0.32 | – | |
| A level | 0.17 | 0.17 | 0.18 | 0.17 | – | |
| Post A level | 0.21 | 0.21 | 0.21 | 0.22 | – | |
| Health condition: | – | – | – | – | 0.23 | |
| MH only | 0.06 | 0.06 | 0.06 | 0.05 | – | |
| MSK only | 0.01 | 0.01 | (-) | 0.01 | – | |
| Other only | 0.04 | 0.04 | 0.04 | 0.04 | – | |
| MH & MSK | 0.01 | 0.01 | (-) | 0.02 | – | |
| MH & oth. | 0.32 | 0.32 | 0.32 | 0.31 | – | |
| MSK & oth. | 0.09 | 0.09 | 0.09 | 0.08 | – | |
| MH, MSK & oth. | 0.48 | 0.48 | 0.46 | 0.49 | – | |
| Area: | – | – | – | – | 0.79 | |
| Barnsley | 0.11 | 0.12 | 0.12 | 0.12 | – | |
| Bassetlaw | 0.07 | 0.07 | 0.07 | 0.07 | – | |
| Doncaster | 0.17 | 0.17 | 0.17 | 0.17 | – | |
| Rotherham | 0.21 | 0.21 | 0.20 | 0.22 | – | |
| Sheffield | 0.45 | 0.44 | 0.45 | 0.43 | – | |
| Sandwell & West B’ham | 0.00 | 0.00 | 0.00 | 0.00 | – | |
| B’ham and Solihull | 0.00 | 0.00 | 0.00 | 0.00 | – | |
| Dudley | 0.00 | 0.00 | 0.00 | 0.00 | – | |
| Wolverhampton | 0.00 | 0.00 | 0.00 | 0.00 | – | |
| Cohort: | – | – | – | – | 0.93 | |
| May 2018-Jun 2018 | 0.04 | 0.02 | 0.02 | 0.02 | – | |
| Jul 2018-Sep 2018 | 0.13 | 0.13 | 0.12 | 0.13 | – | |
| Oct 2018- Dec 2018 | 0.12 | 0.13 | 0.13 | 0.14 | – | |
| Jan 2019- Mar 2019 | 0.15 | 0.16 | 0.17 | 0.16 | – | |
| May 2019-Jun 2019 | 0.18 | 0.19 | 0.19 | 0.18 | – | |
| Jul 2019-Sep 2019 | 0.21 | 0.22 | 0.22 | 0.22 | – | |
| Oct 2019- Dec 2019 | 0.16 | 0.15 | 0.15 | 0.14 | – | |
| EQ5D5L | 0.61 | 0.61 | 0.60 | 0.61 | 0.40 | – |
| Base | 3,505-3,591 | 1,964-2,001 | 927-944 | 1,037-1,057 | – |
(-) Suppressed due to being based on less than 10 observations. The number of observations varies across variables due to missing values in some cases.
Source: baseline and 4-month survey
Table 4-4 Baseline characteristics (WMCA OOW)
| Characteristics | Full 4-month population: mean | 4-month sample, weighted: mean | 4-month sample (Control), weighted: mean | 4- month sample (Treatment), weighted: mean | Test of treatment-control difference: P-value | |
|---|---|---|---|---|---|---|
| Age | 41.30 | 41.45 | 40.72 | 42.18 | 0.14 | |
| Female | 0.46 | 0.47 | 0.46 | 0.48 | 0.35 | |
| Non-white | 0.36 | 0.36 | 0.35 | 0.37 | 0.23 | |
| Partner | 0.25 | 0.25 | 0.25 | 0.25 | 0.94 | |
| Dep. children | 0.24 | 0.24 | 0.24 | 0.24 | 0.91 | |
| Highest qual: | – | – | – | – | 0.05 | |
| Below GCSE / Oth quals | 0.33 | 0.32 | 0.35 | 0.29 | – | |
| GCSE A-C | 0.32 | 0.33 | 0.33 | 0.33 | – | |
| A level | 0.17 | 0.17 | 0.15 | 0.18 | – | |
| Post A level | 0.18 | 0.18 | 0.17 | 0.19 | – | |
| Health condition: | – | – | – | – | 0.35 | |
| MH only | 0.04 | 0.04 | 0.04 | 0.04 | – | |
| MSK only | 0.01 | 0.01 | (-) | (-) | – | |
| Other only | 0.06 | 0.06 | 0.06 | 0.06 | – | |
| MH & MSK | 0.01 | 0.01 | (-) | (-) | – | |
| MH & oth. | 0.28 | 0.28 | 0.31 | 0.25 | – | |
| MSK & oth. | 0.11 | 0.12 | 0.12 | 0.12 | – | |
| MH, MSK & oth. | 0.49 | 0.48 | 0.45 | 0.50 | – | |
| Area: | – | – | – | – | 0.83 | |
| Barnsley | 0.00 | 0.00 | 0.00 | 0.00 | – | |
| Bassetlaw | 0.00 | 0.00 | 0.00 | 0.00 | – | |
| Doncaster | 0.00 | 0.00 | 0.00 | 0.00 | – | |
| Rotherham | 0.00 | 0.00 | 0.00 | 0.00 | – | |
| Sheffield | 0.00 | 0.00 | 0.00 | 0.00 | – | |
| Sandwell & West B’ham | 0.32 | 0.32 | 0.33 | 0.32 | – | |
| B’ham and Solihull | 0.20 | 0.21 | 0.21 | 0.20 | – | |
| Dudley | 0.28 | 0.28 | 0.27 | 0.29 | – | |
| Wolverhampton | 0.19 | 0.19 | 0.19 | 0.19 | – | |
| Cohort: | – | – | – | – | 0.98 | |
| May 2018-Jun 2018 | 0.04 | 0.03 | 0.03 | 0.03 | – | |
| Jul 2018-Sep 2018 | 0.14 | 0.15 | 0.16 | 0.15 | – | |
| Oct 2018- Dec 2018 | 0.13 | 0.13 | 0.12 | 0.13 | – | |
| Jan 2019- Mar 2019 | 0.15 | 0.15 | 0.15 | 0.16 | – | |
| May 2019-Jun 2019 | 0.16 | 0.15 | 0.16 | 0.15 | – | |
| Jul 2019-Sep 2019 | 0.22 | 0.23 | 0.24 | 0.22 | – | |
| Oct 2019- Dec 2019 | 0.16 | 0.15 | 0.15 | 0.15 | – | |
| EQ5D5L | 0.61 | 0.61 | 0.60 | 0.62 | 0.46 | – |
| Base | 3,609-3,675 | 1,910-1,943 | 922-936 | 988-1,007 | – |
(-) Suppressed due to being based on less than 10 observations. The number of observations varies across variables due to missing values in some cases.
Source: baseline and 4-month survey
The concern about treatment-control imbalance prompted the decision rule in the Statistical Analysis Plan (SAP):[footnote 10]
If there is a treatment-control difference in the response rate of more than 5 percentage points and if baseline measures of job search efficacy, employment history, health or well-being differ significantly (p-value <0.05 after adjusting for multiple testing using Westfall-Young (1993)) in weighted regressions on the control variables then regard as primary outcomes sustained employment and earnings taken from the administrative data, and all other outcomes as secondary.
The implication of this decision rule is that if the criteria suggest the survey data may be unreliable for the purpose of impact evaluation, the two primary outcomes that are being measured through survey data – health and wellbeing - would be demoted to secondary outcomes and the primary focus of the evaluation would shift to those outcomes that are observed in administrative data.
While this decision rule will be applied to the full sample at the final survey stage, it is informative to consider how it would operate were it applied to the currently available data. The response rate in SCR differs by more than five percentage points between treatment and control groups (see Table 4-1). Table 4-5 presents the treatment-control differences in baseline outcomes for employment (proxied by ‘looking for work’, ‘job search self-efficacy’ and ‘number of barriers to work’), health (EuroQol-5D-5L, or ‘EQ5D5L’) and wellbeing (Short Warwick-Edinburgh Mental Wellbeing Scale, or ‘SWEMWBS’). In each case, the result shown is the coefficient on a treatment dummy after controlling for the same control variables as used in the main impact estimates. The standard errors are also shown. From this it is clear that none of the differences is statistically significant[footnote 11]. After correcting for multiple testing in line with the SAP decision rule (column ‘P-val’), the clear finding is of no statistical significance. Based on the current data, the decision rule would not result in the primary outcomes being adjusted.
Table 4-5 Treatment-control differences in baseline outcomes
| SCR: IW - diff. | SCR: IW - S.E. | SCR: IW - p-val | SCR: OOW - diff. | SCR: OOW - S.E. | SCR: OOW - p-val | WMCA: OOW - Diff. | WMCA: OOW - S.E. | WMCA: OOW - p-val | |
|---|---|---|---|---|---|---|---|---|---|
| Looking for work | -0.015 | 0.025 | 0.97 | 0.015 | 0.013 | 0.58 | -0.001 | 0.011 | 0.91 |
| Job search self-efficacy | -0.027 | 0.048 | 0.97 | 0.015 | 0.041 | 0.84 | -0.041 | 0.041 | 0.54 |
| Number of barriers | 0.058 | 0.097 | 0.97 | 0.143 | 0.074 | 0.24 | 0.112 | 0.078 | 0.39 |
| EQ5D5L | 0.001 | 0.013 | 0.97 | 0.013 | 0.01 | 0.57 | 0.023 | 0.01 | 0.11 |
| SWEMWBS | -0.015 | 0.025 | 0.97 | 0.015 | 0.013 | 0.58 | -0.001 | 0.011 | 0.91 |
Source: baseline and 4-month survey, all respondents
4.2.2. Engagement with the IPS
Management information collected by providers enables an examination of the degree of engagement with IPS among the treatment group. Table 6.6 captures this by showing the number of interactions between recruits in the treatment group and the IPS service. This is restricted to consideration of face-to-face meetings and telephone conversations. In doing this, other interactions such as email and text messages are excluded in order to focus more directly on real-time personal support in line with the IPS model.
Among the full treatment group, participants had an average of 7 face-to-face sessions or telephone contacts. For survey respondents, this is higher (an average of 12 sessions) suggesting that the more engaged participants were more likely to respond to the survey raising a concern about the representativeness of the survey sample. Non-participation in support was rare, accounting for only 5.9% of the full treatment group and an even smaller proportion (2.8%) among survey respondents.
Examining variation by trial group shows that non-participation was extremely rare in WMCA. Within SCR, non-participation was higher among the OOW group, with 10.6% of all recruits receiving no IPS service, compared to 7.0% for the OOW group (these rates are roughly double those for the corresponding respondent samples). The average number of sessions across all trials groups was quite consistent, ranging between 7.0 and 8.8 among all recruits and between 10.6 and 13.4 among survey respondents.
Table 4-6 MI data on number of IPS sessions, for all participants and participants who respond to the survey
| Number of sessions | SCR IW: All | SCR IW: Resp. | SCR OOW: All | SCR OOW: Resp. | WMCA OOW: All | WMCA OOW: Resp. | Total: All | Total: Resp. |
|---|---|---|---|---|---|---|---|---|
| 0 | 7.0 | 3.2 | 10.6 | 5.2 | 0.4 | 0.2 | 5.9 | 2.8 |
| 1 to 5 | 26.7 | 20.0 | 27.2 | 20.1 | 24.6 | 18.8 | 26.1 | 19.6 |
| 6 to 10 | 26.7 | 29.6 | 20.0 | 20.8 | 25.8 | 24.4 | 23.9 | 24.4 |
| 11 to 15 | 21.1 | 25.1 | 20.4 | 24.6 | 20.4 | 22.5 | 20.6 | 24.0 |
| 16 to 20 | 12.5 | 15.0 | 13.5 | 18.1 | 13.0 | 14.1 | 13.1 | 15.9 |
| 21 to 25 | 4.3 | 5.2 | 5.7 | 7.9 | 8.4 | 10.4 | 6.4 | 8.1 |
| 26 to 30 | 1.5 | 1.5 | 1.7 | 2.3 | 4.1 | 5.7 | 2.6 | 3.3 |
| 31 to 35 | 0.2 | 0.1 | 0.7 | 0.8 | 1.8 | 2.1 | 1.0 | 1.1 |
| 36+ | 0.1 | 0.2 | 0.2 | 0.2 | 1.5 | 1.8 | 0.7 | 0.7 |
| Mean | 7.0 | 10.6 | 7.1 | 11.3 | 7.8 | 13.4 | 7.3 | 11.9 |
| Base | 1,249 | 777 | 1,786 | 1,054 | 1,825 | 1,002 | 4,860 | 2,833 |
Source: provider management information, both sites and 4-month survey
Table 4-7 shows, for those who had at least one IPS session, how soon after randomisation their first session took place. The results for all participants are quite similar to those for survey respondents. Across all trial groups, in more than 30% of cases, the first session took place within a week of randomisation and nearly three-quarters had had their first session within three weeks. For nearly all survey respondents who had an IPS session, this had taken place by the time of their survey interview. However, there was a notable difference between the sites. Half of all WMCA participants had their first session within a week compared to less than 20% amongst the SCR IW and OOW groups.
Table 4-7 MI data on time to first IPS session, for all participants and participants who responded to the survey
| Number of sessions | SCR IW: All | SCR IW: Resp. | SCR OOW: All | SCR OOW: Resp. | WMCA OOW: All | WMCA OOW: Resp. | Total: All | Total: Resp. |
|---|---|---|---|---|---|---|---|---|
| 1 | 18.2 | 16.2 | 19 | 19.1 | 51.6 | 51 | 31.7 | 30.1 |
| 2 | 23.3 | 23.1 | 27.1 | 26.8 | 29.1 | 28.8 | 26.9 | 26.6 |
| 3 | 20.3 | 22.6 | 18 | 19.5 | 9.4 | 10.6 | 15.2 | 17 |
| 4 | 11.6 | 13 | 12.3 | 12.4 | 3.7 | 3.3 | 8.7 | 9.2 |
| 5 | 7.9 | 8 | 7 | 6.7 | 1.4 | 1.6 | 5 | 5.1 |
| 6 | 5.3 | 5.2 | 5.1 | 4.6 | 1.5 | 1.6 | 3.7 | 3.7 |
| 7 | 3.3 | 3.4 | 2.4 | 2.5 | 0.9 | 1.1 | 2 | 2.2 |
| 8 | 3.1 | 3.2 | 2 | 1.9 | 0.5 | 0.2 | 1.7 | 1.6 |
| 10-15 | 4.6 | 3.6 | 5.2 | 5.2 | 1.4 | 1.1 | 3.5 | 3.3 |
| 16+ | 2.5 | 1.7 | 1.8 | 1.4 | 0.5 | 0.6 | 1.5 | 1.2 |
| Base | 1,161 | 753 | 1,596 | 1,000 | 1,818 | 1,000 | 4,575 | 2,753 |
Source: provider management information, both sites and 4-month survey
4.3. Impact estimates
The presentation of the impact estimates follows the same format in all cases (SCR IW; SCR OOW; SCR IW or OOW; WMCA OOW; SCR or WMCA OOW). First, the impacts for the primary outcomes are presented. These comprise employment (employment or self-employment, for any hours per week), health (EQ5D5L) and wellbeing (SWEMWBS), all measured four months after randomisation. In each case, the (raw) means for the control and treatment groups are depicted graphically, with the estimated impact shown in a box above[footnote 12]. For binary outcomes (such as whether in paid work), the impact is shown as a percentage point (ppt) difference. For non-binary outcomes (such as EQ5D5L health) the impact is shown both in units of the measure itself but also, to aid interpretability, in units of the standard deviation. Standard deviation describes the extent to which each outcome varies. This will differ across outcomes so expressing effects relative to standard deviation provides a general means of assessing the scale of the effect. A higher value corresponds to a greater impact. To make this more concrete, an impact of 0.2 standard deviations would move the average individual from the 50th percentile of the distribution for that outcome to 58th percentile. A common convention adopted in this report is to describe effects of 0.2 standard deviations or less as ‘small’[footnote 13].
The statistical significance of each impact is indicated by one, two or three asterisks (90, 95 and 99% significance, respectively, indicating the probability that the observed impact is not down to chance). The p-values underlying the asterisks are adjusted to take account of multiple testing[footnote 14]. It should be noted that statistical significance is determined by the ratio of the estimated impact to its standard error. This is distinct from the presentation approach discussed above which expresses impacts in units of the outcome’s standard deviation. The latter is known as the effect size. It is possible for a small effect size to be statistically significant and for a large effect size not to be statistically significant.
For compactness, the impact estimates for the secondary outcomes are presented in a table. For each, the following information is shown: raw means for treatment and control, impact estimate, standard error and (adjusted) p-values.
The extent of subgroup variation is explored. Controlling for multiple testing is more difficult in this case and has not been included. Because of this, the degree of subgroup variation should be regarded as exploratory rather than confirmatory. Variation is considered for the primary outcomes but also for job search self-efficacy. Four dimensions are considered: gender, age, work experience in the two years prior to randomisation and severity of health problem at randomisation, as captured by the EQVAS variable. The results are summarised graphically, showing the estimated impact within each subgroup.
Lastly, the effects of IPS participation are presented. Not everyone randomised to the treatment group attended any IPS sessions. In view of this, in addition to comparing treatment and control groups as a whole, it is of interest to focus on the impact on participants who received support. In effect, such estimates merely scale up those obtained from treatment-control comparisons. As apparent from Table 4-6, the level of non-participation was low, so these participation impacts do not differ substantially from the main estimates. In fact, non-participation was almost non-existent in WMCA so participation impacts are only presented for SCR. As with the secondary outcomes, results are given in a table showing, for each outcome: raw means for treatment and control; the impact estimate; the standard error; the (adjusted) p-values[footnote 15] and sample size.
All results are preceded by a summary of the results.
4.3.1. SCR IW at randomisation
Summary
For those in SCR who were working at randomisation (SCR IW group), being assigned to the treatment group had no effect on employment four months later, but there was a small positive impact on both health (0.1 standard deviations) and wellbeing (0.2 standard deviations). Among the secondary outcomes, there was no evidence of an impact on employment or health but there was a significant small positive impact on job search self-efficacy (0.2 standard deviations) and life satisfaction (0.1 standard deviations). There was also weak evidence of a small positive impact on general self-efficacy (0.1 standard deviations). Subgroup analysis did not provide any evidence of statistically significant variation across the dimensions considered.
Primary outcomes
Figure 4-2 Employment impact SCR IW
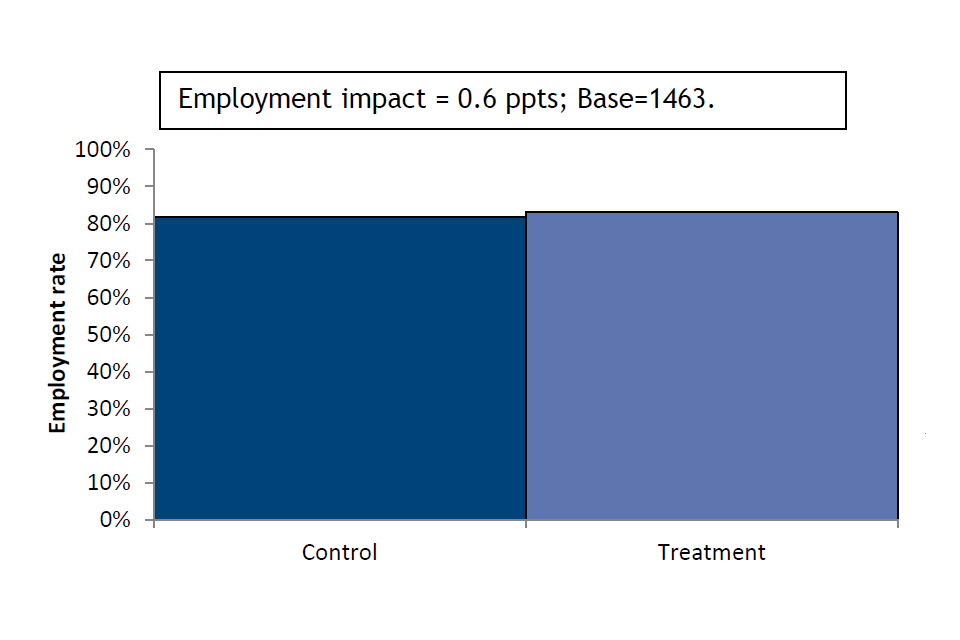
Source: Estimates using baseline and 4-month survey data, all respondents
Figure 4-3 Health impact SCR IW
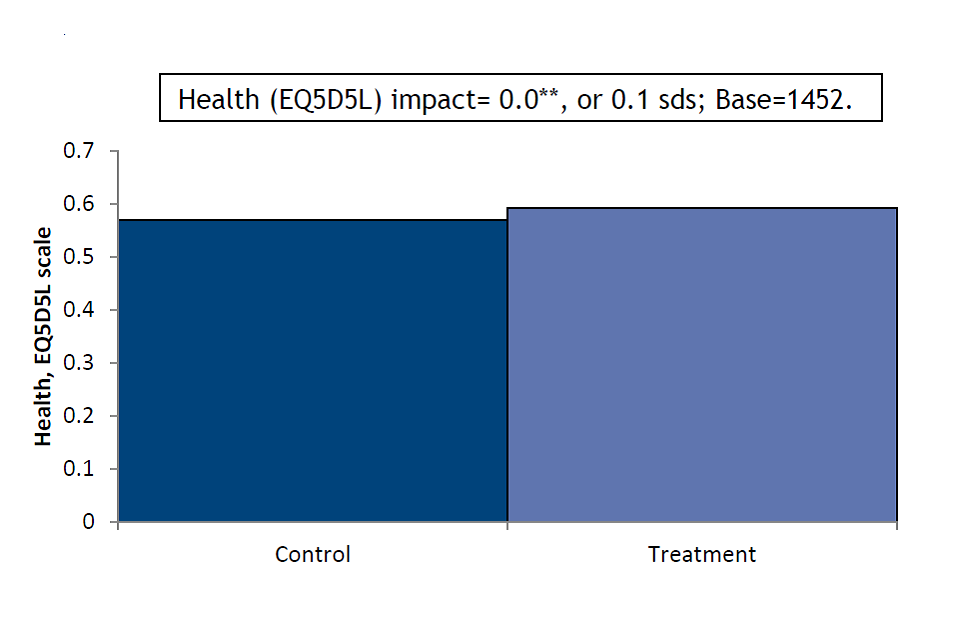
Source: Estimates using baseline and 4-month survey data, all respondents
Figure 4-4 Wellbeing impact SCR IW
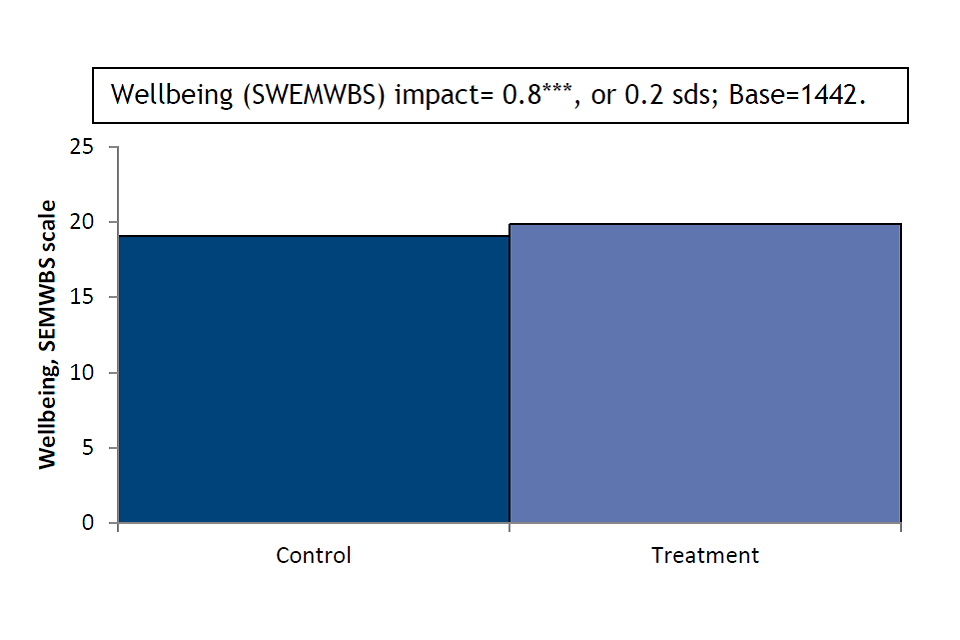
Source: Estimates using baseline and 4-month survey data, all respondents
Secondary outcomes
Table 4-8 Impact estimates on secondary outcomes (SCR IW)
| Characteristic | Control | Treatment | Impact | S.E. | sd.s | Base | |
|---|---|---|---|---|---|---|---|
| Working 16+ hours | 0.73 | 0.76 | 0.02 | 0.02 | – | 1,463 | |
| No. weeks in work | 10.87 | 11.03 | 0.15 | 0.34 | 0.0 | 1,432 \ | |
| No. weeks in work 16+ hrs | 8.27 | 8.76 | 0.48 | 0.37 | 0.1 | 1,445 | |
| Worked 16+ hours continuously | 0.74 | 0.77 | 0.03 | 0.03 | – | 1,463 | |
| Job search self-efficacy | 3.14 | 3.31 | 0.20 | 0.05 | 0.2 | *** | 1,427 |
| Musculoskeletal problems | 0.31 | 0.31 | -0.02 | 0.02 | – | 1,461 | |
| Disability (DDA definition) | 0.29 | 0.25 | -0.05 | 0.02 | – | 1,461 | |
| Life satisfaction (ONS1) | 5.00 | 5.30 | 0.35 | 0.12 | 0.1 | ** | 1,459 |
| General self-efficacy scale | 27.03 | 27.84 | 0.82 | 0.32 | 0.1 | * | 1,365 |
Source: Estimates using baseline and 4-month survey data, all respondents
Subgroup variation among primary outcomes
Figure 4-5 Employment subgroup impact SCR IW
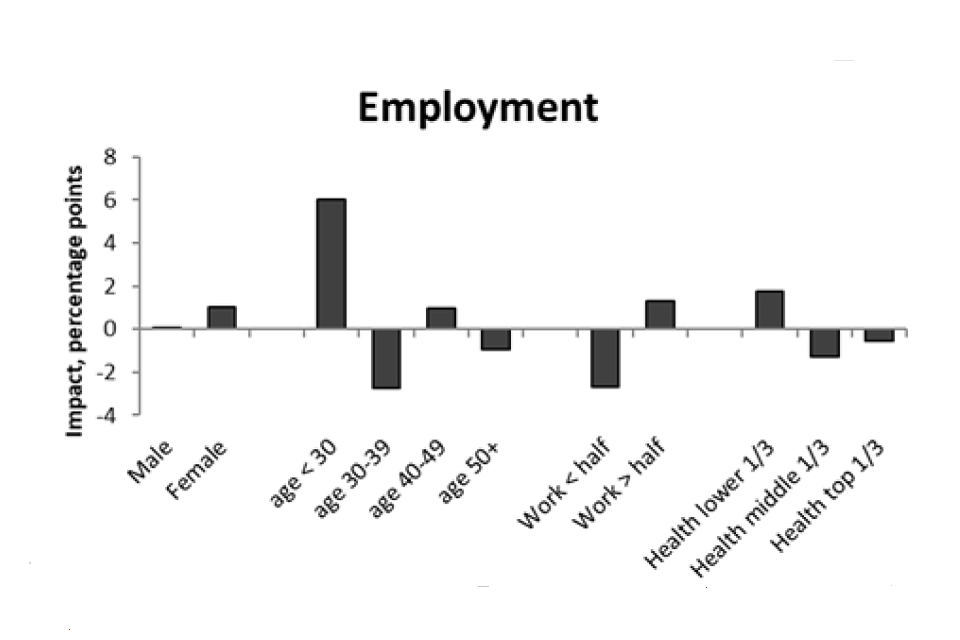
Source: Estimates using baseline and 4-month survey data, all respondents
Figure 4-6 Health subgroup impact SCR IW
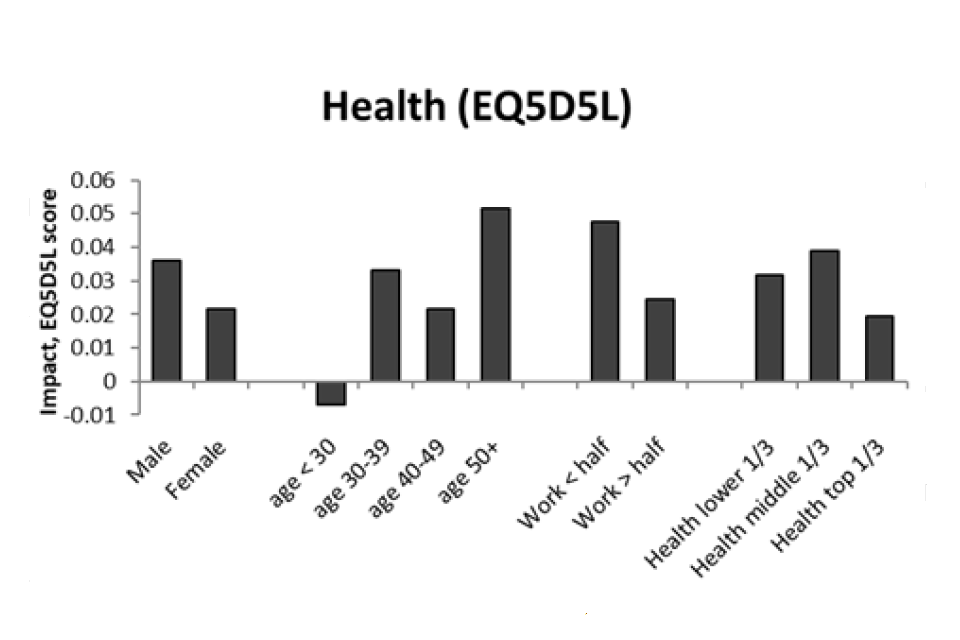
Source: Estimates using baseline and 4-month survey data, all respondents
Figure 4-7 Wellbeing subgroup impact SCR IW
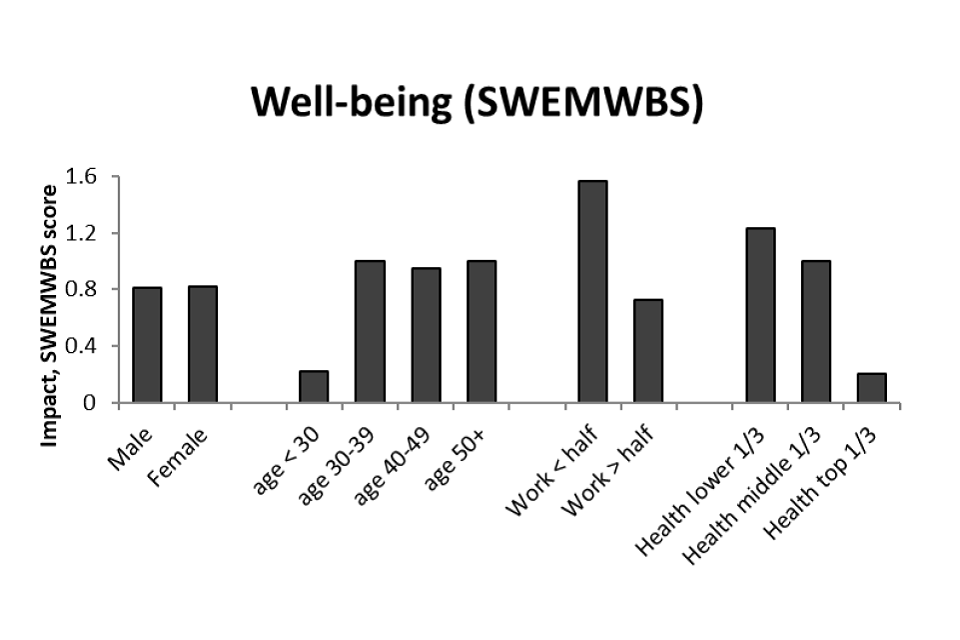
Source: Estimates using baseline and 4-month survey data, all respondents
Figure 4-8 Job search self-efficacy subgroup impact SCR IW
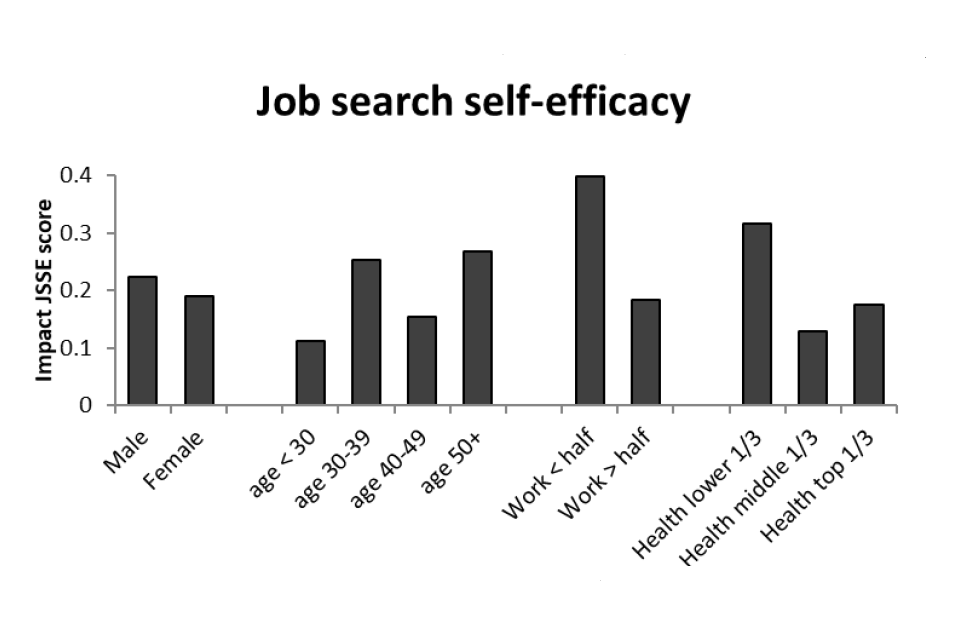
Source: Estimates using baseline and 4-month survey data, all respondents
The impact of participation
Table 4-9 Participation impact estimates (SCR IW)
| Impact | S.E. | sd.s | Base | ||
|---|---|---|---|---|---|
| Employment | 0.01 | 0.02 | – | 1,463 | |
| Health (EQ5D5L) | 0.03 | 0.01 | 0.10 | ** | 1,452 |
| Wellbeing (SWEMWBS) | 0.86 | 0.22 | 0.19 | *** | 1,442 |
Source: Estimates using baseline and 4-month survey data, all respondents
Note: This refers to the impact of receiving support (i.e. attending one or more IPS sessions)
4.3.2. SCR out-of-work at randomisation
Summary
For those in SCR who were not in paid work at randomisation, being assigned to the treatment group had no statistically significant effect on any of the primary outcomes. Among the secondary outcomes, the only significant impact was on life satisfaction, a small increase of 0.1 standard deviations. Subgroup analysis suggested that employment impacts varied with the amount of time spent in employment pre-randomisation: those who had not spent any time in employment in the previous two years and those who had spent more than half that time in work saw a significantly higher positive employment impact than the middle group, or those who had worked but for less than half the time. Also, despite no overall effect on job search self-efficacy, the results suggest a more positive effect among males relative to females.
Primary outcomes
Figure 4-9 Employment impact SCR OOW
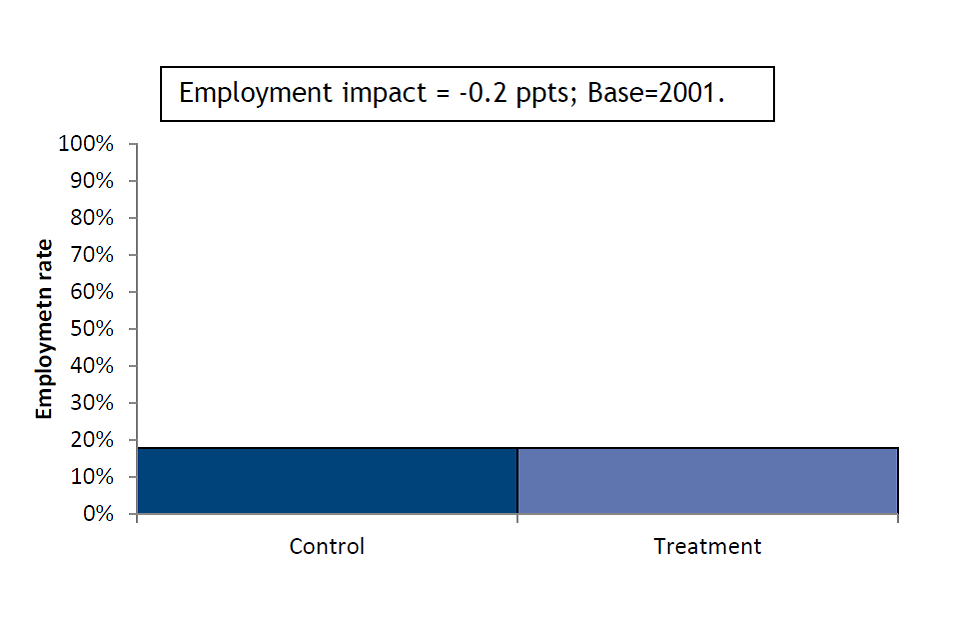
Source: Estimates using baseline and 4-month survey data, all respondents
Figure 4-10 Health impact SCR OOW
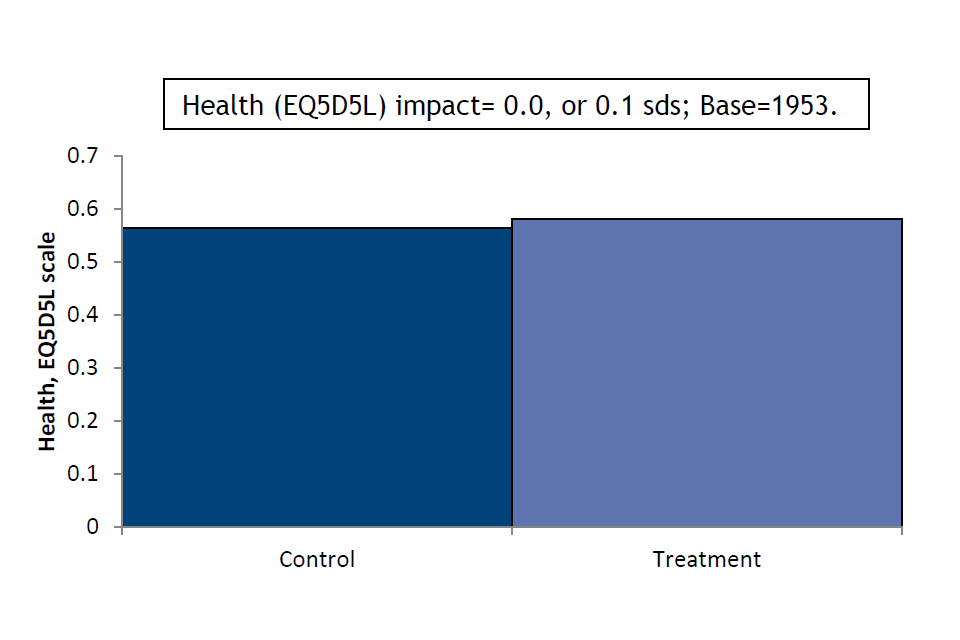
Source: Estimates using baseline and 4-month survey data, all respondents
Figure 4-11 Wellbeing impact SCR OOW
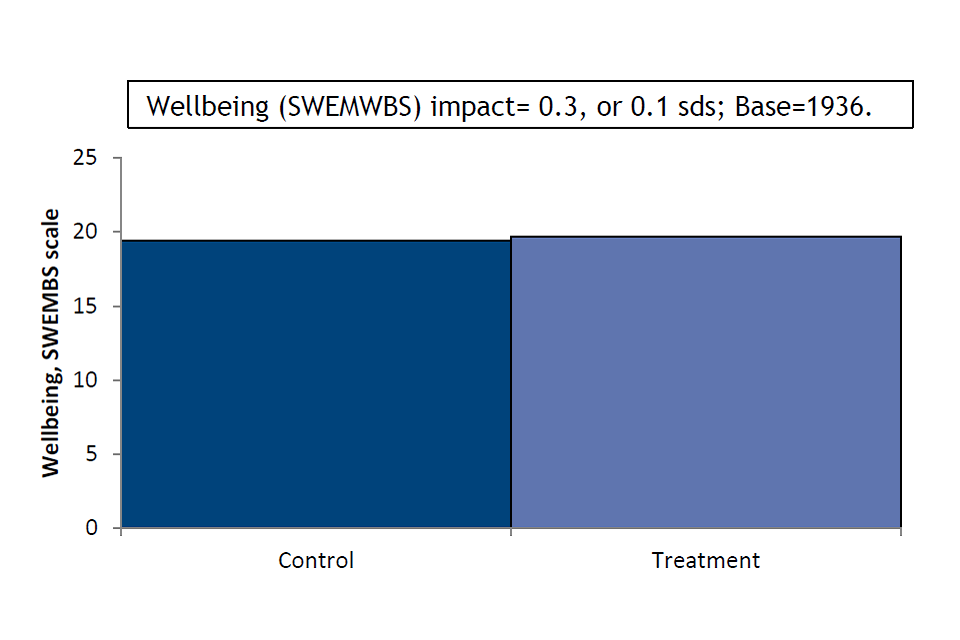
Source: Estimates using baseline and 4-month survey data, all respondents
Secondary outcomes
Table 4-10 Impact estimates on secondary outcomes (SCR OOW)
| Characteristic | Control | Treatment | Impact | S.E. | sd.s | Base | |
|---|---|---|---|---|---|---|---|
| Working 16+ hours | 0.13 | 0.13 | -0.01 | 0.01 | – | 2,001 | |
| No. weeks in work | 1.76 | 1.62 | -0.17 | 0.18 | 0.0 | 1,993 | |
| No. weeks in work 16+ hrs | 1.31 | 1.12 | -0.22 | 0.15 | -0.1 | 1,994 | |
| Worked 16+ hours continuously | 0.18 | 0.16 | -0.02 | 0.02 | – | 2,000 | |
| Job search self-efficacy | 3.08 | 3.19 | 0.10 | 0.04 | 0.1 | 1,897 | |
| Musculoskeletal problems | 0.28 | 0.26 | -0.02 | 0.02 | – | 1,997 | |
| Disability (DDA definition) | 0.29 | 0.30 | 0.02 | 0.02 | – | 1,998 | |
| Life satisfaction (ONS1) | 4.79 | 5.03 | 0.34 | 0.10 | 0.1 | *** | 1,977 |
| General self-efficacy scale | 27.08 | 27.28 | 0.27 | 0.31 | 0.0 | 1,779 |
Source: Estimates using baseline and 4-month survey data, all respondents
Subgroup variation among primary outcomes
Figure 4-12 Employment subgroup impact SCR OOW
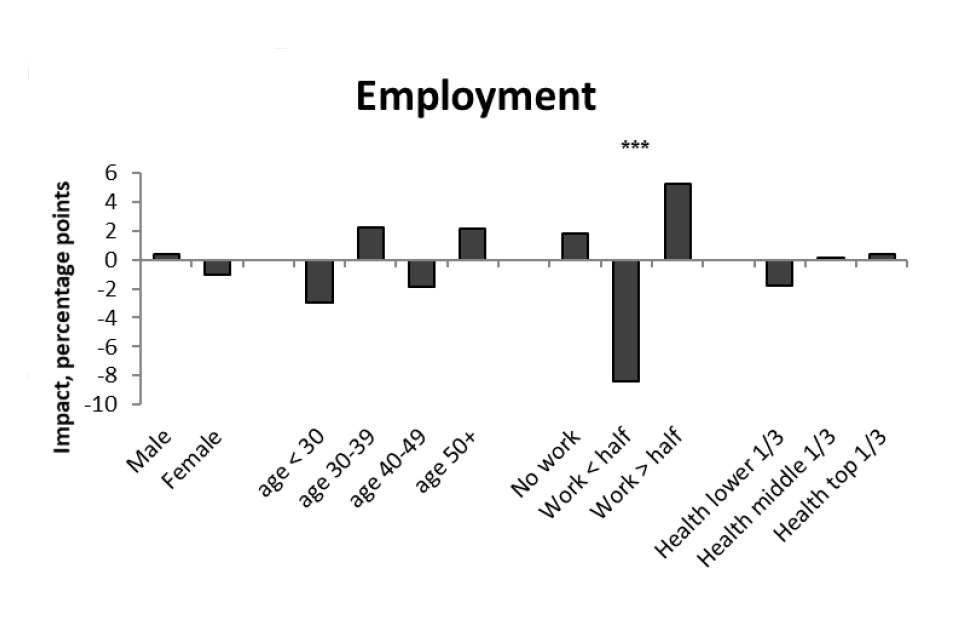
Source: Estimates using baseline and 4-month survey data, all respondents
Figure 4-13 Health subgroup impact SCR OOW
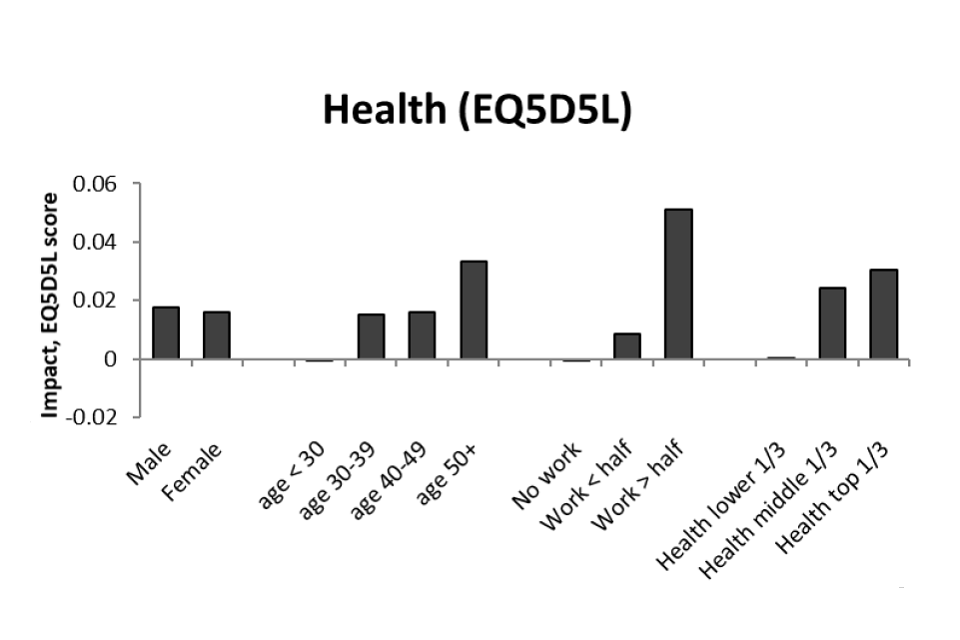
Source: Estimates using baseline and 4-month survey data, all respondents
Figure 4-14 Wellbeing subgroup impact SCR OOW
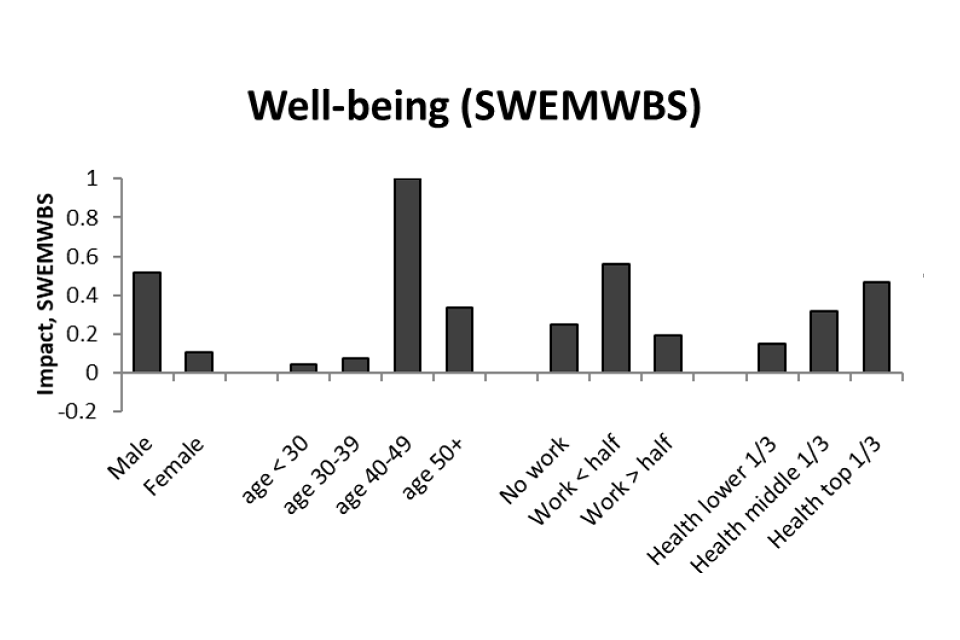
Source: Estimates using baseline and 4-month survey data, all respondents
Figure 4-15 Job search self-efficacy subgroup impact SCR OOW
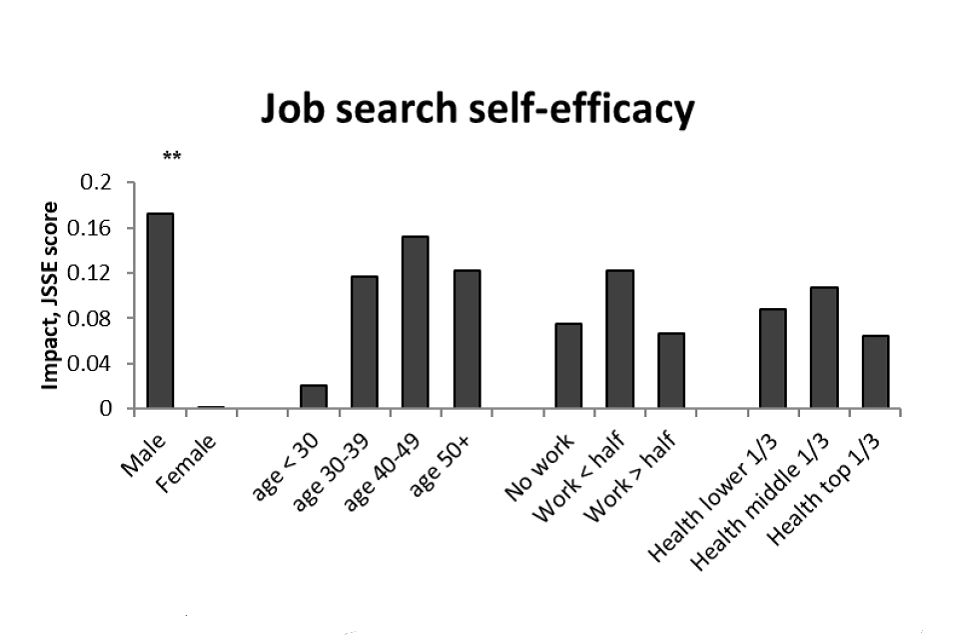
Source: Estimates using baseline and 4-month survey data, all respondents
Table 4-11 Participation impact estimates (SCR OOW)
| Impact | S.E. | sd.s | Base | ||
|---|---|---|---|---|---|
| Employment | 0.00 | 0.02 | – | 2,001 | |
| Health (EQ5D5L) | 0.02 | 0.01 | 0.00 | 1,953 | |
| Wellbeing (SWEMWBS) | 0.36 | 0.20 | 1.07 | 1,936 |
Source: Estimates using baseline and 4-month survey data, all respondents
Note: This refers to the impact of receiving support (i.e. attending one or more IPS sessions)
4.3.3. SCR IW or OOW at randomisation
Summary
The results in this section relate to SCR as a whole, regardless of employment status at the time of randomisation. As a high-level summary, they tend to resemble the results for the SCR IW group. This reflects the fact that, for outcomes where IPS had a statistically significant positive impact among those initially in work, the estimated impact among those initially out-of-work was also positive. Consequently, the commentary on the results is similar to that for the SCR IW group. There was no effect on employment but a small statistically significant positive impact on health and wellbeing (now 0.1 standard deviations in both cases). Among the secondary outcomes, there was a small significant positive impact on job search self-efficacy and life satisfaction (both 0.1 standard deviations). Subgroup analysis did not provide any evidence of statistically significant variation across the dimensions considered.
Primary outcomes
Figure 4-16 Employment impact SCR
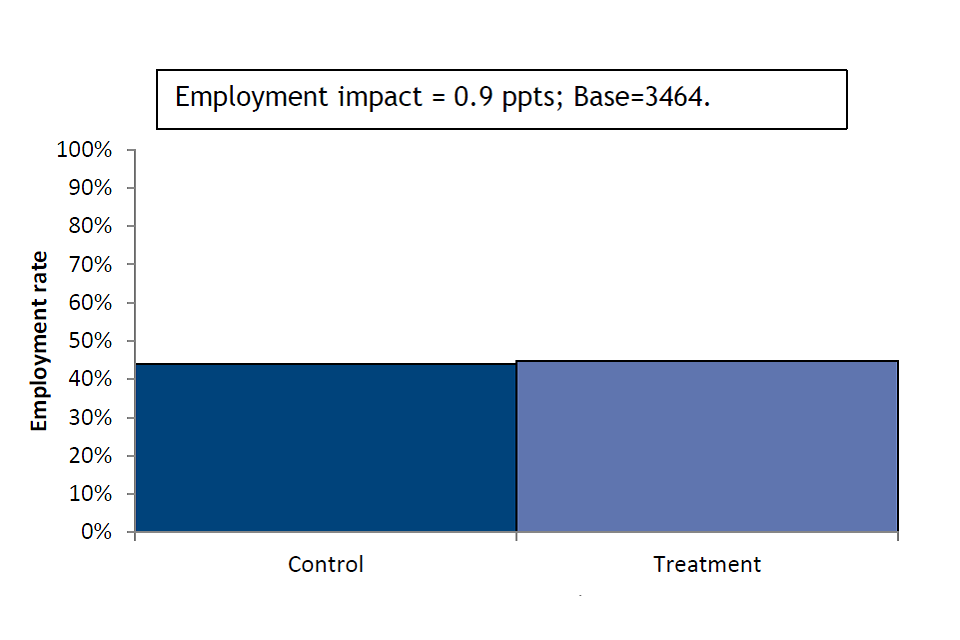
Source: Estimates using baseline and 4-month survey data, all respondents
Figure 4-17 Health impact SCR
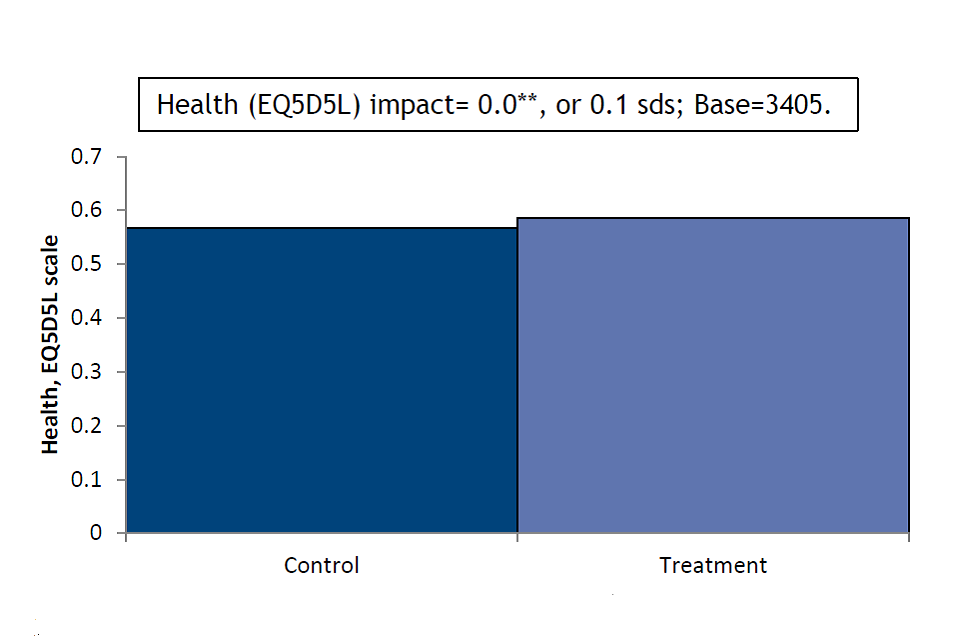
Source: Estimates using baseline and 4-month survey data, all respondents
Figure 4-18 Wellbeing impact SCR
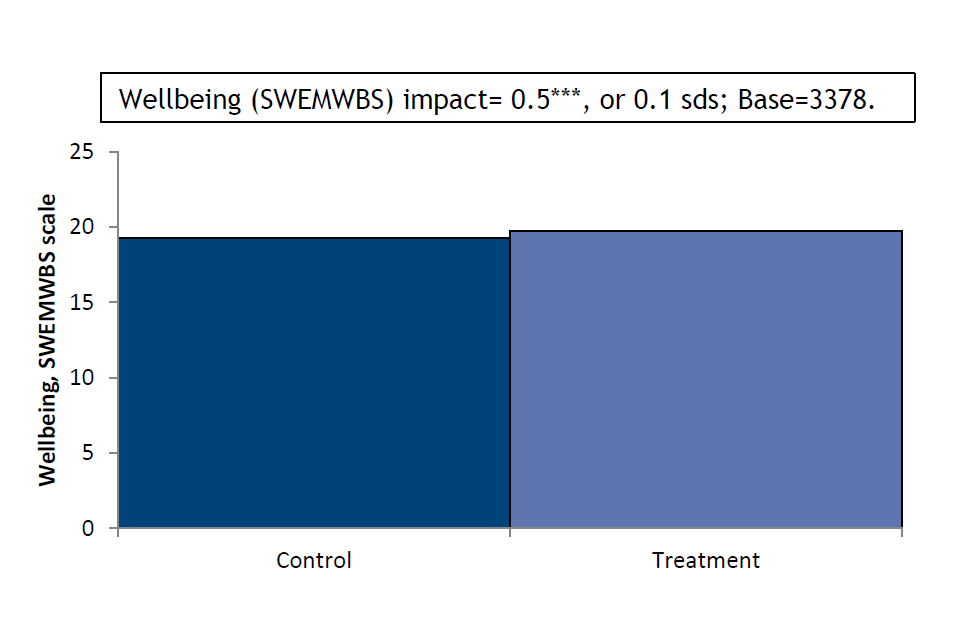
Source: Estimates using baseline and 4-month survey data, all respondents
Secondary outcomes
Table 4-12 Impact estimates on secondary outcomes (SCR)
| Characteristic | Control | Treatment | Impact | S.E. | sd.s | Base | |
|---|---|---|---|---|---|---|---|
| Working 16+ hours | 0.38 | 0.39 | 0.01 | 0.01 | – | 3,464 | |
| No. weeks in work | 5.45 | 5.46 | 0.03 | 0.19 | 0.0 | 3,425 | |
| No. weeks in work 16+ hrs | 4.16 | 4.25 | 0.12 | 0.19 | 0.0 | 3,439 | |
| Worked 16+ hours continuously | 0.41 | 0.41 | 0.00 | 0.02 | – | 3,463 | |
| Job search self-efficacy | 3.11 | 3.24 | 0.14 | 0.03 | 0.1 | *** | 3,324 |
| Musculoskeletal problems | 0.29 | 0.28 | -0.02 | 0.01 | – | 3,458 | |
| Disability (DDA definition) | 0.29 | 0.28 | -0.01 | 0.01 | – | 3,459 | |
| Life satisfaction (ONS1) | 4.88 | 5.06 | 0.23 | 0.08 | 0.1 | *** | 3,903 |
| General self-efficacy scale | 27.06 | 27.52 | 0.51 | 0.22 | 0.1 | 3,144 |
Source: Estimates using baseline and 4-month survey data, all respondents
Subgroup variation among primary outcomes
Figure 4-19 Employment subgroup impact SCR
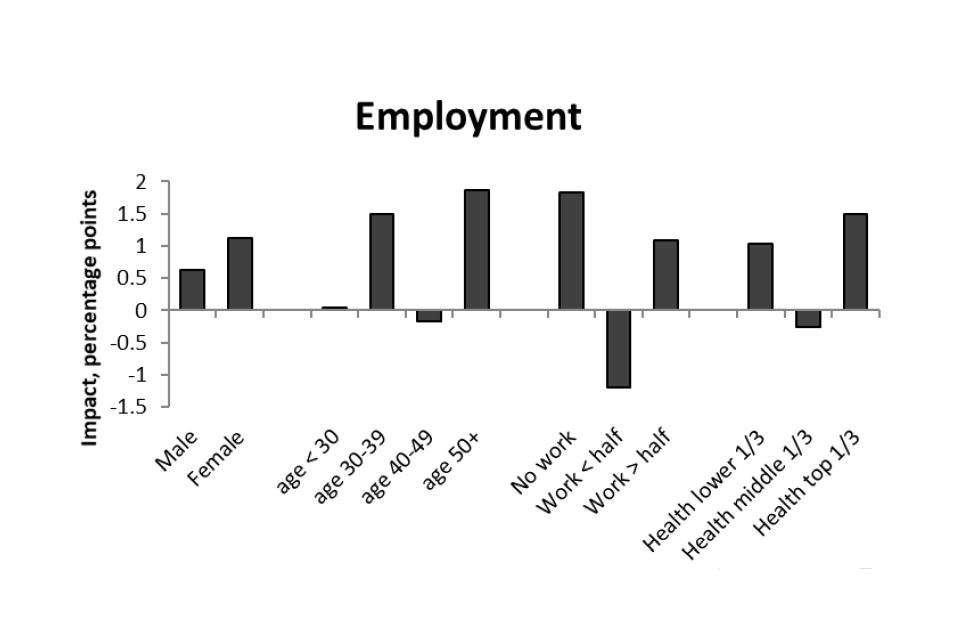
Source: Estimates using baseline and 4-month survey data, all respondents
Figure 4-20 Health subgroup impact SCR
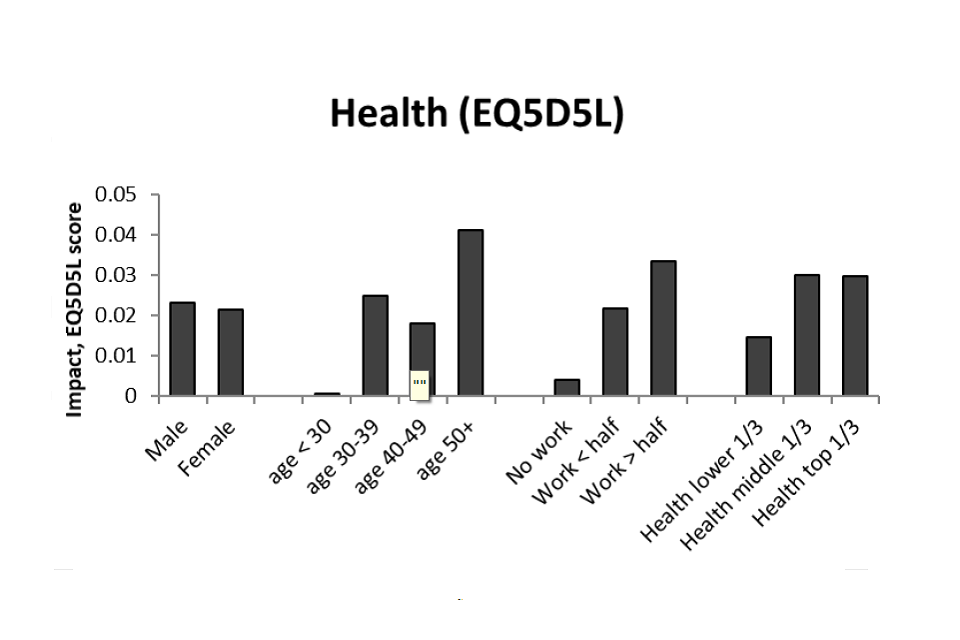
Source: Estimates using baseline and 4-month survey data, all respondents
Figure 4-21 Wellbeing subgroup impact SCR
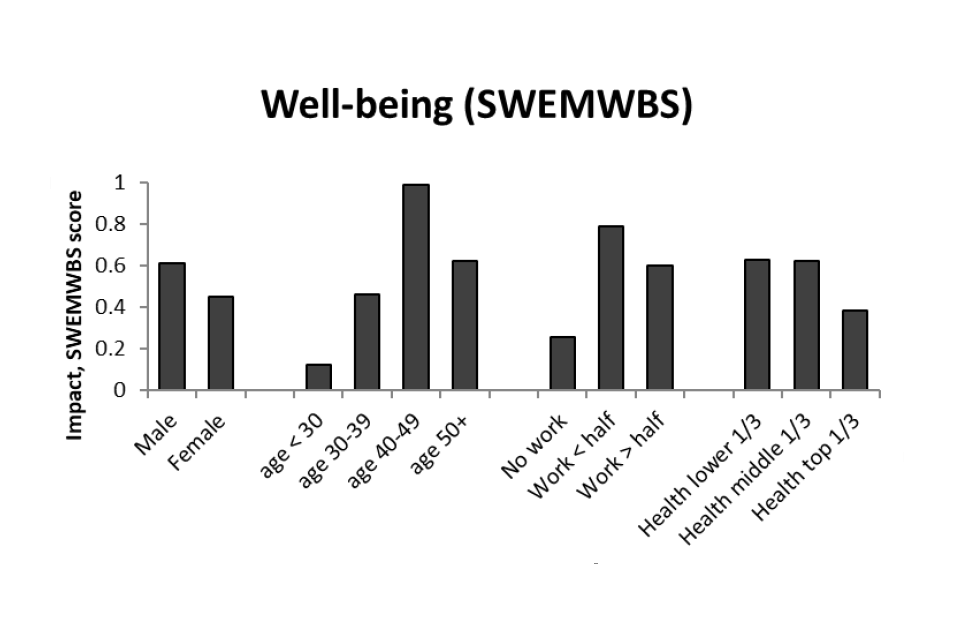
Source: Estimates using baseline and 4-month survey data, all respondents
Figure 4-22 Job search self-efficacy subgroup impact SCR
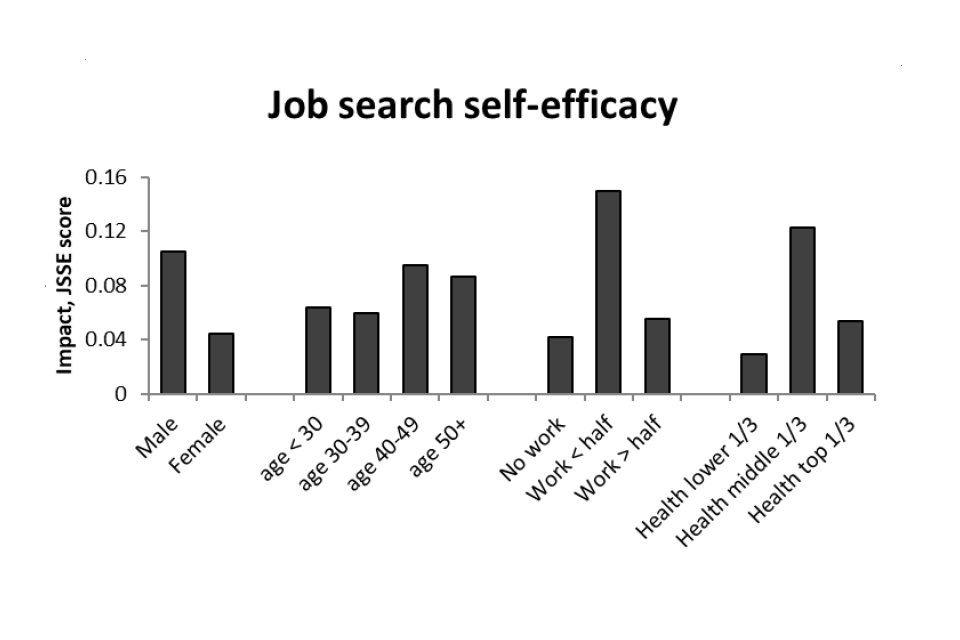
Source: Estimates using baseline and 4-month survey data, all respondents
Table 4-13 Participation impact estimates (SCR)
| Impact | S.E. | sd.s | Base | ||
|---|---|---|---|---|---|
| Employment | 0.01 | 0.01 | – | 3,464 | |
| Health (EQ5D5L) | 0.02 | 0.01 | 0.00 | ** | 3,405 |
| Wellbeing (SWEMWBS) | 0.57 | 0.15 | 0.95 | *** | 3,378 |
Source: Estimates using baseline and 4-month survey data, all respondents
Note: This refers to the impact of receiving support (i.e. attending one or more IPS sessions)
4.3.4. WMCA out-of-work at randomisation
Summary
Among those in WMCA (all of whom were not in paid work at the time of randomisation), there was no effect on any of the three primary outcomes. Nor was there any significant impact on any of the secondary outcomes. The subgroup analysis similarly provides no evidence of variation across the groups considered.
Primary outcomes
Figure 4-23 Employment impact WMCA OOW
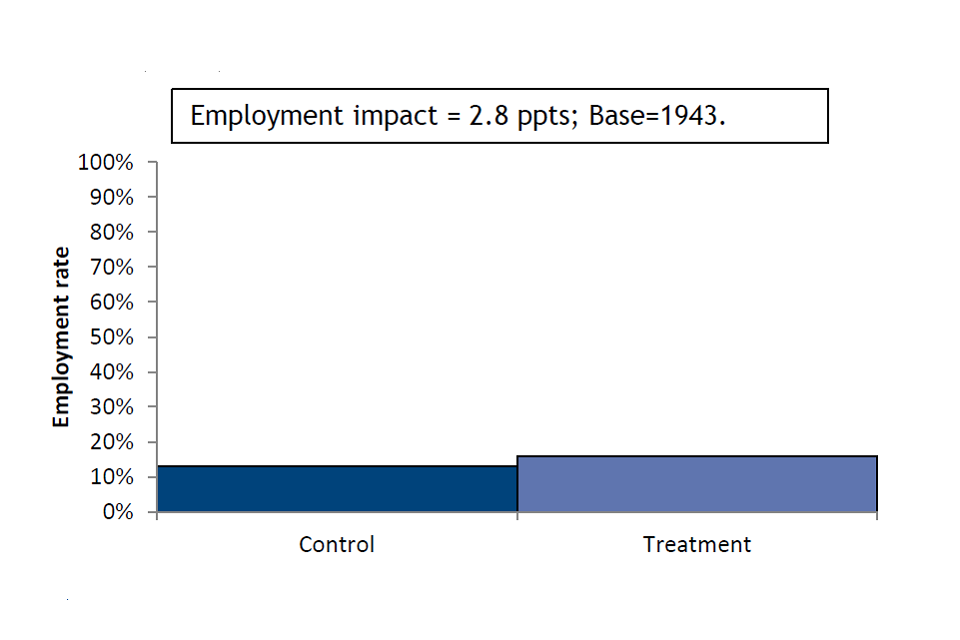
Source: Estimates using baseline and 4-month survey data, all respondents
Figure 4-24 Health impact WMCA OOW
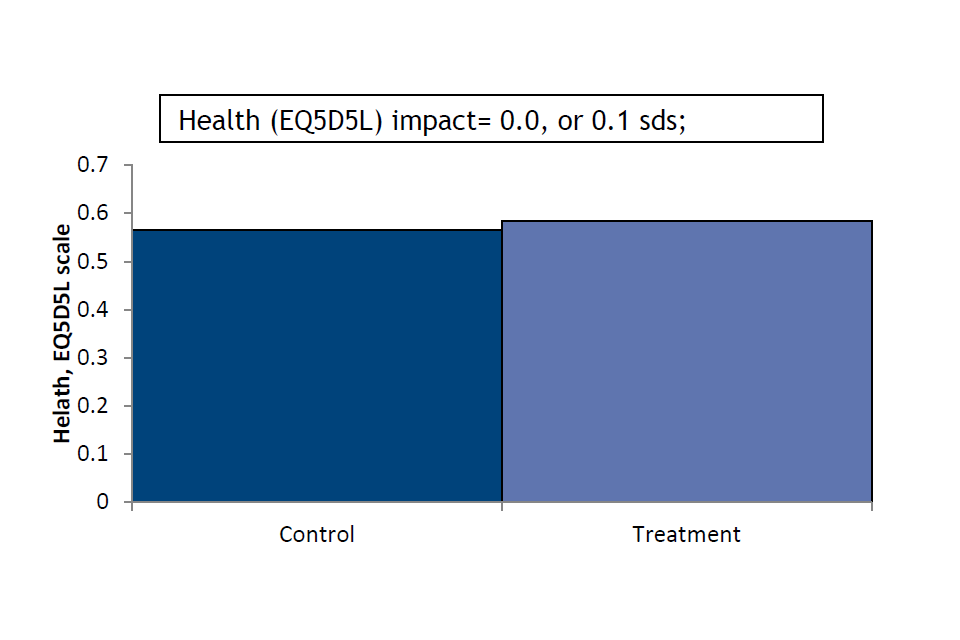
Source: Estimates using baseline and 4-month survey data, all respondents
Figure 4-25 Wellbeing impact WMCA OOW
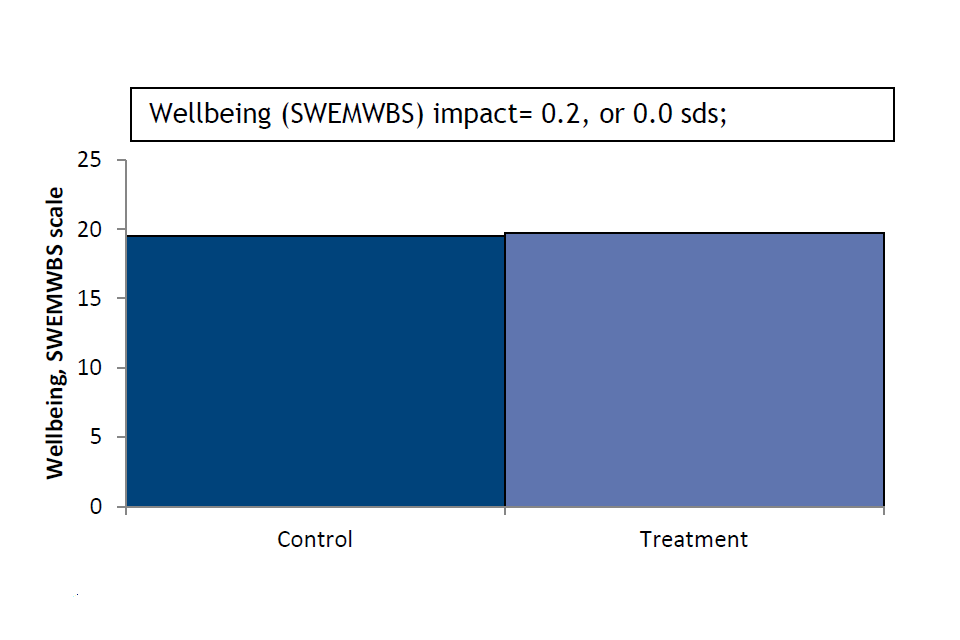
Source: Estimates using baseline and 4-month survey data, all respondents
Secondary outcomes
Table 4-14 Impact estimates on secondary outcomes (WMCA OOW)
| Characteristic | Control | Treatment | Impact | S.E. | sd.s | Base | |
|---|---|---|---|---|---|---|---|
| Working 16+ hours | 0.10 | 0.12 | 0.02 | 0.01 | – | 1,943 | |
| No. weeks in work | 1.09 | 1.32 | 0.23 | 0.15 | 0.1 | 1,927 | |
| No. weeks in work 16+ hrs | 0.76 | 0.82 | 0.06 | 0.13 | 0.0 | 1,937 | |
| Worked 16+ hours continuously | 0.12 | 0.11 | -0.01 | 0.02 | – | 1,942 | |
| Job search self-efficacy | 3.13 | 3.20 | 0.06 | 0.04 | 0.1 | 1,837 | |
| Musculoskeletal problems | 0.29 | 0.29 | -0.01 | 0.02 | – | 1,940 | |
| Disability (DDA definition) | 0.29 | 0.28 | -0.01 | 0.02 | – | 1,937 | |
| Life satisfaction (ONS1) | 4.97 | 5.10 | 0.14 | 0.11 | 0.1 | 1,926 | |
| General self-efficacy scale | 26.83 | 27.47 | 0.41 | 0.31 | 0.1 | 1,718 |
Source: Estimates using baseline and 4-month survey data, all respondents
Subgroup variation among primary outcomes
Figure 4-26 Employment subgroup impact WMCA OOW
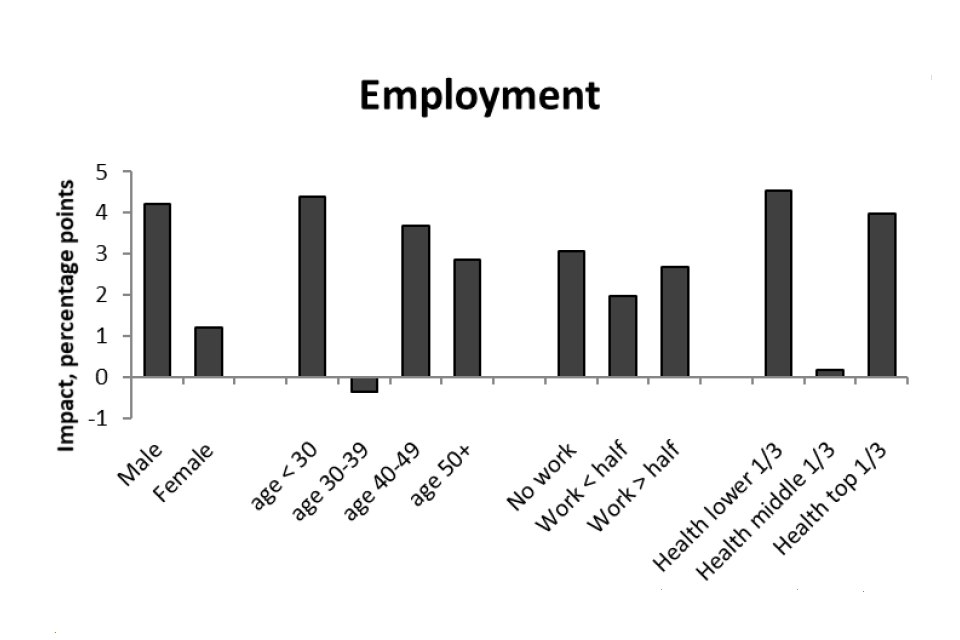
Source: Estimates using baseline and 4-month survey data, all respondents
Figure 4-27 Health subgroup impact WMCA OOW
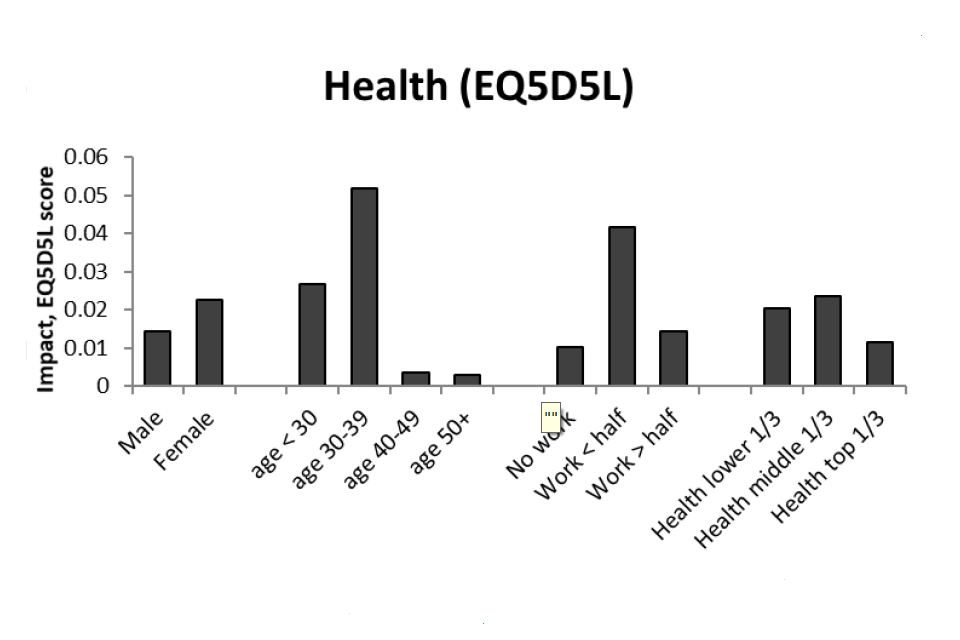
Source: Estimates using baseline and 4-month survey data, all respondents
Figure 4-28 Wellbeing subgroup impact WMCA OOW
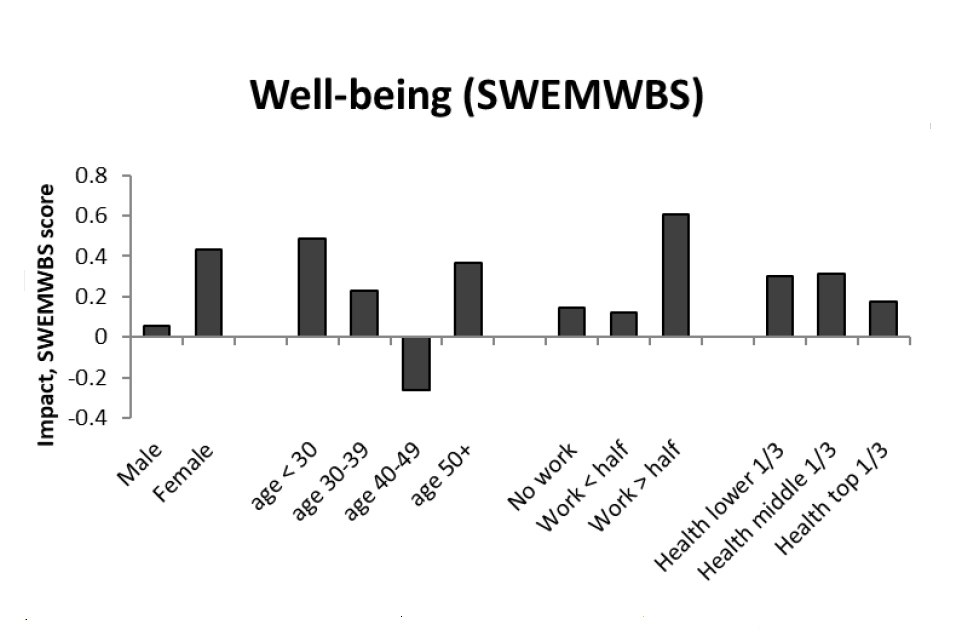
Source: Estimates using baseline and 4-month survey data, all respondents
Figure 4-29 Job search self-efficacy subgroup impact WMCA OOW
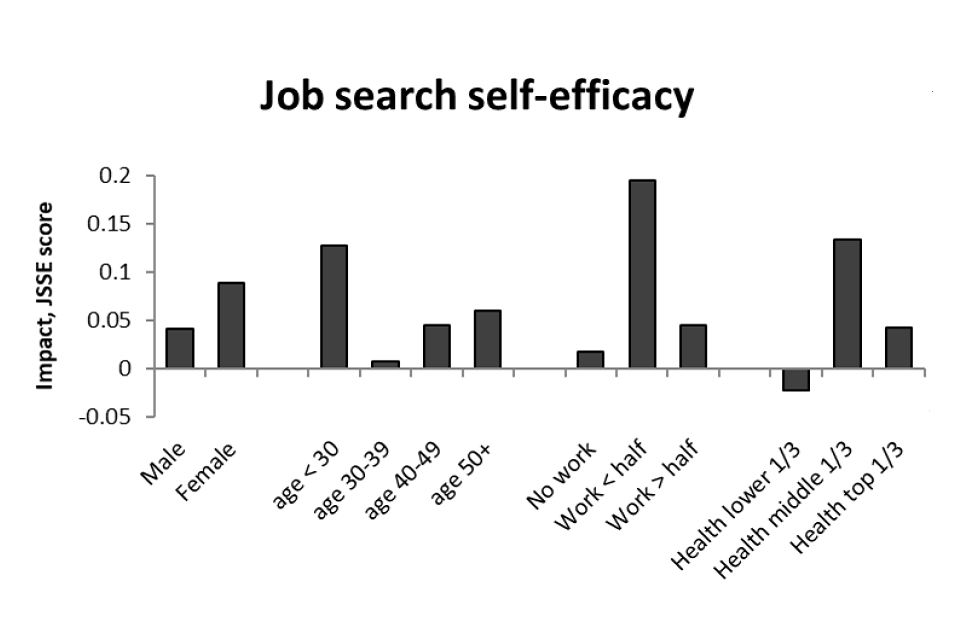
Source: Estimates using baseline and 4-month survey data, all respondents
4.3.5 SCR/WMCA out-of-work at randomisation
Summary
Pooling the two groups who were not in paid work at randomisation increases statistical power of the impact estimates. Doing so provides weak evidence of a small positive impact on health and wellbeing (both 0.1 standard deviations). With regard to secondary outcomes, there is a small positive impact on job search self-efficacy and life satisfaction (both 0.1 standard deviations). Subgroup analysis suggests the employment effects vary with the amount of time spent in employment in the previous two years; those who had not worked or who had worked for more than half the time are more likely to have seen a positive impact.
Primary outcomes
Figure 4-30 Employment impact SCR/WMCA OOW
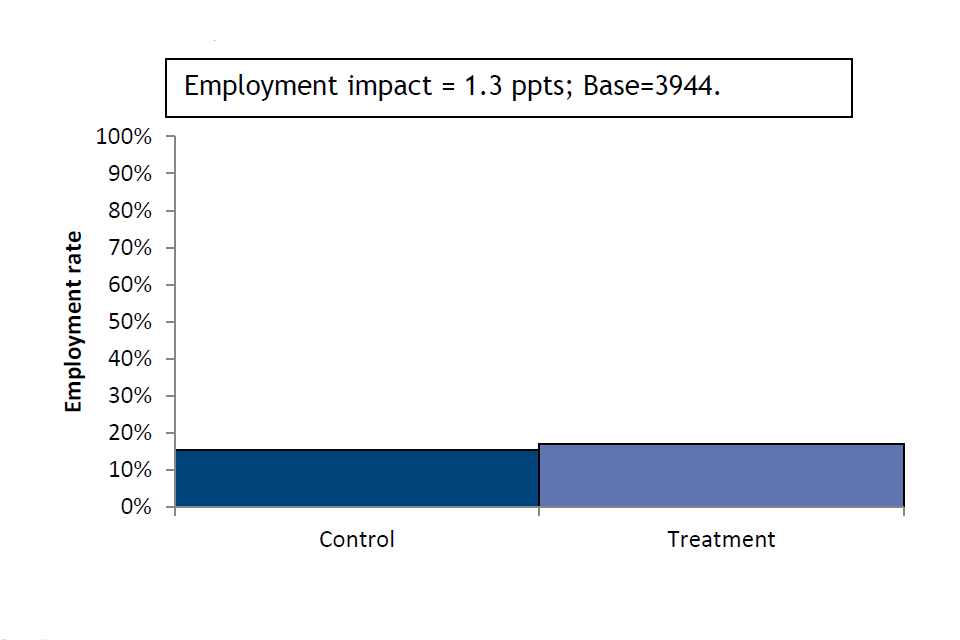
Source: Estimates using baseline and 4-month survey data, all respondents
Figure 4-31 Health impact SCR/WMCA OOW
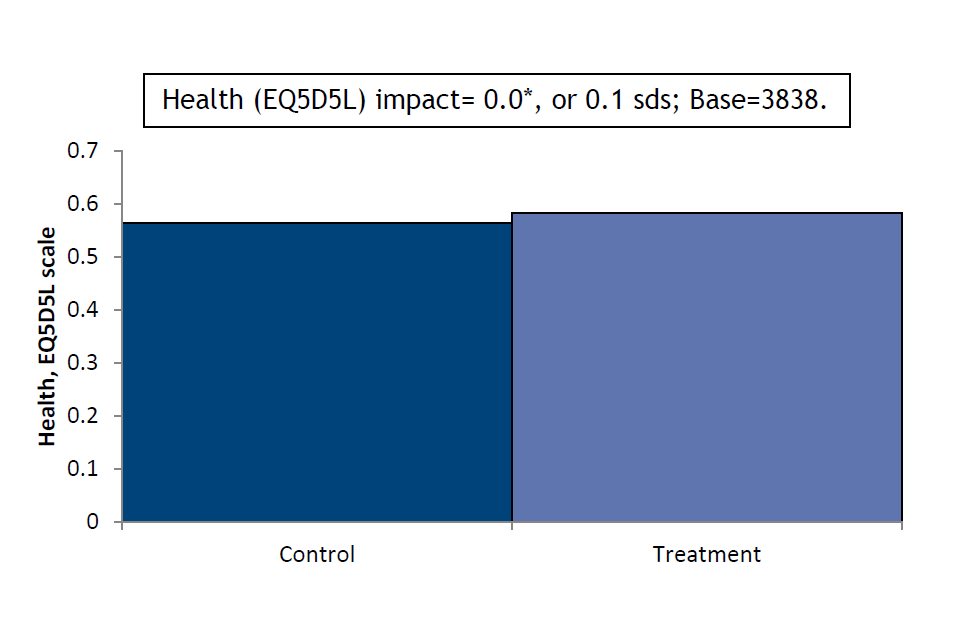
Source: Estimates using baseline and 4-month survey data, all respondents
Figure 4-32 Wellbeing impact SCR/WMCA OOW
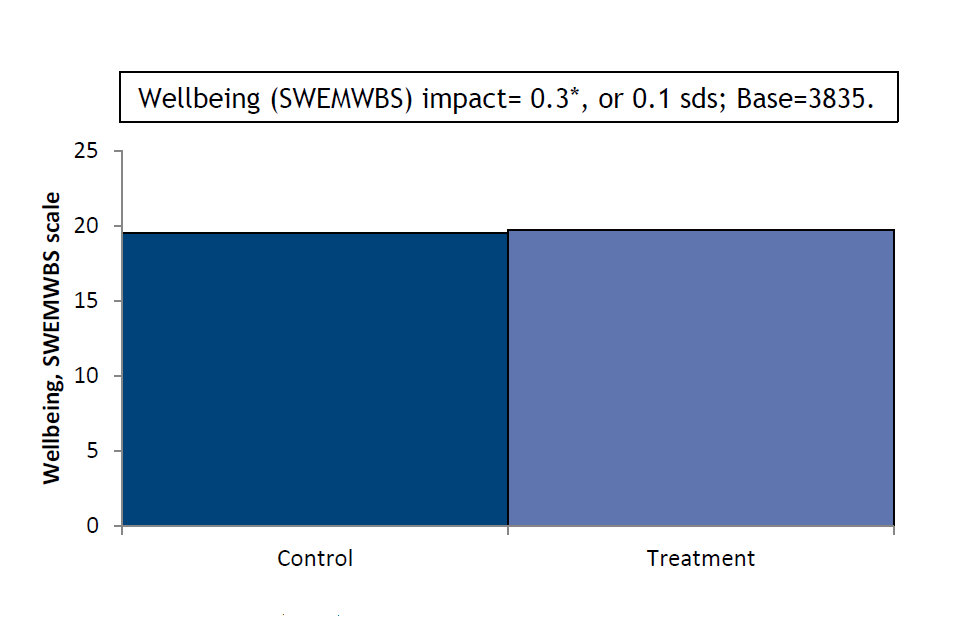
Source: Estimates using baseline and 4-month survey data, all respondents
Secondary outcomes
Table 4-15 Impact estimates on secondary outcomes (SCR/WMCA OOW)
| Characteristic | Control | Treatment | Impact | S.E. | sd.s | Base | ||
|---|---|---|---|---|---|---|---|---|
| Working 16+ hours | 0.12 | 0.13 | 0.01 | 0.01 | – | 3,944 | ||
| No. weeks in work | 1.43 | 1.47 | 0.02 | 0.12 | 0.0 | 3,920 | ||
| No. weeks in work 16+ hrs | 1.04 | 0.97 | -0.09 | 0.10 | 0.0 | 3,931 | ||
| Worked 16+ hours continuously | 0.15 | 0.14 | -0.01 | 0.01 | – | 3,942 | ||
| Job search self-efficacy | 3.10 | 3.19 | 0.08 | 0.03 | 0.1 | ** | 3,734 | |
| Musculoskeletal problems | 0.28 | 0.27 | -0.01 | 0.01 | – | 3,937 | ||
| Disability (DDA definition) | 0.29 | 0.29 | 0.00 | 0.01 | – | 3,935 | ||
| Life satisfaction (ONS1) | 4.88 | 5.06 | 0.23 | 0.08 | 0.1 | ** | 3,903 | |
| General self-efficacy scale | 26.96 | 27.37 | 0.32 | 0.22 | 0.0 | 3,497 |
Source: Estimates using baseline and 4-month survey data, all respondents
Subgroup variation among primary outcomes
Figure 4-33 Employment subgroup impact SCR/WMCA OOW
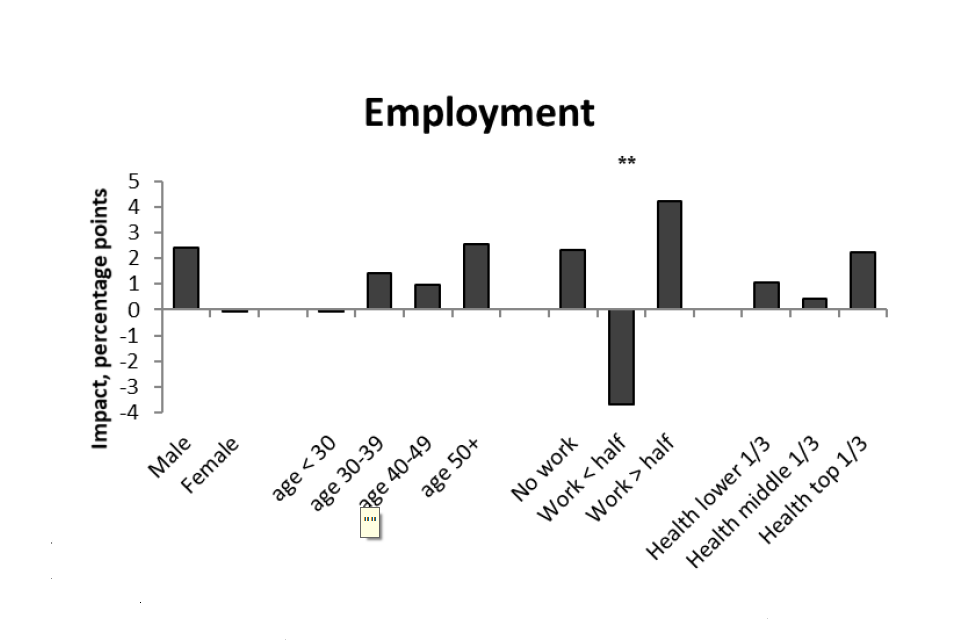
Source: Estimates using baseline and 4-month survey data, all respondents
Figure 4-34 Health subgroup impact SCR/WMCA OOW
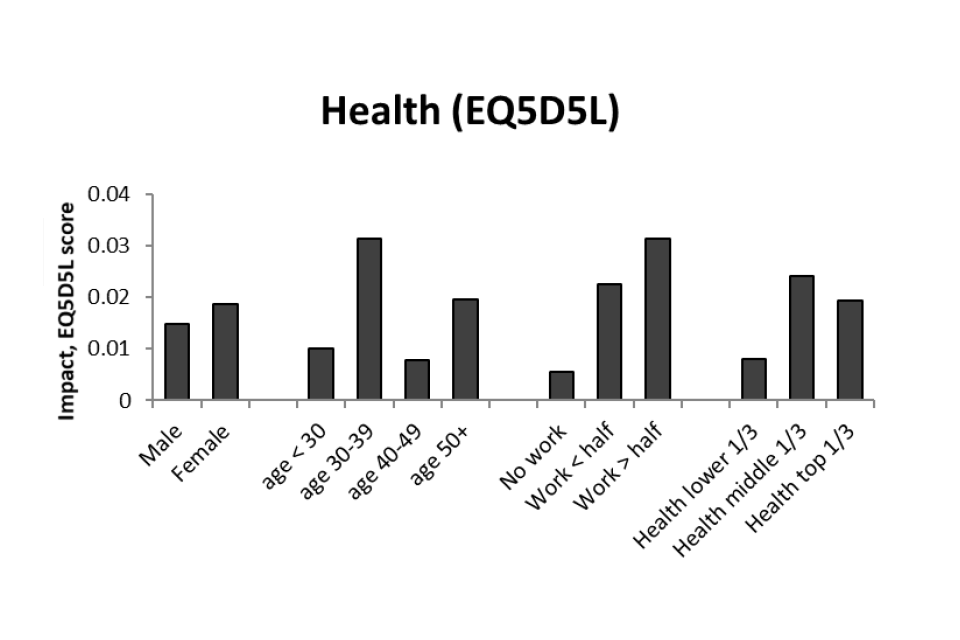
Source: Estimates using baseline and 4-month survey data, all respondents
Figure 4-35 Wellbeing subgroup impact SCR/WMCA OOW
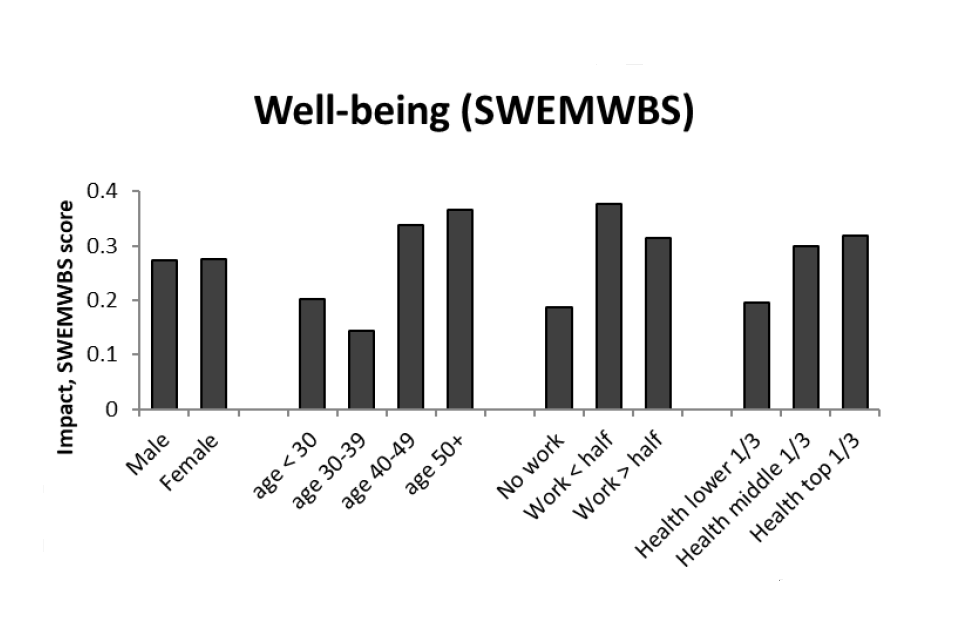
Source: Estimates using baseline and 4-month survey data, all respondents
Figure 4-36 Job search self-efficacy subgroup impact SCR/WMCA OOW
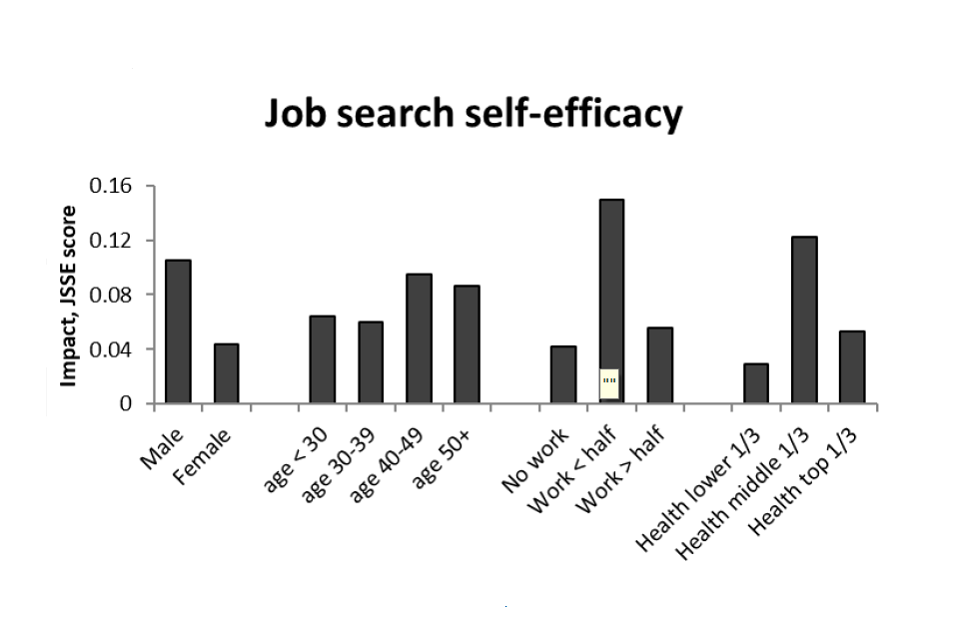
Source: Estimates using baseline and 4-month survey data, all respondents
4.4. Discussion
These results focus on outcomes observed four months after randomisation. This is with a view to capturing the short-term and in-service impacts of IPS. Longer-term impacts are reported in the 12-mont impact report using information from a second survey carried out 12 months post-randomisation and linked administrative data. The results after a year may well differ from those reported here. As evidence of this last point, the reviews of IPS fidelity across the course of the trials (see synthesis report) suggested that it took some time for the treatment to be delivered in line with IPS principles in WMCA (in SCR, there was no information on how quickly fidelity was achieved). The 12-month outcomes will partly reflect the influence of COVID-19 and the ensuing policy response, which changed the nature of the labour market and the nature of the support on offer. To provide a sense of this, note that for more than half of the people recruited to the trials the 12-month point was after the first lockdown in March 2020 was introduced. Given the vulnerable nature of the HLT population, this is likely to be an important factor.
A fundamental question is how to regard impacts based on survey data. There are two aspects to this. First, the respondent sample accounts for 55% of trial recruits, meaning that 45% are excluded from the data used to estimate impacts in this report. This raises an issue of representativeness, prompting the use of survey weights in analysis. While this helps restore representativeness, it can only do so on the basis of those influences on response that are observed. Consequently, it cannot be asserted definitively that the results hold for the trial population as a whole. Second, and more problematic, is the treatment-control imbalance in response rates, particularly in SCR. Should this be driven by some unobserved characteristic – such as the reaction to randomisation outcome or an attitude shaped by experience of IPS – there is the risk that the estimated impacts will reflect in part the effect that such characteristics can have on outcomes. Such a scenario raises a concern about the unbiasedness of estimates. For now, the analyses merely show that the baseline characteristics do not appear to differ substantially between experimental groups.
The final stage of the evaluation examines the possibility of bias more directly using outcomes taken from administrative data. These have the advantage of being linkable to the full trial population, thereby allowing impacts estimated on the respondent population to be compared with impacts estimated on the full population. It will also be informative to draw on as much information as exists on IPS fidelity, and especially in trials using IPS-LITE. For instance, it may be that response to the survey is influenced by how faithfully IPS is delivered. If this is the case, it increases the concern that the response rate differential may undermine impact estimates, since the literature suggests fidelity is related to effectiveness.
In considering the substantive results, it should be kept in mind that they relate to outcomes 4 months post-randomisation. The literature suggests that employment impacts of IPS are expected to take 4 to 6 months to materialise. Consequently, while we might expect to see increased job-related activity, it may be too early to expect impacts on more concrete employment outcomes.
With regard to primary outcomes, there is evidence of positive impacts on both health and wellbeing. This is strongest among the SCR IW group but weaker evidence is also visible when pooling the OOW groups in SCR and WMCA.
Regarding the secondary outcomes, positive impacts on job search self-efficacy were seen for the SCR IW group and for the OOW groups, once pooled across SCR and WMCA. Life satisfaction was also increased among the SCR IW group but also the SCR OOW group, as well as the pooled SCR/WMCA OOW group. There were occasional indications of subgroup variation in impacts but mostly these were not statistically significant.
5. Conclusions
This chapter draws some early conclusions from the 4-month stage of the evaluation – where a 4-month survey following randomisation took a key focus on the in-service experience of the treatment group, and reporting of the qualitative data focused on implementation issues.
Overall, findings from the implementation research indicated that the trials were perceived as useful and effective by individuals, staff and engaged partners and stakeholders. The process evaluation data alongside the IPS fidelity reviews could be interpreted to suggest the trials had taken steps towards understanding how an IPS-LITE service might need to be adapted to primary and community contexts. While the providers delivered a person-centred, low-caseload employment service, aspects, such as employer engagement and case conferencing with healthcare professions, shifted in form and focus when compared to IPS principles; nonetheless, the service was judged to be IPS.
Some key lessons included the importance of ongoing staff training and particularly focusing on building capability for employer engagement, as employment specialists could struggle with this; continued attention to relationships with GPs and health partners to foster support; the importance of location in community settings as well as being able to co-locate with other services which supported integration. Equally, if recruits in future are sourced from Jobcentre, findings indicated the importance of continued briefing on the voluntary nature of IPS support.
Overall, the treatment group were very positively disposed to the IPS support. The nature of the support seemed well matched. While the eligibility criteria did not focus on duration of worklessness on joining the trials, this was also a factor in the degree of progress made by those in the treatment group. The findings show substantial differences in respect of pre-trial employment histories between the trial groups. Health conditions also varied between trial groups, and health was seen as the major barrier for all groups. Notably, the data indicate a high degree of multi-morbidity within the population, which may indicate that recruits had more complex health conditions than envisaged when the trial was designed. Alongside this, it was notable that all trial groups reported multiple barriers to work. These differences might also explain the differences seen within attitudinal findings.
The treatment group had very positive views of the employment specialists supporting them. A majority of these respondents felt the support had a positive effect in terms of: increased motivation; confidence in their skills, abilities and deciding what type of job to do. These are crucial steps in the causal pathway identified by the theory of change, and these points were confirmed in the qualitative research such that the members of the treatment group interviewed said their confidence and motivation to find work had increased, alongside their awareness of skills and assets and self-efficacy in the job search process. More broadly:
- most treatment group respondents said that IPS support helped their ability to manage their health condition or disability. The likelihood of believing that health prevented a return to work decreased for many receiving IPS.
- members of the treatment group interviewed for the qualitative research said the trials helped them to make more appropriate use of health services as they were now seeking help and engaging at the right time to address health needs.
- those receiving IPS support in the qualitative research reported an improved understanding of their skills and assets, and increased clarity on career goals. They said the support was helpful in deciding what type of work they would like to do. Treatment group survey respondents said support had been helpful for increasing their confidence in their skills.
- treatment group members who were interviewed noted the support had significantly improved their job search techniques including better knowledge of how and where to source jobs and submit high quality job applications.
- where treatment group respondents were not working on joining the trial, the 4-month survey indicated increased levels of motivation to work.
- in interviews, the treatment group talked about improved self-confidence and self-esteem – feeling better able to set goals and see the steps needed to reach these, stemming from the trusted relationship with their employment specialist.
The trials have three primary outcomes on which impact is being tested which relate to employment, health, and wellbeing and a range of secondary outcomes some of which – such as impact on job search self-efficacy (JSSE) and more appropriate usage of health services – are viewed as intermediate outcomes in the causal pathway to the primary outcomes. The data available from the TCT at four months following randomisation demonstrated evidence of:
- positive impact on the primary health outcome measured via EQ5D5L for the SCR IW group (0.1 sd increase). In the pooled OOW trial groups weak evidence of a positive effect is also found (at the 10% confidence level);
- positive impact on the primary wellbeing measure which uses the SWEMWBS again for the SCR IW group (0.2 sd increase). In the pooled OOW group, there is weak evidence of positive impact (at the 10% confidence level);
- no significant effect on the primary outcome measure of employment status or secondary outcomes relating to employment;
- positive impact on wellbeing using a secondary outcome measure, the Office for National Statistics Personal Wellbeing Questions where life satisfaction increased for the SCR IW group (0.1 standard deviations), the SCR OOW group (0.1 standard deviation), and the pooled OOW group (0.1 standard deviation).
Across all the primary and secondary outcomes there was little evidence of sub-group variation, indicating that the observed impacts are shared evenly across all subgroups.
-
The area has since rebranded as South Yorkshire Mayoral Combined Authority ↩
-
These are included in Chapter 8 of the “Evaluation of the Health-led Employment Trials: Appendices to the four-month outcomes report”. ↩
-
Fit for Work was an occupational health assessment and advice service looking to address long-term sickness absence. Individuals could be referred by their GP or employer. ↩
-
By the end of November 2020, the SCR provider SYHA had notified ONS that only 528 from a total of 3,059 randomised to treatment group had disengaged from support. ↩
-
By November 2020, WMCA providers Remploy and Prospects had reported 265 cases of disengagement amongst a total of 1,837 who were randomised to the treatment group. Dudley and Walsall did not report any disengagements at all across the course of the trial by this time, but given the experience of other WMCA providers and in the SCR trial, this was unlikely to mean that there were not any. ↩
-
Full demographic information for survey respondents is contained in Chapter 2 of the “Evaluation of the Health-led Employment Trials: Appendices to the four-month outcomes report”. ↩
-
Devlin, N., Shah, K., Feng, Y. et al. (2017) Valuing health-related quality of life: An EQ-5D5L value set for England. Health Economics, 23.06.17: 1-16. ↩
-
Szende, A., Janssen, B., Cabases, J., eds. (2014). Self-Reported Population Health: An International Perspective based on EQ-5D. Springer Open: London. Pg. 46. ↩
-
The term ‘job advisor’ was used in the survey questionnaire, which has been substituted for ‘employment specialist’ for clarity and consistency within the report. ↩
-
These are included with the [registered protocols for the trials: http://www.isrctn.com/ISRCTN68347173 (SCR) and http://www.isrctn.com/ISRCTN17267942 (WMCA) ↩
-
The p-value is calculated from a formula based on dividing the treatment-control difference (ignoring whether this is positive or negative) by its standard error (a measure of the sampling variability of this difference). ↩
-
All impacts were estimated using linear regression, as described in the SAP. ↩
-
Cohen, J. (1988) Statistical Power Analysis for the Behavioral Sciences. Routledge. ISBN 978-1-134-74270-7. ↩
-
See algorithm 2.8 of Westfall-Young (1993) ↩
-
Shown as asterixis to denote significance level. *** p<0.001, ** p<0.01, * p<0.05 ↩