Place-based approaches for reducing health inequalities: annexes
Updated 28 September 2021

© Crown copyright 2021
This publication is licensed under the terms of the Open Government Licence v3.0 except where otherwise stated. To view this licence, visit nationalarchives.gov.uk/doc/open-government-licence/version/3 or write to the Information Policy Team, The National Archives, Kew, London TW9 4DU, or email: psi@nationalarchives.gov.uk.
Where we have identified any third party copyright information you will need to obtain permission from the copyright holders concerned.
This publication is available at https://www.gov.uk/government/publications/health-inequalities-place-based-approaches-to-reduce-inequalities/place-based-approaches-for-reducing-health-inequalities-annexes
Annex 1: Data on health inequalities
Local data for prioritisation
PHE’s Segment Tool has been recently updated, whilst the new local Health Inequalities Dashboard has been published at a local level for the first time, helping local authorities to identify the main conditions, behaviours and wider determinants driving health inequalities in their areas.
Given the emerging and evolving local geographies, a specific health inequalities data pack for ICSs has also been produced alongside this framework. This is a set of practical examples that illustrate how the place-based approach can be used by local health and care systems to bring together and analyse relevant data to inform the development of plans for health inequalities.
A summary is provided in our inequalities tool data table of some sources of local data and its potential uses to inform local action. As an example, a local area can utilise the following sequential approach using the range of data available to agree priorities for health inequalities is provided below:
- identify priorities for local area using measure of burden/risk factors (for example GBD burdens or local information on health or social care service use
- consider comparators, national standards or local targets to estimate relative size of gaps (for example other similar local authorities or CCGs)
- examine within-area inequalities (for example LKIS slide sets, NHS RightCare Inequalities Packs, Local Health, SHAPE, and the Health Equity Dashboard)
- examine the main factors driving inequalities across the full causal pathway including conditions, behaviours and wider determinants (for example Segment Tool, Atlases of Variation, Health Equity Dashboard, Wider Determinants Tool)
- consider care pathways relevant to care priorities. Look to other systems with similar populations but better outcomes (for example RightCare Inequalities Packs and LKIS slide sets)
This data is invaluable for identifying and prioritising issues to address in local areas with the greatest potential impact on health inequalities.
National analysis of the wider determinants, behaviours and conditions associated with health inequalities
This section provides national data to prioritise important factors driving health inequalities ordered through the 3 levels highlighted in the Labonte Model (wider determinants, healthy behaviours, health conditions):
Wider determinants of health
The 6 policy areas within the Marmot Review [footnote 1] provide a prioritised list for action. They are set across the life course and listed below:
- best start in life
- maximising capabilities through skills and education over the lifecourse
- good employment
- healthy standard of living
- sustainable places and communities (including housing)
- strengthening the role and impact of ill-health prevention
The table below illustrates the extent of health inequalities across many of these domains at a national level:
Table 1 Health inequalities across a selection of wider determinants of health
| Marmot domains | Indicators | Most deprived decile | Least deprived decile | Ratio of high to low |
|---|---|---|---|---|
| Best Start in Life | School readiness % of children not achieving good level of development at end of reception [footnote 2] | 32.5 | 24.6 | 1.3 |
| Maximising Capabilities through skills & Education | 16-17 year olds Not in Education or Employment (%) 2017 [footnote 3] | 7.6 | 5.5 | 1.4 |
| Good employment | People aged 16-64 in employment (%) 2017/18 [footnote 4] | 66.7 | 80 | 0.8 |
| Healthy Standard of living | Density Fast Food Outlets (Crude rate per 100,000) 2014 [footnote 5] | 114.4 | 61.4 | 1.9 |
| Sustainable places and communities | Fuel Poverty (%) [footnote 6] | 15.1 | 8.1 | 1.9 |
| Strengthening role & impact of ill health prevention | Access to Health Assets & Hazards Index (%) 2016 [footnote 7] | 37.2 | 5.9 | 6.3 |
This table highlights widespread disparity in the wider determinants of health across England, showing an unequal playing field for people to lead a healthy life.
Making progress on the wider determinants requires action at a national level. However Local Authorities are well placed to act on all of these determinants and are currently providing an important leadership role in driving a health in all policies approach.
Level B: Healthy behaviours
The Global Burden of Disease (GBD) is an annual global assessment of the health of populations. The estimates of GBD is available within England at Upper Tier Local Authority level (UTLA).
These UTLA estimates allow the investigation of how varying levels of deprivation (Index of Multiple Deprivation 2015) between UTLAs may affect morbidity and mortality.
GBD estimates can also inform priority setting for public health policy and practice, as the main results presented are in terms of disability-adjusted life years (DALYs), a time-based measure that combines years of life lost due to premature mortality (YLLs) and years lived with a disability (YLDs).
However, it is important to note that YLD is based on modelled estimates which are not sensitive to differences in deprivation. However, YLL data is based on death records at a fine geographic scale which is sensitive to this difference.
Therefore, the ensuing analysis focuses on YLL and mortality data due to the confidence we can infer from the results.
It is important to stress though that national and local policy action should still target drivers of morbidity and healthy life expectancy given there is clear evidence of inequalities in these as well.
For example, the proportion of five-year-olds with dental decay is nearly 3 times greater, whilst the incidence of Tuberculosis is six times greater in more deprived deciles than the least deprived deciles [footnote 8].
Bespoke analysis conducted using 2017 data for the ten most and ten least deprived UTLAs shows that the major behaviours associated with disease burden in both the most and least deprived areas are tobacco, dietary risks, alcohol and drug use.
However, whilst it is the same behaviours that are associated with the disease burden in both areas, the rate of years of life lost from tobacco and drug use are twice as high in the most deprived areas compared to the least deprived areas.
This distribution is shown in Figure 1 [footnote 9].
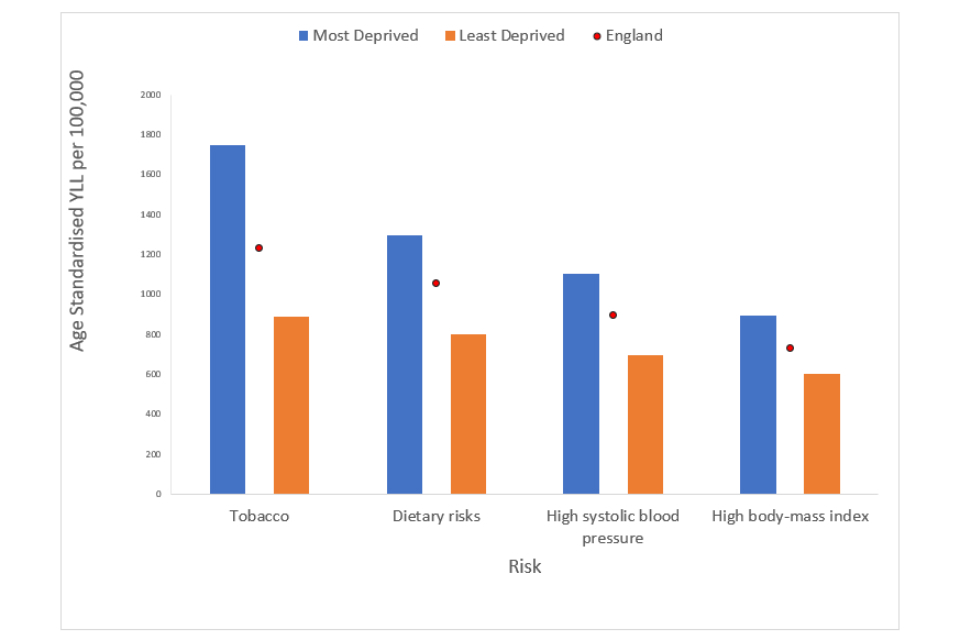
Figure 1. Age Standardised years of life lost (YLL) rate per 100,000 by risk for the most and least deprived areas in England.
Level C: Conditions and physiological risk factors
The 2017 GBD shows that the top five conditions driving premature mortality and morbidity in the 10 most deprived areas are: 1. cancer 2. cardiovascular disease 3. musculoskeletal disorders 4. neurological disorders 5. mental disorders
They make up nearly 60% of the overall burden of disease, creating a natural list of prioritised conditions. There is also extensive evidence to show that these health conditions do not occur in isolation but instead are clustered, with people in deprived areas more likely to experience multi-morbidity [footnote 10].
It is important to note that, again, these are the same conditions driving the burden of disease in the least deprived areas. However, a greater proportion of people experience them, and at a younger age, in deprived areas.
The issue of early onset is shown in Figure 2 [footnote 11], which highlights the years of life lost per age group in the 10 most and 10 least deprived areas.
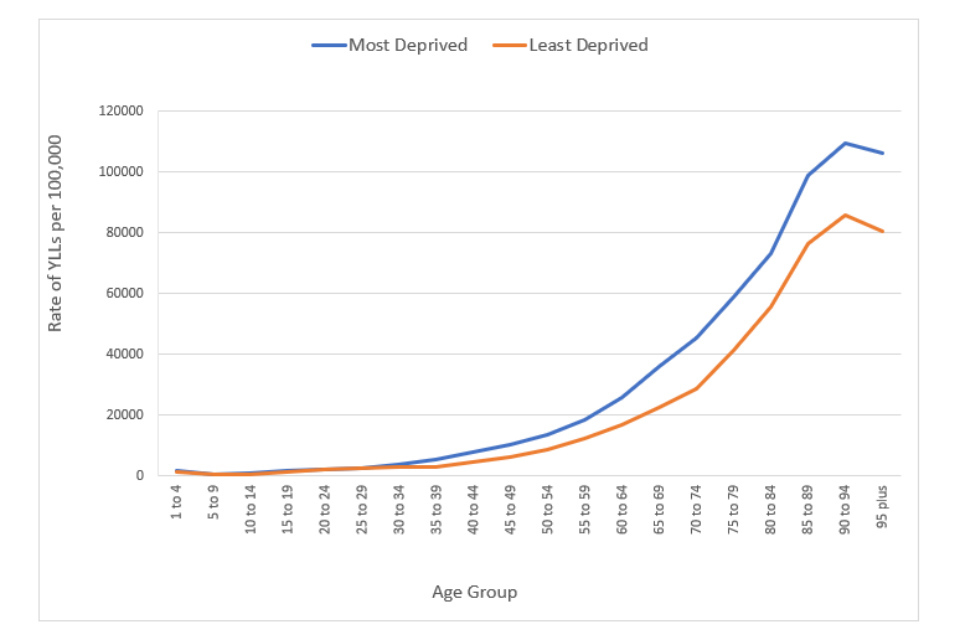
Figure 2 shows rate of years of life lost varies little between most and least deprived areas up until aged 40. After age 40 there is a gap, with deprived areas having a higher rate of YLL.
This greater burden of disease highlights that all interventions should be designed to align uptake with the distribution of need. This includes:
- removing barriers to access
- distributing resources and intervention proportionately to address need so as to achieve more equal outcomes
- recognising the earlier onset of conditions in deprived areas compared to the least deprived areas
We can see this equal distribution is not being achieved yet, despite efforts by the public health and healthcare system.
For example, ‘there are significantly fewer GPs per head in the most deprived areas compared to the least deprived.
In the least deprived fifth of CCGs, there were 53 GPs per 100,000 patients, compared to 47 in the most deprived fifth’ [footnote 12].
The uptake of abdominal aortic aneurysm (AAA) screening is another example as shown in the graph [footnote 13] below.
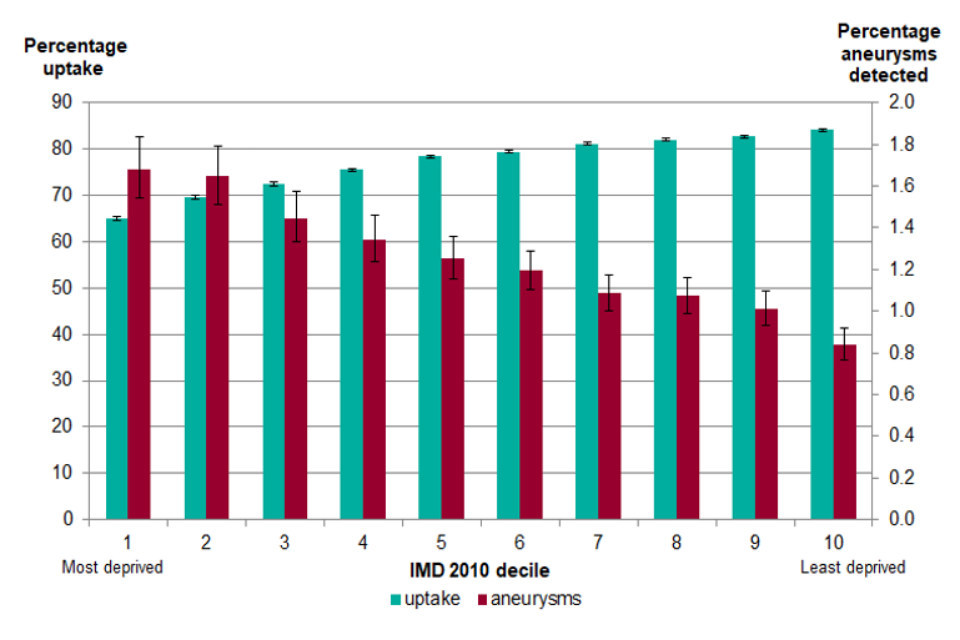
Both uptake and detection analysis of AAA shows a gradient with deprivation deciles. The least deprived decile has the lowest percentage aneurysms detected but the highest percentage uptake of the programme.
Achieving a more equal distribution of uptake will not only save lives but also has the potential to save money. For example, Figure 4 illustrates that elective care decreases slightly with deprivation.
Given that a higher burden of disease would be expected in more deprived areas, this would suggest that the distribution of elective care is not matching the burden of need.
Conversely, emergency care is more likely to be accessed by people living in the most deprived areas, at a cost of an estimated £4.8 billion in hospitalisations per year [footnote 14].
This would suggest that there are cost savings by identifying earlier entry points to improving health outcomes for those living in deprived areas, including access to elective care, primary care, as well as further upstream approaches addressing the wider determinants of health.
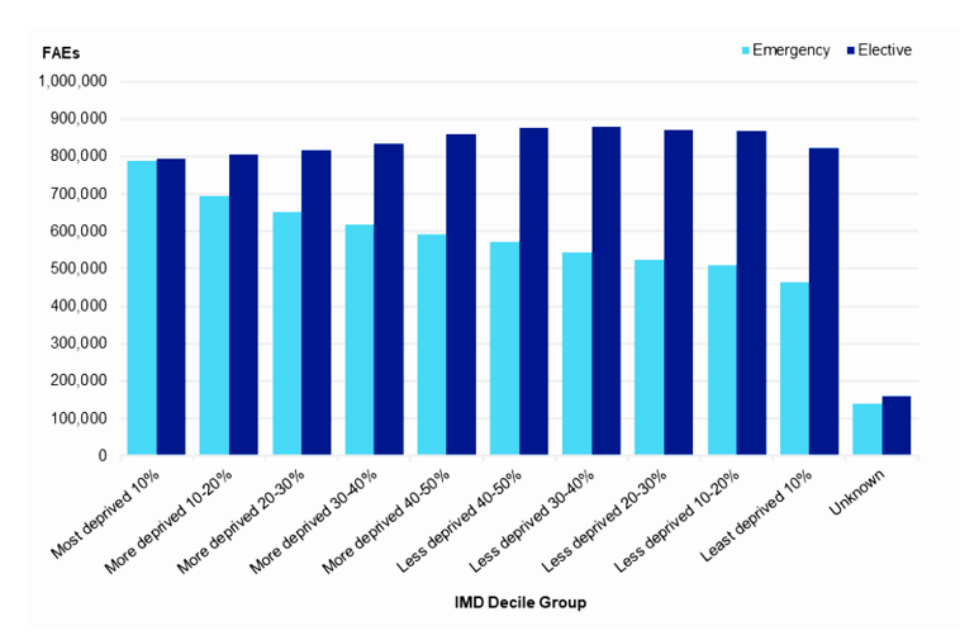
Figure 4 shows that elective admissions show little variation across deprivation decile.
Annex 2: Roles and responsibilities of local institutions
A clear understanding of the different roles and potential actions of different organisations is a critical component of effective action to address health inequalities.
The following section draws on the evidence of effective approaches for addressing health inequalities set out throughout this framework, in the PHE publication ‘system, scale and sustainability’ [footnote 15], as well as wider in other systems approaches.
It provides further detail about the potential role and contributions to addressing health inequalities that different sectors and institutions could make.
Duties and potential actions for place-based approaches to health inequalities:
Health and Wellbeing Boards:
Health and Wellbeing Boards (HWB) have a duty to encourage integrated working between health and social care commissioners, the HWB, and commissioners of health-related services such as housing, and local government services [footnote 16].
Examples of good practice by HWBs to address health inequalities include:
- working with Directors of Public Health to undertake analysis of the main drivers of inequalities in health outcomes and access in an area
- developing integrated ‘SMART’ (specific, measurable, achievable, realistic and time-bound) plans to reduce health inequalities
- developing plans which incorporate the principles of system, scale and sustainability - and specific actions from all partners to address the wider determinants of health
- ensuring plans include locally agreed short, medium and longer-term targets to reduce health inequalities
- engaging with Voluntary, Community and Social Enterprise (VCSE) sector and local residents to ensure actions build connected and empowered communities
- ensuring local communities, community and voluntary sector organisations and statutory services work together to plan, design, develop, deliver and evaluate health and wellbeing initiatives
Local authorities:
Local authorities have a responsibility to meet their duties in The Health and Social Care Act [footnote 17], the Care Act [footnote 18], and the Social Value Act [footnote 19].
The Health and Social Care Act [footnote 20] requires local authorities to take such steps as they consider appropriate for improving the health of the people in their areas.
The terms of the Public Health Grant to local authorities indicate that a local authority must, in using the grant have regard to the need to reduce inequalities between the people in its area, with respect to the benefits that they can obtain from that part of the health service provided in exercise of the functions referred to in paragraph 3 (public health functions as specified in Section 73B(2) of the National Health Service Act 2006 (“the 2006 Act”) [footnote 21].
The Care Act 2014 [footnote 22] indicates that local authorities must provide or arrange services that help prevent people developing needs for care and support, or delay people deteriorating such that they would need ongoing care and support.
Care and support planning considers a number of different things, such as what needs the person has, what they want to achieve, what they can do by themselves or with the support they already have, and what types of care and support might be available to help them in the local area.
In addition the Social Value Act 2012 [footnote 23] requires public sector commissioners – including local authorities and health sector bodies – to consider economic, social and environmental wellbeing in the procurement of services or contracts.
Creating social value has clear connections with efforts to reduce health inequalities through action on the social determinants of health – for example, by improving employment and housing.
Examples of the kind of actions that local authorities could consider to address health inequalities include:
- working with other system leaders to develop integrated SMART plans at neighbourhood and place-level, underpinned by analysis of local drivers of, and protective factors for addressing, health inequalities, including individual and community assets
- ensuring plans capture all council functions and local authorities’ place-based function in addressing health inequalities
- engaging community members and voice in planning and delivery, especially from the most marginalised communities
- identifying measurable cross-council targets for addressing health inequalities
- identifying and prioritising action with a specific focus on addressing health inequalities as part of delivering Care Act wellbeing duties
- considering how regulatory and other functions can contribute to place-based plans to better address health inequalities (for example planning, licensing, environment, transport, environmental health, leisure)
- utilising community-centred approaches to improve health and wellbeing, and building social capital to help communities to reduce inequalities
- working with employers, including the NHS, to improve access to employment and the health and wellbeing of employees
- considering addressing inequality by devolution of power and resources from the local to community level, through integrating communities into local decision making in line with findings from the Due North inquiry report [footnote 24].
Clinical commissioning groups
CCGs have duties regarding health inequalities under the NHS Act 2006 as amended by the Health and Social Care Act 2012 and Social Value Act 2012 (see details in local authority duties).
Examples of the kind of actions that public-sector commissioners, including CCGs, could consider to address health inequalities include:
- ensuring commissioning plans have a specific focus on improving the health of people with the poorest health outcomes fastest
- identifying and closing the gaps in care which have the most impact on health inequalities
- ensuring that all screening and vaccination programmes are designed to support a narrowing of health inequalities in access, uptake and outcomes
- ensuring procurement processes formally assess impact on health inequalities
- considering the potential of service models to inadvertently increase health inequalities (for example are psychosocial factors likely to impact on accessing services for some groups)
- undertaking and acting upon Health Equity Impact Assessment of plans and services
- using formal mechanisms to proactively identify people who are most likely to benefit from earlier intervention – based on the identification of risk, and early diagnosis
- targeting resources to support them and transforming care models and pathways to improve access, experience and outcomes
- employing targeted use of personal budgets and personalisation, to empower individuals and communities including those in positions of disadvantage
Sustainability Transformation Partnerships/ Integrated Care Systems
The NHS Long Term Plan indicates that ICSs provide stronger foundations for working with local government and voluntary sector partners on the broader agendas of prevention and health inequalities.
Examples of the kind of action that STPs or ICSs could consider to address health inequalities include:
- setting out specific measurable goals for narrowing inequalities, in line with the NHS Long Term Plan requirement. During 2019 they will set out how they will specifically reduce health inequalities by 2023 to 2024 and 2028 to 2029
- working with other system leaders, ICSs develop integrated SMART plans underpinned by analysis of local drivers and protective factors, to reduce health inequalities systematically at the different local levels of place-based organisation
- ensuring plans include co-ordinated action on the wider determinants of health including employment and poverty
- undertaking Health Equity Audit (HEA) plans, and completing audit change cycles
- ensuring plans include locally agreed short, medium and longer-term targets to address health inequalities at system, place and neighbourhood level
- ensuring plans engage the most marginalised communities in setting, delivering and monitoring priorities
- engagement with VCSE organisations, and inclusion of civil society organisations in strategic approaches
Health and social care (HSC) service providers
Examples of the kind of action that HSC service providers could take to support delivery of the NHS Long Term Plan, and the Care Act ambitions on Health Inequalities, include:
- targeting services to the needs of individuals, families and communities most likely to experience health inequalities (including through utilising available data, for example demographic, equality and diversity or wider determinants data)
- the use of evidence-based risk stratification tools, for example, the Patient Activation Measure (PAM) offers different levels of wellbeing support depending on individuals’ health literacy as part of targeted self-care
- implementing structures that engage community members, especially the most marginalised groups, in decision-making about service needs, priorities and appropriate delivery methods with demonstrable resulting changes
- implementing an enhanced and targeted continuity of carer models, in particular, to help improve outcomes for the most vulnerable mothers and babies
- ensuring that by 2023 and 2024, all people admitted to hospital who smoke will be offered NHS-funded tobacco treatment services
- using their role as a system anchor to improve health outcomes through co-ordinated action on the wider determinants of health, including air pollution and employment. For example, through ‘green’ transport provision and targeted recruitment of people from deprived communities
- influencing supply chain to address health inequalities, for example through use of the Social Value Act
- utilising community-centred approaches to improving health and wellbeing
- continuing to take action on healthy NHS premises
Primary care networks
Primary care networks (PCNs) are expected to play a pivotal role, with local authority and community partners, in improving population health and reducing inequalities. They play a full part in co-producing and implementing ICS plans to reduce inequalities by 2023 to 2024 and 2028 to 2029.
PCNs from 2020 to 2021 will assess their local population at risk of unwarranted health outcomes and, working with local community services, make support available to those who need it most. The Five Year Framework for GP Contract reform [footnote 25] sets out ambitions on social prescribing including its role in addressing health inequalities, making social prescribing more widely available and accessible.
Examples of the kind of action that PCNs could take to contribute to addressing health inequalities include:
- recognising the impact of health literacy and psychosocial factors on demand, need and uptake of primary care services
- systematically targeting and adapting services to the needs of people most likely to experience health inequalities
- working closely and systematically with other front-line delivery partners to co-ordinate person and family-based approaches to addressing complex needs
- embedding community-centred approaches in their work with communities as part of developing social prescribing systems
- utilising community-centred approaches to improve health and wellbeing, building social capital to help communities to reduce inequalities
Voluntary and community sector
The Health Foundation [footnote 26] and All Party Parliamentary Committee on Arts and Wellbeing [footnote 27] have identified the contribution that specific elements of civil society make to improving health.
Examples of the kind of action that civil society organisations could take to further contribute to addressing health inequalities include:
- continuing to contribute knowledge of the strengths of local communities to inform cross-system plans to ‘grow’ the protective factors, and to better link communities with services
- further helping to create social capital to support communities to reduce inequalities
- aligning civil society resources with those of statutory partners to support the delivery of place-based plans (where appropriate)
- providing advocacy and voice for people and groups who face most barriers
Business
The Confederation of British Industry has identified the business benefits of good workplace [footnote 28] health. The Industrial Strategy [footnote 29] includes an ambition to narrow the gap between the experience (in relation to healthy independent years of life) of the richest and poorest.
Examples of the kind of action that the business sector could take to address health inequalities include:
- recognising their role as a system anchor through maximising social, environmental and economic impacts for the local communities’ benefit
- business organisations, for example, Chambers of Commerce, encouraging their members to understand the business case for addressing health inequalities, and work with others to identify opportunities for business to participate in place-based health inequalities activity
Public Health England
The Health and Social Care Act 2012 [footnote 30] placed a legal duty on PHE to have due regard to the need to reduce health inequalities. PHE does this by:
- providing data and evidence of health inequalities trends and drivers
- supporting monitoring of local, regional and national outcomes in reducing health inequalities
- sharing good practice from across the country
- providing practical tools and resources to implement joined-up place-based approaches to health inequalities outlined in this in this framework
At a local level, PHE centres and regions support local areas through place-based approaches to:
- share learning and good practice
- build capacity and co-produce work
- support local action on reducing inequalities in health through evidence, information, guidance, partnerships and advice
Supporting areas to use the tools within this work is a key means of achieving of these objectives, and there is dedicated support available at both a national and local level to do this. If you are interested in drawing on this support, please contact health.equity@phe.gov.uk
Annex 3: Fairshire
What this could look like in practice: Fairshire place-based planning to address Health Inequalities
Fairshire is home to around 320,000 people. Despite a small geographical footprint, life expectancy varies by 12 years for men and 10 years for women between the most and least deprived areas.
Although it has areas of great affluence, Fairshire remains in the 20% of most deprived districts in England, with nearly one quarter of children living in low-income families. It has a high level of premature mortality, being ranked 275 out of 324 local authorities nationally.
Health and social care systems are under significant financial pressure, and service contractual targets are being missed for A&E waits, emergency admissions and delayed transfers of care.
As part of a move towards creating integrated care systems (ICS) in which commissioners and providers agree a shared responsibility for using their collective resources to benefit local populations they aim to:
- create more robust cross-organisational arrangements to tackle systemic challenges
- support population health management, for example, recognising and supporting those at risk of developing acute illness and hospitalisation
- deliver more care through re-designed community-based and home-based services, in partnership with social care and the VCSE sector
- take collective responsibility for performance and health outcomes
These principles are reflected in the development of local place-based care systems.
Leadership and infrastructure:
The ICS System Leadership is persuaded by information from national partners (PHE; NHS England; Local Government Association) supported by local public health advice, that population problems such as the high burden of disease, and early loss of independence in the elderly relate closely to levels of deprivation in communities.
They believe that they will not meet many of the service ambitions without recognising and responding to local intelligence on measures such as the Index of Multiple Deprivation (IMD). They decided as an early principle that they will need to combine addressing health inequalities in conjunction with other frontline priorities and have committed to do so.
The multi-faceted nature of socio-economic and other inequalities will need complex and integrated solutions.
Accordingly, the local ICS management structures are designed to balance health and care service representation with ‘civic’ public sector partners; local (borough) council at the core, with links to Housing, Work and Skills, Welfare and others.
This will mean that expertise in the complexity and depth of functions will be available when scoping possible solutions to identified problems.
Rather than reinventing infrastructure, close links have been formed with statutory and other place-based infrastructures such as the Health and Wellbeing Board (HWB), with cross-membership and close communication links.
Relevant elements of the existing Health and Wellbeing Strategy, for example, could be adopted, refreshed and strengthened as appropriate and agreed.
A variety of potential barriers and gaps in joint working are being addressed upfront - through data sharing and information governance agreements. This will evolve into strong integrated solutions in prioritised areas of joint working.
There is a joint Communications Group, and strategies are being developed to disseminate co-ordinated information for internal and external audiences.
Scoping local health and wellbeing inequalities:
The statutory Joint Strategic Needs Assessment for Fairshire has been maintained as a working online document under the auspices of the HWB.
However, previous healthcare infrastructures have tended to focus on their own copious data sources - and perhaps missed out on how a more rounded ‘picture of place’ may lead to better intelligence-led solutions to problems.
Now, a working alliance has brought analysts together to provide more rounded support to integrated decision making. As well as an enriched Fairshire-wide profile, augmented neighbourhood and GP practice profiles have provided building blocks to deliver working pictures of the four agreed Locality divisions.
Maps of each show neighbourhood or ward-based shading of national IMD quintile, and add locations of GP practices, community pharmacies, children’s centres. This will provide the basis of planning graduated support based on need, and the identification of any target communities.
The analytical alliance’s augmented integrated needs assessment generated a range of outlying population outcomes.
A combination of partnership working and internal and external consultation resulted in a number of key joint priorities, including:
- enhanced use of local spending to grow the economy, and improve work, skills and employment
- early start for children - addressing outlier status for school readiness
- physical activity and exercise (adult) – an outlier in the Public Health Outcome Framework (PHOF)
- cardiovascular disease mortality – the leading cause of premature mortality and ’excess’ deaths
- ambulatory care sensitive emergency admissions to hospital. An outlier nationally and against Fairshire CCG’s Similar 10
For each identified priority, the intelligence baseline was consolidated and expanded, showing where possible the current variation and distribution of outcomes within Fairshire.
For example, ‘cluster analysis’ (such as Mosaic) differentiates communities with a high IMD which are dominated by young families and single parents, from those where there are predominantly young adults away from family.
A disadvantaged early start may be a particular risk in the former, and alcohol or drug-related harm in the latter.
Ambitions as to ‘what good would look like’ for each of these prioritised areas are agreed across the partners, including the impact on different sectors. The considerations then extended to drawing out, from experts in each sector, which of their functions and resources might contribute to ambitions for improvement.
This produced a ‘whole system’ long-list of possibilities, from which to systematically extract the shortlist of interventions offering the most realistic chance of contributing to the required dimension of change.
Selecting interventions for priority programmes:
For all of the main selected priorities, there is a good base of evidence and guidance on ‘best buys’ for maximum impact. These have already been part of mainstream programmes, but uptake and delivery have been patchy and variable across the place.
The selection of intervention for action should:
- show a refined focus on the portfolio of interventions under each priority with potential for the greatest impact at the population level
- establish how unacceptable variation in delivery can be addressed
- establish how to improve how the population uses the intervention to best effect and might be supported to do so
Fairshire partners decided the structure of their priority programmes would include a number of actions, these are listed below.
Growing the economy (as part of a major area initiative):
- work across the civic-service interface to ensure as much of the healthcare (and other nationally funded service partners’) spend is retained, to have secondary economic effects locally (for example, through procurement supply chains)
- investment in the local labour market for service employment (for example, work and skills provision - school job fairs, adjusted recruitment and retention practices and apprenticeships)
- civic-service public health, and NHS supported healthy workforce initiatives across the partnership
For early child and school readiness:
- LA commissioners and community healthcare providers agreed to reconfigure the distribution of health visitor provision and skill mix on a graduated basis to better reflect community deprivation.
- a major transformation across the early help/health care interface to integrate early years screening, assessment and targeted support
For physical activity and exercise:
- joint funding to strengthen the provision of dedicated coordinators, to develop and run low-cost exercise inclusion activities (for example, 5-a-side football street leagues, park runs, walking groups and active dance events)
- support community-centred or independent sector enterprise, to take on and maintain green or open spaces, and harness for community use including activity initiatives and events
- work across public sector workforce as exemplars to improve physical activity, for example through bike, walk and run to work initiatives, or team target-steps leagues
- work across civic service interface, to utilise staff across frontline services to actively make every contact count in identifying physical inactivity and overweight in users, and link in to social prescribing resources to capitalise, for example on above initiatives
For cardiovascular disease mortality:
- harnessing HWB channels across the civic-community interface, linking to African-Caribbean communities about awareness of high blood pressure risk, and navigating into accessible testing and supported self-management
For Ambulatory care sensitive hospital emergency admissions:
- the RightCare CCG Health Inequalities Pack identified priority wards with high deprivation scores and also outliers for excess admissions – using a two-pronged approach to address unwarranted variation in covering primary care, and community-based issues in effective connection to services
- stocktake with local authority identified levels of community action, classified using the ‘family’ of types of community engagement, that might offer better basis of connection with ‘external’ services
- where communities were identified with barriers to engagement, diagnostic being used to address bridging across the community-service interface (harness existing infrastructures (for example, through community safety, work and skills, using housing sector community venues)
For each portfolio of agreed interventions, the potential dimensions of practical change were estimated or modelled. Realistic timescales to potential measurable impact were also plotted, taking into account factors such as commissioning cycles, recruitment and training, roll-out beyond ‘rapid adopters’, as well as the gestation of change of the interventions themselves.
For health inequalities, targets have included short, medium and long gestation measures.
Potential relative change was estimated between target communities and the average for the system. Armed with these practical realities, targets have been set which attempt to match the ambitions from when the priority objective was set.
Good use has been made of realistic benchmarks, with similar clusters of local authority and CCG for example.
As an example, Fairshire has set targets to bring emergency admission rates in outlying ‘priority’ wards down to the average for those with similar deprivation scores, within 2 years.
This will contribute to the target for Fairshire as a whole reaching admission rates in line with the best 5 of the CCGs Similar 10 cluster.
Detailed planning clearly built on strong evidence and intelligence base of interventions, followed by the design of implementation pathways that:
- drew in whole system partners
- had clear objectives, backed with transparent assumptions
- drew on appropriate benchmarked experience
- established agreed contributions from partners
- identified and costed where investments or shifted resources would be necessary
- mapped how benefits would contribute to priorities across organisations
- identified the potential contribution to agreed system priorities
- demonstrated benefits in terms of system affordability going forward - not unrealisable savings
The plans were accordingly built into strong narratives as a business case for consideration by the ICS and Health and Wellbeing Boards.
Programme management and evaluation:
For the main priority objectives, it was decided to establish a formal integrated programme management structure. The partner organisations involved agreed the necessary infrastructure resources, which were shared and mainly contributed ‘in kind’.
A designated programme manager is appointed and empowered to work across agencies to oversee progress, ensure slippages and barriers to plans are mitigated, and to be responsible for reporting on behalf of the whole programme to the locally relevant overseeing committee.
The separate programmes can call down support from generic services for functions such as analytical, Information Management & Technology, and Human Resources support.
The manager will ensure that elements of capacity and capability building include ‘learning together – working together’ initiatives.
The programme manager is supported to build evaluation into the programmes as they proceed, using Plan, Do, Study, Act (PDSA) type approaches to drive a reflective learning-by-doing approach.
The Health Inequalities components of strategy are being evaluated as a whole. A local academic partner has been engaged. They have been part of the planning process so as to establish baselines for the assessments.
They will produce an interim progress report at 18 months and a final report after 3 years.
Annex 4 - Methodology and definitions
Methodology
‘Place-Based Approaches for Reducing Health Inequalities’ has been developed by Public Health England (PHE), Local Government Association (LGA), and the Association of Directors of Public Health (ADPH).
Particular thanks to Paul Ogden (LGA) and Isobel Howe (ADPH) for the development of this work.
The scope of the work was informed by over 50 interviews undertaken by Ipsos Mori with local leaders from local authorities, local mayoral offices, Sustainability Transformation Partnerships (STPs), Integrated Care Systems (ICSs), Clinical Commissioning Groups (CCGs), the Voluntary Community and Social Enterprise (VCSE) sector as well as 3 focus groups with leaders from these organisations.
The population intervention triangle (PIT) has been developed by Professor Chris Bentley, independent consultant to PHE on health inequalities and director of the previous Health Inequalities National Support Team.
The Health Inequalities National Support Team (HINST) was established by the Department of Health from 2006 to support local areas to tackle health inequalities more effectively.
HINST undertook intensive ‘diagnostic’ visits to 70 targeted local areas, spending time with system leadership and providing intelligence and support to inform the development of action plans.
Although not formally evaluated, an extensive body of experiential learning resulted from the visits.
The principles and conceptual frameworks that evolved from the HINST have been updated to make them relevant and useful today.
Definitions
Absolute gradient of inequality [footnote 31]
Difference in age and sex standardised rate of unplanned hospitalisation for chronic ambulatory care sensitive conditions per 100,000 population, between the most and least deprived LSOAs in England.
Age standardised mortality rates [footnote 32]
Age-standardised rates adjust for differences in the age structure of populations and allow comparisons to be made between geographical areas and through time.
Access to Health Assets & Hazards Index [footnote 33]
The Access to Healthy Assets and Hazards (AHAH) index is designed to allow policy/decision makers to understand which areas have poor environments for health, and to help move away from treating features of the environment in isolation.
The AHAH index is comprised of 3 domains:
- access to retail services (fast food outlets, gambling outlets, pubs, bars and nightclubs, off licences, tobacconists)
- access to health services (GP surgeries, A&E hospitals, pharmacies, dentists and leisure centres)
- physical environment (access to green spaces, and 3 air pollutants: NO2 level, PM10 level, SO2 level)
The AHAH index provides a summary of an area’s relative performance on these indicators (the second and third domains conceptualised as health promoting, and the first - ‘access to retail’ - as health demoting).
It therefore provides information on how conducive to good health an area is relative to other areas, for the specific indicators.
Anchor institutions [footnote 34]
Anchor institutions are large organisations rooted in local communities. They have a vast economic and social impact on local communities and are pivotal to their success and wellbeing.
The NHS has highlighted an anchor institution approach in the long term plan, recognising the importance of leveraging institutional resources to the benefit of local people.
Place-based Voluntary, Community and Social Enterprise (VCSE) organisations can also be important community anchors that support health and wellbeing in neighbourhoods [footnote 35].
Civic level interventions
The various tiers of local authority have a wide range of civic functions (700+), some are mandated from national government and others determined by local democratic process, for example - transport, planning, education, employment, built environment and welfare.
Community centred approaches [footnote 36]
Communities include neighbourhoods, workplaces, schools and other groups of common interest, culture or religion.
These can use their assets within civic infrastructure, resources and support, working with services that listen, engage, adapt and empower people to become involved in some aspects of their health and wellbeing.
Community-centred approaches [footnote 37] involve working in partnership with communities to mobilise assets, strengthen social connections, promote equity and increase people’s control over their lives.
Correlation coefficient (r2) [footnote 38]
A measure of association that indicates the degree to which 2 variables have a linear relationship. It ranges from 0 (not very good) to 1 (perfect).
Crude Rate per 1,000 live births [footnote 39]
The number of infant deaths is divided by the number of live births in the same area and multiplied by 1,000.
Density fast food outlets crude rate per 100,000 [footnote 40]
The number of fast-food outlets is divided by the population of the area and multiplied by 100,000.
Deprivation deciles [footnote 41]
Deprivation deciles are defined using the Index of Multiple Deprivation 2015.
They are created by ranking lower super output areas (LSOA) within each area from most to least deprived and dividing these into ten categories with approximately equal numbers of LSOAs in each.
Disability adjusted life years (DALYs) [footnote 42]
The sum of years lost due to premature death (YLLs) and years lived with disability (YLDs). DALYs are also defined as years of healthy life lost.
Health Equity Audit [footnote 43]
A Health Equity Audit (HEA) is a review procedure, which examines how health determinants, access to relevant health services, and related outcomes are distributed across the population.
It advises decision-makers at all levels of governance to prioritise resources in the planning of policies, strategies, and projects in a way that reduces health inequities.
Health in all policies [footnote 44]
An approach to policies that systematically and explicitly takes into account the health implications of the decisions made, and targets the key social determinants of health - an approach that looks for synergies between health and other core objectives, and aims to reduce inequity.
Life expectancy at birth [footnote 45]
A summary measure of the population. It represents the average number of years that would be lived by babies born in a given time period according to the mortality rates for that time period.
Place-based approaches [footnote 46]
Place-based working is a person-centred, bottom-up approach used to meet the unique needs of people in one given location by working together to use the best available resources and collaborate to gain local knowledge and insight.
By working collaboratively with the people who live and work locally, it aims to build a picture of the system from a local perspective, taking an asset-based approach that seeks to highlight the strengths, capacity and knowledge of all those involved.
Population health management [footnote 47]
One of many tools for using data to guide the planning and delivery of care to achieve maximum impact on population health.
It often includes segmentation and stratification techniques to identify groups of patients (and sometimes wider population groups) at risk of ill health and to focus on interventions which can prevent that ill health or equip them to manage it.
Population intervention triangle
Triangular model developed to describe the interrelated segments, through which it is possible to make a measurable change at a population level through a place-based approach.
Population outcomes through services (POTS)
POTS is a framework of 14 elements that together determine whether implementation of evidence-based interventions on a local basis are able to produce the optimal outcome at the population level.
Relative index of Inequality [footnote 48]
This is a measure of inequality. The relative index of inequality (RII) is a measure of the social gradient in an indicator and shows how much the indicator varies with deprivation (by deprivation decile).
It takes account of inequalities across the whole range of deprivation within England and summarises this into a single number. The relative index of inequality (RII) represents the proportional difference in the indicator across the social gradient from most to least deprived
Sector led improvement [footnote 49]
Approach to improvement put in place by local authorities and the Local Government Association (LGA).
The following principles underpin the approach to sector-led improvement in local government:
- councils are responsible for their own performance and improvement and for leading the delivery of improved outcomes for local people in their area
- councils are primarily accountable to local communities (not government or the inspectorates) and stronger accountability through increased transparency helps local people drive further improvement
- councils have a collective responsibility for the performance of the sector as a whole (evidenced by sharing best practice, offering member and officer peers, and so on)
Service based interventions [footnote 50]
High quality services, such as therapies for people with heart disease are frequently focussed on the benefit to individuals to produce good outcomes.
If they are delivered with sufficient system, scale and sustainability, those successes can add up to population-level change.
Slope Index of Inequality [footnote 51]
This is a measure of inequality. The slope index of inequality (SII) is a measure of the social gradient in an indicator and shows how much the indicator varies with deprivation (by deprivation decile).
It takes account of inequalities across the whole range of deprivation within England and summarises this into a single number. The measure assumes a linear relationship between the indicator and deprivation.
The slope index of inequality (SII) represents the absolute difference in the indicator across the social gradient from most to least deprived.
Social prescribing [footnote 52]
Social prescribing sometimes referred to as community referral is a means of enabling GPs, nurses and other health and care professionals to refer people to a range of local, non-clinical services.
Whole system approaches [footnote 53]
A whole systems approach seeks to link together many of the influencing factors to tackle health and social challenges and will require coordinated action and integration across multiple sectors including health, social care, planning, housing, transport and business to bring about major change.
Years lived with disability (YLDs) [footnote 54]
Years of life lived, with any short-term or long-term health loss.
Years of life lost (YLLs) [footnote 55]
Years of life lost due to premature mortality.
Annex 5: Further resources to inform action on health inequalities.
Physical and mental health conditions
Health condition
- Improving access for all: reducing inequalities in access to general practice services (NHS, 2017)
- Reducing Health Inequalities Through New Models of Care (UCL, 2018)
- Improving Health Literacy (PHE, 2015)
- Local Health and Care Planning: Menu of Preventative Interventions (PHE 2016)
- Health Matters: Reducing health inequalities in mental illness (PHE, 2018)
- Cardiovascular Disease: Identifying and supporting people most at risk of dying early (NICE, 2008)
- Population health framework for healthcare providers (Provider Public Health Network, 2019)
Behaviours
Smoking
- Smokeless Tobacco: South Asian Communities (NICE, 2012)
- Behaviour Change: Individual Approaches (NICE, 2014)
- Towards a smokefree generation: A Tobacco Control Plan for England (PHE, 2017)
- CLeaR local tobacco control assessment (PHE, 2014)
Poor diet/ lack of activity
- Health Equity Pilot Project (HEPP) Scientific report on evidence-based interventions to reduce the socio-economic inequalities in diet and physical activity (European Commission, 2017)
- Health Inequalities: dietary and physical activity-related determinants (European Commission Science Hub)
- Obesity and inequities. Guidance for addressing inequities in overweight and obesity (WHO, 2014)
- BMI: Preventing ill health and premature death in black, Asian and other minority ethnic groups (NICE, 2013)
- Obesity: Working with local communities (NICE, 2017)
Substance misuse
- Alcohol and inequities. Guidance for addressing inequities in alcohol-related harm (WHO, 2014)
- Alcohol, drugs and tobacco commissioning support: principles and indicators (PHE, 2018)
- Local alcohol services and systems improvement tool (PHE, 2017)
- Drug misuse prevention: targeted interventions [NG64] (NICE, 2017)
- Coexisting severe mental illness and substance misuse: community health and social care services [NG58] (NICE, 2016)
Wider determinants
Psycho-social risks
- Health and wellbeing: a guide to community-centred approaches (PHE, 2015)
- Health matters: community-centred approaches for health and wellbeing (PHE, 2015)
- Psychosocial Pathways and Health Outcomes (PHE & UCL, 2017)
- Community Engagement: Improving health and wellbeing and reducing inequalities (NICE, 2014)
Wider determinants
- Local wellbeing, local growth: adopting Health in All Policies (PHE, 2016)
- Health in All Policies a manual for local government (LGA, 2016)
- Reducing health inequalities: system, scale and sustainability (PHE, 2017)
- Tackling health inequalities through action on the social determinants of health: lessons from experience (PHE & UCL, 2014)
Poverty
Law
Educational attainment
- Improving Resilience in Schools (PHE & UCL, 2014)
- Reducing the number of young people not in employment, education or training (NEET) (PHE & UCL, 2014)
- Social and emotional wellbeing in primary education (NICE, 2008)
- Social and emotional wellbeing in secondary education (NICE, 2009)
Unemployment
- Promoting good quality jobs (PHE & UCL, 2015)
- Increasing employment opportunities and retention for older people (PHE & UCL, 2014)
- PHE/BITC Toolkits https://wellbeing.bitc.org.uk/tools-impact-stories/toolkits
- https://www.aomrc.org.uk/wp-content/uploads/2019/04/Health-Work_Consensus_Statement_090419.pdf
Environment
- Fuel poverty and cold home-related health problems (PHE & UCL, 2014)
- Improving Access to Green Spaces (PHE & UCL, 2014)
- Excess winter deaths and illness and the health risks associated with cold homes (NICE, 2015)
- ‘Reducing Inequities in Early Childhood Mental Health: How Might the Neighbourhood Built Environment Help Close the Gap? A Systematic Search and Critical Review’, International Journal of Environmental Research and Public Health, 2019
References
-
Marmot M. Fair society, healthy lives: The Marmot Review: strategic review of health inequalities in England post-2010. 2010. ↩
-
Public Health England. Health Profile for England. 2018. ↩
-
Kings Fund. Tackling multiple unhealthy risk factors: emerging lessons from practice. 2018. ↩
-
Longevity Science Panel. Life expectancy: Is the socioeconomic gap narrowing?, 2018. ↩
-
Asaria M, Doran T, Cookson R. The costs of inequality: whole-population modelling study of lifetime inpatient hospital costs in the English National Health Service by level of neighbourhood deprivation. Journal of Epidemiology and Community Health. 2016;70(10):990. ↩
-
Public Health England. Reducing health inequalities: system, scale and sustainability. 2017. ↩
-
LGA., ADSO. Health and wellbeing boards: A practical guide to governance and constitutional issues. 2013. ↩
-
UK Parliament. Health and Social Care Act [Legislation]. 2012. ↩
-
The Care Act 2014 ↩
-
Public Services (Social Value) Act 2012 ↩
-
UK Parliament. Health and Social Care Act [Legislation]. 2012. ↩
-
Department of Health. Local authority circular: public health ring-fenced grant 2019/20. 2018. ↩
-
UK Parliament. Care Act [Legislation]. 2014. ↩
-
UK Parliament. Public Services (Social Value) Act [Legislation]. 2012. ↩
-
Inquiry Panel on Health Equity for the North of England. Due North: Report of the Inquiry on Health Equity for the North. Centre for Local Economic Strategies, University of Liverpool; 2014. ↩
-
NHS England and the BMA General Practitioners Committee. A five-year framework for GP contract reform to implement the NHS long term plan. 2019. ↩
-
Corry D. How charities help to keep the country well. Health Foundation; 2018. ↩
-
All-Party Parliamentary Group - Arts Health and Wellbeing. Inquiry Report. Creative Health: The Arts for Health and Wellbeing. 2017. ↩
-
CBI. Time for employers to place workplace health & wellbeing front of mind. 2018. ↩
-
HM Government. Industrial Strategy: Building a Britain fit for the future. 2017. ↩
-
UK Parliament. Health and Social Care Act [Legislation]. 2012. ↩
-
www.england.nhs.uk/wp-content/uploads/2018/11/Technical-annex-1819.pdf ↩
-
www.gov.uk/government/publications/health-profile-for-england-2018/methods-data-and-definitions ↩
-
Locality, 2016 How to keep it local. Available from: https://locality.org.uk/wp-content/uploads/2018/03/How-to-Keep-it-Local.pdf ↩
-
https://assets.publishing.service.gov.uk/government/uploads/system/uploads/attachment_data/file/731682/Reducing_health_inequalities_system_scale_and_sustainability.pdf ↩
-
A guide to community-centred approaches for health and wellbeing. London: Public Health England: London; 2015 Available from: www.gov.uk/government/publications/health-and-wellbeing-a-guide-to-community-centred-approaches ↩
-
A Dictionary of Epidemiology – Edited by John M. Last 3rd Edition (1995) ↩
-
https://fingertips.phe.org.uk/profile/public-health-outcomes-framework ↩
-
https://fingertips.phe.org.uk/profile/public-health-outcomes-framework ↩
-
www.local.gov.uk/health-all-policies-manual-local-government ↩
-
www.gov.uk/government/publications/health-profile-for-england-2018/methods-data-and-definitions ↩
-
www.kingsfund.org.uk/sites/default/files/2018-11/A%20vision%20for%20population%20health%20online%20version.pdf ↩
-
www.gov.uk/government/publications/health-profile-for-england-2018/methods-data-and-definitions ↩
-
www.local.gov.uk/sites/default/files/documents/25.59%20-%20SLI%2C%20Public%20Health%2C%20Prevention%20and%20Intervention%20prospectus_v02_PRINT.pdf ↩
-
https://assets.publishing.service.gov.uk/government/uploads/system/uploads/attachment_data/file/731682/Reducing_health_inequalities_system_scale_and_sustainability.pdf ↩
-
www.gov.uk/government/publications/health-profile-for-england-2018/methods-data-and-definitions ↩
-
www.gov.uk/government/publications/social-prescribing-applying-all-our-health/social-prescribing-applying-all-our-health ↩
-
www.leedsbeckett.ac.uk/wholesystemsobesity/a-whole-systems-approach/ ↩