DESNZ annual report 2025 to 2026: Performance report (HTML)
Updated 19 August 2026

© Crown copyright 2026
This publication is licensed under the terms of the Open Government Licence v3.0 except where otherwise stated. To view this licence, visit nationalarchives.gov.uk/doc/open-government-licence/version/3 or write to the Information Policy Team, The National Archives, Kew, London TW9 4DU, or email: psi@nationalarchives.gov.uk.
Where we have identified any third party copyright information you will need to obtain permission from the copyright holders concerned.
This publication is available at https://www.gov.uk/government/publications/desnz-annual-report-and-accounts-2025-to-2026/performance-report
Accounts presented to the House of Commons pursuant to section 6(4) of the Government Resources and Accounts Act 2000
Report presented to the House of Commons by Command of His Majesty
Ordered by the House of Commons to be printed on 16 July 2026
© Crown copyright 2026
HC 304
ISBN 978-1-5286-6645-9
E03633638 07/26
Correction slip
Title: Department for Energy Security and Net Zero Annual Report and Accounts 2025-26
Session: 2026-27
HC 304
ISBN: 978-1-5286-6645-9
Ordered by the House of Commons to be printed 16 July 2026
Correction
Text currently reads:
Page 80 of the published document includes a table with the dates 2025-26 and 2024-25.
Text should read:
The table dates should be 2024-25 and 2023-24.
Date of correction:
24 July 2026
Purpose of the performance report
The performance report contains 2 sections, which are as follows:
The performance overview provides information on how the DESNZ group is structured, along with a short summary of our priorities, performance and risks during the financial year.
The performance analysis builds on the performance overview, to provide more detail on the DESNZ’s performance. This section covers:
- our performance during the financial year
- the risk profile for the department
- a financial review
- our sustainability report
- our performance in other areas
Performance overview
Statement of the Secretary of State
Since the start of the Iran war, our department has been focused on fighting people’s corner in the face of global events and learning the right lessons from the second fossil fuel shock in half a decade.
Even before this latest shock, the affordability crisis was the biggest issue facing Britain. The driving purpose of our government is to tackle it. That is why we have taken an average of £150 of costs off energy bills for the years ahead, expanded the Warm Home Discount to a total of around 6 million families, supported vulnerable families reliant on heating oil and accelerated our Warm Homes Plan to upgrade as many homes as we can ahead of the winter.
As we act to support families and businesses, the overriding lesson of recent months is that Britain needs to go further and faster to get off the rollercoaster of international fossil fuel markets.
For 2 years now we have been moving at speed on our mission for clean homegrown power that we control and electrification of the economy.
In that time we have secured enough power for the equivalent of 23 million homes through 2 record breaking renewables auctions; invested in the biggest nuclear building programme in half a century, from Sizewell C to small modular reactors at Wylfa; set up Great British Energy, which is already installing solar on hundreds of schools and hospitals to cut their bills; broken down the barriers to getting Britain building, from our planning system to the grid; and set out our plan to continue to use the North Sea for decades to come as we manage existing oil and gas fields for their lifetime including introducing Transitional Energy Certificates, alongside driving forward on wind, carbon capture, hydrogen and other technologies.
We are already seeing the impact of our mission, with over £90bn of private investment announced in clean energy between July 2024 and March 2026 and more than a million jobs now supported by the UK’s net zero economy, according to CBI Economics. This has only been possible because of the partnership we have built between government, businesses, trade unions and civil society, and the progress we have made in 2 years is just the start of what we can achieve together.
I want to thank everyone across our department and beyond it for their hard work and continued commitment to driving this vital agenda—for energy security, lower bills, good jobs and growth today, and to protect our home for future generations.
The Rt Hon Ed Miliband MP
Secretary of State for Energy Security and Net Zero
Statement of the Permanent Secretary
Since joining the department in March 2026, I have seen first-hand the breadth and impact of the work underway. DESNZ is at the forefront of delivering on the government’s top priorities.
Recent events in the Middle East have underlined the importance of our mission and the urgency of the programme of change we are driving. This work is not only in our economic and environmental interest, but our transformed energy system is fundamental to protecting the United Kingdom against hostile states seeking to use the energy system to inflict harm.
The conflict in the Middle East has also highlighted the importance of what we do day-to-day – from our international engagement to our work across the country managing implications for energy consumers. Delivering clean power, reducing bills, supporting growth and tackling climate change are inseparable challenges, and our progress on each is essential to achieving the others.
As set out in more detail throughout this report, the department’s work over the last year has been vast in scale and scope. I would like to thank my predecessor, Jeremy Pocklington, for his work in guiding the department the past 3 years and also Clive Maxwell, for his leadership during the final 4 months of the financial year, and with whom I look forward to working to continue to deliver our outcomes. The department’s agenda is complex and demanding but we will continue to work hard to deliver the secure, clean and affordable energy our country needs.
Jonathan Brearley
Permanent Secretary and Principal Accounting Officer
Statement of the lead Non-Executive Director
The Department for Energy Security and Net Zero continues to deliver an ambitious agenda. During the year, the department has remained focused on increasing energy independence through more home grown energy, accelerating progress towards net zero, ensuring a fair deal for consumers, and supporting economic growth.
The department advanced delivery of the Clean Power Action Plan, which sets out the pathway to a clean power system by 2030. This work has remained central to the department’s outcomes, providing clarity on the steps required to decarbonise the power system while maintaining security of supply and affordability for households and businesses.
The department has continued to establish and develop Great British Energy as a publicly owned energy company, with a clear mandate to support clean, secure and domestically produced energy. Alongside this, work has progressed to set out a long-term framework for the future of energy in the North Sea. This recognises the ongoing role of oil and gas as the UK transitions to a low carbon energy system, and reflects the department’s commitment to ensuring that communities which have long supported the UK’s energy needs continue to play a central role in its clean energy future.
Great British Energy – Nuclear has remained a key component of the government’s approach to energy security and decarbonisation, with work continuing to support the delivery of new nuclear projects, providing greater certainty for industry and investors, supporting highly skilled jobs across the supply chain, and contributing to a resilient, low carbon energy mix.
Further progress has been made in accelerating the transition to net zero, supporting innovation and growth in green industries. This has included continued investment in emerging technologies to support emissions reduction, renewables deployment and improvements in energy efficiency, reinforcing the UK’s position as a leader in clean energy innovation.
Ensuring a fair deal for consumers has remained a central priority throughout the year. As part of this, work was done to improve energy efficiency and reduce energy bills by an average of £150 from April 2026. The department is delivering the Warm Homes Plan to support cleaner, more affordable heating for homes across the country.
None of this work would be possible without the continued dedication and professionalism of colleagues across the department. On behalf of the Non-Executive Board Members, I would like to thank colleagues for their continued commitment and hard work in delivering this vital agenda over the course of the year.
Ravi Gurumurthy
Lead Non-Executive Director
Our purpose and priorities in 2025–26
During this year, the department had 4 strategic outcomes:
- Enhance energy security
- Protect billpayers
- Create economic growth for the UK and generate and protect jobs
- Reduce the UK’s emissions
Our Business Model and Environment
To deliver our departmental outcomes, we:
- devise and manage policies, developing expertise on various energy and climate topics, and advising ministers on how to achieve their outcomes
- deliver public services, implementing the policies decided by ministers for the benefit of citizens
- manage taxpayer funds, ensuring financial resources are allocated effectively to deliver public policy goals and implement programmes, while adhering to auditing, reporting, and compliance requirements to demonstrate value for money and proper use of public funds
The core department carries out policy development and delivery via a structured portfolio management approach, that ensures resources are managed and allocated to achieve policy goals effectively and efficiently.
The department also collaborates with and delivers through public bodies, suppliers, local authorities, and regulators to achieve its priorities. DESNZ is supported by Integrated Corporate Services (ICS), which provides a range of corporate and support functions to DESNZ and other departments. In our policy development and implementation, we engage with a diverse range of stakeholders, including businesses of all sizes, business representative organisations, unions, research institutions, citizen groups, and direct engagement with the public.
Organisational structure
The diagram below shows the groups that made up our organisational structure. The groups are headed by Directors General (DGs). DG groups are formed of several directorates.
The corporate delivery group is overseen by a Chief Operating Officer (COO) function. This group provides corporate services, support and expert advice across DESNZ. Integrated Corporate Services (ICS) provides enabling services to a number of departments and is hosted within DESNZ.
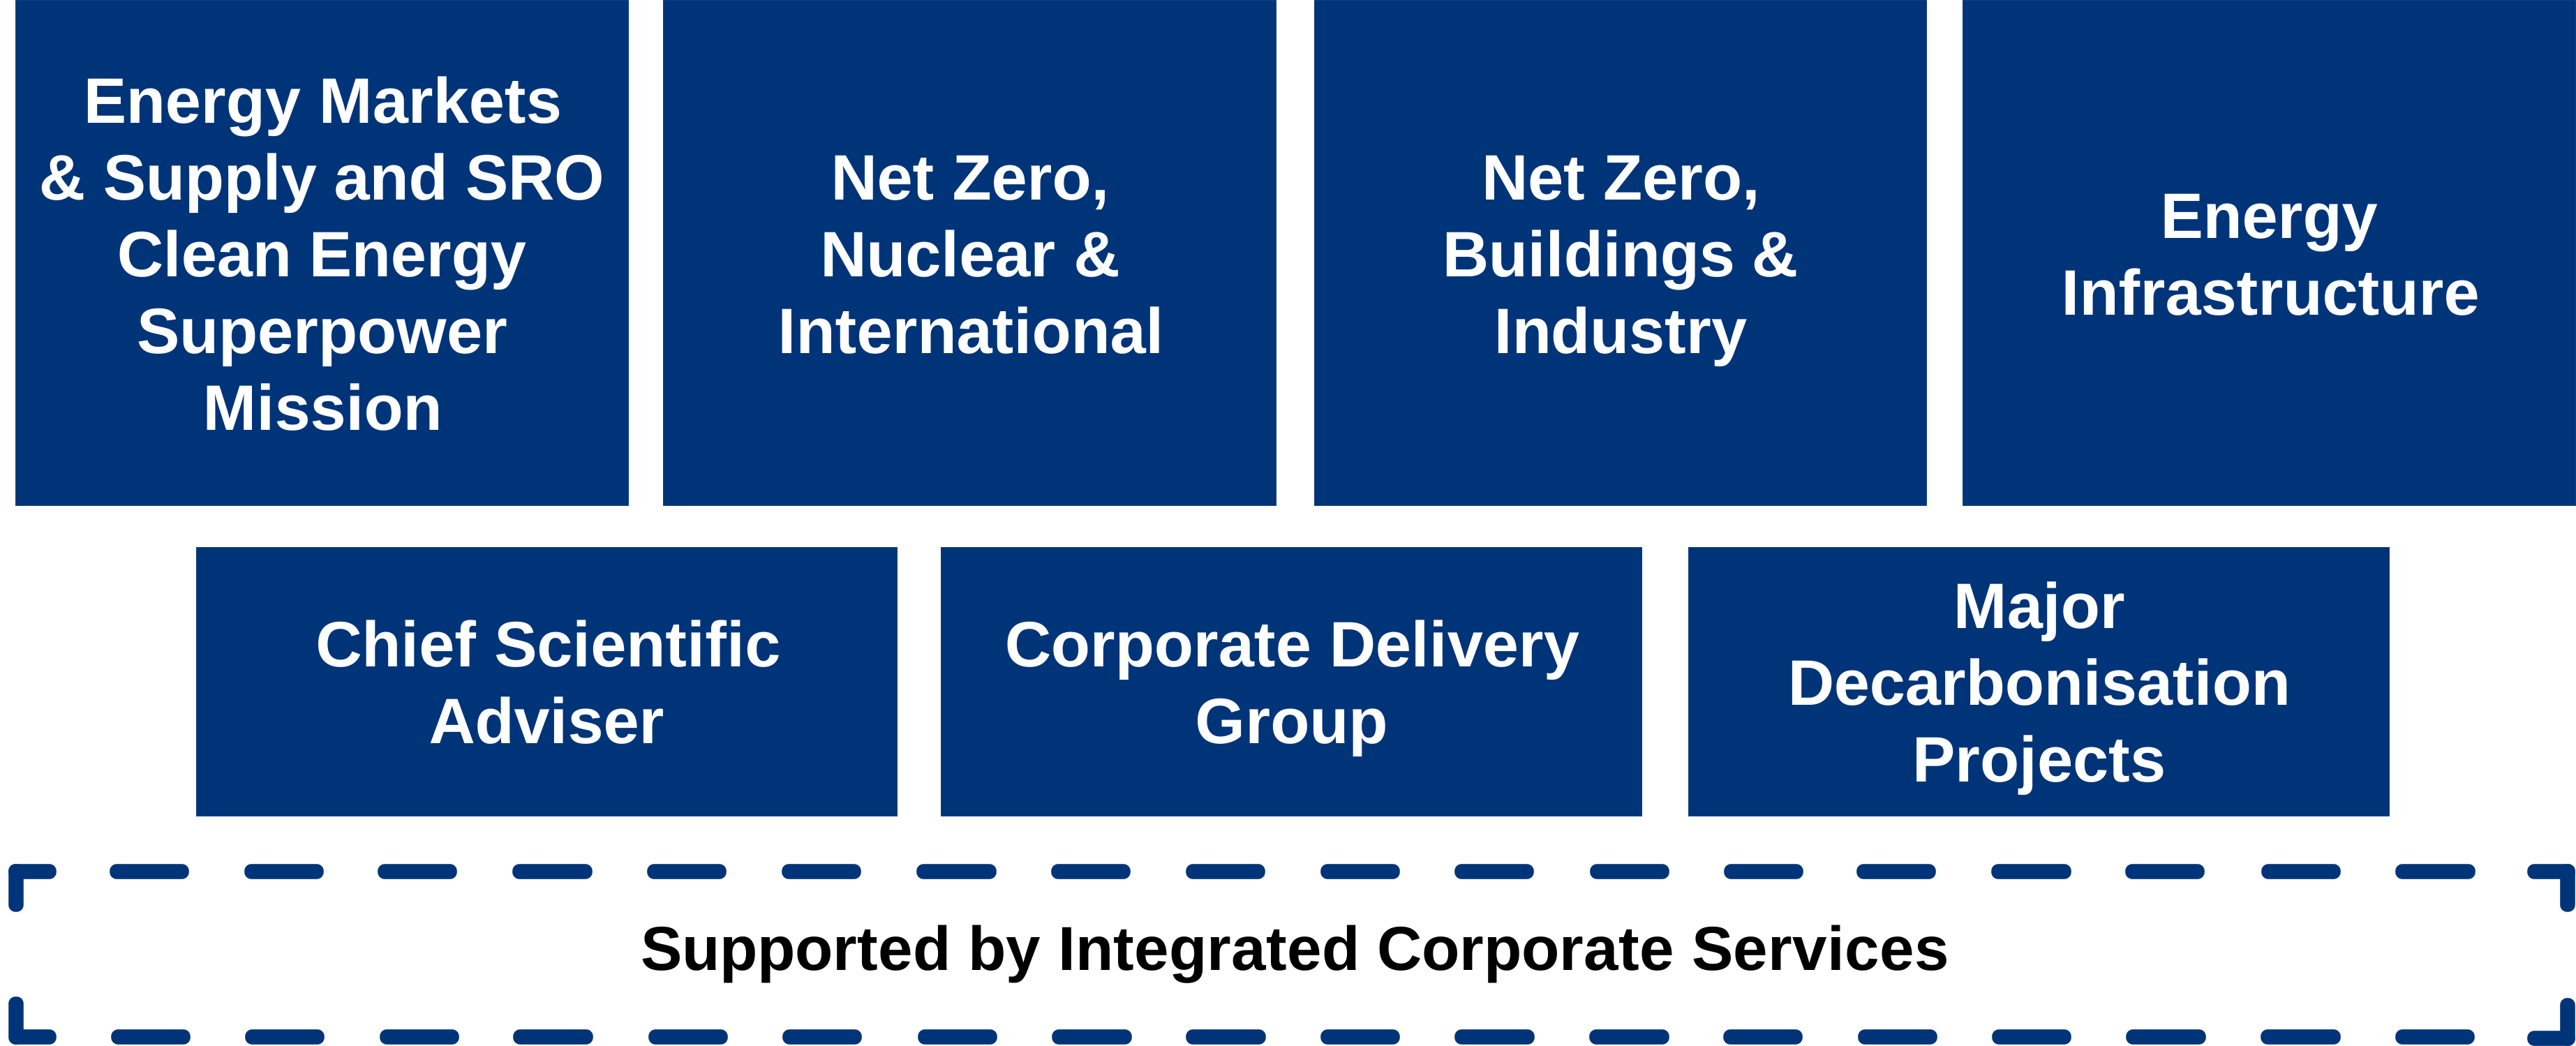
Organisational structure: diagram data
DGs:
- Energy Markets and Supply (and SRO Clean Energy Superpower Mission)
- Net Zero, Nuclear and International
- Net Zero Buildings and Industry
- Energy Infrastructure
- Chief Scientific Adviser
- Corporate Delivery Group
- Major Decarbonisation Projects
Supported by Integrated Corporate Services (ICS).
Our group
The Department for Energy Security and Net Zero Group is made up of the core department and its arm’s length bodies (ALBs) which are a combination of non-departmental public bodies (NDPBs) and companies.
Departmental group
These bodies are within our accounting boundary and are consolidated into the group accounts.
See note 26 of the financial statements on page 289 for the full list of consolidated entities. Note 26 also includes the entities whose accountability flows from the bodies and companies listed in this section.
Non-Departmental Public Bodies:
- Civil Nuclear Police Authority
- Climate Change Committee
- Committee on Fuel Poverty
- Committee on Radioactive Waste Management
- Mining Remediation Authority (formerly Coal Authority)
- Nuclear Decommissioning Authority
- North Sea Transition Authority (formerly Oil and Gas Authority)
- UK Atomic Energy Authority
Companies:
- Civil Nuclear Police Authority
- Climate Change Committee
- Committee on Fuel Poverty
- Committee on Radioactive Waste Management
- Mining Remediation Authority (formerly Coal Authority)
- Nuclear Decommissioning Authority
- North Sea Transition Authority (formerly Oil and Gas Authority)
- UK Atomic Energy Authority
- Bulb Energy Ltd
- Electricity Settlements Company Ltd
- Enrichment Holdings Ltd
- Great British Energy Group Limited
- Great British Energy – Nuclear (formerly Great British Nuclear)
- Liverpool Bay CCS Limited
- Low Carbon Contracts Company Ltd
- Net Zero North Sea Storage Ltd
- Salix Finance Limited
- Sizewell C Limited
- Sizewell C (Holding) Limited
- Sizewell C (Pledge Co) Limited
The departmental accounting boundary is similar to the concept of a group under International Financial Reporting Standards (IFRS) but is based on control criteria used by the Office for National Statistics (ONS) to determine the sector classification of the relevant sponsored bodies. The statistical guidance defines control as the ability to determine general corporate policy and this can be exercised through the appointment of directors, control of over half of the shareholders’ voting power, through special legislation, decree or regulation. The difference between the public and private sector classification of the institutional units is determined by where control over the organisation lies, rather than by ‘ownership’ or whether or not the entity is financed from public funds. Classification as public or private can therefore require judgement and ONS processes are designed to ensure that these judgements are appropriate, consistent and internationally comparable.
Within the departmental accounting boundary there are 2 Carbon Capture, Usage and Storage (CCUS) Transport and Storage Companies (T&SCos) that are wholly privately owned. Net Zero North Sea Storage Limited is an incorporated joint venture between BP, Equinor, and TotalEnergies. Liverpool Bay CCS Limited is a 100% subsidiary of Eni CCUS Holding Limited.
The financing model for T&SCos is based on the Regulated Asset Base (RAB) model with government support provided where needed to ensure the model’s finance-ability. T&SCos received a licence under section 7 of the Energy Act 2023 which renders them eligible to receive an Allowed Revenue, recouped through system charges paid by users of their network. This provides them with long-term revenue certainty and is also paired with additional government support in the form of a Government Support Package and Revenue Support Agreement, mitigating significant cross-chain and leakage risks.
The agreed model with the additional government support mentioned above has been subject to a decision by ONS to provisionally classify T&SCos to the central government sub-sector. As a result of this, all the transactions incurred by T&SCos are consolidated onto the DESNZ group balance sheet, even though the department and the public sector have no ownership or direct control over the companies. At the time of laying these accounts, ONS have not yet released their final decision on the classification of T&SCos, but on the instruction of HM Treasury we have consolidated on the basis of the interim classification decision.
The department has received an audit qualification in relation to transactions and balances managed by Liverpool Bay CCS Limited. This reflects a limitation of scope arising from independence constraints, which prevented the company’s external auditor from providing assurance to the National Audit Office. The issue stems from the interaction between an evolving public sector classification and audit framework and a novel delivery model, under which Liverpool Bay CCS Limited is required to be consolidated into the departmental group. The same limitation of scope has also resulted in a qualification of the regularity opinion. The department is working with Liverpool Bay CCS Limited and the National Audit Office to put appropriate audit arrangements in place for future reporting periods.
Wider departmental group
The Department for Energy Security and Net Zero has policy responsibility for 2 public corporations, a central government fund and a non-ministerial department, which are not consolidated in the group accounts.
Public corporations:
- United Kingdom National Nuclear Laboratory Limited
- National Energy System Operator Limited
Central government fund:
- Nuclear Liabilities Fund
Non-ministerial department:
- Office of Gas and Electricity Markets
Performance Summary on Priority Outcomes
This section summarises our departmental performance during 2025-26. See performance on priority outcomes in the performance analysis section for more details on performance, including metrics.
Spending Review
The Chancellor announced the outcome of Spending Review 25, setting budgets for all government departments up to the end of the decade.
Through the Spending Review the department secured a capital settlement of £62.8bn from 2025-26 to 2029-30 and a resource settlement of £5.8bn from 2026-27 to 2028-29. This included £13.2bn for the Warm Homes Plan; £8.3bn for GBE and GBE – Nuclear; £14.2bn for Sizewell C; and development funding for the Acorn and Viking CCUS projects.
Enhance energy security
We are moving faster on clean, homegrown power to cut bills for good, strengthen our energy security and protect the British people. Following events in the Middle East, we outlined a package of measures in March 2026 to strengthen UK energy security and protect consumers by cutting bills. This includes new plug-in solar that families can buy; bringing forward the Renewables auction to July; accelerating our Warm Homes Plan; fitting solar on new homes as standard; helping those who rely on heating oil; and confirming we will apply the lessons of the Fingleton review to other infrastructure such as renewables. The government has also taken immediate action to support consumers, including working with the Competition and Markets Authority to ensure that fuel suppliers cannot engage in unfair practices and that motorists can access clearer fuel price information. We have also stood up a response team to monitor and mitigate potential impacts from the conflict
We continued to deliver the Clean Power 2030 Action Plan, including major upgrades to the electricity grid, expanding the renewable auction process, and speeding up planning decisions to prioritise critical infrastructure. The latest renewables auction in early 2026 saw record levels of new solar and onshore wind projects and secured 8.4GW of offshore wind overall.
We worked closely with industry to improve and maintain the resilience and security of energy infrastructure. The government’s response to NESO’s North Hyde Review has set out a range of actions to improve GB energy resilience and support preparedness and response efforts. The Energy Resilience Strategy will build on this and be delivered later in the year, setting out our strategic priorities for a secure and resilient energy system, now and in the future and how we will work with industry, the regulator and wider society to deliver that. The Capacity Market is our main mechanism for ensuring security of electricity supply and has already secured the majority of Great Britain’s capacity needs out to 2029-30, with the most recent auctions held in March 2026. We have now secured 57.4GW of capacity in total for the upcoming winter in 2026-27. That includes 50.2GW secured in earlier auctions, plus 7.2GW secured in the one year ahead auction. This gives us confidence we will have enough capacity available to meet peak demand. In our main auction which secures the majority of our electricity capacity 4 years in advance, we have secured 40.1GW
We have deepened our cooperation with the EU and in December 2025, we concluded a period of exploratory talks with the EU and agreed to enter formal negotiations on the UK’s participation in the Internal Electricity Market (IEM)
We have signed an historic clean energy and energy security agreement, the Hamburg Declaration, with European leaders at the North Sea Summit in Hamburg to transform the North Sea into the world’s largest regional clean power hub. The deal means that, for the first time, North Seas countries have agreed to deliver 100GW of this offshore wind power through joint projects by 2050, including new ‘offshore hybrid assets’ — wind farms at sea directly connected to more than one country. The Summit took place just after the UK delivered a record-breaking offshore wind auction, unlocking 7,000 jobs and driving £22bn of private sector investment into the UK’s factories and ports.
The International Summit on the Future of Energy Security took place in April 2025 in London, co-hosted by the UK government and the International Energy Agency. It brought together global leaders to discuss securing energy supplies during the transition to clean energy, focusing on geopolitical risks, supply chains and technology
We are progressing work on 3 priority challenges that were set out in the Midstream Gas System Update to Market (June 2025). These are: maintaining security of supply, managing investment and affordability, and delivering a planned, orderly operational transition. We continue to work closely with the gas system operator, National Gas, Ofgem and NESO regarding resilience and supply of our system for the upcoming winter 2026-27 and beyond, whilst also progressing our response due this year to the consultation on long-term gas security, ‘Gas system in transition: security of supply’.
The government has committed to securing the long-term viability of the UK’s oil refining sector and outlining its vision for the future of the downstream oil sector remains a priority. We launched a call for evidence in February 2026 to shape the UK’s long-term strategy for the downstream oil sector. This will gather industry views on the opportunities and barriers to transition, issues and risks to energy security and what government support may be needed to promote a managed transition to net zero
Protect billpayers
This government has taken decisive action to cut bills: the measures in Budget 2025 took an average of £150 of costs off bills. This is on top of expanding the £150 Warm Home Discount to around a further 2.7 million of the poorest households
The government is also providing additional support to the lowest income households. The Fuel Poverty Strategy, published in January 2026, sets out a new plan to reduce energy costs for low-income households and lift up to 1 million households out of fuel poverty by 2030. On top of the continuation of the Warm Home Discount until 2030-31, the Fuel Poverty Strategy also commits to seeking to expand data matching so that the department can provide alternative ways to determine eligibility for support, including those not receiving means- tested benefits. In November 2025, Ofgem published an update of its Debt Strategy, aiming to support suppliers to reduce the level of debt and ensure that consumers in payment difficulty receive adequate support
We launched the £15bn ‘Warm Homes Plan’ in January 2026, the biggest home upgrade plan in British history, to help millions of families benefit from solar panels, batteries, heat pumps and insulation that can cut energy bills. The plan is for all types of households, with targeted interventions for those on low incomes; upgrades for social housing; new protections for renters; and a universal offer for all households to upgrade homes if and when they want to
The government also published a Solar Roadmap in June 2025, produced through collaboration with industry, presenting a comprehensive strategy and clear plan of action to achieve the significant increase in solar deployment needed to support the delivery of clean power by 2030. Homeowners could save around £500 from the government’s rooftop revolution
We have begun reforms to the electricity market that will create a fairer, cheaper, more secure, and more efficient energy system through Reformed National Pricing (RNP). RNP is a portfolio of interventions spanning the whole of the power sector to reform siting and investment levers to support the delivery of the Strategic Spatial Energy Plan (SSEP), further bear down on network constraint costs through accelerated infrastructure projects, smart grid technologies and operational improvements; and improve system operability and efficiency by reformed balancing and settlement arrangements. The proposals set out in the RNP Delivery Plan, published in April 2026, will achieve this by changing how and where new investment happens across our power system, and by improving the efficiency of how our system operates
We launched Fuel Finder in February 2026, a new government open data scheme for road fuel prices, to improve transparency and competition in the market, helping drivers and businesses find the best deals
Additionally, the government is working with Ofgem across a range of programmes to support consumers. The Ofgem Review was published on 22 April 2026, setting out actions to strengthen Ofgem, enabling it to deliver more effective regulation and act as a strong, robust consumer champion. In response to the Chancellor’s Regulation Action Plan, the government is working with Ofgem to consider the future of the energy retail market, including how it could better enable innovation to support consumers, system transformation and growth.
Government is working with Ofgem to review how ‘fixed’ costs, which tend to be funded through standing charges, should be recovered in the future energy system through a Cost Allocation and Recovery Review.
Create economic growth for the UK and generate and protect jobs
We published our landmark Clean Energy Industries Sector Plan in June 2025, as part of the UK’s Modern Industrial Strategy, developed with industry, trade unions, and workers across all regions of the country. The Clean Energy Industries Sector Plan sets the UK on a path to unleash the tidal wave of jobs and investment that clean energy can bring, with the government targeting at least a doubling of current investment levels across our frontier Clean Energy Industries to over £30bn per year by 2035. From July 2024 to March 2026, over £90bn of private investment has already been announced into the UK’s clean energy industries for projects and plans over the coming years.
We published our Clean Energy Jobs Plan in October 2025, setting out the workforce needed to deliver our clean energy ambitions and how the government will work in partnership with industry and trade unions to deliver it. It explains how we will help workers in all parts of the country benefit from these opportunities—supporting our existing workforce to find new opportunities, training up the next generation, and helping our young people to get good jobs. The new North Sea Future Plan sets a clear path to grow clean energy industries, support the management of existing oil and gas fields for their lifespan, and help North Sea workers and communities make the transition. Through this plan, employment in clean energy industries is expected to double to 860,000 by 2030, with high quality and well-paid jobs.
Great British Energy published its first ever Strategic Plan last December, setting out a clear, practical plan to accelerate the UK’s shift to renewable power and strengthen the nation’s industrial backbone and allow more communities across the country to control their clean energy projects. Great British Energy and government have also published the Local Power Plan, backed by funding of up to £1bn, to help support locally owned clean energy generation projects such as solar on community buildings like libraries, leisure centres and miners’ welfare clubs. Of this, GBE have already invested £255m in rooftop solar for 250 schools, and 260 NHS and military sites. Great British Energy, The Crown Estate, and industry are coming together to invest £1bn in offshore wind supply chains – addressing critical supply chain bottlenecks, supporting new infrastructure and manufacturing facilities, and creating skilled well-paid jobs.
We’re taking bold action to unlock investment in clean energy and green growth. This includes: + Expanding the Clean Industry Bonus under the Contracts for Difference scheme. In 2024, we announced £204m for more sustainable offshore wind supply chains through the Clean Industry Bonus. This will crowd in £3.4bn of private sector investment and support up to 7,000 jobs in manufacturing, factories and ports across Britain + Launching a £1bn Clean Energy Supply Chain Fund last December to support UK-based companies with high growth potential, catalysing private investment and strengthening domestic supply chains + Empowering the National Wealth Fund with £27.8bn in capital to invest in high-impact, capital-intensive projects – like carbon capture, hydrogen, gigafactories, ports, and green steel – with at least £5.8bn allocated to these sectors this Parliament + In addition, we’re taking steps to protect jobs in industrial heartlands. A winding up order was made against Prax Lindsey Oil Refinery Ltd in June 2025 and the company ceased refining in July 2025. An Official Receiver was appointed liquidator by the court, independently of the government. The government provided indemnities to the Official Receiver as set out in page 159 (Remote contingent liabilities) in this report and is funding a Training Guarantee to support employees affected by redundancy. The Official Receiver announced in January 2026 that Phillips 66 was the most credible bidder to purchase the assets of the company. The sale was completed on 28 April 2026 + In practice, UK economic growth will also be strongly bolstered by the other objectives noted in this paper. Improving UK’s energy security through reducing the reliance on fossil fuels will help shield the economy from the rollercoaster of international energy prices, with impacts on inflation, interest rates and investment levels. The OBR estimate that the cost to the taxpayer of the energy bill support in 2022-23 following the fossil fuel price spike was £41.6bn, with a wider economy cost equivalent to 2-3% of GDP if the same event occurred a decade later. Stabilising bill levels and policy stability through clear policy aligned to carbon budget emission reduction targets allows households and firms to plan their economic activity, fostering innovation and bolstering long-term productivity
Reduce the UK’s emissions
In the Spending Review 2025, this government committed £62.8bn in capital funding for clean energy, climate and nature, including nuclear – putting the UK on the path to clean power by 2030, bringing bills down in the long-term, creating thousands of good jobs for our country and tackling the climate crisis. This settlement is about taking back control of our energy to deliver energy security and lower bills for families.
Since then, we published the Carbon Budget and Growth Delivery Plan in October 2025, setting out how the UK will continue to reduce emissions in a way that lowers bills and secures good jobs, in line with the landmark 2008 Climate Change Act. It details how the cross-government package will enable the UK to meet Carbon Budgets 4-6 and sets out how the British public and businesses stand to benefit in the years ahead with economic growth, cleaner air and the protection of the nation’s natural environment for current and future generations.
We are delivering decarbonisation across the economy. In the 2025 Spending Review, the government allocated £9.4bn in capital budgets over the Spending Review period to CCUS. This will maximise deployment to fill the storage capacity of the East Coast Cluster and HyNet Cluster. This year, we have announced results of the seventh Contracts for Difference (CfD) allocation round, securing enough clean energy to power the equivalent of 16 million homes.
We also work extensively across government to drive progress and deliver the transition. That includes working with DfT, DBT and industry to deliver decarbonisation of aviation, collaborating with Defra to deliver policies that strengthen both climate and nature, and working with DHSC, MCHLG and DfE to decarbonise buildings.
The actions set out in the Carbon Budget and Growth Delivery Plan are further strengthened through a range of ‘enabling’ policies. This includes empowering local government and communities to accelerate to net zero, in line with the unique needs and opportunities of each area, accelerating the adoption and delivery of low-carbon programmes and solutions and fostering innovation specific to local contexts. In December 2025, we published our Public Participation Plan, setting out how we will involve and engage people and their communities in the policies and decisions that will help tackle climate change and deliver this mission.
At COP30 in Belém, more than 190 countries came together to reaffirm their commitment to multilateralism and to keep global warming to less than 1.5 degrees. COP30 triggered the launch of roadmaps on the transition away from fossil fuels and on deforestation. It also took many other important steps forward on issues from nature to adaptation finance. The UK Negotiations team fought hard for this outcome because it is crucial for Britain to protect future generations and because of the economic opportunities today from the clean energy transition and the protection and restoration of nature. We had a successful UK presence at COP30 with strong attendance from the Prime Minister and ministers. The UK Pavilion, packed with events, re-enforced our position as a global leader for climate action.
We are proud to have united leading nations and institutions behind our vision of a green global economy powered by a clean energy transition, taking key steps at COP30 on the Global Clean Power Alliance, launching a new investment roadmap and 5 country action plans under the Finance Mission; and announcing partners and early actions under the Supply Chains Mission. This work is all about taking practical, problem-solving actions that unblock supply chain bottlenecks, scale up clean energy investment, and strengthen energy security to build resilient economies fit for the future. This will remain our focus in 2026.
The UK exceeded its £11.6bn International Climate Finance (ICF) commitment for 21/22-25/26, alongside delivering on commitments to triple adaptation finance to £1.5bn by 2025 and sub targets on nature (£3bn) and forests (£1.5bn). DESNZ successfully invested £797m in 25/26 – it’s highest FY spend to date on ICF. Since 2011, UK ICF has helped 137 million people adapt to the effects of climate change, provided 89 million people with improved access to clean energy, and helped to mobilise billions in private investment.
This year saw significant progress on growing high-integrity carbon markets, including the launch of joint principles for using carbon credits through our Coalition to Grow Carbon Markets, further steps in implementing UN carbon markets under the Paris Agreement and a new Coalition on Compliance Carbon Markets which most of the major economies have joined, championed by Brazil.
We continued our international efforts to end coal use, with 3 new countries (Bahrain, Guatemala and the Republic of Korea) having joined the UK co-chaired Powering Past Coal Alliance (PPCA). The Republic of Korea currently operates the world’s 7th largest coal fleet.
As co-chair of the Forest and Climate Leaders’ Partnership, we delivered strong outcomes on securing forest tenure rights for Indigenous People & local communities, supporting high integrity forest carbon markets to help scale forest finance.
We launched a declaration on ‘super-pollutants’ to accelerate action on the most harmful greenhouse gases such as methane, co-hosting a summit with Brazil and China to galvanize action on this critical issue.
Adverse events
We are continuing to monitor and respond to potential impacts from the crisis in the Middle East which broke out at the end of this period, and will report more fully in next year’s report and accounts.
Leveraging private investment
Our progress to enhance energy security and reduce emissions that is described above is successfully unlocking investment: UK energy transition investment reached a record £65bn in 2025, a 32% increase in final investment decisions versus 2024 according to DESNZ analysis of the latest BloombergNEF (BNEF) data. However, the Middle East crisis has clearly raised uncertainty and market volatility while showing the need for accelerated clean energy deployment.
The UK is securing clean energy investment from domestic and international investors. CfD Allocation Rounds 7 and 7a in particular are viewed as a strong vote of confidence, having unlocked £27bn in private investment. We enable private investment through clear long-term policy signals, world leading financing mechanisms and business models, and targeted public investment, working across Great British Energy, National Wealth Fund, British Business Bank, Innovate UK and UK Export Finance, to crowd in private capital.
Principal risks
The department manages longer term strategic risks and threats, either related to our core departmental commitments such as meeting the carbon budgets and maintaining energy security, and other more functional risks around information security, staffing and policy design. The key risks faced by the department are summarised below. For further details on our risks, see risk profile in the performance analysis.
Strategic Delivery Risks managed at the Executive Committee (ExCo):
1. Energy bills rising, affecting affordability of households and businesses, driven by exposure to volatile fossil fuel prices and limited control over key cost drivers
2. Disruption to supplies of gas/electricity fuel to meet near-term demand
3. Underlying energy supplies (gas/electricity/fuel) and/or the resilience of the energy system are disrupted or undermined due to a disorderly energy transition, creating a risk to our energy security
4. Failure to meet our legally binding net zero commitments and interim climate targets (carbon budgets)
5. Failure of the UK to provide leadership and active international engagement, drawing on our strong climate credentials and domestic expertise, in the global fight to tackle climate change in line with the Paris Agreement
6. Failure to secure sufficient levels of private investment required to deliver the clean energy mission (‘net zero private investment’)
7. Catastrophic or severe incident affecting energy or nuclear critical national infrastructure
8. Potential of insufficient funding creates a risk that financial constraints could limit our ability to deliver our objectives and ambitions
Corporate Risks Managed at the People and Operations Committee (POpCo):
9. Sensitive information is compromised or lost through cyber-attack (such as a ransomware attack), eavesdropping, theft, mistakes, or leaks
10. Structural gaps in the current and future workforce
11. Departmental morale, engagement and wellbeing
12. Failure to embed Public Sector Equality Duty in policy design and delivery, resulting in inequitable outcomes and undermining delivery of the clean energy mission
13. Environmental Principles Policy Statement – non-compliance
Where we spent our money
Departmental Expenditure Limit (DEL) is the controllable budget issued by HM Treasury on behalf of Parliament to deliver our strategic objectives. It excludes Annually Managed Expenditure (AME) which represents volatile, demand-led spend and technical accounting matters. These categories are explained in the financial review section of the annual report and accounts.
In 2025-26, total DEL spend for the departmental group is shown in the diagram below. Major areas of spend are also shown by estimate line for the core department, and by entity for arm’s length bodies.
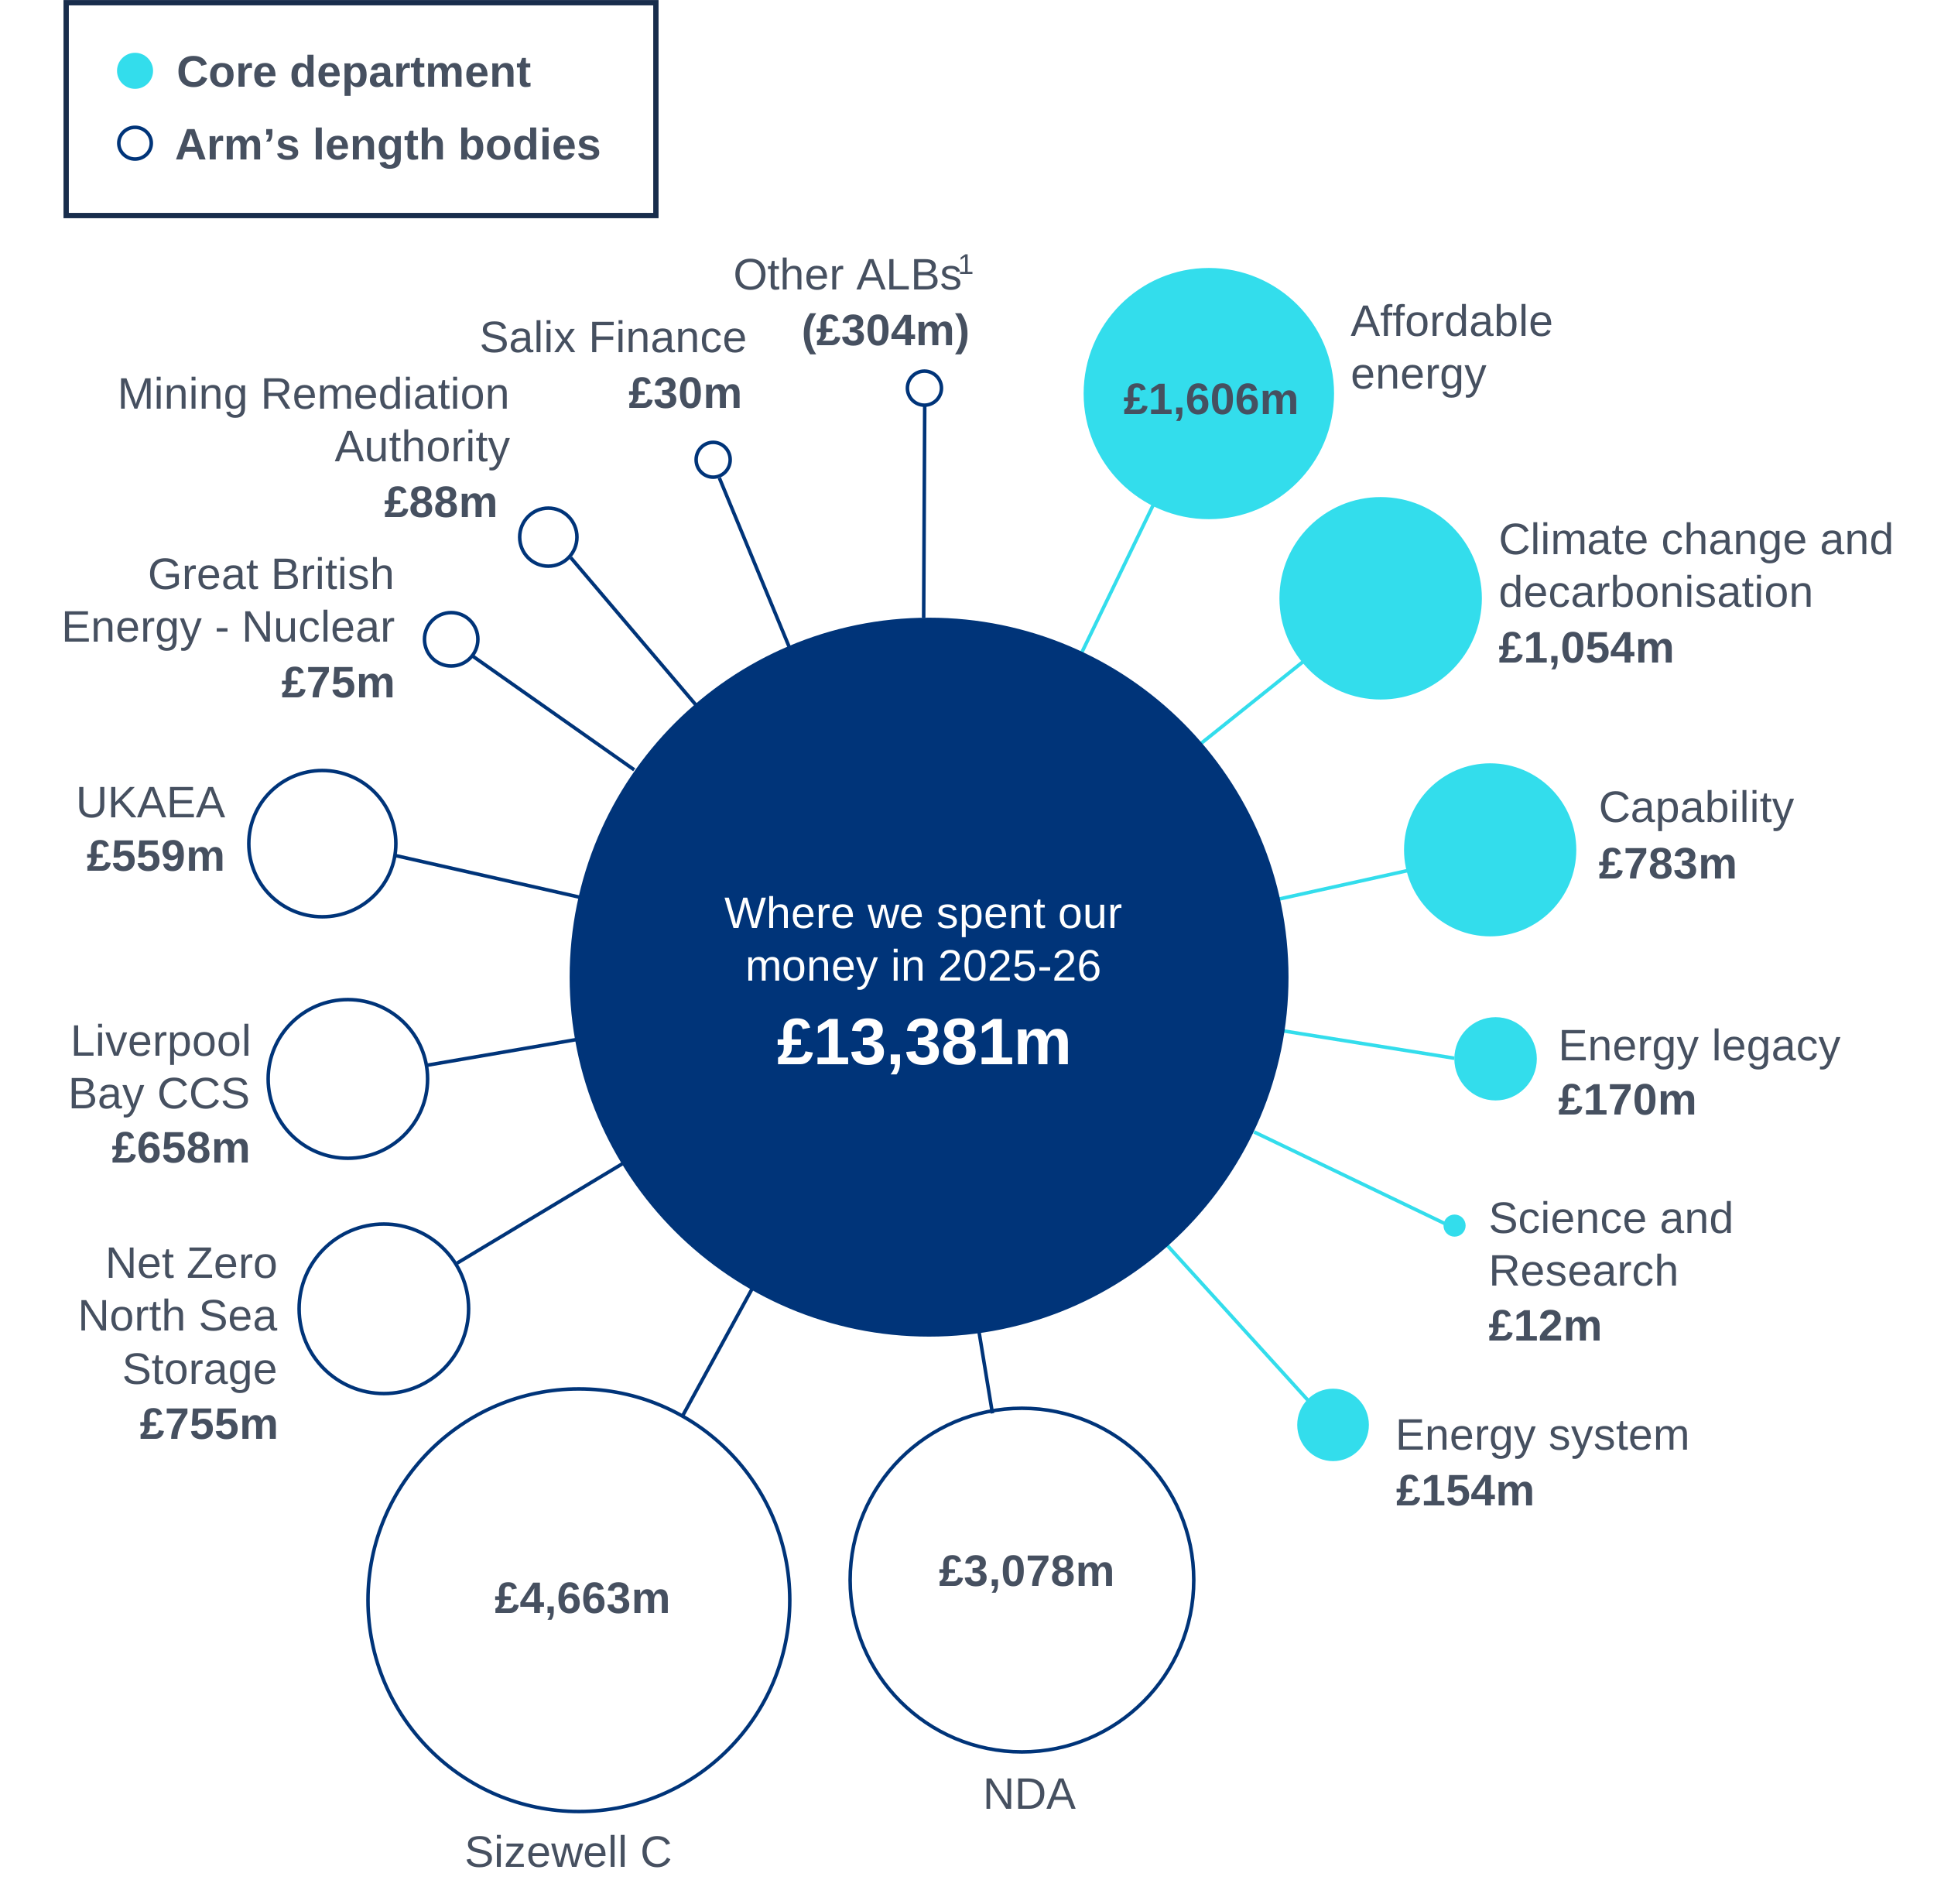
Where we spent our money in 2025-26: diagram data
| Major areas of spend | Group | Value (£m) |
|---|---|---|
| Affordable energy | Core | £1,606m |
| Climate change and decarbonisation | Core | £1,054m |
| Capability | Core | £783m |
| Energy legacy | Core | £170m |
| Science and Research | Core | £12m |
| Energy system | Core | £154m |
| NDA | ALBs | £3,078m |
| Sizewell C | ALBs | £4,663m |
| Net Zero North Sea Storage | ALBs | £755m |
| Liverpool Bay CCS | ALBs | £658m |
| UKAEA | ALBs | £559m |
| Great British Energy - Nuclear | ALBs | £75m |
| Mining Remediation Authority | ALBs | £88m |
| Salix Finance | ALBs | £30m |
| Other ALBs [note 1] | ALBs | (£304m) |
| Total | - | £13,381m |
Note:
- Other ALBs comprises of arm’s length bodies within the group boundary that are smaller in terms of financials, where these are not separately identified.
Performance analysis
Performance on priority outcomes
See the performance summary section for an overview of our departmental performance during 2025–26. This section summarises delivery against the core metrics for each of our outcomes.
Enhance energy security
Energy security was strengthened over the past year through a more coordinated and proactive approach, including maintaining a highly reliable electricity system, accelerating reforms to the Capacity Market, and advancing plans for an Energy Resilience Strategy to better manage emerging risks. The department continued to monitor and respond to global shocks, including those driven by geopolitical events, while working closely with industry to improve resilience across critical infrastructure. However, challenges remain: continued dependence on fossil fuels leaves the UK exposed to volatile global markets, and further progress is needed to strengthen long-term resilience, particularly across gas supply, infrastructure security, and system preparedness for emerging threats.
| Metric | Description | Source | Rationale |
|---|---|---|---|
| Loss of Load Expectation forecasts (LOLE) | Represents the number of hours per year in which, over the long-term, it is statistically expected that supply will not meet demand |
NESO Winter Outlook (Published, updated annually) |
Provides a comparable quantification of electricity security of supply. Gives an indication of how likely it is for the National Energy System Operator to take emergency action, such as reducing voltage or implementing some demand disconnections. This aligns with the department’s ambition to continue working closely with system operators, ensuring security of supply and the resilience of our energy system |
| N-1 Infrastructure Standard | The N-1 infrastructure test simulates the failure of the largest single piece of infrastructure and assesses whether the remaining gas system can continue to meet a level of peak demand that would be expected once every 20 years without interruption. The result is shown in millions of cubic metres per day (mcm/d). A positive number indicates surplus supply, even after the infrastructure failure |
National Gas Winter Outlook (Published, updated annually) |
The N-1 test is a critical assessment used by National Gas to evaluate the resilience and reliability of the gas transmission network. This aligns with the department’s ambition to continue working closely with system operators to ensure security of supply and the resilience of our energy system |
| Fossil Fuel Demand as a Percentage of Total Energy Demand | Captures the proportion of total energy demand that comes from gas and oil |
DUKES (Published, updated annually) |
Lower reliance on fossil fuels translates to less dependency on volatile fossil fuel markets, allowing our energy system to be price secure. This aligns directly with the government’s Clean Energy Superpower Mission of transitioning to a diverse, secure future energy system |
Loss of Load Expectation
| Year | Loss of Load Expectation (hours/year) |
|---|---|
| 2025-26 | <0.1 |
| 2024-25 | <0.1 |
| 2023-24 | 0.1 |
Source: Electricity System Operator Winter Outlook Report 2025-26
Release schedule: Annual
Note: LOLE remained below 0.1 hours in 2025-26, meaning that for the year 2025-26, it was statistically expected that supply would not meet demand for less than 0.1 hours.
N-1 Infrastructure Standard
| Year | N-1 Infrastructure Standard (mcm/d) |
|---|---|
| 2025-26 | 11 |
| 2024-25 | 55 |
| 2023-24 | 87 |
| 2022-23 | 50 |
| 2021-22 | 32 |
Source: National Gas Winter Outlook
Release schedule: Annual
Note: National Gas, in its 2025 Winter Outlook, forecasts gas margins (the difference between peak day gas supply and peak day demand) under N-1 conditions for winter 2025-26 to be 11mcm/d. This is a tighter margin compared to the previous couple of years but it is important to consider that N-1 considers 2 very unlikely events happening simultaneously. The department published a consultation in November 2025 (Gas System in Transition: Security of Supply) seeking views on our assessment of GB’s long-term supply of gas, and proposed policy actions to protect our gas and energy security during the transition. We are currently analysing the feedback.
Fossil Fuel Demand as a Percentage of Total Energy Demand
| Year | UK fossil fuel dependency (%) |
|---|---|
| 2024 (difference vs 2023) | 75.2% (-1.4%) |
| 2023 (difference vs 2022) | 76.6% (-1.6%) |
| 2022 (difference vs 2021) | 78.2% (+0.3%) |
Source: DESNZ Digest of UK Energy Statistics (DUKES): Energy, Table 1.1.1.C: Inland consumption of primary fuels and equivalents for energy use, percentage shares on an energy supplied basis.
Release schedule: Annual
Notes: Fossil fuel dependency is the share of energy consumption accounted for by coal, petroleum and natural gas. UK fossil fuel dependency dropped to 75.2% in 2024, down 3 percentage points since 2022.
Data for 2025 will be included in the July 2026 release of DUKES.
Protect billpayers
Protecting consumers from high energy costs has remained a central focus, with progress made through lower average household bills in 2025, the removal of an average £150 of costs off household bills from April 2026, expanded targeted support such as the Warm Home Discount reaching around 6 million households, and continued delivery of the £15bn Warm Homes Plan to upgrade 5 million homes and reduce long-term costs. The British Industrial Competitiveness Scheme will also cut electricity bills by up to 25% for over 10,000 businesses. Alongside this, reforms to strengthen consumer protection and address wider system costs point to a shift from short-term relief toward more structural change. Yet energy costs still place a disproportionate burden on low-income households, and more is needed to ensure the benefits of system reform and electrification are delivered consistently and fairly. The next phase will need to focus on faster delivery, better targeting of support, and making sure the gains from a more strategically planned energy system are shared equitably.
| Metric | Description | Source | Rationale |
|---|---|---|---|
| Average household combined, electricity, and gas bills (UK) | Average bills are expressed in real terms 2025 prices, and based on average actual consumption, temperature adjusted. Prices are shown in real 2025 terms to allow comparison over time by removing the effects of inflation |
DESNZ Annual Domestic Energy Bills (tables 2.2.5 and 2.3.5) (Published annually) |
The average bills measure is our most comprehensive measure of household energy bills |
| Fuel poor households in England (LILEE) | Fuel Poverty in England is measured using the Low-Income Low Energy Efficiency (LILEE) indicator. A household is considered to be fuel poor if: – it is living in a property with a Fuel Poverty Energy Efficiency Rating (FPEER) of D or below; and – its disposable income (after housing and required energy costs) would be below the poverty line |
DESNZ Fuel poverty annual statistics (Published annually) |
These metrics are aligned with the Fuel Poverty Strategy for England. Fuel poverty is a devolved issue, with each nation in the UK having its own fuel poverty definition, targets and policies |
| Average required energy costs as a percentage of household income (England) | Required energy costs are the modelled cost to heat a household’s dwelling to a satisfactory standard based on household and dwelling characteristics. Rather than using actual spending, this ensures that those households who have low energy bills simply because they actively limit their energy use at home are not overlooked. | - | - |
| - | This proportion is calculated for each household as unequivalised required energy costs divided by unequivalised After Housing Costs (AHC) income, multiplied by 100. The median value across households is then calculated, both for all households and for low income households. AHC income is calculated as described in section 3 of the Fuel poverty statistics methodology handbook. This metric replaces the 10% affordability threshold used in previous reports to align with the latest Fuel Poverty Strategy for England |
- | - |
| Average gas price for industrial users (across all size bands) (UK) | This shows the average gas price for industrial users, across all consumption bands |
Industrial energy price statistics (Published, updated quarterly) |
This shows the average price of gas and electricity for the average non-domestic user. Businesses differ greatly in terms of energy consumption, and energy prices change depending on consumption levels (energy intensive, medium, and small businesses). Some energy intensive users also benefit from exemptions, which lower their energy costs |
| Average electricity price for industrial users (across all size bands) (UK) | This shows the average electricity price for industrial users, across all consumption bands |
Industrial energy price statistics (Published, updated quarterly) |
This shows the average price of gas and electricity for the average non-domestic user. Businesses differ greatly in terms of energy consumption, and energy prices change depending on consumption levels (energy intensive, medium, and small businesses). Some energy intensive users also benefit from exemptions, which lower their energy costs |
Average household combined electricity and gas bills (UK)
| Year | Average household combined energy bill, total (UK) | Average household electricity bill | Average household gas bill |
|---|---|---|---|
| 2025 (provisional) | £1,784 | £981 | £803 |
| 2024 | £1,896 | £1,022 | £874 |
| 2023 | £2,311 | £1,189 | £1,122 |
Source: DESNZ Annual Domestic Energy Bills (tables 2.2.5 and 2.3.5)
Release schedule: Annual
Notes:
-
Average bills are expressed in real terms 2025 prices, and based on average actual consumption, temperature adjusted
-
These figures do not reflect the Energy Bills Support Scheme payments made between 2022 and 2023
-
Average electricity bill excludes those on Economy 7 tariffs
-
The average household combined fuel bill is the total of the average household electricity bill and the average household gas bill combined. These are our best estimates of a dual-fuel bill which would cover approximately 84% of households (those on the gas grid), however these estimates do include households who only use electricity or electricity alongside other fuels not covered here like heating oil
Fuel poor households in England (LILEE)
| Year | Fuel poor households in England (LILEE – percentages indicate proportion of all households in England) |
|---|---|
| 2026 (projection) | 2.13m (8.4%) |
| 2025 (provisional) | 2.36m (9.4%) |
| 2024 | 2.47m (9.9%) |
| 2023 | 2.80m (11.4%) |
Source: Fuel poverty annual statistics (26 March 2026)
Release schedule: Annual
Average required energy costs as a percentage of household income (England)
| Year | All Households | Low Income Households |
|---|---|---|
| 2025 (provisional) | 6.8% | 14.9% |
| 2024 | 7.5% | 15.8% |
| 2023 | 7.8% | 16.2% |
| 2022 | 6.4% | 14.2% |
Source: Fuel poverty annual statistics (26 March 2026)
Release schedule: Annual
Average electricity and gas prices for non-domestic users (nominal terms, across all size bands), including Climate Change Levy
| Year | Average electricity price for non-domestic users across all size bands (nominal terms, p/kWh) | Average gas price for non-domestic users across all size bands (nominal terms, p/kWh) |
|---|---|---|
| 2025 (provisional) | 24.3 | 5.3 |
| 2024 | 26.3 | 5.7 |
| 2023 | 27.2 | 6.4 |
| 2022 | 20.9 | 5.3 |
Source: Industrial energy price statistics (table 3.4.2)
Release schedule: Quarterly
Create economic growth for the UK and generate and protect jobs
Programmes such as Great British Energy, the Clean Energy Industries Sector Plan and targeted supply chain investment have helped lay the foundations for long-term growth and employment across the UK. Over the past year, the department also made strong progress in driving economic growth and supporting jobs through the expansion of clean energy industries, increased investment in key sectors such as wind, nuclear and CCUS, and the mobilisation of significant public and private finance to strengthen domestic supply chains. Alongside this, interventions to support workers transitioning from traditional energy sectors and to improve skills provision are intended to help spread the benefits more widely. However, sustaining this progress will depend on translating investment more consistently into high-quality jobs across all regions, strengthening workforce planning to meet future skills demands, and maintaining competitiveness in a rapidly evolving global market.
| Metric | Description | Source | Rationale |
|---|---|---|---|
| UK low carbon and renewable energy employment | Number of FTE employees in a low-carbon and renewable energy sector |
Low Carbon and Renewable Energy Economy (LCREE) Survey (Published, updated annually) |
This is a survey-based estimate of employment in a low carbon and renewable energy sector among a list of 17 pre-defined sectors in the survey. The Low Carbon and Renewable Energy Economy (LCREE) survey is the primary source of official information on LCREE activity in the UK. The survey collects data on direct LCREE activity and indirect activity (that is, the additional activity in the economy generated because of demand for the products of LCREE-active firms, the wages they pay to employees, or the increase in demand for the inputs used by businesses directly active in the LCREE) |
| UK low carbon and renewable energy turnover | Turnover from economic activity in a low-carbon and renewable energy sector |
Low Carbon and Renewable Energy Economy (LCREE) Survey (Published, updated annually) |
This is a survey-based estimate of employment in a low carbon and renewable energy sector among a list of 17 pre-defined sectors in the survey. The Low Carbon and Renewable Energy Economy (LCREE) survey is the primary source of official information on LCREE activity in the UK. The survey collects data on direct LCREE activity and indirect activity (that is, the additional activity in the economy generated because of demand for the products of LCREE-active firms, the wages they pay to employees, or the increase in demand for the inputs used by businesses directly active in the LCREE) |
| UK annual energy transition investment | This provides data on total (public and private) investment into low-carbon industries, which enables the tracking of high-level investment trends | BNEF energy transition investment dataset | This dataset is an annual review of global investment in the low-carbon energy transition. It covers a wide scope of sectors central to the transition. The report also tracks investment in the clean energy supply chain |
Total low carbon and renewable energy economy jobs
| Time period | Total employment in low carbon and renewable energy economy (LCREE) in the UK and constituent countries |
|---|---|
| 2024 | 453,900 FTEs Direct – 304,000 FTEs Indirect – 149,900 FTEs |
| 2023 | 448,400 FTEs Direct – 317,000 FTEs Indirect – 131,400 FTEs |
| 2022 | 422,800 FTEs Direct – 284,600 FTEs Indirect – 138,200 FTEs |
Source: ONS Publication of the LCREE Survey
Release schedule: Annual
Note: A ca. 18-month lag exists between statistical release and the year the data in each release refers to. For this reason, the 2026 release (the latest one) reports results from 2024
Total low carbon and renewable energy economy exports
| Time period | Direct turnover in low carbon and renewable energy economy (LCREE) in the UK and constituent countries |
|---|---|
| 2024 | £7.1bn |
| 2023 | £8.6bn |
| 2022 | £8.5bn |
Source: ONS Publication of the LCREE Survey
Release schedule: Annual
Note: A ca. 18-month lag exists between statistical release and the year the data in each release refers to. For this reason, the 2026 release (the latest one) reports results from 2024
UK annual energy transition investment (public and private combined)
| Time period | Energy transition investment, £bn |
|---|---|
| 2025 | 64.7 |
| 2024 | 48.9 |
| 2023 | 52.6 |
Source: DESNZ analysis of Bloomberg NEF Energy Transition Investment Trends, 2026
Release schedule: Unpublished
Reduce the UK’s emissions
The UK’s greenhouse gas emissions continued to fall over the past year, supported by sustained delivery against Carbon Budgets and a broad package of policies across power, industry and buildings (as well as wider sectors across government). Key interventions, including the expansion of the UK Emissions Trading Scheme, investment in CCUS clusters, and continued progress on clean power and building decarbonisation, have strengthened the framework for longer-term emissions reductions. The department has also maintained a strong international leadership role in promoting global climate ambition and cooperation. However, emissions reductions will need to continue and accelerate in some sectors to meet future carbon budgets, and continued focus is needed to ensure delivery plans translate into sustained real-world reductions at pace.
| Metric | Description | Source | Rationale |
|---|---|---|---|
| UK territorial greenhouse gas emissions | Measures the progress of the UK territory in reducing overall GHG emissions in million tonnes of CO2 equivalent both in terms of outturn emissions and projected emissions against targets. |
UK greenhouse gas emissions statistics (Published, updated annually) |
These are the main statistics on domestic greenhouse gas emissions. They are helpful in tracking emissions reduction progress over time |
| UK territorial greenhouse gas emissions, sector breakdown | Emissions are provided for Net Zero Strategy (NZS) sectors. |
Energy and Emissions Projections (Published, updated annually) |
This sector breakdown is consistent with the UK Net Zero Strategy |
| Clean power share of electricity generation to be at least 95% by 2030 (Plan for Change metric) | The proportion of GB’s electricity generation that comes from clean power |
Clean Power 2030 Metrics (Published annually) |
These metrics are aligned with the DESNZ Clean Power Action Plan. The three-part definition is designed to ensure that raising clean power’s share of domestic electricity generation and reducing power sector emissions is not achieved merely by relying more on electricity imports |
| Clean power generation as a share of GB consumption to be at least 100% by 2030 | The proportion of GB’s electricity consumption that comes from clean power |
Clean Power 2030 Metrics (Published annually) |
As above |
| Grid emissions intensity to be no more than 50 gCO2e/kWh by 2030 | The amount of GHGs emitted per unit of power sector generated energy |
Clean Power 2030 Metrics (Published annually) |
As above |
Total UK greenhouse gas emissions (million tonnes CO2 equivalent)
| Time period | Total emissions (mtCO2e) | Percentage reduction from 1990 levels |
|---|---|---|
| 2025 (provisional) | 366.6 | 53.6% |
| 2024 | 373.4 | 52.8% |
| 2023 | 383.9 | 51.5% |
| 2022 | 404.0 | 48.9% |
Sources: DESNZ Final UK greenhouse gas emissions national statistics: 1990 to 2024, Table 1.1, and DESNZ Provisional UK greenhouse gas emissions statistics 2025, table 1a
Release schedule: Annual. Provisional estimates in March, final estimates the following February
Note: Excludes emissions from the UK’s share of international aviation and shipping
UK territorial greenhouse gas emissions by sector
| Sector | 2022 | 2023 |
|---|---|---|
| Power | 55.0 (13.6%) | 43.9 (11.4%) |
| Fuel supply | 19.4 (4.8%) | 18.2 (4.7%) |
| Domestic transport | 111.5 (27.6%) | 110.3 (28.6%) |
| Buildings | 78.7 (19.4%) | 74.1 (19.2%) |
| Industry | 65.3 (16.1%) | 64.1 (16.6%) |
| Agriculture | 46.9 (11.6%) | 46.6 (12.1%) |
| Waste | 19.8 (4.9%) | 19.7 (5.1%) |
| F-Gases | 7.6 (1.9%) | 7.0 (1.8%) |
| Land use, land use change and forestry (LULUCF) | 0.5 (0.1%) | 1.1 (0.3%) |
| Total | 405 (100%) | 385 (100%) |
Source: Energy and Emissions Projections: 2024 to 2050, Annex A (NZS taxonomy), Greenhouse gas emissions by source (Net Zero Strategy Taxonomy)
Notes: Historical figures are aligned with the UK 1990-2023 GHG Inventory (hence misalignment with totals in the table above). The next EEP will be published in Autumn 2026, which will align with the GHG Inventory figures in the table above. This publication will include 2024 figures
Emissions are provided for Net Zero Strategy (NZS) sectors
Calculated Clean Power share of Great Britain’s electricity generation in 12 month period (%)
| Time period | Clean Power share of GB electricity generation (%) |
|---|---|
| 2025 | 73.3 |
| 2024 | 73.7 |
| 2023 | 68.3 |
| 2022 | 62.7 |
Source: Clean Power 2030 Metrics, Data Tables, Table 1
Release schedule: Annual
Note: In 2025, 73.3 per cent of GB’s power system generation came from low carbon technologies, down 0.4 percentage points from 2024 due to a lower nuclear share and a rise in gas generation required to make good a fall in imported electricity
Calculated share of GB electricity demand met by clean sources (%)
| Time period | Clean Power share of electricity demand (%) |
|---|---|
| 2025 | 64.4 |
| 2024 | 63.7 |
| 2023 | 61.5 |
| 2022 | 63.1 |
Source: Clean Power 2030 Metrics, Data Tables, Table 2
Release schedule: Annual
Estimated emissions intensity of Great Britain’s electricity supplied (gCO2e/kWh)
| Time period | Emissions intensity of GB electricity supply (gCO2e/kWh) |
|---|---|
| 2025 (provisional) | 104 |
| 2024 | 107 |
| 2023 | 129 |
| 2022 | 154 |
Source: Clean Power 2030 Metrics, Data Tables, Table 3
Release schedule: Annual
UN Sustainable Development Goals
The Sustainable Development Goals (SDGs) were agreed by UN member states – they consist of 17 goals for 2016–2030, which are fundamental to social, environmental and economic development. Departments are required to identify in their ARAs where their performance contributes to the SDGs. DESNZ contributes directly to SDGs 7, 8, 9 and 13. The table below provides a summary, with more details in the performance narrative above.
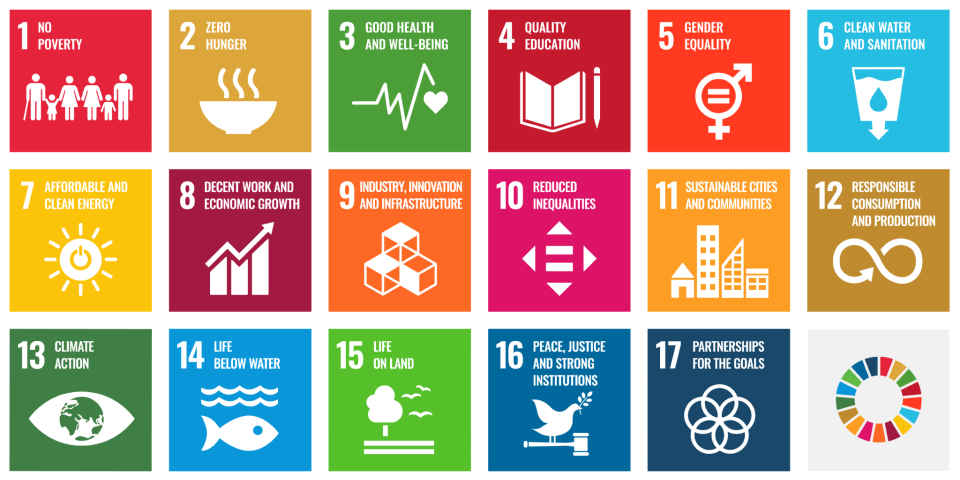
List of UN SDGs:
- Goal 1: No poverty
- Goal 2: Zero hunger
- Goal 3: Good health and well-being
- Goal 4: Quality education
- Goal 5: Gender equality
- Goal 6: Clean water and sanitation
- Goal 7: Affordable and clean energy
- Goal 8: Decent work and economic growth
- Goal 9: Industry, Innovation, Technology and Infrastructure
- Goal 10: Reduced inequality
- Goal 11: Sustainable cities and communities
- Goal 12: Responsible consumption and production
- Goal 13: Climate action
- Goal 14: Life below water
- Goal 15: Life on land
- Goal 16: Peace, justice and strong institutions
- Goal 17: Partnerships for the goals
| UN SDGs | DESNZ Performance |
|---|---|
|
Goal 7: Affordable and Clean Energy Ensure access to affordable, reliable, sustainable, and modern energy for all |
DESNZ Work Strands: Clean Power by 2030 is the first pillar of the Clean Energy Superpower Mission Specific outputs include: – The Great British Energy Act 2025 receiving Royal Assent – Secured record pipeline of clean cheap energy projects through Contracts for Difference Allocation Round 7 – Publication of the Warm Homes Plan – Contributed to tackling fuel poverty through expansion of the £150 Warm Home Discount to an additional 2.7 million households |
|
Goal 8: Decent Work and Economic Growth Promote sustained, inclusive and sustainable economic growth, full and productive employment and decent work for all |
Specific outputs include: – Published the Clean Energy Jobs Plan, setting out how the government will work in partnership with industry and trade unions to deliver the workforce needed to deliver our clean energy ambitions – Published the Carbon Budget and Growth Delivery Plan – Published the Local Power Plan to ensure that communities directly benefit from the energy they help to produce – Secured record pipeline of clean cheap energy projects through Contracts for Difference Allocation Round 7 – Investment in offshore wind and clean energy supply chains, including through Great British Energy |
|
Goal 9: Industry, Innovation and Infrastructure Build resilient infrastructure, promote inclusive and sustainable industrialisation and foster innovation |
Specific outputs include: – Published the Industrial Strategy, a 10 year plan to increase business investment, including in manufacturing and clean energy industries – Published the Solar roadmap and an Onshore Wind Taskforce Strategy – Investment in the industries of the future, such as CCUS and Hydrogen – Announced partnerships to deliver novel fusion energy – Working with the Net Zero Council to develop and deliver sector transition plans, which supports collaboration between business, finance, civil society, and the government to deliver net zero |
|
Goal 13: Climate Action Take urgent action to combat climate change and its impacts |
DESNZ Work Strands: Accelerating to Net Zero is the second pillar of the Clean Energy Superpower Mission. Specific outputs include: – Published the Carbon Budget and Growth Delivery Plan – Published the ‘Energising Britain’ public participation plan for climate and nature action – Continued rollout of the Warm Homes Plan – Building clean energy industries into the Industrial Strategy – Bolstering investment in enabling technologies, including artificial intelligence and nuclear energy |
Risk profile
The department has a highly challenging agenda, including several first-of-a-kind projects, which creates a higher risk environment. To properly manage this, DESNZ continues with the portfolio management approach adopted in September 2024. Programmes and projects undertake first line risk management, identifying and mitigating risks to their local delivery. Portfolio Boards sit above them to undertake assurance of programme risk management and to take ownership of risks which need a broader mitigation approach. The portfolios also own and manage those risks that impact across multiple programmes and thus need a co-ordinated response. Where risks sit across multiple portfolios or where the portfolio cannot mitigate the risk on its own, escalation to the departmental strategic risk register is then considered.
Historically, both strategic delivery risks and corporate enabler risks sat on a singular departmental strategic risk register and went collectively to the Executive Committee (ExCo). As part of a governance review in late 2025, the decision was taken to achieve greater scrutiny of risk by splitting management of delivery risks at ExCo from the management of corporate risks at the People and Operations Committee (POpCo).
Detail of the departmental strategic risks managed by ExCo and POpCo, as well as their mitigations, are set out below. Further information on how both committees managed these risks is included in the governance report.
Risks continued on the Departmental Strategic Risk Register from 2024-25
Energy bills increase significantly, affecting affordability for households and businesses, driven by exposure to volatile international fossil fuel prices and wider system cost pressures
Outcome: Improve energy affordability
Change from prior year: the departmental risk assessment process has determined that the likelihood and impact have increased
Mitigations and controls:
- DESNZ and the energy regulators constantly review the energy market to assess likely future prices and to consider any further action that may need to be taken to protect consumers
- The government confirmed its decision to retain a single UK wide wholesale market and proceed with Reformed National Pricing, rejecting zonal pricing due to complexity and disruption risks
- Following Budget decisions, officials delivered measures to take an average £150 of policy costs off household bills from April 2026
- For vulnerable consumers in particular, this risk is mitigated through existing support schemes. For winter 2025-26, the Warm Home Discount was expanded, meaning around 6 million households now benefit from a £150 rebate off their winter energy bill – a measure that has been confirmed through to 2030-31
- The government has also confirmed its intention to shift the recovery of Warm Home Discount costs from the standing charge to the unit rate from April 2026, better aligning contributions with actual energy use, and reflecting the strong fairness arguments raised by consumers and stakeholder groups during consultation
- All bills’ trajectories and conflict scenarios see bills elevated significantly above their current levels from July. DESNZ officials are working closely with HMT and other departments to identify contingency options for this winter to provide bills support to households, considering both targeted and universal options. Decisions will need to be taken on the overall design of a possible scheme, with a final go/no go decision required at around the beginning of August. On non-domestic support, HMT, DBT and DESNZ are jointly working through options for intervention, for decision-making June onwards
Disruption to supplies of gas/electricity/fuel to meet near-term demand
Outcome: Improve energy affordability; Enhance energy security
Change from prior year: Unchanged
Mitigations and controls:
- NESO undertake regular forecasts of energy capacity, looking at both supply and demand. In the winter 2025-26 they forecasted an operational surplus. However, in the event of margins being tight NESO can use a range of technologies, including gas-fired generation and flexible technologies such as batteries and Consumer Led Flexibility, interconnector imports, or Electricity/Capacity Market Notices
- There are also specific contingency planning activities for actions if a fuel shortfall were to occur
- In response to international market conditions tightening as a result of the Iran conflict, we established a Middle East Hub to coordinate cross-HMG work across 3 key priorities, jet and road fuel security of supply, reducing fossil fuel exposure and price interventions. We also stepped-up monitoring of key leading indicators (including the pace of European gas storage refill over summer and any spread of export controls), alongside existing engagement with system operators and established operational tools
- Following procurement, a contract was signed in April 2025 for a replacement for the Reserve Tanker Fleet. Transition to the new supplier of the Reserve Tanker Fleet was competed in 2025
Underlying energy supplies (gas/electricity/fuel) and/or the resilience of the energy system are disrupted or undermined due to a disorderly energy transition, creating a risk to our energy security
Outcome: Deliver Clean Power by 2030; Reduce the UK’s Emissions; Enhance Energy Security
Change from prior year: Unchanged
Mitigations and controls:
- A special situations function was set up to support refineries in difficulty and manage non-energy security aspects of closures and DESNZ is building up a dedicated Future of Fuel team to match those already in place for gas and electricity
- Cutting across the separate energy types, there is a key focus on enhancing cyber security as part of the Quad (DESNZ, Ofgem, NESO, and NCSC). A security strategy for the energy sector will be published in 2026, in alignment with the Government Cyber Action Plan
- Consultations were conducted on Security of Supply, and the implementation of capacity market reforms to mitigate capacity adequacy risks in the early 2030s, and announced the intention to publish an Energy Resilience Strategy and a renewed Hydrogen Strategy
Failure to meet our legally binding net zero commitments and interim climate targets (carbon budgets)
Outcome: Deliver clean power by 2030; Reduce the UK’s emissions
Change from prior year: Unchanged
Mitigations and controls:
- Delivered the Carbon Budget and Growth Delivery Plan, including a package of over 300 policies to enable Carbon Budgets 4, 5 and 6 (2023 – 37) to be met, and we continue to develop and monitor robust implementation plans for those policies
Failure of the UK to provide leadership and active international engagement, drawing on our strong climate credentials and domestic expertise, in the global fight to tackle climate change in line with the Paris Agreement
Outcome: Deliver clean power by 2030; Reduce the UK’s emissions
Change from prior year: Unchanged
Mitigations and controls:
- Although there is an increasingly difficult geopolitical environment, DESNZ continues to play a leading role in promoting international action on climate change, including sharing our own expertise on low carbon growth
- Our commitment to delivering clean power by 2030 and the strength of UK investment in clean power demonstrates continued efforts to decarbonise energy supplies
Failure to secure sufficient levels of private investment required to deliver the clean energy mission (‘net zero private investment’)
Outcome: Deliver clean power by 2030; Reduce the UK’s emissions; Create economic growth and good jobs
Change from prior year: the departmental risk assessment process has determined that the likelihood has increased
Mitigations and controls:
- The UK has major growth opportunities in clean energy industries and we are providing investors with certainty, lower risk and stability to enable strategic clean energy investments. DESNZ continues to enable private investment to support the department’s objectives by prioritising clear long-term policy signals, robust revenue support/business models, transparent market frameworks, and targeted public investment
- The department continues to improve its investor intelligence gathering at all levels. Secretary of State, ministers and senior officials have attended leading industry and investor events throughout the year to better understand risk and investor sentiment, as well as to promote the UK’s clean energy investment opportunities and clarity of the Clean Energy Mission
- The department maintains a strategic internal view of the pipeline of priority UK clean energy deployment and supply chain projects to inform critical decisions, support delivery, focus stewardship, manage any divestment risks and ensure greater coherence
- DESNZ is also ensuring clean energy projects benefit from the UK’s comprehensive Public Finance Institutions offer. We are partnering with catalytic institutions such as the National Wealth Fund, UK Export Finance, and British Business Bank to crowd in private investment
Catastrophic or severe incident affecting energy or nuclear critical national infrastructure
Outcome: Enhance energy security
Change from prior year: Unchanged
Mitigations and controls:
- DESNZ works with industry and regulators such as the Office for Nuclear Regulation (ONR) and Ofgem, to ensure safety and security capability is developed and standards are maintained, including strengthened regulatory frameworks
- DESNZ continues to ensure robust and proportional safety and security (physical, personnel and cyber) arrangements are in place at critical energy and civil nuclear sites, including a review based at protecting High Impact Points of Failure
- Cyber security and resilience are a strong focus, with co-ordinating groups in place for each energy sector and DESNZ works closely with the National Cyber Security Centre (NCSC)
- DESNZ runs regular exercises to test and improve the UK’s response plans to any such incidents, seeking to ensure minimal impact should the risk arise
- The Energy Resilience Leadership Group was launched with industry partners to facilitate collaboration and enhance the resilience of downstream gas and electricity sectors
- The electricity prioritisation list has been reviewed, adding 74 critical sites. Ministerial approved changes to the protected sites process are being implemented
- DESNZ has committed to providing a full government implementation plan of the Nuclear Regulatory Taskforce’s 47 recommendations
As a result of insufficient funding, there is a risk that financial constraints could limit our ability to deliver our objectives and ambitions
Corporate Enabler
Change from prior year: Unchanged
Mitigations and controls:
- DESNZ manages the in-year position and review forecasts for value and volatility each month. As part of the Management Accounting change project, work is underway to further improve forecasting accuracy across the department
- Quarterly deep dives are held into specific budgets to identify risks and levers to manage overspends and underspends and consider commitments, volatility or other data as needed
- In the longer term, DESNZ has agreed allocations at Business Planning and the Spending Review has provided agreed settlements through to 2029-30 which aids certainty of funding
- DESNZ regularly engages with HM Treasury to discuss our financial position and policy funding, and to identify and address any emerging issues
Sensitive information is compromised or lost through cyber-attack (such as a ransomware attack), eavesdropping, theft, mistakes, or leaks
Corporate Enabler
Change from prior year: Unchanged
Mitigations and controls:
- DESNZ continues to develop security capability across the personnel, physical, cyber, cultural and resilience threads to counter the expanding threats to people and information
- This year the department has demonstrated strong compliance against a number of the Cyber Assessment Framework (CAF) contributing outcomes; DESNZ recognises there are areas of improvement which include response and recovery planning, asset and supply chain management; programmes are in place to develop these
- Security culture, education, training and awareness remains a priority, and we have refreshed this years programme of work that will continue to improve this theme
- As part of the improvement for incident management and response and recovery planning, we have a programme of work that will ensure robust plans are in place, understood and continuously tested
Our current and future workforce has structural gaps
Corporate Enabler
Change from prior year: Unchanged
Mitigations and controls:
- After several years of growth, DESNZ now needs to manage a real terms fall in the admin budget
- Business planning has been completed centrally to give a view of departmental size and cost over the coming 4 years
- DESNZ met its March 2026 workforce size/cost targets and is progressing workforce planning activity to mitigate this risk for 2026-27 and into future years
- We have been progressing actions under our departmental strategic workforce plan, including our capability plan to ensure we are building the right skills and capabilities to support our future delivery
- We have used workforce agility to reassign colleagues where there are critical gaps in the department through the Assignment Hubs. More recently, we have successfully pivoted at pace, numerous colleagues onto urgent Middle East roles
Departmental morale, engagement and wellbeing
Corporate Enabler
Change from prior year: Unchanged
Mitigations and controls:
- DESNZ encourages SCS to lead by example through role modelling best practice with regard to work/life balance and support for personal wellbeing
- DESNZ provides a range of professional wellbeing resources, including the department’s extensive network of Mental Health First Aiders, and access to wider Civil Service resources such as the Employee Assistance Programme
- DESNZ has a People Survey Action Plan in place with an action to undertake a Wellbeing survey and identify areas that may require further support. Local areas also have action plans in place
- DESNZ ensures that advice and information on how to access these services is available to all staff and is regularly promoted through comms such as blog posts, staff networks, and seasonal campaigns, for example, for winter wellness and flu vaccination
- The department is also strengthening leadership and line manager capability through our line manager offer, providing practical tools, targeted learning, and guidance to support managers in leading through change and supporting staff wellbeing
Failure to embed Public Sector Equality Duty in policy design and delivery, resulting in inequitable outcomes and undermining delivery of the clean energy mission
Corporate Enabler
Change from prior year: Unchanged
Mitigations and controls:
- The department launched the CoPilot PSED Agent to improve access and engagement with PSED guidance
- We published the annual DESNZ Equality Objectives document, and undertook a 6-month follow up review of progress
- We continue to run regular training sessions for the department, including a new pilot of targeted training engagement, tailoring equality considerations to specific policy context
Risks Newly Added in 2025-26
EPPS (Environmental Principles Policy Statement) compliance risk
Corporate Enabler
Mitigations and controls:
- EPPS compliance has increased over the past 12 months.
- Our sample size in the January 2025 audit more than doubled (10 to 22 submissions to review), compared to the previous one in June 2026, with the entire department taking part, not just Energy Infrastructure Group
- Compliance results have greatly improved, going from 10% to 45% of submissions reviewed being fully compliant with EPPS (rated green), within those 6 months
- EPPS learning workshops are still well attended, averaging about 30 people per session
- The next audit, in July, is the first that will not be run centrally, but rather through each individual DG group, reporting back to the policy profession team. This is a first step in embedding a departmental wide compliance process and enabling each DG group to increase their compliance
During the year, a risk relating to “Fuel supply disruption due to strike/insolvency/accident at a critical refinery or terminal” was escalated from the Energy Security and Resilience Portfolio to the Departmental Strategic Risk Register, based on intelligence on the future of the Prax Lindsey Oil Refinery. ExCo managed the risk for a period of several months and the risk was de-escalated once the situation was more stable.
Financial review
This section summarises the department’s expenditure and financial position for the year, based on information presented in the Statement of Parliamentary Supply (SOPS) and the financial statements. The SOPS explains how the department performed against the spending approved by Parliament, while the financial statements are prepared on an accruals basis in accordance with International Financial Reporting Standards (IFRS). Both are prepared for the departmental group.
Understanding the budget framework
Total Managed Expenditure (TME) is the government’s overall measure of public spending. It is split into:
- Departmental Expenditure Limits (DEL): planned, controllable spending set over multi-year periods, for example, staff costs, grants and running costs
- Annually Managed Expenditure (AME): demand-led or volatile spending that is more difficult to forecast, including provisions, financial instruments and other technical adjustments
Both DEL and AME are further divided into:
- Resource expenditure: day to day spending to deliver departmental priorities, including programme and administration costs
- Capital expenditure: investment in assets or activities that provide benefits beyond the current year, such as infrastructure and financial investments
Parliament approves departmental spending through Supply Estimates, which set annual limits on how much departments can spend in each category. Departments are required to manage spending within these limits and notify HM Treasury where outturn is expected to exceed their approved budgets.
Reconciliation between budgets and the financial statements
The SOPS presents financial performance on a budgetary basis, reflecting Parliamentary control, while the financial statements are prepared on an accruals basis under IFRS.
SOPS 2 provides a reconciliation between these 2 measures, helping users understand how budget outturn relates to the financial position and performance reported in the accounts.
Financial performance
Outturn for 2025-26
The diagram below shows the departmental outturn for 2025-26.
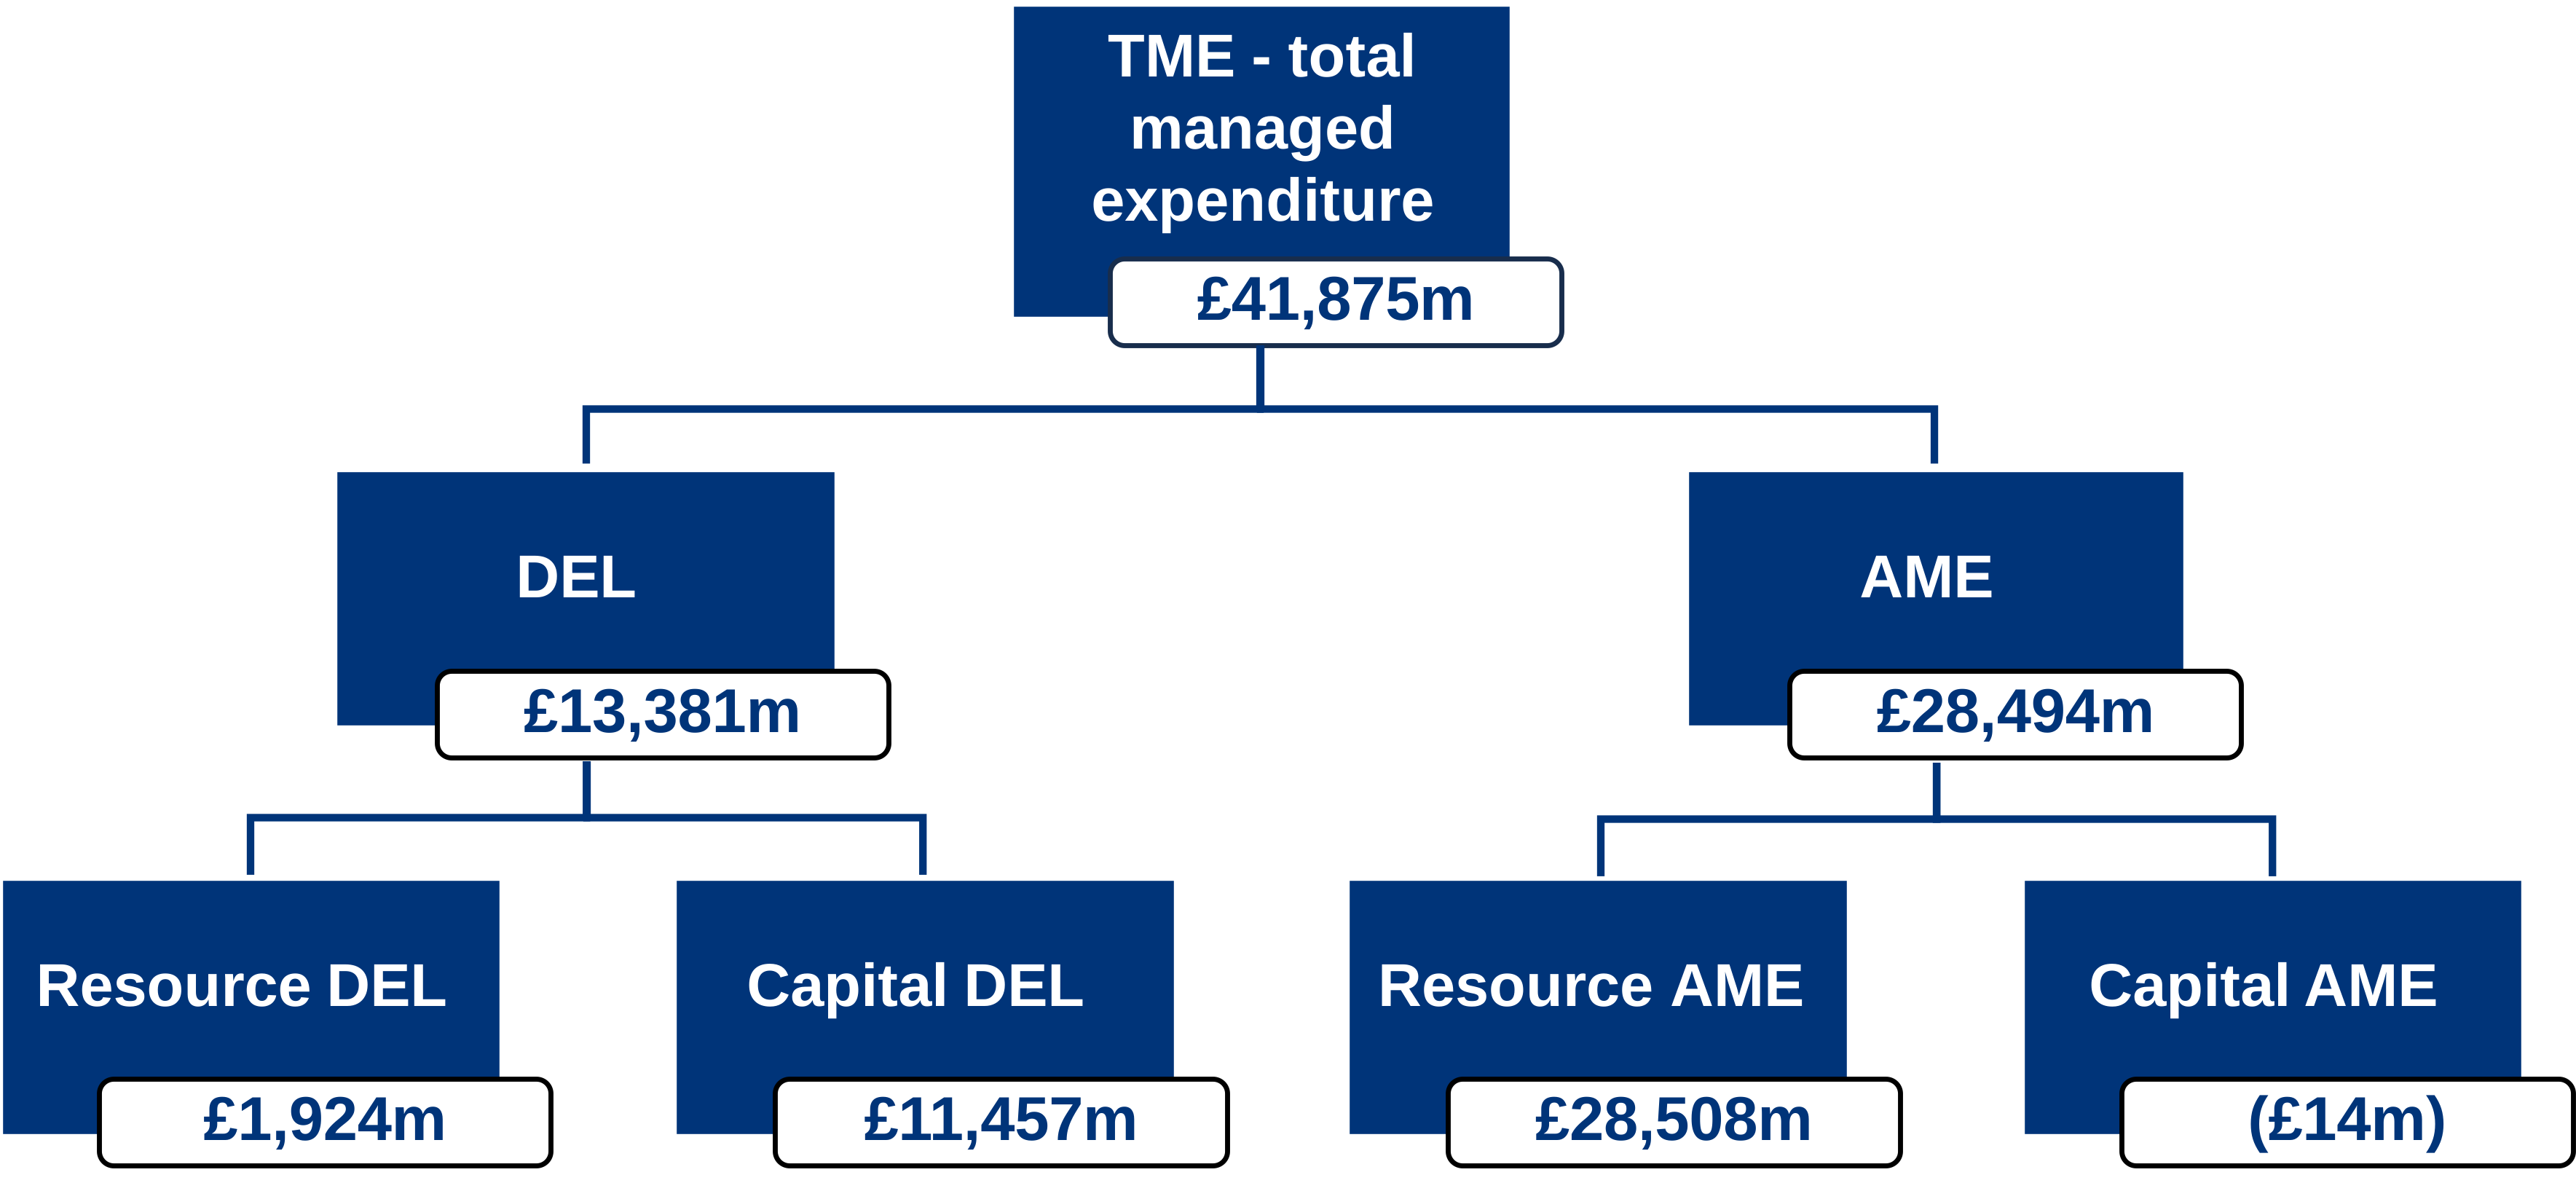
Outturn for 2025-26: diagram data
TME - total managed expenditure: £41,875m
DEL: £13,381m
- Resource DEL: £1,942m
- Capital DEL: £11,457m
AME: £28,494m
- Resource AME: £28,508m
- Capital AME: £(14m)
Outturn compared to budget
This table ties directly to the SOPS, which compares outturn with the Supply Estimates approved by Parliament. Further detail on DEL is provided in ‘where we spent our money’ on page 23, with both DEL and AME analysed in the SOPS and supporting notes within the Parliamentary accountability section.
2025-26
| DEL | Outturn £m |
Budget £m |
Variance £m |
Variance % |
|---|---|---|---|---|
| Total DEL | 13,381 | 13,798 | (418) | (3.0%) |
| Resource DEL | 1,924 | 2,070 | (146) | (7.1%) |
| Capital DEL | 11,457 | 11,728 | (272) | (2.3%) |
| AME | Outturn £m |
Budget £m |
Variance £m |
Variance % |
|---|---|---|---|---|
| Total AME | 28,494 | 81,099 | (52,604) | (64.9%) |
| Resource AME | 28,508 | 81,018 | (52,510) | (64.8%) |
| Capital AME | (14) | 80 | (94) | (117.1%) |
| TME | Outturn £m |
Budget £m |
Variance £m |
Variance % |
|---|---|---|---|---|
| Total | 41,875 | 94,897 | (53,022) | (55.9%) |
Explanations for the key variances from budget are provided below, split by budget line headings from the SOPS.
The department has managed all budget types within Parliamentary control totals and had £418m underspends across DEL; and a £52,604m AME underspend.
Resource DEL:
The outturn on Resource DEL was £1,924m, an underspend of £146m, against a budget of £2,070m. This was primarily due to:
- £42m underspend in Net Zero Buildings and Industry, largely due to loan accounting adjustments at year-end, alongside lower spend resulting from efficiencies and delays to digital delivery
- £41m underspend relating to funding set aside for insolvency support that was not required
- £39m underspend across ALBs supporting nuclear activity, of which £28m was driven by higher income within the Nuclear Decommissioning Authority, primarily reflecting RPI movements, and £11m improved cost control across Great British Energy-Nuclear
- £29m underspend reflecting lower spend across the Hydrogen Programme, where there have been delays to Hydrogen Allocation Round 2 and Hydrogen Transport and Storage Allocation Round; and delayed payments for low‑carbon hydrogen business models (now commencing from 1 April 2026)
Capital DEL:
The outturn on Capital DEL was £11,457m, an underspend of £272m against a budget of £11,728m. This was primarily due to:
- £440m underspend relating to CO₂ transport and storage infrastructure (T&SCo), reflecting updated delivery timelines and the reprofiling of construction spend into future years
This is partially offset by £150m financial transaction reflecting the portion of the receivable expected to be recovered in managing an energy sector insolvency.
Resource AME:
The outturn Resource AME was £28,508m, an underspend of £52,510m, against a budget of £81,018m. The underspend is primarily due to:
- £27.1bn underspend due to uncertainties at the time of budgeting for movements in the NDA nuclear provision. The underspend reflects updated cost profiles of major operating companies and increased discounting. For more information on Nuclear Decommissioning provision valuation please see Note 18.1 Nuclear provisions
- £23.9bn underspend reflects uncertainties in the Contracts for Difference (CfD) valuation, which is inherently volatile given the scale and long-term nature of contracts, alongside sensitivity to fluctuating electricity prices. For more information on CfD valuation please see Note 9 Derivative financial instruments
- £900m underspend on Green Hydrogen (LCHA) due to contracts for Hydrogen Allocation Round 2 were not signed in year as expected. For more information on LCHA valuation please see Note 9 Derivative financial instruments
- £400m underspend against the budget for Mining Remediation Authority (formerly Coal Authority) provisions. The variance reflects uncertainties at the time of budget setting when the final outturn in relation to Public Safety claims, incidents or litigation is not known
Capital AME:
The Department’s full year Capital AME outturn was -£14m, an underspend of £94m, against a budget of £80m, primarily due to changes in the Sizewell C site restoration provision, following financial close, which removed the need to account for a discontinuation scenario.
Outturn trend
| DEL | 2025-26 £m |
2024-25 £m |
2023-24 £m |
2022-23 £m |
2021-22 £m |
|---|---|---|---|---|---|
| Resource DEL | 1,924 | 1,463 | 1,376 | 13,228 | 2,483 |
| Capital DEL | 11,457 | 5,241 | 5,127 | 6,200 | 10,712 |
| AME | 2025-26 £m |
2024-25 £m |
2023-24 £m |
2022-23 £m |
2021-22 £m |
|---|---|---|---|---|---|
| Resource AME | 28,508 | 8,998 | (13,547) | (95,616) | 114,878 |
| Capital AME | (14) | 48 | (60) | (144) | (122) |
Outturn trend – biggest areas of net expenditure
The table below shows the department’s biggest areas of net expenditure taken from the SOPS.
| 2025‑26 £m |
2024‑25 £m |
2023‑24 £m |
2022‑23 £m |
2021‑22 £m |
|
|---|---|---|---|---|---|
| NDA | 8,936 | 8,548 | (15,369) | (107,667) | 103,362 |
| CfDs | 21,518 | 2,499 | 4,009 | (13,507) | 10,286 |
| Mining Remediation Authority (formerly Coal Authority) | (43) | 193 | (521) | (3,328) | 3,168 |
| RHI | 1,227 | 1,213 | 1,218 | 1,002 | 920 |
| ICF | 790 | 406 | 366 | 231 | 432 |
| Nuclear Liabilities fund | - | - | - | - | 5,610 |
| Sizewell C | 4,668 | 1,728 | 1,179 | 841 | - |
| Energy SAR | (1) | (2,858) | (930) | 1,157 | 2,136 |
| Energy price support | (1) | (55) | 897 | 43,531 | - |
| UKAEA | 570 | 391 | 280 | 267 | 239 |
| Net Zero buildings and heat | 1,333 | 1,404 | 739 | 523 | 1,259 |
| Great British Energy – Nuclear | 77 | 30 | 181 | - | - |
| NESO | - | 687 | - | - | - |
| CCUS | 1,520 | 396 | 36 | 17 | 11 |
| Other | 1,281 | 1,167 | 812 | 600 | 528 |
| Total | 41,875 | 15,750 | (7,103) | (76,332) | 127,951 |
Expenditure on Official Development Assistance
The UK’s Official Development Assistance (ODA) refers to the overseas aid budget. ODA expenditure is reported for the calendar year and on a cash basis.
DESNZ’s ODA expenditure (provisional) in 2025 was £200.4m. This expenditure supports climate and energy projects designed to help countries tackle climate change impacts. The table below shows a breakdown by sector.
DESNZ’s International Climate Finance (ICF) spend focuses on climate mitigation, particularly in countries where emissions are growing rapidly. It aims to accelerate clean energy transition, raise climate ambition, enable low-carbon growth and address deforestation.
The difference in the DESNZ ODA expenditure between 2024 and 2025 is due to the timing of a £260m contribution to the Climate Investment Funds (CIF). A significant portion of this contribution will go towards the CIFs new High Leverage Facility (HLF). The timings for HMG approval of this contribution were aligned to the set-up of the HLF. This meant that DESNZ made it’s contribution in early 2026.
DESNZ ODA spend by sector
| Sector | Sector code | 2025 ICF Total £m |
2024 ICF Total £m |
|---|---|---|---|
| Energy policy | 231 | 7.2 | (9.0) |
| Energy generation, renewable sources | 232 | 80.7 | 128.4 |
| Banking & financial services | 240 | 2.0 | 2.0 |
| Business & other services | 250 | 1.6 | 1.3 |
| Forestry | 312 | 49.2 | 244.3 |
| General environment protection | 410 | 39.9 | 19.4 |
| Other Multisector | 430 | 0.4 | 0.1 |
| Administrative costs of donors | 910 | 10.3 | 9.1 |
| Unallocated / unspecified | 998 | 9.1 | 12.6 |
| Total | - | 200.4 | 408.2 |
Notes:
These figures are provisional. The final 2025 Statistics on International Development (SID) is due to be published by the Foreign, Commonwealth and Development Office (FCDO) in late September 2026
Please note that in last year’s Annual Report and Accounts, the columns were mislabelled with the current year. ODA expenditure is published each September, for the previous calendar year. Therefore, last year’s information related to 2024, rather than 2025 as stated
Sector codes used by the OECD Developmental Assistance Committee (DAC) are available at www.oecd.org
Financial position
Assets and liabilities
The table below shows the value of assets and liabilities for the departmental group.
As at 31 March 2026, the department remains in a net liability position. Net liabilities have increased by £28.8bn from (£200.1bn) at 31 March 2025 to (£228.9bn) at 31 March 2026. The biggest effect on the change in the financial position this year comes from the recognition of the liability in relation to the CfD contracts awarded this year as a result of the Allocation Round 7 (AR7). Further details on CfDs can be found in note 9.
| 31‑Mar‑26 £m |
31‑Mar‑25 restated £m |
31‑Mar‑24 restated £m |
|
|---|---|---|---|
| Assets | 24,411 | 17,414 | 16,385 |
| Liabilities | (253,295) | (217,532) | (210,152) |
| Net assets/(liabilities) | (228,884) | (200,118) | (193,767) |
Changes in discount rates
Discount rates heavily impact the value reported for some liabilities. Liabilities that involve payments over many years must be discounted. This recognises the time value of money and enables us to put a value on these outgoings in today’s terms and at a high level it tells us how much it might cost to settle these obligations at the reporting date. This is an accounting adjustment. The department has liabilities that extend over decades. This means that a small change in the discount rate can greatly affect the present value of the liability. Assets and liabilities were discounted at positive rates - this means that the present value is lower than the cash the department expects to receive or pay. The accounts use several discount rates depending on the nature of the transaction and timing of the cash flows. Further details on discount rates applied to provisions and CfDs can be found in notes 18 and 9.
The NDA nuclear provision has increased this year, primarily due to revised decommissioning plans on which it is based. Most significantly, Sellafield have reviewed all aspects of their site plan and made multiple updates to sequencing, pricing and future funding. Similarly, NRS and NWS have updated their plans, and in all cases the longevity of the changes renders a larger undiscounted movement less financially significant on a discounted basis.
The CfD liability increased this year to account for the results of the AR7. LCCC has successfully signed more than 200 CfD contracts, representing 14.7 GW of renewable electricity generation. AR7 represents a significant increase in scale from previous auctions, delivering contracts across fixed bottom and floating offshore wind, onshore wind, solar, and tidal stream power.
The table below shows the impact of discounting on our assets and liabilities.
| Assets | 2025-26 No discounting £m |
2025-26 With discounting £m |
2025-26 Impact of discounting £m |
2024-25 No discounting £m |
2024-25 With discounting £m |
2024-25 Impact of discounting £m |
|---|---|---|---|---|---|---|
| Financial asset: Coal pension receivable | 346 | 328 | (18) | 346 | 335 | (11) |
| Liabilities | 2025-26 No discounting £m |
2025-26 With discounting £m |
2025-26 Impact of discounting £m |
2024-25 No discounting £m |
2024-25 With discounting £m |
2024-25 Impact of discounting £m |
|---|---|---|---|---|---|---|
| NDA nuclear provision | 276,364 | 115,631 | (160,733) | 215,954 | 110,101 | (105,853) |
| Mining Remediation Authority (formerly Coal Authority) provision | 11,818 | 1,571 | (10,247) | 11,709 | 1,709 | (10,000) |
| CfD liabilities (included within derivative financial instruments on SoFP, with assets and liabilities presented separately) | 166,061 | 110,923 | (55,138) | 128,229 | 90,405 | (37,824) |
| LCHA liabilities (included within derivative financial instruments on SoFP, with assets and liabilities presented separately) | 2,796 | 2,244 | (552) | 1,255 | 1,243 | (12) |
Sustainability report
The Greening Government Commitments
The Greening Government Commitments (GGCs) framework sets out actions by departments and their public bodies to improve the environmental impact of the government estate and its operations. The Department for Environment, Food and Rural Affairs (Defra) compiles, mandates and coordinates the GGC Framework.
GGC targets were in place up to March 2025 under the 2021–25 framework, which has now ended. Defra is working on a new framework for 2025–30, to be published in due course. As part of the new framework, 2025–26 will form the baseline year to track progress each year. Due to the differences between the old and new frameworks, prior year comparators for metrics have not been provided.
The figures reported are for the DESNZ GGC family, made up of the core department and 10 in scope public bodies:
- Climate Change Committee (CCC)
- Mining Remediation Authority (MRA)
- Nuclear Decommissioning Authority (NDA)
- United Kingdom National Nuclear Laboratory (UKNNL)
- North Sea Transition Authority (NSTA)
- Salix
- UK Atomic Energy Authority (UKAEA)
- The Office of Gas and Electricity Markets (Ofgem)
- Great British Energy-Nuclear (GBE-N)
- The Civil Nuclear Constabulary (CNC)
The Government Property Agency (GPA) manages all the estate occupied by the core department and a small proportion of public bodies. In these cases, GPA is responsible for ensuring their estate delivers on the GGC targets. The organisations perform an assurance role to support the GPA. The GPA has an environmental management system accredited to ISO 14001, to monitor energy, waste and water use. This aligns with the Government Property Strategy 2022–30 mission to move to a smaller, better, and greener estate.
Emissions
The GPA is running a net zero programme to reduce carbon emissions and energy use across its estate. DESNZ has benefited from carbon emissions and energy savings from a solar panel review at Feethams House, Darlington. Public bodies that do not occupy the GPA estate have also made efforts to reduce emissions (see public body annual reports for more details).
Carbon emissions data:
| Scope 1 | Unit | 2025-26 |
|---|---|---|
| Emissions: (direct - sources owned or controlled by the organisation) (gas) | Tonnes CO2 equivalent | 3,923 |
| Related gas consumption | KWh | 15,705,345 |
| Related expenditure | £’000 | 506 |
Notes:
- Ofgem data unavailable
- Ofgem, UKAEA & CCC expenditure unavailable
| Scope 2 | Unit | 2025-26 |
|---|---|---|
| Emissions: (indirect - energy consumed which is supplied by another party) (electricity) | Tonnes CO2 equivalent | 11,499 |
| Related electricity consumption | KWh | 58,759,962 |
| Related expenditure | £’000 | 9,281 |
Notes:
- Ofgem data unavailable
- Ofgem, UKAEA & CCC expenditure unavailable
There was no additional spend on energy outside of scope 1 and 2.
| Scope 3 | Unit | 2025-26 |
|---|---|---|
| Emissions from business travel | Tonnes CO2 equivalent | 4,382 |
| Related expenditure | £’000 | 4,798 |
| Emissions from ICT | Tonnes CO2 equivalent | 1,570 |
Notes:
- Ofgem, UKAEA & CCC data unavailable for business travel
- CNC, NSTA, UKAEA & Ofgem data unavailable for ICT. CCC are exempt
Carbon offsets:
The Nuclear Decommissioning Authority purchased 1500 Woodland Carbon Code Pending Issuance Units at the Lowther estate for a total cost of £60,000.
DESNZ Core purchased 432 Bangladesh Verra’s Verified Carbon Standard (VCS) to compensate for emissions arising from DESNZ travel to UNFCCC COP30 events during 2025 at a cost of £5,023.
No further carbon offsetting has been done by the remainder of the DESNZ family.
Waste organisation and management
In 2025, the GPA developed a new sustainability strategy for its workplace services. The strategy focuses on areas such as minimising energy use. Related collaborative projects are being run across the GPA’s portfolio occupied by DESNZ core, and a small portion of some public bodies.
Municipal waste data:
| 2025-26 Tonnes |
|
|---|---|
| Recycling | 963 |
| Anaerobic digestion | 77 |
| Incineration with energy recovery | 69 |
| Composting | 4 |
| Incineration without energy recovery | 1 |
| Landfill | 372 |
| Other destination | 89 |
| Total municipal waste arising | 1,575 |
Note:
- Ofgem data unavailable
Major mineral waste data:
| 2025-26 Tonnes |
|
|---|---|
| Recycled | 9,011 |
| ICT waste recycled, reused, and recovered (externally) | 6 |
| Composted/ food waste | 53 |
| Incinerated with energy recovery | 3 |
| Incinerated without energy recovery | 1 |
| To landfill | 1,308 |
| Other destination | 3,562 |
| Total mineral waste arising | 13,944 |
Notes:
- Ofgem data unavailable
- ICT waste for NSTA, Ofgem, CNC & GBE-N unavailable
Other waste data:
| 2025-26 Tonnes |
|
|---|---|
| Recycled | 2,110 |
| ICT waste recycled, reused, and recovered (externally) | - |
| Composted/ food waste | 84 |
| Incinerated with energy recovery | 3 |
| Incinerated without energy recovery | 48 |
| To landfill | 2,111 |
| Other destination | 13,931 |
| Total other waste arising | 18,286 |
Note:
- Ofgem data unavailable
Total expenditure on municipal, major mineral and other waste data was £132,843.
Water consumption (finite resource)
GPA continued to implement water efficiency measures across the estate, such as rolling out water meters across most sites. Apart from the GGC disclosures below, the estate occupied by DESNZ does not use other finite resources.
Water consumption data
| Unit | 2025-26 | |
|---|---|---|
| Water consumption | cubic metres m3 | 47,115 |
| Water supply and sewage costs | £’000 | 117 |
Note:
- UKAEA, Ofgem & CCC data unavailable
Sustainable construction and restoring and enhancing nature
The GPA’s new government hub offices are designed to meet GGC sustainability targets to deliver on our commitments. They achieve these through sustainable design and construction aiming for ambitious EPC and BREEAM ratings where possible.
The GPA has updated the Government Workplace Design Guide with an updated annex on net zero and sustainability and a new annex on biodiversity and nature recovery. Both publications demonstrate the GPA’s commitment to protecting the environment on behalf of DESNZ.
Adapting to climate risks
For the proportion of the DESNZ GGC family which occupy the GPA estate, the GPA has completed a climate change adaptation strategy and action plan to mitigate against the impacts of climate change. Roll-out of the action plan will continue into 2026 and beyond. During 2025‑26 flood risk assessments were reviewed and further site level data collected, defining risks and actions required.
Sustainable procurement
We have a supplier code of conduct and a departmental environmental policy. Both documents outline our expectations for suppliers and the supply chain, in relation to minimising social and environmental impacts.
Actions taken during the year:
- We prepared guidance to support the implementation of sustainable procurement practices. The guidance and resources reference the Government Buying Standards (GBS)
- We provided training to commercial colleagues and contract managers on topics including tackling modern slavery, social value and supply chain diversity
- We have a dedicated team to provide coaching to major projects. This supports teams to embed sustainability into their sourcing approaches
- At year-end, we were in the process of setting spend targets for Small & Medium Enterprises (SMEs) and Voluntary, Community and Social Enterprises (VCSEs)
Reducing environmental impacts from ICT and digital
DESNZ’s main ICT suppliers continue to use more recycled and renewable materials in their products, and reduce packaging through new initiatives where possible. The department has a continued focus on ICT waste management, aiming to reduce the overall amount of waste and increase the proportion which is reused and recycled, with the ultimate goal of zero waste going to landfill.
Under the Greening Government Commitments, DESNZ continues to seek opportunities to reduce its environmental impact. The department works with suppliers to support its sustainability objectives, including the reduction of carbon emissions, and requires the provision of CO2e data to monitor progress against these objectives.
Taskforce on Climate-Related Financial Disclosures statement
This disclosure has been prepared in accordance with the recommendations and recommended disclosures of the Task Force on Climate-related Financial Disclosures (TCFD), as interpreted and applied through HM Treasury’s TCFD-aligned disclosure requirements.
Given the nature of DESNZ’s remit, where consideration of climate change and resilience to climate change are a key element to the department’s work and UK climate risks and response are a business as usual activity, this return covers the department’s UK-wide impact. As such, this inherently covers the work of both the department and our public bodies. However, we do not assess specific actions from across the DESNZ group, and public body responses to climate change and climate resilience will be found in their own TCFD returns.
For future returns, the internal DESNZ aspects of TCFD will need to be strengthened.
Background
The Taskforce for Climate-Related Financial Disclosures (TCFD) was created in December 2015, recognising the increasing need for stakeholders to understand climate-related risks. The taskforce’s recommendations, published in June 2017, provide a framework for companies and, since 2024, public sector bodies, to disclose information in a clear and comprehensive manner. The annual report return is part of this framework, ensuring that organisations regularly update their climate-related financial disclosures, thereby promoting transparency and informed decision-making.
Strategy
For TCFD reporting, DESNZ is in a somewhat unique position. Our mission and outcomes are directly articulated in terms of encouraging reduction of climate change globally, and the delivery of carbon reductions within the UK, while ensuring the affordability and security of energy provision.
The assessment and outlook on climate related risk heavily informs and guides the department’s approach to strategic decisions on funding and resourcing. Decisions at major fiscal events such as Spending Reviews and the allocation of resourcing across the department is informed and guided by the assessment of climate related risk, primarily through efforts to reduce the UK’s emissions and ensure energy security.
As such, assessment of climate risk is central to the department’s overall risk assessment processes, and 3 of our 8 departmental strategic delivery risks relate to climate change and international action: achievability of UK and global carbon targets; the UK’s reputation for climate action and influence on other global players, and use of our reputation and climate policy to attract private investment for green infrastructure. We additionally have a strategic risk relating to management of the transition to a clean energy system.
Our mission is to “Make the UK a clean energy superpower by achieving clean power by 2030 and accelerating to net zero” and, within that, our outcomes for 2025-26 were to:
- Enhance UK energy security
- Protect billpayers
- Support economic growth for the UK and generate and protect jobs
- Reduce the UK’s emissions
Our Climate Strategy
The UK has made a series of commitments to tackling climate change over the past decades. The Climate Change Act (2008) made the UK the first country to establish a long-term legally binding framework to cut carbon emissions, containing a target requiring emissions reductions to Net Zero by 2050. The Act has cemented the UK’s position as an international leader in tackling climate change with countries such as Denmark, France, Mexico, Sweden and New Zealand creating their own legislation based on the Act.
The UK’s official commitments to the UN and COP processes are geared toward our Net Zero target and delivering the overarching Paris Agreement goal of limiting global warming to well below 2°C, and this is the scenario on which DESNZ assesses any climate risk.
Current official targets include:
- 2030 Nationally Determined Contribution (NDC): The UK remains committed to its target of at least a 68% reduction in emissions by 2030 against 1990 levels
- 2035 Nationally Determined Contribution (NDC): The UK has committed to reducing economy-wide greenhouse gas emissions, excluding international aviation and shipping, by at least 81% by 2035 compared to 1990 levels
- Long-Term Strategy (Net Zero 2050): The UK has a legally binding commitment to reach Net Zero emissions by 2050. This target is economy-wide and includes international aviation and shipping
- Carbon Budgets: These are domestic, legally binding 5-year caps on emissions. The Sixth Carbon Budget (2033–2037) aligns with the 2035 NDC, requiring a 78% reduction by 2035 (including international aviation and shipping). Detail can be seen in metrics 1a and 2b. In addition, the UK has Strategic & Financial Commitments:
- International Climate Finance: The UK has pledged £11.6bn between 2021-22 and 2025-26 to support developing countries, with at least £3bn dedicated to nature-based solutions
-
Global Sectoral Pledges:
- Global Methane Pledge: Committing to reduce global methane emissions by 30% by 2030
- Clean Power: Ambition to achieve a 95% clean power system by 2030
- Zero Emission Vehicles (ZEV): Phasing out new petrol and diesel cars by 2030 and ensuring 100% of new cars and vans are zero-emission by 2035
- Jet Zero Strategy is the UK’s official plan to achieve Net Zero aviation by 2050. Launched in 2022 and reaffirmed by subsequent governments, it forms a core part of the UK’s broader climate commitments
- Maritime decarbonisation – Net Zero by 2050: A target for the UK maritime sector to achieve net-zero lifecycle greenhouse gas (GHG) emissions by 2050
Our Climate Adaptation Strategy
At departmental level, our direct operations are largely office based and, therefore, our direct climate and resilience impacts relate to our estate, IT and consumables. This can be seen in the sustainability report on page 55.
At a national level, we are a contributor to UK Government Climate Change Risk Assessments (CCRA), a 5-yearly requirement under the 2008 Climate Change Act. The third assessment, CCRA3, was published in 2021 and forms the basis of DESNZ’s strategic resilience planning.
It looks at risks and opportunities for the UK under 2 climate change scenarios, corresponding to approximately a 2°C or a 4°C rise in global temperature by 2100. It answers 3 questions, for 61 different risks or opportunities using available published evidence and analysis:
- What is the current and future level of risk or opportunity?
- Is the risk or opportunity being managed, taking account of government action and other adaptation?
- Are there benefits of further adaptation action in the next 5 years, over and above what is already planned?
As part of the CCRA there is a published Energy Sector Briefing, setting out specific Energy concerns:
It details that all energy infrastructure is vulnerable to climate change, particularly from increasing surface water and coastal flooding. Extreme weather such as temperature fluctuations, snow, ice, wind, and lightning can disrupt networks, though future wind and lightning risks are less certain. Energy systems are interconnected with other infrastructure (transport, ICT, water), meaning failures can cascade. Buried assets like gas pipelines face rising risks from flooding and subsidence. Hydroelectric output depends on river flows, which may become more variable with changing rainfall, as seen in reduced generation during the dry summer of 2018. Reduced water availability could also limit thermal, biomass, and gas power generation. Offshore infrastructure may face greater degradation from sea level rise and extreme weather, though this is hard to quantify. Warmer winters are likely to lower heating demand, while hotter summers may increase cooling demand, shifting peak electricity use.
The UK response/mitigation to the CCRA is then set out in the National Adaptation Programme (NAP). NAP3, from 2023, is the latest version, and this sets out what DESNZ’s climate resilience actions/mitigations are on behalf of the UK.
Within this, DESNZ owns or co-owns 10 sector risks. Details of the actions, and risk reduction goals for each risk that DESNZ owns, are taken directly from the 2023 NAP3 publication. These are historical in nature, but are set out below. They will be updated for the publication of NAP4, which will respond to CCRA4, published in May 2026.
Sector Risks owned by DESNZ
Risks cited in the NAP3 are split across various distinct sector categories. DESNZ has 10 risks in 2 sector areas; which are Infrastructure risks (indicated by an (I) below), and Health, Communities, and the Built Environment risks (indicated by a (H) below).
I2 – Risks to infrastructure services from river, surface water, and groundwater flooding (energy – DESNZ):
Risk reduction goal – to reduce the risks to the energy system from climate change-driven increases in river, surface water, and groundwater flooding.
| Actions | How we will do it |
|---|---|
| DESNZ will use the climate services for a Net Zero resilient world (CS-N0W (climate services for a Net Zero resilient world)) research programme through to 2025 to explore developing indicators to measure the progress of the mitigation of climate change risks to energy assets. | – CS-N0W research programme |
I3 – Risks to infrastructure services from coastal flooding and erosion (energy – DESNZ):
Risk reduction goal – Reduce the risks to the energy system from climate change-driven increases in coastal flooding and erosion.
| Actions | How we will do it |
|---|---|
| DESNZ will use the climate services for a Net Zero resilient world (CS-N0W) research programme through to 2025 to explore developing indicators to measure the progress of the mitigation of climate change risks to energy assets. | – CS-N0W research programme |
I4 – Risks to bridges and pipelines from flooding and erosion (energy – DESNZ):
Risk reduction goal – Reduce the risk to the energy system from pipeline damage caused by climate change-driven increases in flooding and erosion.
| Actions | How we will do it |
|---|---|
| DESNZ will encourage knowledge sharing across operators on risk mitigation approaches via existing engagement forums throughout the NAP3 implementation period, with a review point by end 2025, to enhance resilience to flooding and erosion. | – Energy Networks Association’s Climate Change Resilience Working Group |
| DESNZ will use the CS-N0W research programme through to 2025 to explore developing indicators to measure the progress of the mitigation of climate change risks to energy assets. | – CS-N0W research programme |
I6 – Risks to hydroelectric generation from low or high river flows (energy – DESNZ):
Risk reduction goal – Reduce the risk to hydroelectric generation from climate change-driven increases in low or high river flows.
| Actions | How we will do it |
|---|---|
| DESNZ will monitor power companies’ engagement with regional water resource planning initiatives and Energy UK’s engagement with the National Framework for Water Resources throughout the NAP3 implementation period, with a review point by end 2025, to drive understanding of and resilience to current and future low or high river flows. | – Adaptation Reporting Power (ARP) |
| DESNZ will use research and development throughout the NAP3 implementation period, including the CS-N0W research programme which runs to 2025, to improve understanding of future water availability and impacts on water-intensive energy infrastructure. | – CS-N0W research programme |
| DESNZ will use the CS-N0W research programme through to 2025 to explore developing indicators to measure the progress of the mitigation of climate change risks to energy assets. | – CS-N0W research programme |
I7 – Risks to subterranean and surface infrastructure from subsidence (energy – DESNZ):
Risk reduction goal – Reduce the risks to subterranean and surface energy infrastructure from climate change-driven increases in subsidence.
| Actions | How we will do it |
|---|---|
| DESNZ will engage with National Underground Asset Register (NUAR) development prior to it becoming operational in 2024 to consider how this knowledge could be used to facilitate further resilience measures by industry. | – Geospatial Commission’s National Underground Asset Register project |
| DESNZ will encourage knowledge sharing approaches across operators on risk mitigation approaches via existing engagement forums throughout the NAP3 implementation period from 2023 to 2028, with a review point by end 2025, to enhance resilience to subsidence. | – Energy Network Association’s Climate Change Resilience Working Group |
| DESNZ will use the CS-N0W research programme through to 2025 to explore developing indicators to measure the progress of the mitigation of climate change risks to energy assets. | – CS-N0W research programme |
I9 – Risks to energy generation from reduced water availability (energy infrastructure – DESNZ):
Risk reduction goal – Reduce the risks to energy generation from climate change-driven reduced water availability.
| Actions | How we will do it |
|---|---|
| DESNZ will monitor power companies’ engagement with regional water resource planning initiatives and Energy UK’s engagement with the National Framework for Water Resources to drive understanding of and resilience to reduced water availability throughout the NAP3 implementation period, with a review point by end 2025. Energy UK is also engaging with the Environment Agency as they develop the abstraction licensing transition into the Environmental Permitting Regulations. | – Adaptation Reporting Power (ARP) |
| DESNZ will use research and development, including the CS-N0W research programme, which runs until 2025, to improve understanding of future water availability and impacts on water-intensive energy infrastructure. Energy UK has been contributing to the Environment Agency project on Humber industrial constraints. | – CS-N0W research programme |
| DESNZ will continue work with industry throughout the NAP3 implementation period, with a review point by end 2025, to understand the future water needs for the power sector in its transition to net zero. Industry will also work on this via private initiatives, such as UK Water Industry Research’s work on the feasibility of scaling hydrogen production in relation to water consumption. | – CS-N0W research programme – Energy and Water External Steering Group, which is led by the Environment Agency and has participation from Defra, DESNZ, the Scottish Environment Protection Agency and other stakeholders |
| DESNZ will use the CS-N0W research programme through to 2025 to explore developing indicators to measure the progress of the mitigation of climate change risks to energy assets. | – CS-N0W research programme |
I10 – Risks to energy from high and low temperatures, high winds, and lightning (energy infrastructure – DESNZ):
Risk reduction goal – Reduce the risk to the energy system from climate change-driven increases in incidences of severe weather.
| Actions | How we will do it |
|---|---|
| DESNZ will use the CS-N0W research programme through to 2025 to explore developing indicators to measure the progress of the mitigation of climate change risks to energy assets. | – DESNZ-funded CS-N0W research |
| DESNZ will conduct an internal review by 2024 of governance arrangements for climate resilience in the energy system, to ensure they are fit for the new expanded and more diverse low-carbon system given increasing societal reliance on electricity. | – No specific action mentioned in the NAP3 |
| By 2024, DESNZ will designate parties responsible now and in the future for the maintenance of energy sector codes and standards, with a clear mandate to ensure climate and weather resilience. | – Development of future system operator licence conditions |
I11 – Risks to offshore infrastructure from storms and high waves (DESNZ):
Risk reduction goal – Sustain current levels of resilience and safety in offshore infrastructure in the context of increased severity and frequency of climate impacts.
| Actions | How we will do it |
|---|---|
| DESNZ will continue to work with regulatory bodies throughout the NAP3 implementation period to 2028 and beyond to ensure that current and new offshore installations are suitably designed to minimise, mitigate or reduce as far as reasonably possible the risk of damage caused by extreme weather conditions at sea. | – The Health and Safety at Work Act 1974 – The Offshore Installations (Offshore Safety Directive) (Safety Case, etc) Regulations 2015 – All applicable active marine guidance notes |
| DESNZ will continue to work with regulatory bodies throughout the NAP3 implementation period to 2028 and beyond to ensure that risks to offshore infrastructure and personnel are minimised in accordance with relevant sector guidelines. They will also ensure operators maintain sufficient risk assessments and procedures to minimise risk to personnel at sea. | – The Health and Safety at Work Act 1974 – The Offshore Installations (Offshore Safety Directive) (Safety Case, etc) Regulations 2015 – All applicable active marine guidance notes |
| DESNZ will continue to work with regulatory bodies throughout the NAP3 implementation period to 2028 and beyond to ensure that climate risks are considered within the codes, standards and guidance for other offshore infrastructure and vessels operating within and across the UK continental shelf. | – The Health and Safety at Work Act 1974 – The Offshore Installations (Offshore Safety Directive) (Safety Case, etc) Regulations 2015 – All applicable active marine guidance notes |
H5 – Risks to building fabric (DESNZ and the Department for Levelling Up, Housing and Communities – DLUHC):
Risk reduction goal – Understand the impact to the different building fabrics and approaches to mitigate impacts from climate change induced hazards including extreme weather events, winds, and wildfires in the UK under different warming scenarios considering vulnerabilities and equality duties. DESNZ will ensure that measures to deliver net zero and retrofit existing buildings, as described in the Heat and Buildings Strategy, will seek to minimise risks to building fabric due to the impacts of climate change. This will result in an existing building stock that is appropriately retrofitted to deliver net zero by 2050 and more resilient to climate hazards.
| Actions | How we will do it |
|---|---|
| DESNZ plan to carry out a detailed risk assessment for the UK’s existing building stock’s exposure to damage from 2080 climate hazards by 2028 using a programme of research. Research will be carried out from 2023 to 2028, gathering evidence to enable this risk assessment, with outputs delivered throughout this period. For example, research modelling projected wind-driven rain risk in 2080 will report back by the end of 2023. The research in this action will support the development of tailored adaptation actions for local areas, it will consider unequal effects of climate change on at-risk groups, and feed into the development of the Heat & Buildings Strategy Policy Framework. | – Research framework study – Mapping climate hazards using UKCP18 Climate Projections for 2°C and 4°C scenarios – Academic secondment to research and catalogue holistic adaptation strategies for different building archetypes |
| DESNZ require that measures installed under current Government schemes must be carried out by a Trustmark registered and, where appropriate, Publicly Available Specification (PAS) 2030 certified installer in accordance with PAS 2035. PAS 2035/2030:2023 is expected to be published in 2023. | – Academic secondment to research and catalogue holistic adaptation strategies for different building archetypes – Funding for fuel poor homes announced in the 2021 Spending Review – Green Homes Grant (Local Authority Delivery scheme 2&3) (until 2023) – Home Upgrade Grant (HUG) (2022-2025) – Boiler Upgrade Scheme – ECO 4 (extended until 2026) – The Great British Insulation Scheme (2023-2026) – Social Housing Decarbonisation Fund (SHDF) (2020‑2025) – Public Sector Decarbonisation Funding Scheme (2021-2025) – TrustMark Scheme – PAS 2035/2030 standards – Review of practical planning barriers to energy efficiency measures in conservation areas and listed buildings, (2022-2023) – Energy Bill (2023) – Update of the Energy Performance of Building Regulations for EPCs (2023-24) – Future development of the SAP methodology (SAP11) (2021-2025) – Strengthening the Energy Savings Opportunity Scheme (ESOS) for Phase 4 (2023-2027) – Consider introducing Minimum Energy Efficiency Standards across building tenures (2025-2030) |
Note: DLUHC’s contribution is not included here. It can be found in the NAP3 publication
H6 – Risks and opportunities from summer and winter household energy demand – DESNZ:
Risk reduction goal – Take account of climate risks, especially overheating, when improving the energy performance of buildings to actively manage the risk of increased energy demand due to potential active cooling. This will be informed by research to fill gaps in our understanding of what measures and changes are likely for different buildings and their impacts for energy demand, including the role of cooling, looking at both 2°C and 4°C warming projections. DESNZ will ensure that measures to deliver net zero and retrofit existing buildings, as described in the Heat and Buildings Strategy, will minimise the risk of overheating and the increased energy demands associated with active cooling. This will result in the existing building stock being appropriately retrofitted to deliver net zero by 2050 and more resilient to climate hazards.
| Actions | How we will do it |
|---|---|
| DESNZ requires that measures installed under current government schemes must be carried out by a TrustMark registered and, where appropriate, Publicly Available Specification (PAS) 2030 certified installer in accordance with PAS 2035. PAS 2035/2030:2023 is expected to be published in 2023. | – Funding for fuel poor homes announced in the 2021 Spending Review – Green Homes Grant (Local Authority Delivery Scheme 2&3) (until 2023) – Home Upgrade Grant (HUG) (2022-2025) – Boiler Upgrade Scheme – ECO 4 (extended until 2026) – The Great British Insulation Scheme (2023-2026) – Social Housing Decarbonisation Fund (SHDF) (2020-2025) – Public Sector decarbonisation funding scheme (2021-2025) – Trustmark Scheme – PAS 2035 and 2030 – Energy Bill (2023) – Update of the Energy Performance of Building regulations for EPCs (2023-24) – Future development of the SAP methodology (SAP 11) (2021 – 2025) – Review of practical planning barriers to energy efficiency measures in conservation areas and listed buildings (2023) – Strengthening the Energy Savings Opportunity Scheme (ESOS) for Phase 4 (2023-2027) – Consider introducing minimum energy efficiency standards across building tenures, 2025-2030 |
| DESNZ will conduct research to help assess projected energy demand and system impacts due to the risk of overheating and different potential cooling energy demand trajectories building on existing evidence. Research will be carried out through the NAP3 implementation period from 2023 to 2028, producing evidence to support analysis and decision making with outputs delivered throughout this period. | – Cooling in the UK – DESNZ Research Report (Sep 2021) – English Housing Survey – English Housing Survey Energy Follow Up Survey (EFUS) results and subsequent research by DESNZ and others – Co-funding PhDs to research overheating risks and mitigation – Climate science for a Net Zero resilient world (CW-N0W) Overheating analysis |
Governance
Our mission-based approach defines the end goal and focuses on outcomes, enabling more joined-up, innovative and flexible delivery.
The Clean Energy Superpower Mission (CESM) is made up of 2 pillars: Clean Power by 2030 and Accelerate to Net Zero. The CESM utilises a ‘Cabinet Committee Level’ Mission Board as the principal senior governance mechanism to provide strategic direction, unblock challenges and organise key departments to deliver on the Mission.
Within DESNZ, both pillars utilise additional governance mechanisms to support and track delivery of their workstreams. Successful delivery of the mission and its various priorities will be a shared endeavour requiring extensive engagement and investment from citizens, business, and industry.
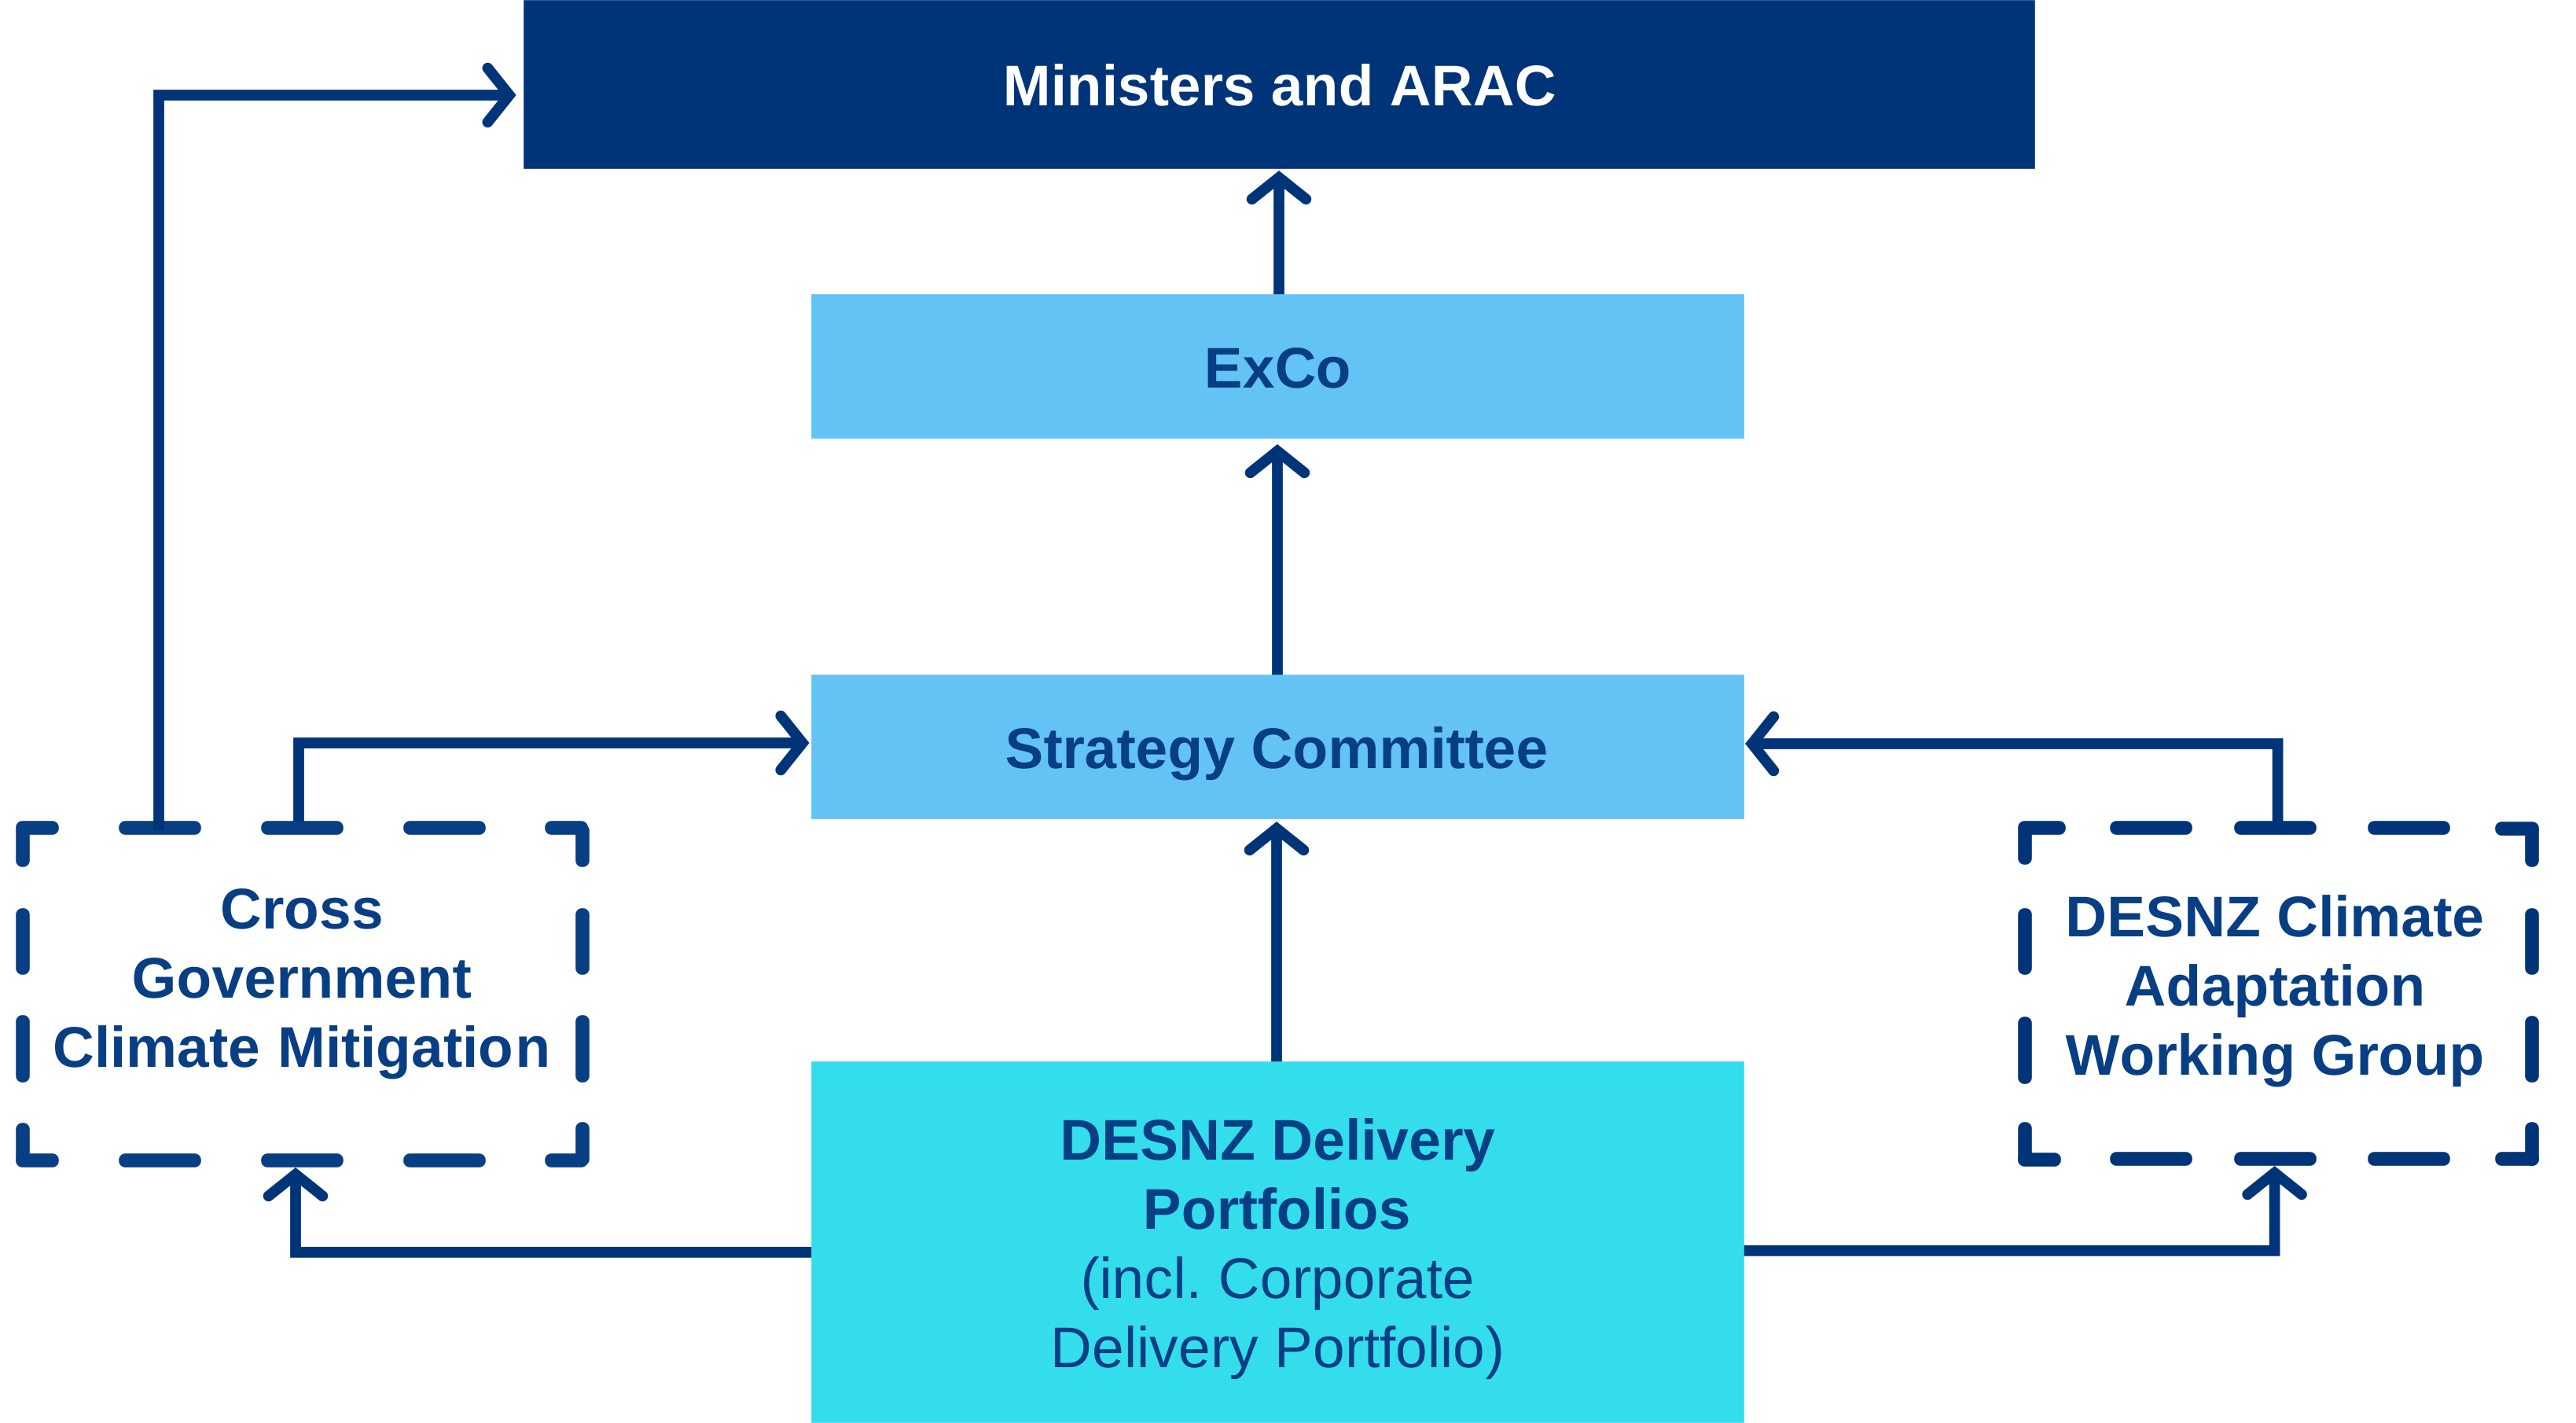
Governance map: diagram data:
DESNZ Delivery Portfolios (incl. the Corporate Delivery Portfolio) report to the Strategy Committee.
The Strategy Committee report to ExCo.
ExCo report to Ministers and ARAC.
The Delivery Portfolios also works with 2 climate groups:
- Cross-Government Climate Mitigation
- DESNZ Climate Adaptation Working Group
Both these groups advise the Strategy Committee. The cross-government group also feeds back direct to Ministers and ARAC.
The Strategy Committee is a senior official governance committee in DESNZ, operating as a subcommittee of the Executive Committee (ExCo). It brings together the Permanent Secretary and Directors General to focus on complex, cross‑cutting strategic issues that need senior alignment and, in some cases, decisions.
The Strategy Committee provides an informal but authoritative space for senior leaders to: think collectively about strategic direction, test emerging policy choices, and explore trade‑offs across portfolios. The Strategy Committee focuses on strategic, cross‑cutting issues, rather than routine delivery or performance management and can take decisions that carry the authority of ExCo, where appropriate.
The assessment made by the Strategy Committee can then feed back into specific decision-making through:
- providing the department’s executive committee (ExCo) with recommendations for required interventions
- providing steers for consideration for any of the programmes or projects that contribute towards delivering or enabling carbon savings/decarbonising the power sector/maintaining security of supply/affordable energy supply ensuring plans and risk management include cross-cutting elements identified by the boards
- The Strategy Committee does not assure individual project, programme, or portfolio performance, but take their collective performance into account when assessing progress against outcomes
Within our portfolio management governance structure, which continues to mature, our strategic delivery portfolios will directly manage risks to the achievement of their individual policy outcomes, including their contributions to net zero, energy decarbonisation, security, affordability, and market design. The Strategy Committee has a helicopter view across all the portfolios and draws together where risks impact across the piece. If required, the Strategy Committee can then recommend a new strategic risk be added to the DESNZ register. They will similarly be able to identify where opportunities can be taken across portfolios to improve overall delivery.
The Climate Adaptation Working Group is not a formal decision-making committee in DESNZ’s corporate governance hierarchy (it does not sit alongside ExCo, Strategy Committee, ARAC, etc.). Instead, it sits as an official‑level, cross‑departmental working group operating below senior committees, and is convened by the Energy Security and Resilience (ESR) Portfolio Management and Strategic Risk Team.
The Climate Adaptation Working Group provides a cross‑DESNZ forum to coordinate thinking on climate adaptation and resilience, particularly where this affects energy systems, infrastructure, policy delivery, and risk. It focuses on sense‑making, evidence‑sharing and alignment, rather than governance or delivery sign‑off.
The Climate Adaptation Working Group does not formally report to the Strategy Committee, but it supports Strategy Committee indirectly. The working group provides working‑level analysis, evidence and discussion on climate adaptation risks, scenarios, and uncertainty, which are used by corporate climate governance and strategic risk owners.
Risk management
As described in the governance section, DESNZ’s risk management framework is established around a portfolio structure, with each level of that structure being responsible for delivery of their own risk management and ExCo having ownership of our Departmental Strategic Risks.
By the very nature of the department’s outcomes, this will include the management of climate related risk, globally, within the UK and related to delivery of our programmes and projects.
Climate-related resilience considerations are addressed across DESNZ over multiple planning horizons, reflecting the differing nature of departmental functions and policy objectives. Strategy teams consider the immediate and cross-cutting resilience implications for departmental priorities, including current energy security, affordability and delivery risks.
Teams responsible for Clean Power 2030 consider nearer-term resilience issues associated with the transition to a predominantly clean power system over this decade, including system operability, infrastructure readiness and exposure to acute climate hazards.
Energy networks teams consider longer-term resilience to 2050, including how network design, asset standards and investment decisions may need to adapt to the projected impacts of chronic and acute climate risks over the lifetime of infrastructure. This supports an approach in which climate resilience is considered alongside decarbonisation, security of supply and long-term system transformation.
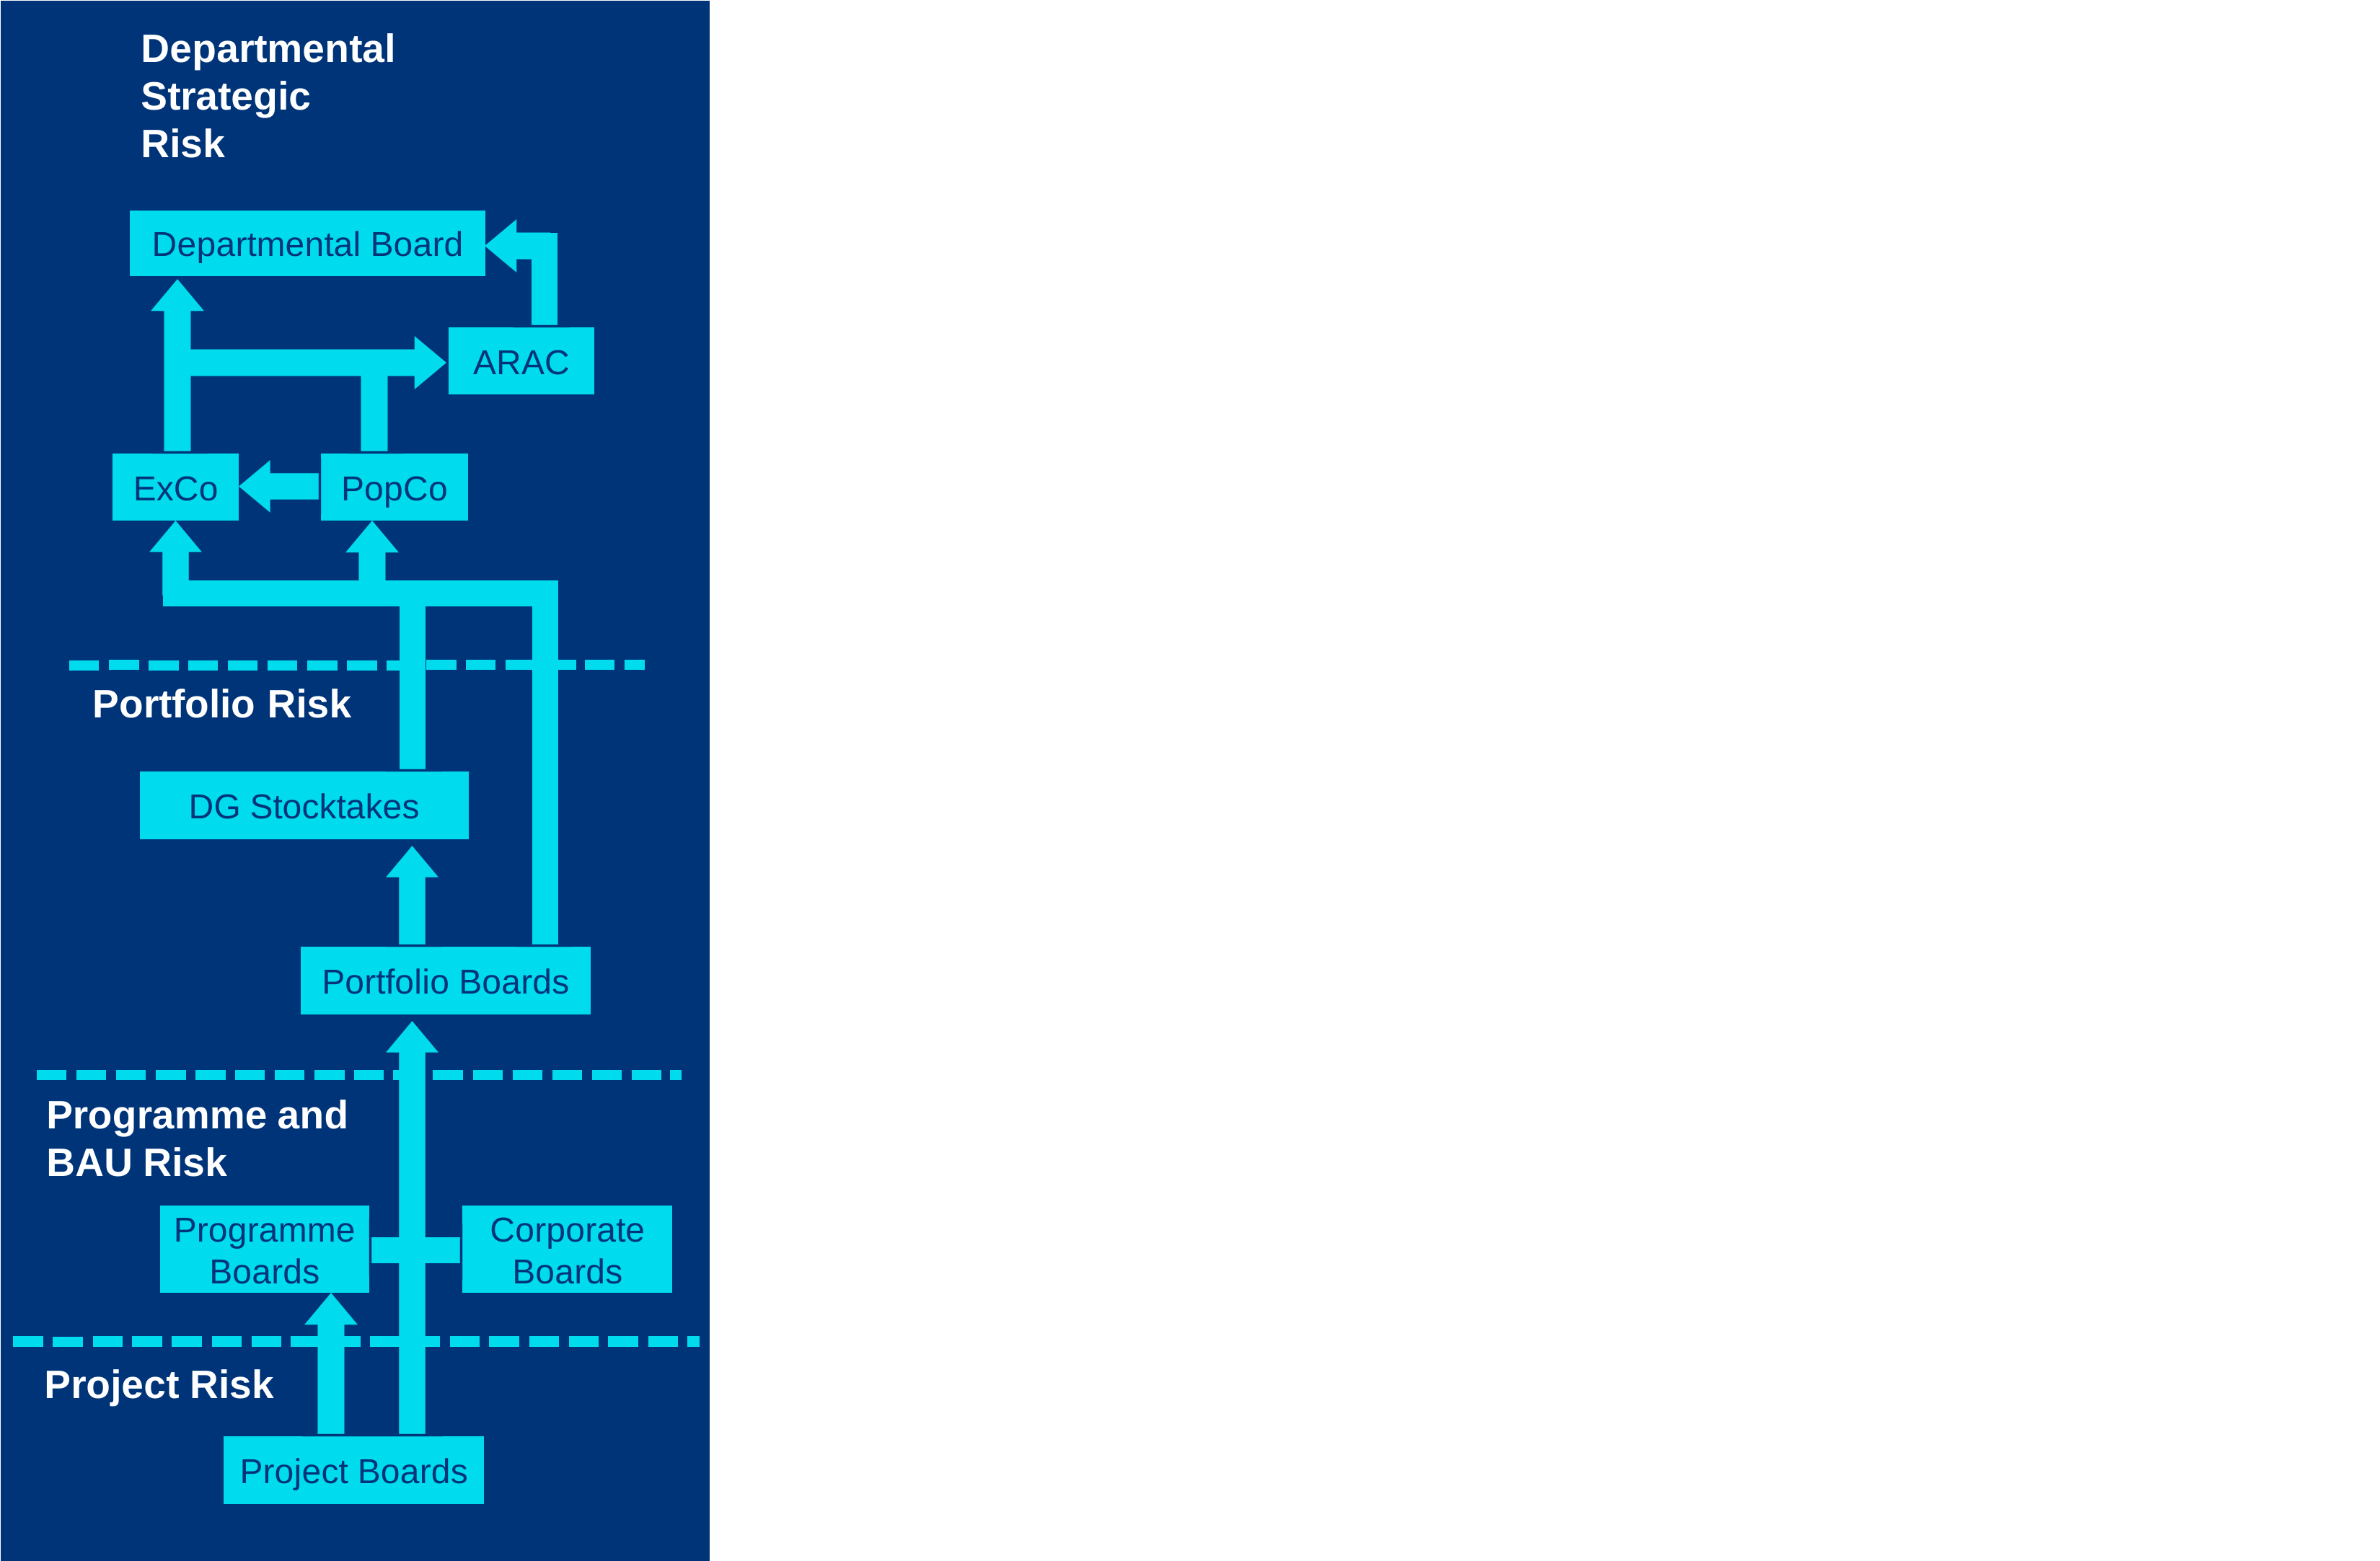
Departmental Strategic Risk Register: diagram data:
Departmental Strategic Risk:
The Departmental Risk Team in Portfolio and Data Directorate reviews the DESNZ Strategic Risks and reports them to ExCO & ARAC.
They also consider escalations and the aggregation of risk themes from the Portfolios, working with risk owners to ensure the right governance body reviews them.
ExCo, POpCo and ARAC conduct deep dives on individual DSRR risks across the year.
Portfolio Risk:
Senior Strategy Delivery Advisers / DD Group Risk Champions help review risk on the Portfolio Registers under their DG and co‑ordinate review at Group SLT (as agreed by each DG), and at DG Stocktakes. SDAs and DRT provide advice and guidance to Portfolio Offices/Teams on risk management best practice.
Programme and BAU Risk:
The Portfolio Offices/Teams review the risks on their portfolio registers at their board and consider whether there is a departmental impact to flag for discussion or if there is a formal escalation to the Departmental Strategic Risk Register.
Portfolio teams also ensure that risk management in their programmes and projects is robust.
Project Risk:
Programmes and Projects manage their risks in ORB and/or Verto, updating them each month and escalating to Portfolio when necessary.
Strategy teams across DESNZ set and monitor delivery of the UK’s Carbon Budgets on behalf of government, and international and energy teams invest in technologies, at home and abroad, based on their climate impact and resilience to climate change. As part of this, the department commissions independent research into these themes to amend policy and to set funding criteria.
The department also contributes heavily to government’s long-term climate and energy scenarios, previously articulated as the chronic risks in the National Risk Register.
Metrics and targets
Net Zero and UK Energy:
As the lead department for UK net zero policy and monitoring, most of our metrics and targets are already published. These include:
1. Climate Change Reductions
Key DESNZ products:
1a. UK Carbon Budget Targets, the data used to set them, and our plans to achieve them
- The carbon budget for the 2023–2027 budgetary period is 1,950,000,000 tonnes of carbon dioxide equivalent
- The fifth carbon budget for the (2028–2032) budgetary period is 1,725,000,000 tonnes of carbon dioxide equivalent
- The sixth carbon budget for the (2033-2037) budgetary period is 965,000,000 tonnes of carbon dioxide equivalent
- The seventh carbon budget (2038-2042) budgetary period has not yet been formally set, but in their February 2026 report, the CCC recommended that this should be set at 535m tonnes of carbon dioxide equivalent
1b. Energy and climate change: evidence and analysis including ‘UK Energy Trends’ and ‘Digest of UK Energy Statistics’ products for total energy and energy supply/demand balance, as well as for specific areas of electricity, renewables, gas, etc.
1b.i) UK Energy Trends – below are 2 charts taken from the UK Energy Trends publication showing UK energy production, and total UK inland energy consumption by primary fuel source. More detailed charts and analysis can be found in the report.
Chart 1.1 UK production
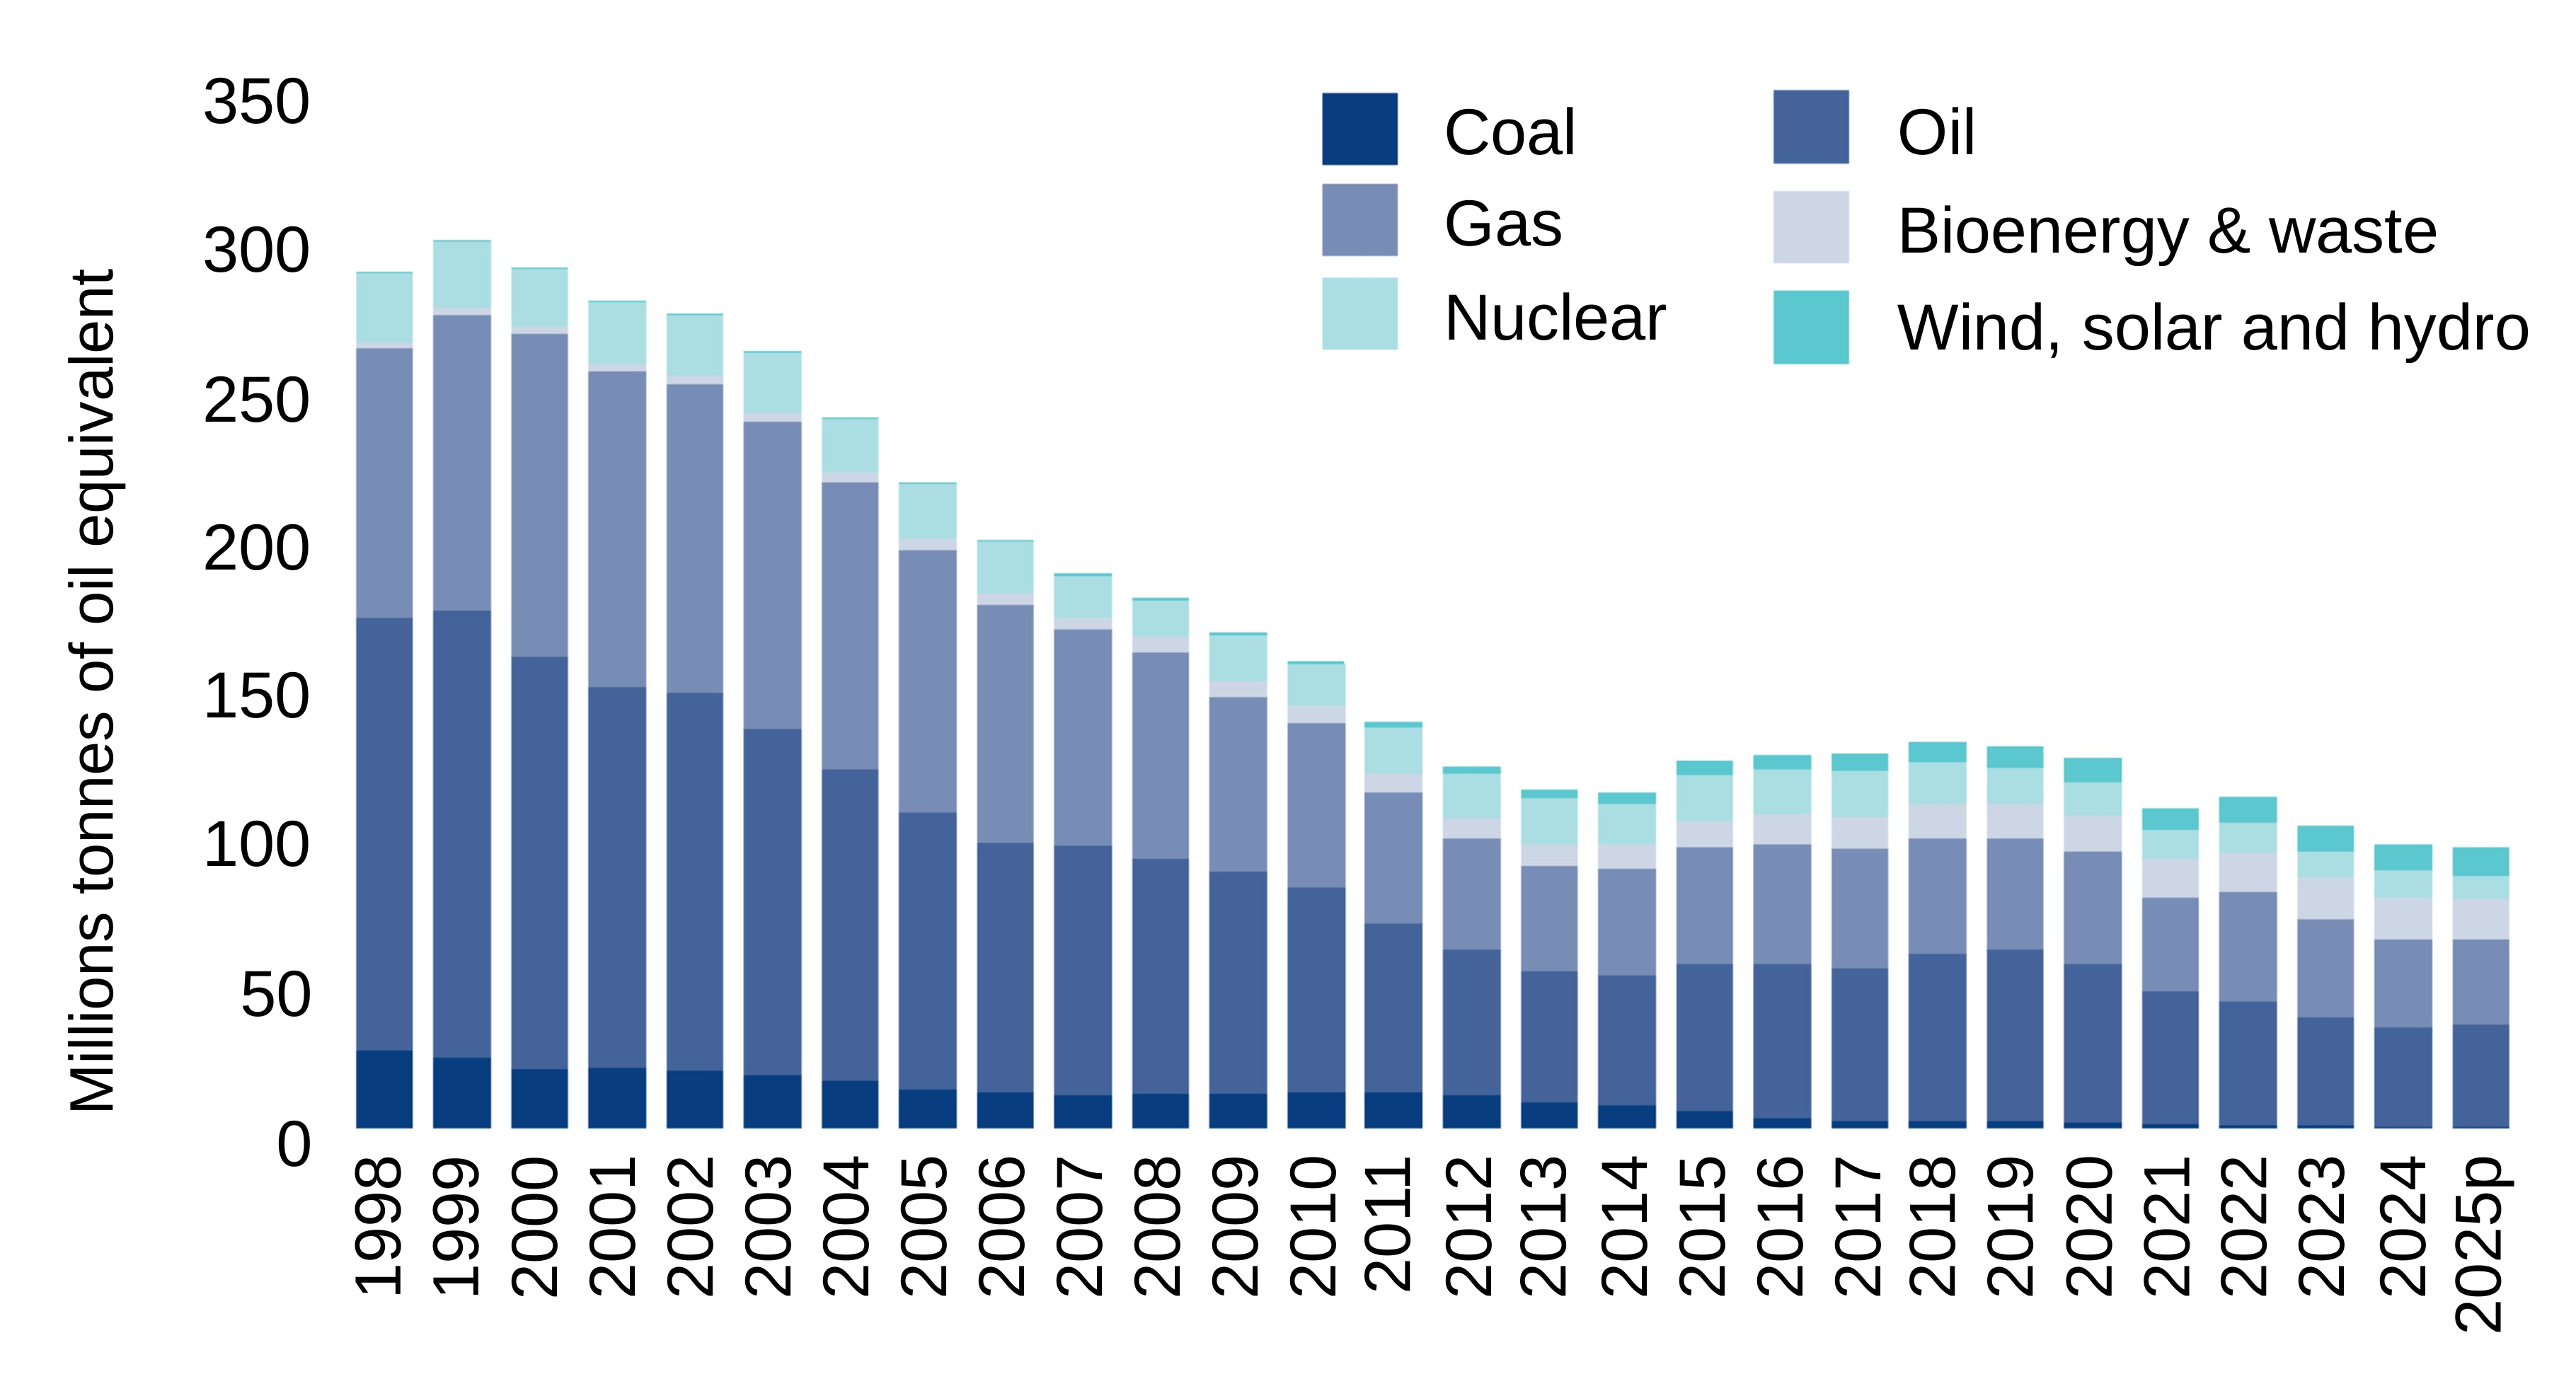
Chart 1.1: In 2025 total production was 94.0 million tonnes of oil equivalent, 1.0 per cent lower than in 2024 and at a record low level in the published series, and 68 per cent lower than in 1999 when UK production peaked. Production levels for all fuels except coal, oil, and wind, solar and hydro are down, with gas and nuclear output at record low levels. Production of oil rose by 2.5 per cent, whilst natural gas fell by 3.3 per cent to a record low level. Electricity produced from nuclear sources fell by 12 per cent to a record low level as continued outages affected the UK nuclear fleet. Electricity produced from wind, solar and hydro rose by 8.1 per cent to a record high level, with output from wind and solar up but hydro down on 2024 levels.
Chart 1.2 Total inland consumption (primary fuel input basis)
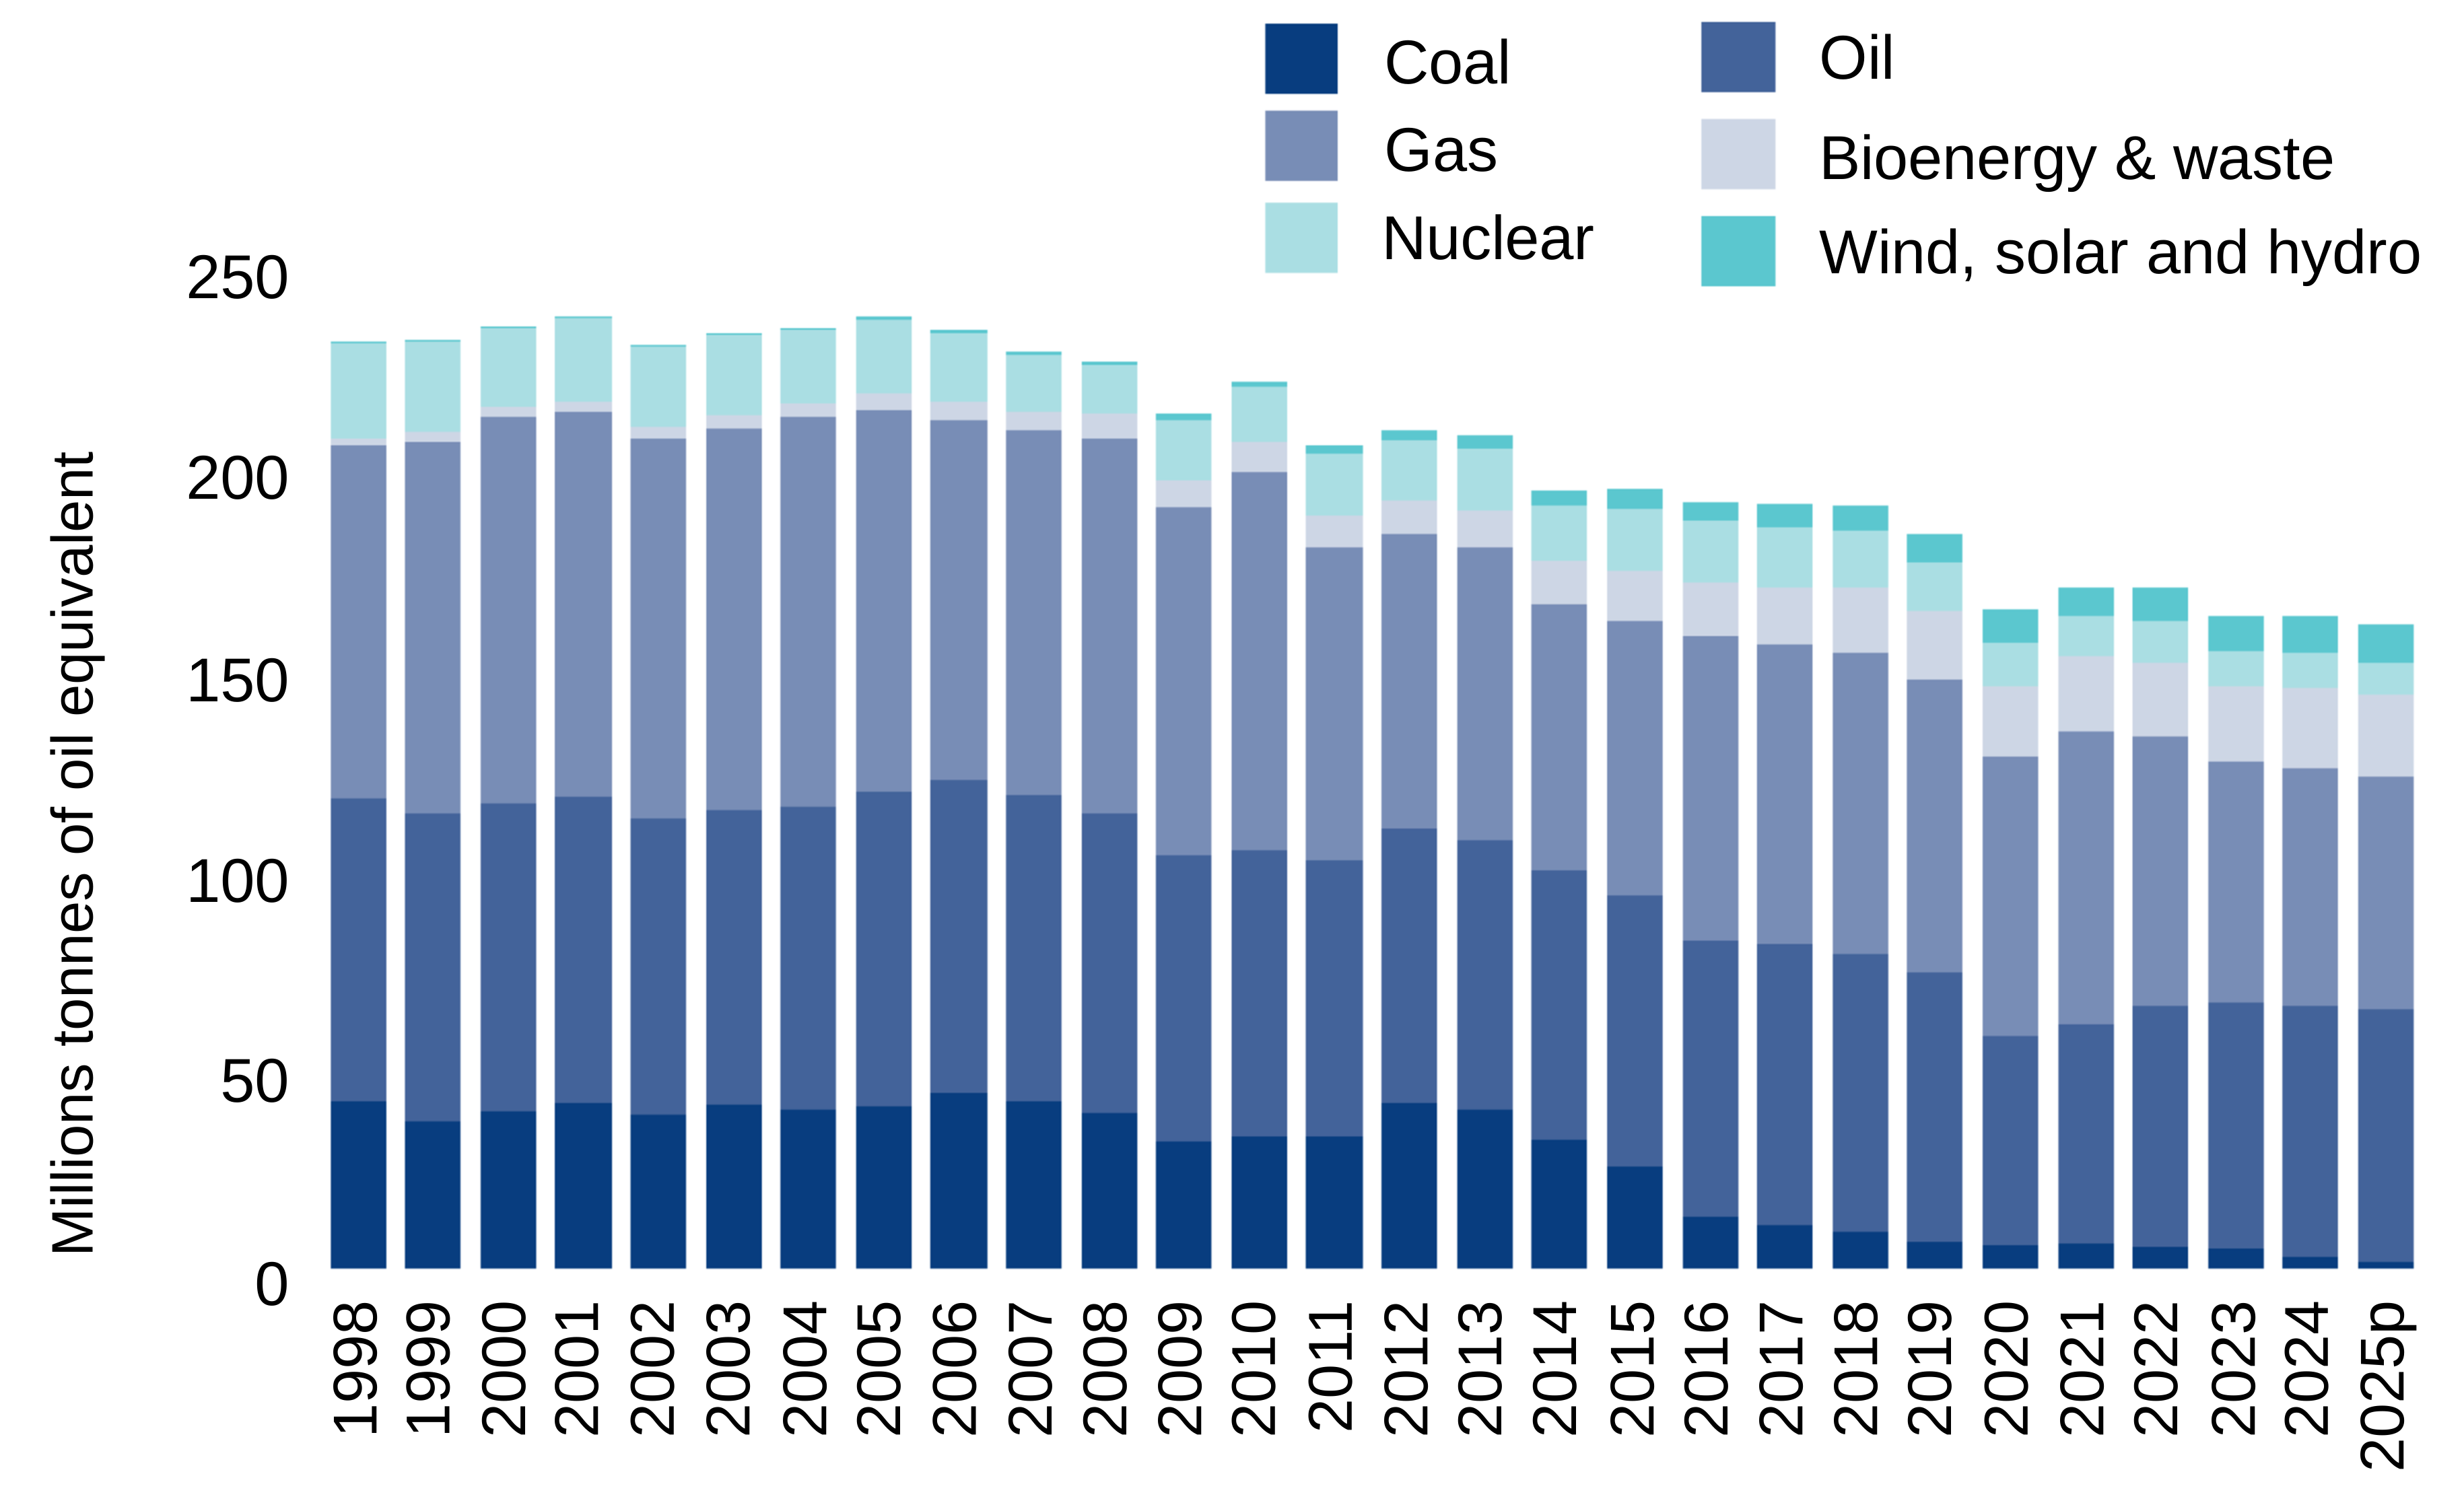
Chart 1.2: In 2025 total inland consumption (this includes not only fuel use by consumers, but fuel used for electricity generation and other transformation) was 164.5 million tonnes of oil equivalent, down 1.8 per cent compared to 2024 and down 11 per cent on pre-pandemic (2019) levels (on a seasonally adjusted and annualised rate that removes the impact of temperature on demand).
1b. ii) Digest of UK Energy Statistics (DUKES) – More detailed analysis can be found in the report.
2. Commissioned and independent products
2a) Clean Power 2030 is a National Energy System Operator report looking at supply and demand and network operability as we move to clean power.
In line with independent advice from the National Energy System Operator (NESO), our clean power target means transitioning to an electricity system with the following characteristics in a typical weather year:
- Clean sources produce at least as much power as Great Britain consumes in total, and;
- Clean sources produce at least 95% of Great Britain’s generation
We expect delivering a clean power system with these characteristics will make Great Britain a net exporter of electricity and will reduce the carbon intensity of electricity generation from 171gCO2 e/kWh in 2023 to well below 50gCO2 e /kWh in 2030, well within the Climate Change Committee’s guidelines.
Whilst the expansion of renewables in the power system has reduced the share of fossil fuel generation to date (see chart below), all routes to a Clean Power system will require mass deployment of offshore wind, onshore wind, and solar.
Securing affordable, homegrown renewables means we will be able to run our power system for increasing periods on low carbon generation, with renewables providing the vast majority of generation, and nuclear continuing to deliver a backbone of vital firm low carbon power.
Source: DUKES 2025 Chapter 1-7
Chart 1.3 Electricity generated by fuel, 2000 to 2024
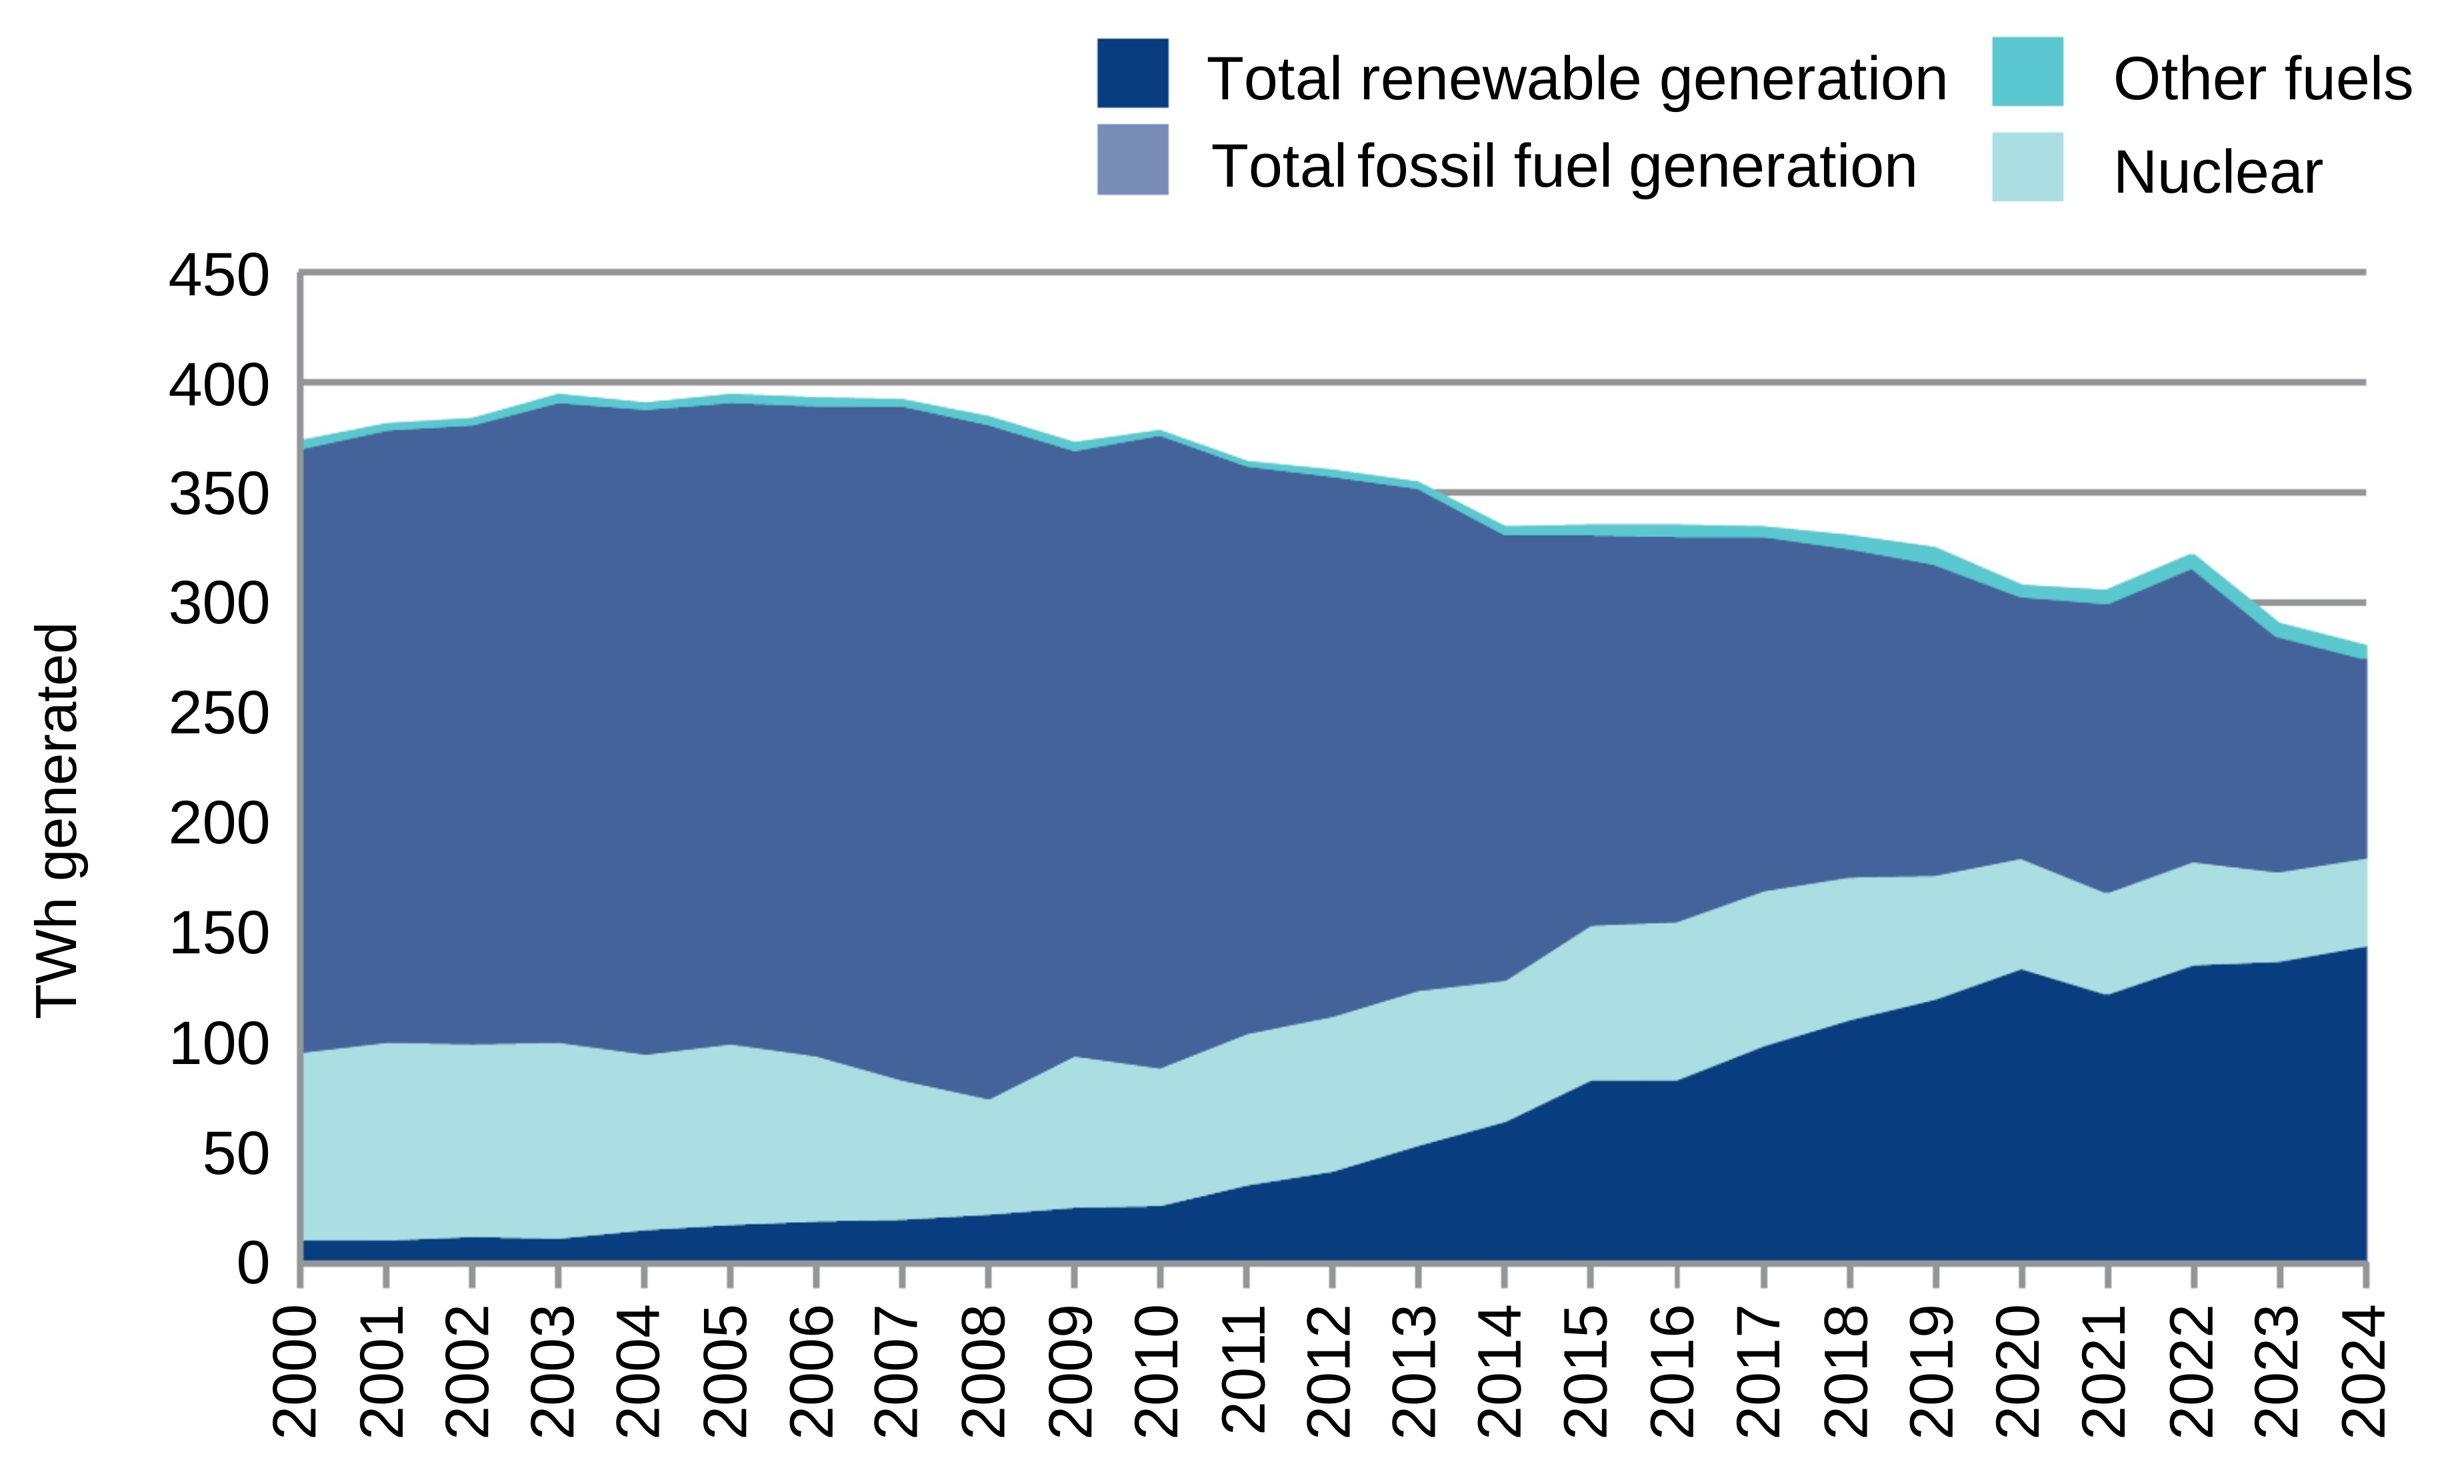
Chart 1.3: Despite broadly stable UK demand, electricity generation fell to 285.0 TWh in 2024, down 3.1 per cent from 2023. This was due to record-high electricity imports which displaced some UK-based generation. Major Power Producers (MPPs) generated 229.0 TWh, down 3.7 per cent compared to 2023, while generation from autogenerators and other generators decreased slightly, down 0.6 per cent to 55.9 TWh. The share of generation from MPPs decreased by 0.5 percentage points to 80.4 per cent.
2b) The Seventh Carbon Budget – Climate Change Committee is a statutory report from the Climate Change Committee providing advice to the UK government on the level of the Seventh Carbon Budget (2038 to 2042).
Below is a graph illustrating the CCC’s recommended path to net zero and the various carbon budgets that will get the UK to net zero.
Figure 1: The recommended Seventh Carbon Budget
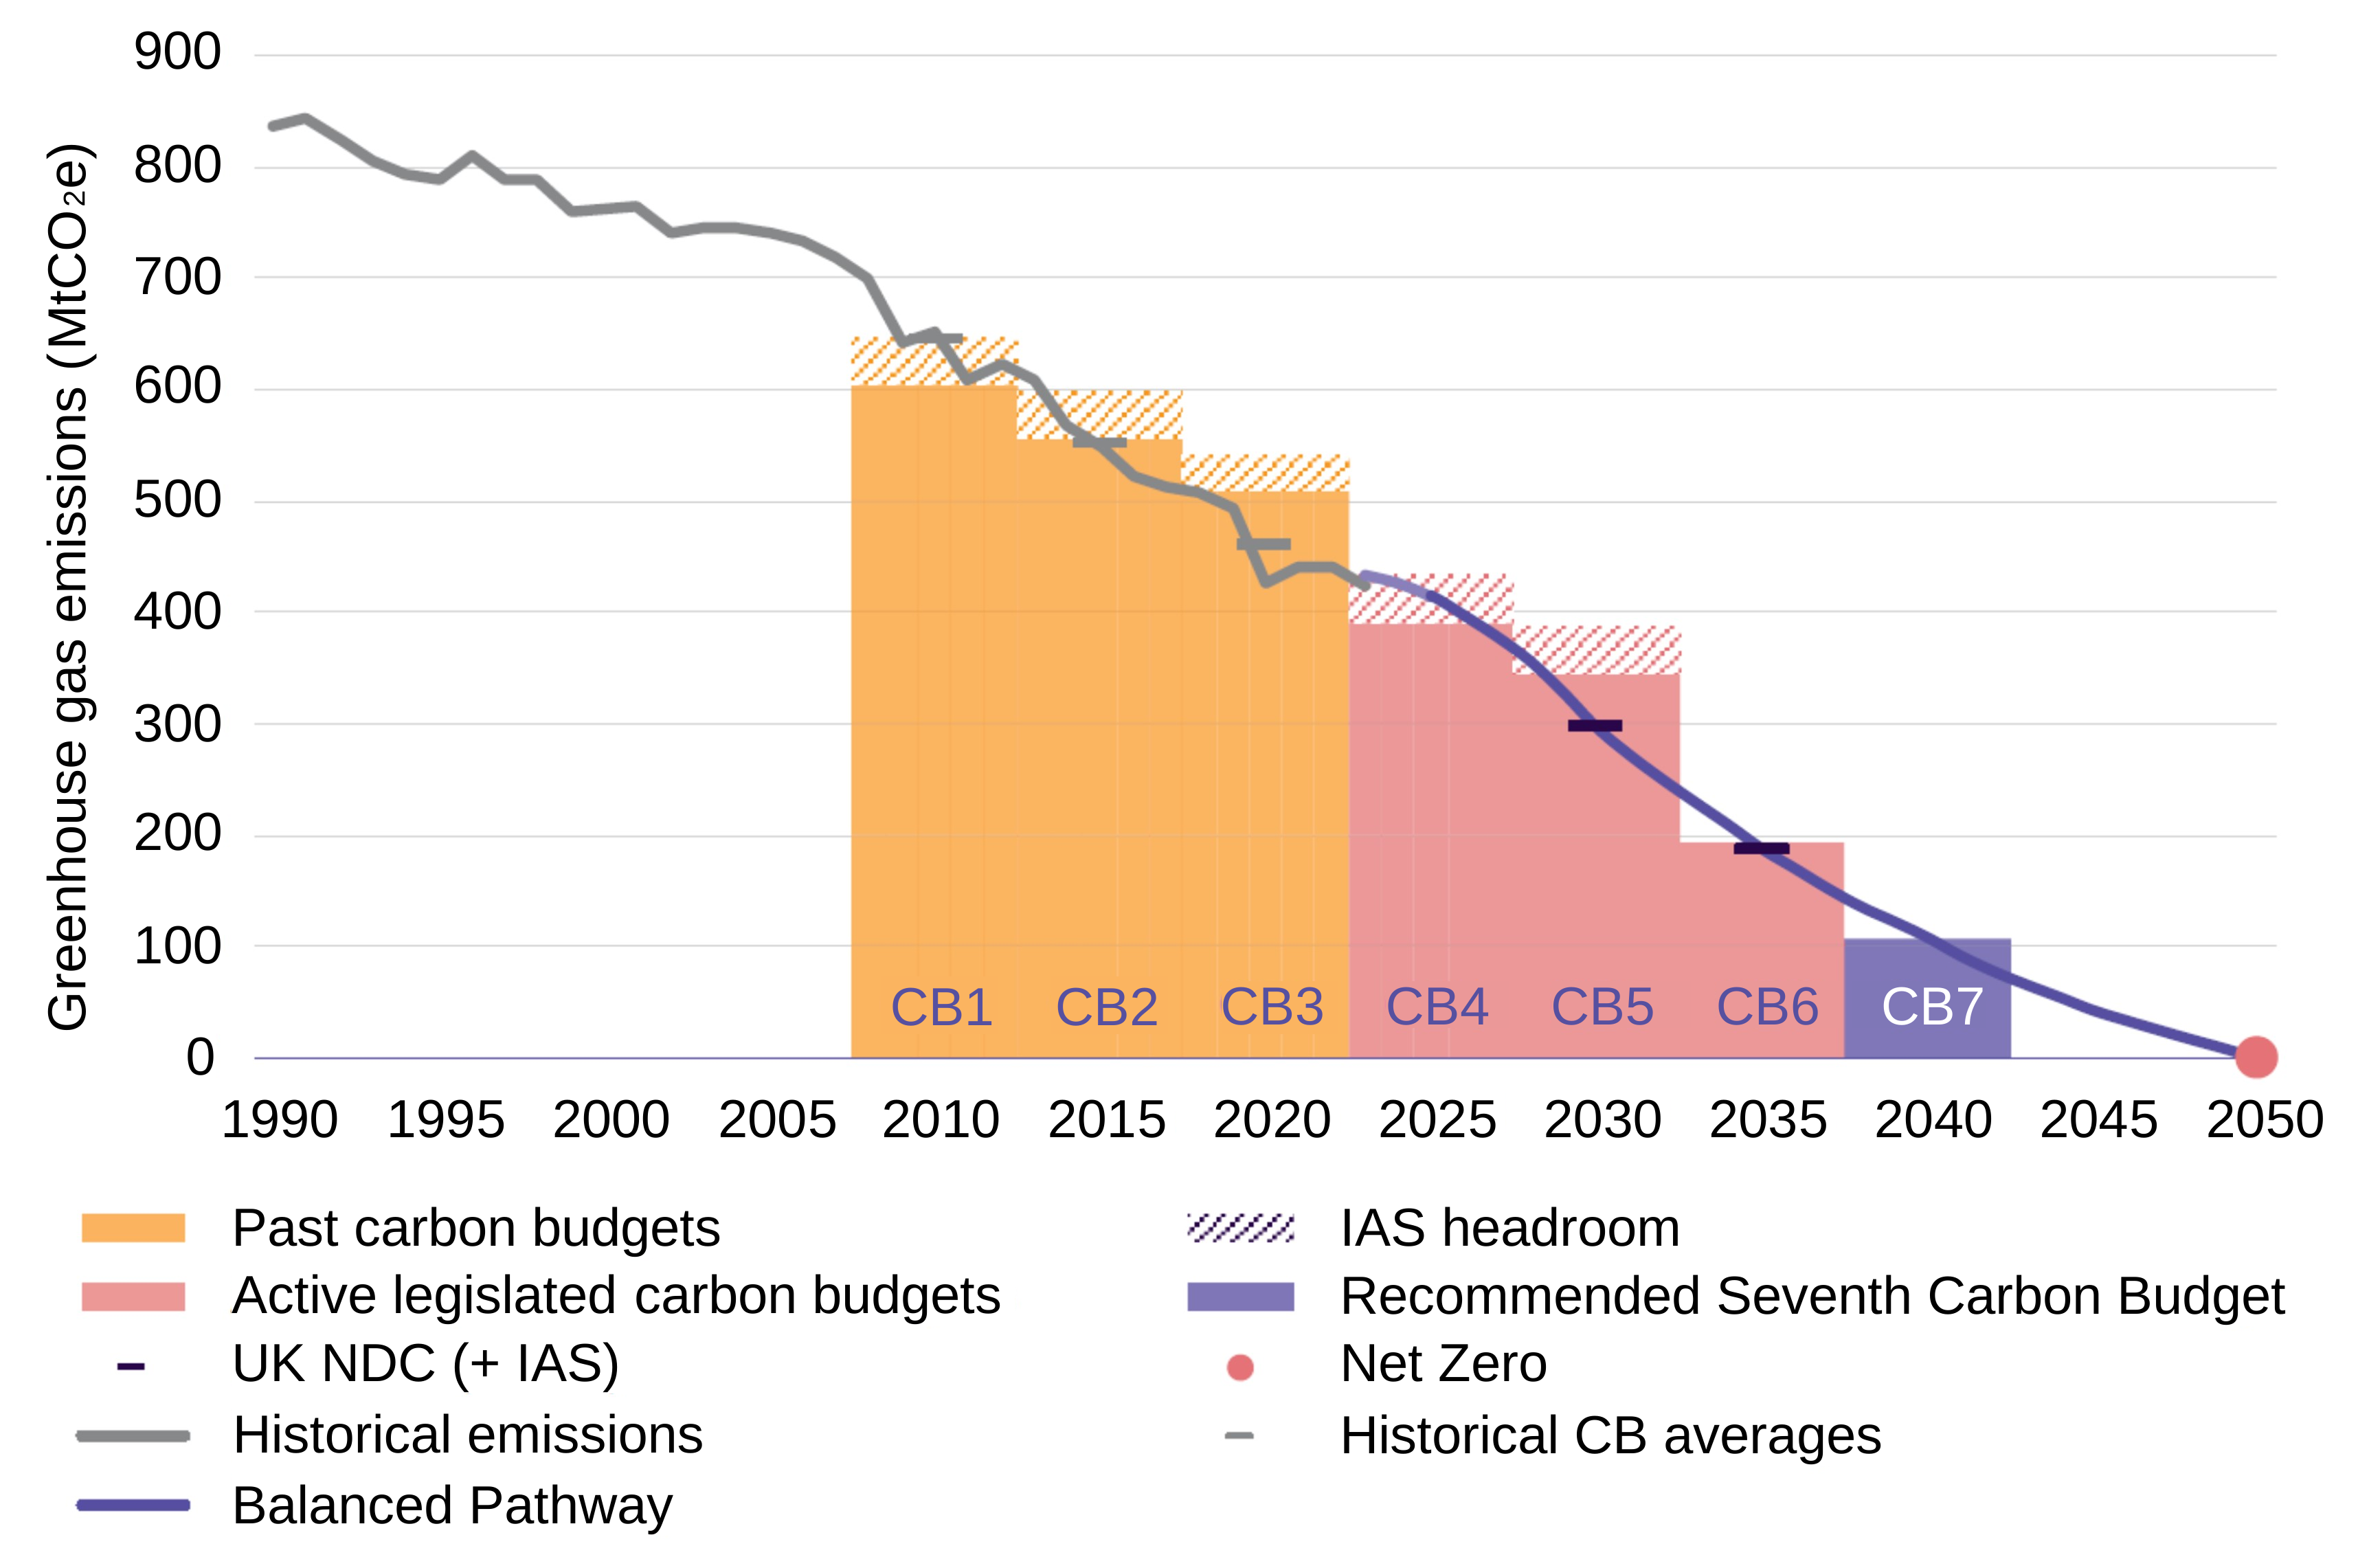
Description: The Balanced Pathway meets the UK’s existing future emissions targets and sets the recommended level for the UK’s next target: the Seventh Carbon Budget.
Source: Department for Energy Security and Net Zero (DESNZ) (2024) Provisional UK greenhouse gas emissions national statistics 2023; DESNZ (2024) Final UK greenhouse gas emissions national statistics: 1990 to 2022; Climate Change Committee (CCC) analysis.
Notes: See Chapter 3. ‘CB’ refers to the UK’s carbon budget. ‘CB1’ refers to the First Carbon Budget; subsequent numbers refer to subsequent carbon budgets. ‘IAS’ refers to international aviation and shipping. ‘UK NDC’ refers to the UK’s Nationally Determined Contributions.
2c) UK Low carbon and renewable energy economy (LCREE) is the Office for National Statistics publications on UK’s low carbon and renewable energy economy, including turnover and employment.
Table 1: UK low carbon and renewable energy economy turnover was an estimated £77bn, with 304,000 FTEs in 2024
LCREE turnover and full-time equivalent (FTE) employment estimates (with confidence intervals), UK and constituent countries, 2024.
| Turnover (£ billions) Estimate |
Turnover (£ billions) Lower CI |
Turnover (£ billions) Upper CI |
Employment (FTE) Estimate |
Employment (FTE) Lower CI |
Employment (FTE) Upper CI |
|
|---|---|---|---|---|---|---|
| UK | 77.0 | 68.9 | 85.0 | 304,000 | 276,300 | 331,800 |
| England | 58.7 | 52.1 | 65.3 | 247,500 | 222,900 | 272,100 |
| Scotland | 13.3 | 11.5 | 15.1 | 35,200 | 29,300 | 41,100 |
| Wales | 3.4 | 3.1 | 3.8 | 14,300 | 12,600 | 15,900 |
| Northern Ireland | 1.5 | 1.3 | 1.7 | 7,100 | 5,200 | 9,000 |
Source: Low Carbon and Renewable Energy Economy Survey from the Office for National Statistics
The figure above taken from the UK LCREE publication illustrates the positive economic impact that the low carbon and renewable energy sector is having on the UK economy in terms of annual turnover (£ billions) in 2024 and the numbers of individuals employed in the low carbon and renewable energy sector.
Figure 4: UK LCREE employment has increased by 51.6% between 2015 and 2024
LCREE group and total employment, UK, 2015 to 2024, full-time equivalents (FTEs) in thousands.
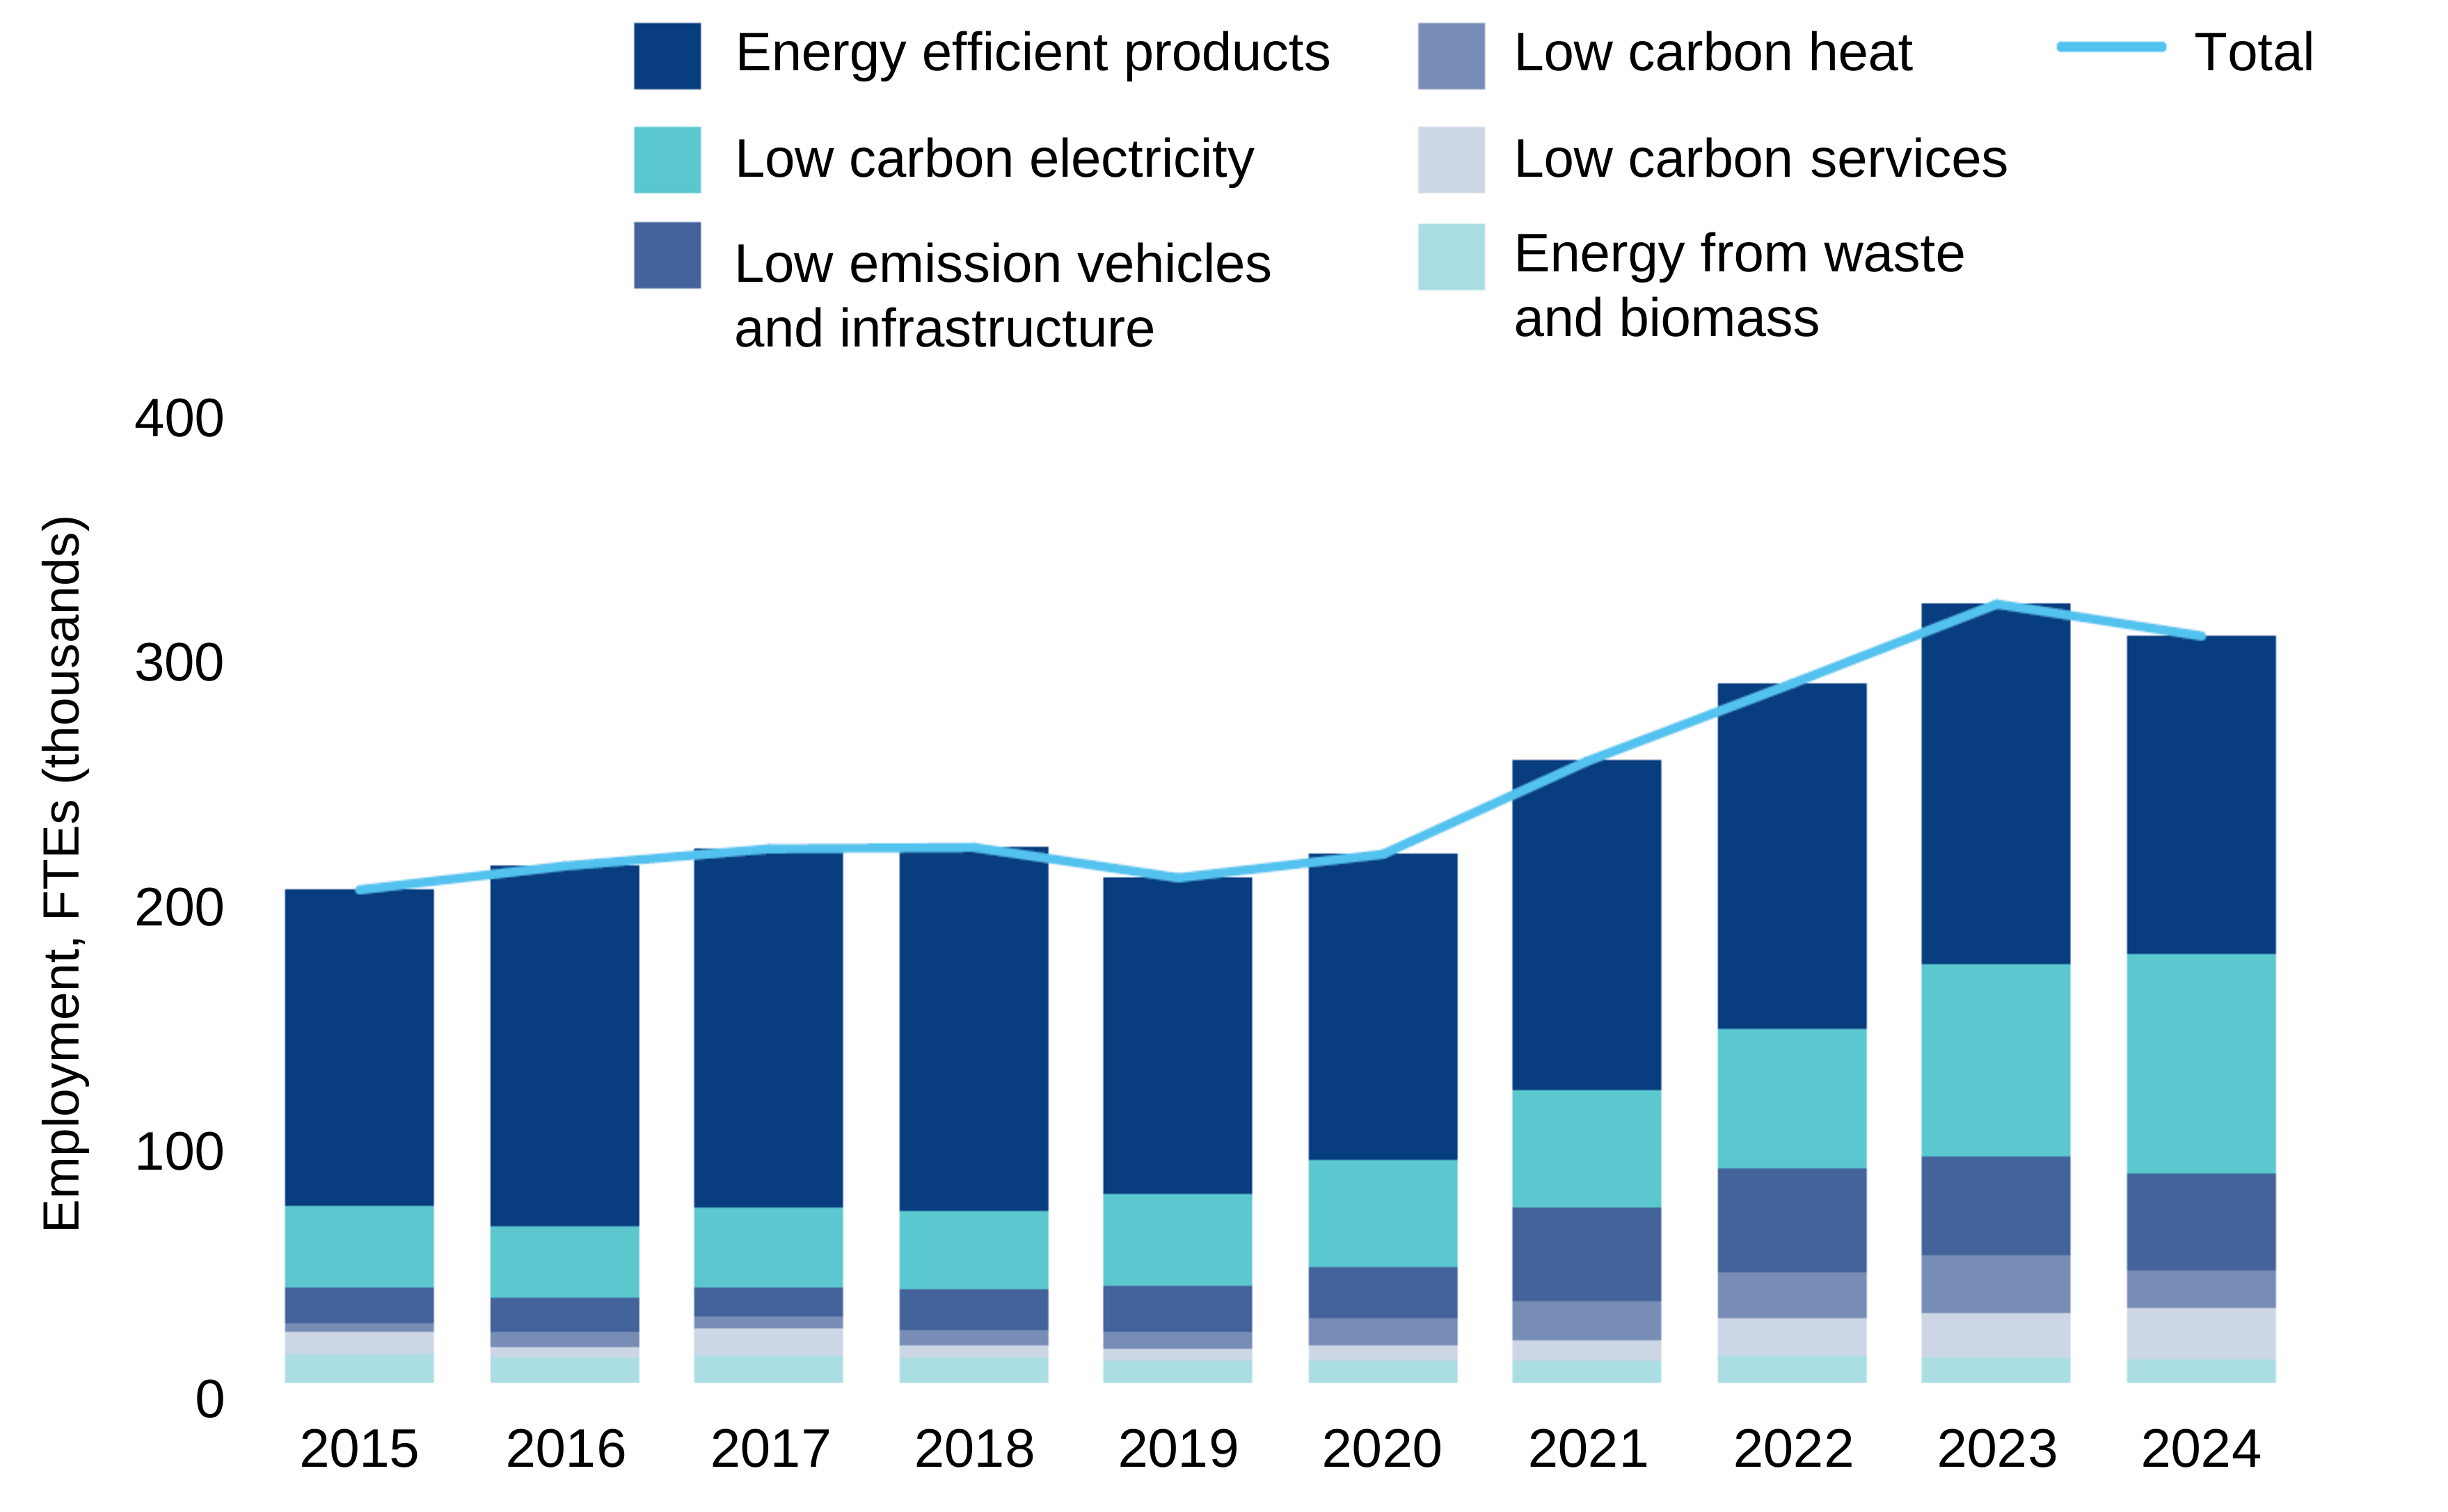
2b) The Seventh Carbon Budget – Climate Change Committee is a statutory report from the The figure above taken from the UK LCREE publication illustrates the overall upward trend in LCREE employment in the UK between 2015 and 2024.
3. Direct DESNZ Emissions
Disclosures on Scope 1, Scope 2, and Scope 3 greenhouse gas (GHG) emissions are included in the sustainability report, on page 55.
Future Direction
As awareness of climate-related risks continues to grow, it is expected that the role of TCFD statements will become even more critical. DESNZ will enhance our disclosures on the management of climate-related risks, and we will work to identify specific metrics and targets from within our published data to include in future years’ returns particularly related to the Climate Adaptation Metrics and the impacts of our DESNZ policies to making the energy system more resilient to future climate change.
Performance in other areas
Fraud and error analysis
Areas of major spend or significant risk of fraud and error:
The department identifies its greatest fraud risks as arising from high value grant schemes and core programmes, supplier and procurement activity, and delivery through partners and arm’s length bodies (ALBs), where complexity, scale and reliance on third parties increase exposure. These risks have been amplified during the last year due to the commencement of significant capital spend schemes for example carbon capture usage and storage and Sizewell C investment.
The department has developed an Enterprise Fraud Risk Assessment (EFRA) that defines these risks and manages them through multi-levelled departmental governance. Each risk is assigned within the department and, where applicable, fraud risks are also embedded within Directorate-level risk registers. Each risk is reviewed quarterly with an annual review conducted of the EFRA in full.
Targeted training is conducted in those areas that pose the greatest risk to build necessary capability and upskill decision-makers in how to identify and manage fraud risk. All programmes are required to use cross-government fraud risk assessment tools to understand and mitigate fraud risk throughout their lifecycle.
A second line counter fraud function provided by Integrated Corporate Services (ICS) sets standards and provides oversight and assurance of the department’s counter fraud response.
Fraud and error detected, recovered and prevented:
Every quarter, departments report to the Public Sector Fraud Authority (PSFA) on all fraud and error detected, recovered and prevented. The table below reports the figures for 2024-25 as the most up to date validated dataset and compares it to 2023-24 data. Reporting for 2025-26 is ongoing and will be validated in Q2 of 2026-27.
Table: DESNZ core prevented, detected and recovered fraud and error (excluding ALBs
| 2025‑26 Q1 |
2025‑26 Q2 |
2025‑26 Q3 |
2025‑26 Q4 |
2025‑26 Total (£000) |
2024‑25 Total (£000) |
|
|---|---|---|---|---|---|---|
| Fraud Detected | - | 135 | 17 | 6 | 159 | 199 |
| Fraud Recovered | 4 | 5 | 137 | 2 | 147 | 12 |
| Fraud Prevented | 651 | 119 | 7,254 | 35 | 8,060 | 88,931 |
| Error Detected | 7,781 | 28,480 | 2,004 | 1,228 | 39,493 | 403,548 |
| Error recovered | 1,294 | 5,947 | 1,401 | 1,497 | 10,140 | 404,189 |
The high levels of fraud and error reported in 2023-24 largely relate to reporting from the Energy Affordability scheme. The NAO found that “There was a comparatively low rate of fraud and error, which DESNZ estimates at 0.7% of energy schemes payments, worth £291.8m of the total programme expenditure of £44bn.”
In 2024-25, the largest driver of error was within grant payments, with common themes including overpayments and eligibility. These amounts include the impact of the Public Sector Decarbonisation Scheme breach, detailed below. The amounts for fraud detected, and fraud recovered, will not match in year as funds are often recovered at a later date.
Departmental risks related to fraud and error:
The department’s main risks are the principal risks reported on page 22. In 2025-26, the principal risk register did not hold any risks related to fraud and error. The department is working towards the addition of a related risk to the register in 2026-27, subject to the necessary governance process and approval.
Fraud & Compliance does feature in the Financial Exposure section of the DESNZ Risk Appetite Statement. The appetite for the risk is Cautious – Open.
In line with requirements, DESNZ maintains an Enterprise Fraud Risk Assessment (EFRA) which lists the department’s main fraud risks. These risks are owned by relevant leads within DESNZ. In 2025-26, the DESNZ EFRA identified the 7 risks below:
- DESNZ Core Programmes are exposed to fraud and bribery due to high‑value funding, delivery pressures, or complex governance and delivery arrangements, resulting in financial loss, reduced programme effectiveness, and reputational damage
- Schemes are vulnerable to fraud and bribery as a result of their design, scale, eligibility criteria, or delivery models, leading to misuse of public funds and failure to achieve intended outcomes
- Insufficient or inconsistent counter fraud and bribery controls within DESNZ Partner Organisations and ALBs could expose the department to financial, operational, and reputational risks
- Suppliers may engage in fraudulent or bribery-related activity during procurement or contract delivery, undermining value for money, delivery confidence, and public trust in DESNZ
- Weaknesses or inconsistencies in recruitment vetting processes could allow individuals with fraudulent intent, undeclared conflicts of interest, or inappropriate access to enter the organisation, increasing exposure to internal fraud and bribery
- Cybercrime, including the use of artificial intelligence by fraudsters, could enable more sophisticated fraud, data compromise, or system exploitation, leading to financial loss and disruption to DESNZ operations
- A weak counter fraud and bribery culture across DESNZ could reduce staff awareness, vigilance, and reporting, allowing fraud and bribery risks to go undetected or unchallenged
Risk Triage (preliminary assessment): DESNZ deployed an assessment tool for new programmes before the formal fraud risk assessment. This removes subjectivity and focuses efforts on the highest-risk aspects of a programme.
Technology and Data Analytics: CFES trialled new programmes produced by the PSFA such as the Single Network Analytics Platform (SNAP) and the Fraud Risk Assessment Accelerator to support existing capabilities within DESNZ.
Material and non-material breaches relating to DESNZ schemes and programmes
Public Sector Decarbonisation Scheme:
The Public Sector Decarbonisation Scheme supports clean energy retrofit projects across the public sector in England. The scheme is delivered on behalf of the department by Salix Finance, an arm’s length body.
In line with Managing Public Money, grant funding is paid in arrears on receipt of evidence that eligible works have been completed. Payments are supported by invoices and related documentation and must be claimed within the funding profile set out in the grant offer letter.
During 2025-26, the department became aware of a potential breach of controls relating to a project delivered by a NHS Trust. Information initially provided by a whistleblower raised concerns that advanced payments were being made to the lead contractor on 2 PSDS-funded capital projects, and that these advanced payments were being reported as delivered expenditure to both the Trust and to Salix Finance. The Trust undertook an initial review, which identified grounds for further investigation, and subsequently commissioned an independent review by PricewaterhouseCoopers (PwC).
PwC’s report identified evidence of collusion between parties involved in the project, resulting in the submission of misleading documentation and payments being made in advance of works being completed. This corroborated the concerns raised by the whistleblower.
This issue follows a separate compliance matter identified on the same project, where Advance Payment Bonds had been used to facilitate upfront payments. While these arrangements are not permitted under scheme rules or Managing Public Money, no evidence of fraud or intent to deceive was identified at that time. The Trust was therefore permitted to retain the funding on the condition that the arrangements were unwound and expenditure incurred within the relevant financial year.
Financial impact:
As at 31 March 2025, a total of £15.6m of advance payments were identified as being held by the contractor. This comprised:
- £9.0m relating to prior year Advance Payment Bond arrangements which remained unspent at year end, contrary to agreed conditions; and
- £6.6m of payments made in 2024-25 in advance of works being completed
Of this amount, £14.45m relates to departmental funding.
Action taken:
The department, through Salix Finance Ltd, is seeking recovery of £14.45m from the Trust. The Trust have agreed to pay this in instalments over Financial Year 2026-27.
Potential fraud relating to the conduct of the parties involved was referred to the appropriate NHS authorities for further investigation. No further action is being taken.
Control response and mitigation:
The control framework operated by Salix Finance was circumvented through collusion between multiple parties involved in the project, including a wholly owned subsidiary of the Trust. This represents a significant but seemingly isolated control failure.
In response, additional assurance measures have been implemented, including:
- enhanced evidential requirements, including geo-tagged and dated photographic evidence prior to payment, for higher-risk projects, including:
- projects involving contractors connected to this case;
- projects with final claims exceeding £2m;
- projects with a total value above £10m; and
- projects where the final claim exceeds 60% of total grant value; and
- retrospective review of prior payment claims to identify any further control weaknesses
Salix Finance has initiated an internal audit review of its processes, and the department is working with Salix to ensure that any weaknesses identified are addressed.
Retrofit Schemes
The department manages fraud, error and other non-compliance risks across its retrofit portfolio, including ECO 4, GBIS and capital grant programmes, through established governance, risk management and assurance arrangements, with oversight by the Audit and Risk Assurance Committee. Administration of schemes, including fraud and error responsibilities, is delegated across a range of delivery bodies with differing roles and responsibilities across different retrofit schemes. The department acknowledges that this has created a complex landscape and, through the delivery of the Warm Homes Plan, and the establishment of the Warm Homes Agency, aims to simplify, rationalise and strengthen these arrangements.
During 2025–26, audit and assurance activity identified material levels of non-compliance in certain measures delivered under ECO 4 and GBIS, particularly in relation to solid wall insulation. A statistically representative audit regime was initiated to assess the scale and nature of non‑compliance and strengthen the evidence base.
While delivery is undertaken by third parties, including suppliers, installers and assurance bodies, the department retains overall accountability for managing fraud and error risks as policy owner, and is actively pursuing those responsible for non-compliance while ensuring households are not left out of pocket or with substandard installations. The department recognises that non‑compliance does not necessarily indicate fraud in all cases; however, both fraud and error present risks to value for money and consumer outcomes across retrofit schemes.
In response, the department has taken action to strengthen controls and address issues identified. This includes implementing a programme of audit and remediation activity, commissioning a ‘find and fix’ approach for higher-risk external wall insulation installations under ECO 4 and GBIS, and enhancing governance arrangements, including dedicated programme boards and strengthened oversight of delivery partners. These actions are informing improvements to assurance and control frameworks applied more widely across retrofit programmes.
The department welcomes the action taken by the Serious Fraud Office in relation to suspected fraud in ECO 4 and continues to work with relevant law enforcement bodies to refer suspected cases. It would not be appropriate to comment further at this stage.
In line with recommendations from the National Audit Office and the Public Accounts Committee, the department is improving the consistency and coverage of fraud and error measurement across retrofit schemes. During the year, this has included reviewing existing quality assurance processes and metrics across schemes. While audit activity has provided useful insight into non‑compliance risks, further work is underway to develop a consistent and comparable approach to estimating fraud and error across retrofit schemes.
Since the issues of non-compliance with SWI installations under ECO 4 and GBIS were brought to our attention, the department has scaled up work to understand fraud and non-compliance root causes and exposure across all retrofit schemes to inform delivery improvements. The department is developing a cross-scheme standardised methodology for measuring and reporting levels of fraud and error and compliance checks which will be applied to new schemes and, where feasible and represents value for money, to existing schemes. This will support more consistent and transparent reporting in future Annual Reports and Accounts, improving understanding of the scale of risk and the effectiveness of mitigation activity.
Renewable Heat Incentive (RHI) Scheme
The value of payments made in error during 2025-26 under the core department R H I Scheme is estimated at £10.0m (0.85% of total payments) within a 95% confidence interval of £6.6m to £13.3m. Applied to the expenditure total of £1,218m (which represents the value of payments made in 2025-26, adjusted for net movements on accrued amounts payable) this would give an estimate of potential error of £10.3m within a 95% confidence interval of £6.9m to £13.8m. This assumes the same error rate would be incurred on the accrued expenditure when it is paid.
The value of payments made in error during 2024-25 under the same scheme was estimated at £9.8m (0.9% of total payments) within a 95% confidence interval of £6.5m to £13m.
Boiler Upgrade Scheme (BUS)
The value of error stated represents the estimated impact of both fraud and error. The value of payments made in error during 2025-2026 under the Boiler Upgrade Scheme is estimated at £4.5m (1.93% of total payments) within a confidence interval of £1.4m to £7.6m.
For 2024-2025 restated, this is likely to be £9.7m (5.09% of total payments) within a 95% confidence interval of £5.6m to £13.7m.
For 2023-2024 restated, this is £1.9m (2.14% of total payments) within a 95% confidence interval of £0.7m to £3.1m.
A proportion of the value of error in 2024-25 was due to installers redeeming the voucher prior to the installation being commissioned, a number of which were remediated and able to demonstrate compliance. We have observed some positive behavioural changes across the scheme, following deterrent messaging to installers not to redeem vouchers prior to the installation being commissioned, in line with the MCS Standards. This is reflected in the lower estimated error in 2025-26, which is currently reduced and within the mid-range of expected tolerance levels. Audit & compliance casework trends continue to be monitored, and overall strategy kept under review.
Complaints to the Parliamentary Ombudsman
| No. | |
|---|---|
| Number of complaints accepted for investigation by the Parliamentary Ombudsman in 2025-26 | 1 |
| Number of investigations reported on in 2025-26* | 2 |
| (a) Investigations fully upheld | 0 |
| (b) Investigations partly upheld** | 1 |
| (c) Investigations not upheld | 1 |
| Number of Ombudsman recommendations in 2025-26 | 0 |
| Complied with | 0 |
| Not complied with | 0 |
Notes:
These figures have been obtained directly from the Parliamentary and Health Service Ombudsman for the period 2025-26. When published, the report will be available at: www.ombudsman.org.uk/publications/
*The Ombudsman only accepts complaints that have been through the department’s internal complaints process. We aim to answer all formal complaints within 20 working days. Only a small percentage of complaints we receive are escalated to the Ombudsman. Investigations may be completed after the financial year they were received/created.
**A complaint related to the Green Homes Grant Voucher Scheme was partially upheld. The complaint was related to delayed and conflicting information being received by the complainant.
Performance in responding to public correspondence
We aim to respond to 80% of our correspondence in 15 working days. In 2025-26, we received 3,345 written enquiries from members of the public. We responded to 68% within 15 working days (2024-25: 50%).
The table below shows our monthly performance. During the winter period, DESNZ experienced an increase in correspondence received from members of the public, related to the cost of energy. In addition, the Iran conflict has led to a notable and sustained increase in correspondence being received in recent months. Performance fell as the department responded to live and emerging issues related to energy. In March, performance improved, despite a significant increase in volumes of letters received and answered.
| No. of written enquiries received | No. with response within 15 days | % with response within 15 days | |
|---|---|---|---|
| Apr‑25 | 247 | 165 | 67% |
| May‑25 | 267 | 177 | 66% |
| Jun‑25 | 277 | 170 | 61% |
| Jul‑25 | 231 | 162 | 70% |
| Aug‑25 | 176 | 138 | 78% |
| Sep‑25 | 223 | 181 | 81% |
| Oct‑25 | 268 | 220 | 82% |
| Nov‑25 | 253 | 205 | 81% |
| Dec‑25 | 215 | 140 | 65% |
| Jan‑26 | 334 | 180 | 54% |
| Feb‑26 | 263 | 96 | 37% |
| Mar‑26 | 591 | 426 | 72% |
| Total | 3,345 | 2,260 | 68% |
Respect for human rights and social matters
We include modern slavery risk assessments into our procurements where relevant and appropriate. Where procurements are deemed as higher risk, we have a mandatory set of steps at each stage of the procurement lifecycle to further assess supplier risk and manage it during the contract.
We provided training to commercial colleagues and contract managers to improve awareness of tackling modern slavery in public sector supply chains. We also contributed to the development of a refreshed modern slavery risk assessment tool.
We continued to implement Social Value Model default priority themes (linked to PPN 06/20 and PPN 002) aimed at improving the quality and added value of social value propositions. We also set a small and medium-sized enterprise (SME) spend target and SME action plan for 2025‑2028. We are developing a Voluntary, Community and Social Enterprises (VCSE) spend target and will combine SME/VCSE commitments into a Supplier Diversity Action Plan to support the spend targets.
Advertising
The government communications plan directs the communications in all government departments. Our communications work supports the delivery of the Department’s priorities. We work with partners, specifically those who can help us reach and influence our audiences. Where necessary, we use paid publicity and advertising. Key areas of paid advertising in 2025‑26 are listed below.
Warm and Fuzzy:
The Warm and Fuzzy campaign encourages homeowners to upgrade their existing boiler or heating system to a heat pump, promoting the £7,500 Government Boiler Upgrade Scheme grant. The campaign aims to improve public understanding of the benefits of heat pumps and help homeowners prepare their properties for low carbon heating.
Activity is targeted at homeowners in England and Wales and directs audiences to gov.uk/cleanenergy for further information on heat pumps and the grant.
The campaign ran from September 2025 to March 2026 and was delivered through a multi-channel paid media approach totalling £3.6m, including targeted audio visual, video on demand, radio, digital display, search, podcasts, social media, and door drops. Paid media partnerships were also deployed to broaden reach and build awareness among new audiences.
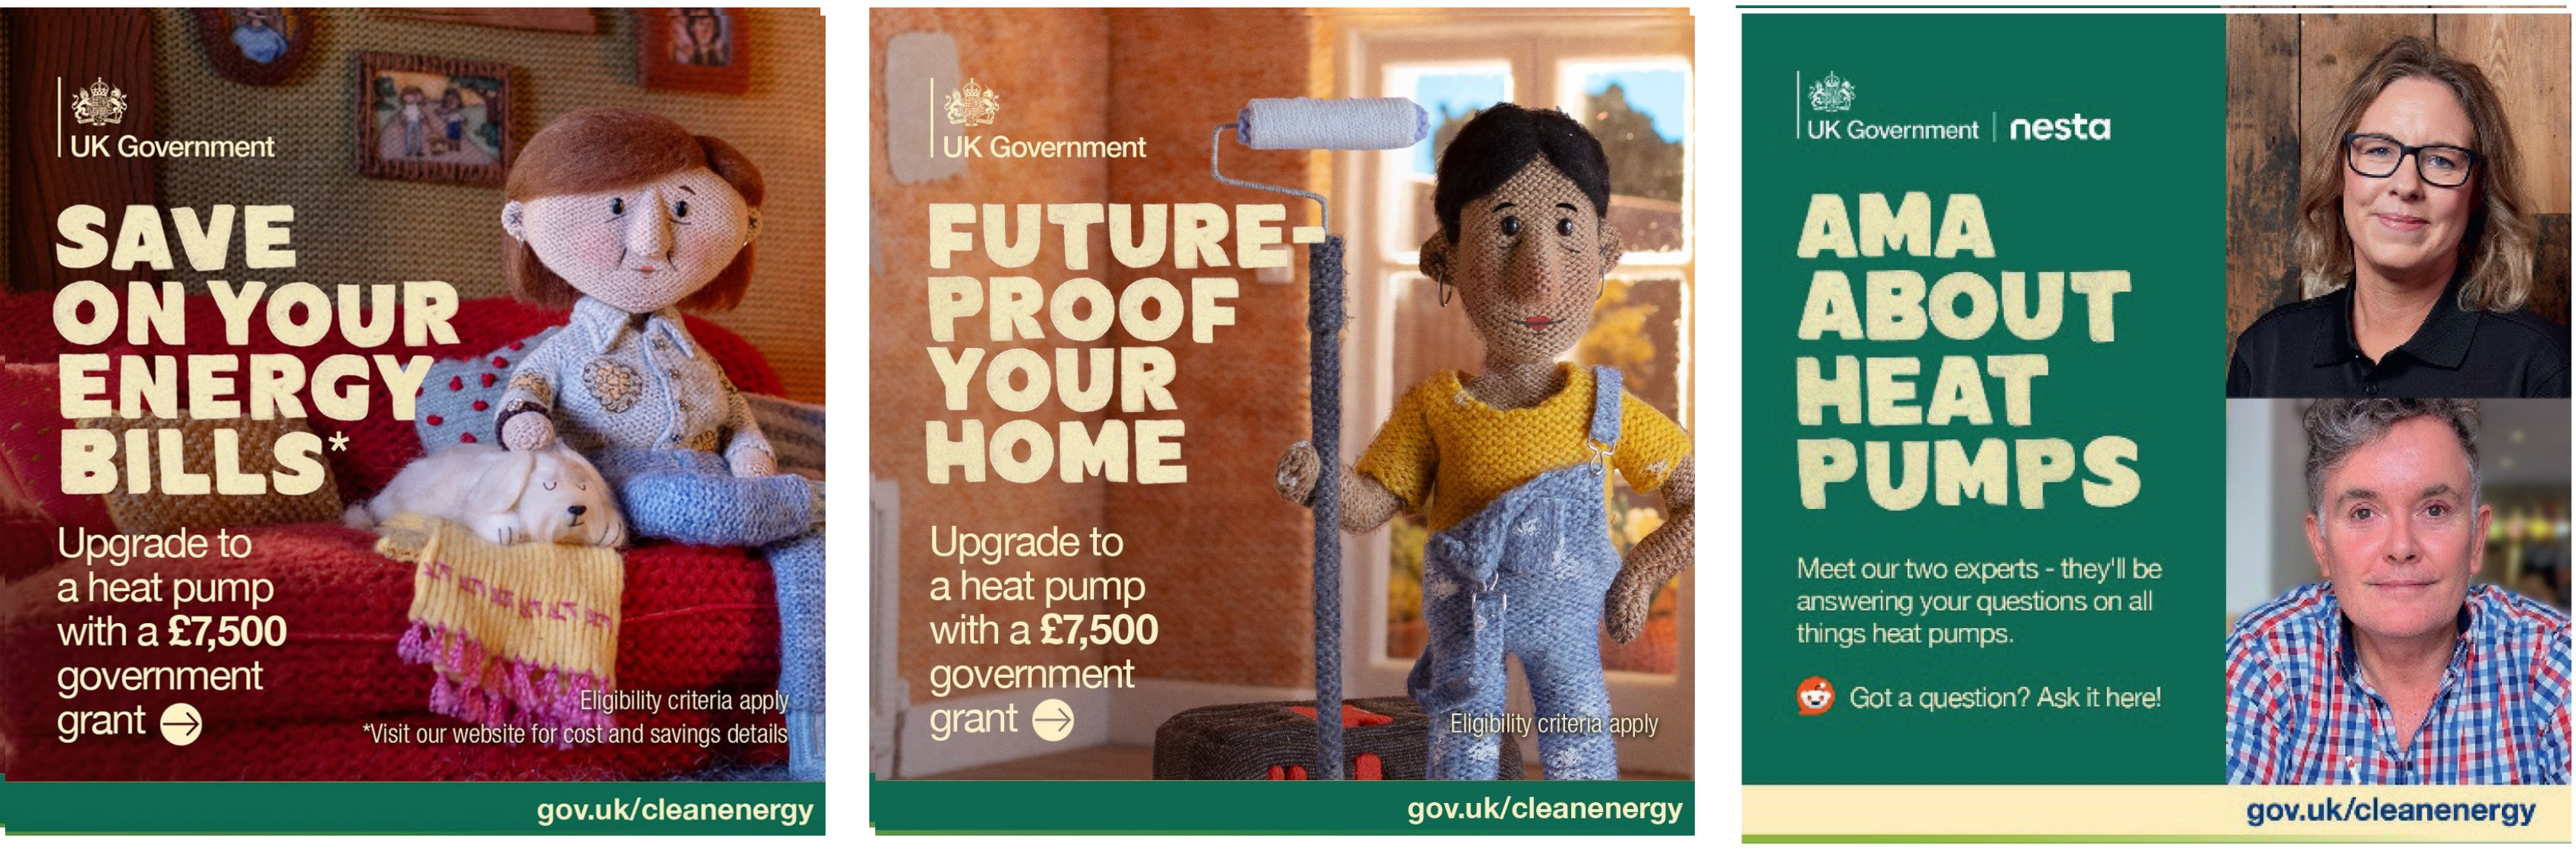
A Little Saves a Lot:
The A Little Saves a Lot Energy Saving campaign promotes 3 simple, actionable steps that households across the UK can take to reduce their energy bills. The campaign is targeted at all UK households, with a particular focus on those most affected by cost-of-living pressures and fuel poverty.
A key objective of the campaign is to drive audiences to gov.uk/cleanenergy, where they can access further tips, advice and guidance on reducing their energy use at home.
The campaign ran from November 2025 to February 2026 and was delivered through a broad mix of paid channels totalling £2.8m, including radio, out-of-home advertising, online video, community media, display, social media and social boosting, search, and paid media partnerships.

Get that Electric Feeling:
The Get that Electric Feeling campaign aims to encourage the uptake of electric vehicles (EVs) and increase public awareness of their benefits. In collaboration with Department for Transport, the campaign ran from January to March 2026 and was delivered through a cross channel paid media approach totalling £4.5m, including video on demand, radio, out of home advertising, digital display, paid social, influencer led content, and podcasts.
The campaign targets UK households, focusing particularly on those with access to a driveway and who are planning to buy a new vehicle within the next 5 years, or remain undecided about purchasing new or used.
Campaign activity directs audiences to gov.uk/cleanenergy for further information

As a result of marketing spend, households saved between £8m and £14.5m by taking 389,000 energy-saving actions to reduce their energy consumption. There were more than 39,000 grant redemptions for the Boiler Upgrade Scheme and from January to March 2026 there was a recorded 137,766 EVs sold compared to 120,267 in the same period in 2025 – a 14.55% increase – as EVs continue to become the right choice for many, the ‘Get That Electric Feeling’ campaign is helping raise awareness of the benefits of EV ownership.
Jonathan Brearley
Permanent Secretary and Principal Accounting Officer
13 July 2026
Next:
Accountability report