The employment of disabled people 2021
Updated 11 February 2022

© Crown copyright 2022
This publication is licensed under the terms of the Open Government Licence v3.0 except where otherwise stated. To view this licence, visit nationalarchives.gov.uk/doc/open-government-licence/version/3 or write to the Information Policy Team, The National Archives, Kew, London TW9 4DU, or email: psi@nationalarchives.gov.uk.
Where we have identified any third party copyright information you will need to obtain permission from the copyright holders concerned.
This publication is available at https://www.gov.uk/government/statistics/the-employment-of-disabled-people-2021/the-employment-of-disabled-people-2021
1. Introduction
These statistics relate to the employment of working-age disabled people in the UK. They provide context for the government’s goal to see one million more disabled people in work between 2017 and 2027, and its commitment to reduce the gap between the employment rates of disabled and non-disabled people (known as the disability employment gap).
This is the second annual publication and provides more detailed breakdowns of the labour market status of disabled people than those published on a quarterly basis by the Office for National Statistics (ONS). The need for these statistics was set out in the government’s strategy Improving lives: the future of work, health and disability published in November 2017.
This release contains annual data to March 2021 and quarterly data to June 2021. It therefore covers the first 12 to 15 months of the coronavirus (COVID-19) pandemic. Users should be aware of the potential effect of the pandemic and should interpret results, particularly across different time periods, with care.
2. Main points
Since 2013 (the earliest comparable year using the current definition of disability) up to the start of the coronavirus (COVID-19) pandemic the general trend in disability employment had been positive. There had been strong growth in the number and rate of disabled people in employment and a narrowing of the gap, between the rate of disabled and non-disabled people in employment.
The pandemic initially reversed these trends with year-on-year changes showing a fall in the disability employment rate and a widening of the disability employment gap in Q2 (April to June), Q3 (July to September) and Q4 (October to December) of 2020. There are now signs of trends improving with the disability employment rate returning to its pre-pandemic level in Q2 2021. The disability employment gap also started to narrow again in Q2 2021.
- there were 4.4m disabled people in employment in the UK in Q2 2021. This is estimated an increase of 300,000 on the year, an increase of 390,000 since Q2 2019 and an overall increase of 1.5m since Q2 2013
- the disability employment rate was 52.7% in Q2 2021, compared to 81.0% for non-disabled people. For disabled people, this is an increase of 0.3 percentage points on the year, an increase of 0.1 percentage points since Q2 2019 and an overall increase of 9.0 percentage points since Q2 2013
- the disability employment gap was 28.4 percentage points in Q2 2021. This is a decrease of 0.7 percentage points on the year, a decrease of 0.6 percentage points Q2 2019 and an overall decrease of 4.8 percentage points since Q2 2013
- on average around 340,000 disabled workers move out of work each year and 380,000 workless disabled people move into work (includes people who were classed as disabled at the start of the year)
- disabled workers move out of work at nearly twice the rate (8.8%) of non-disabled workers (4.9%). Workless disabled people move into work at nearly one-third of the rate (11.0%) of workless non-disabled people (26.9%)
The increasing number of disabled people in employment is being driven by three main components of change: disability prevalence (50%), the disability employment gap (25%) and the non-disabled employment rate (20%).
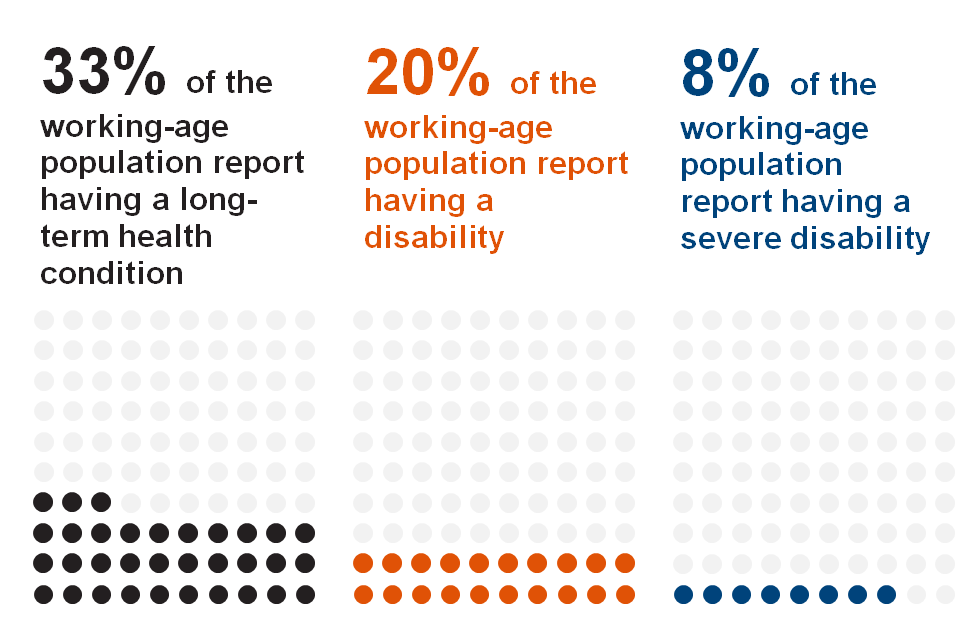
- 1 in 5 of the working-age population are classed as disabled
- more people are reporting a long-term health condition or disability than did so eight years ago
- the increasing number of people reporting a disability is being largely driven by an increase in mental health conditions
- nearly 1 in 3 people classed as being disabled one year are no longer classed as being disabled the next
The disability employment gap is wider for:
- disabled men
- older (aged 50 to 64) disabled people
- disabled people with no qualifications
- disabled people of White ethnicity
- disabled people living in Northern Ireland, Scotland, Wales, North West, and North East
The disability employment rate is lower for disabled people:
- with a mental health condition
- with five or more health conditions
Disabled people are more likely than non-disabled people to be:
- working in lower-skilled occupations
- self-employed
- working part-time (and subsequently less hours)
- working in the public sector
- temporarily away from work
Disabled people are as likely as non-disabled people to be:
- working for a small or medium sized employer
- in ‘quality work’
Disabled people are more likely to be working in health, retail, and education than other industries.
3. What you need to know
Disability
Estimates of disability in this release are for working-age people (aged 16 to 64) from April 2013 onwards. They use the Government Statistical Service (GSS) Harmonised Standard definition, in line with the Equality Act 2010 (EA) core definition. This includes people who have a long-term physical or mental health condition that affects their day-to-day activities.
Employment and other labour market concepts used in this release are defined in the same way as National Statistics published by the Office for National Statistics (ONS) in their Labour Market Overview. This in turn follows internationally agreed guidelines set out by the International Labour Organisation (ILO).
Estimates prior to April 2013, under different definitions of disability, are covered in-depth in last year’s publication.
Seasonality
All estimates in this release are not seasonally adjusted, so comparisons over time should only use the same quarter in each year.
Data sources
Full definitions are given in the background information and methodology. Estimates in this release are based on versions of the Annual Population and Labour Force Surveys using the latest population weights. These have been reweighted to new populations derived using growth rates from HM Revenue and Customs (HMRC) Real Time Information (RTI), to allow for different trends during the coronavirus (COVID-19) pandemic. The reweighting gives improved estimates of both rates and levels.
Statistical significance
All results in the commentary are statistically significant at the 95% level, unless stated. Differences in employment of groups with given characteristics are not necessarily caused by those characteristics.
Rounding
Numbers have been rounded as detailed in the Background information and methodology. Percentages are calculated using numbers prior to rounding and rounded to one decimal place.
The underlying (unrounded) data can be found in the supplementary data tables.
4. Measures
The next section looks at the 3 main measures used to monitor disability employment:
- the (absolute) number of disabled people in employment
- the disability employment rate (the number of disabled people in employment divided by the number of disabled people)
- the difference between the employment rates of disabled and non-disabled people (known as the disability employment gap)
Trends for each measure, starting from April 2013 when the current definition of disability began, are shown in Figures 1a to 1c. The components or factors that may influence these measures are examined in Figure 2.
The number of disabled people in employment continues to rise
Figure 1a: Number of disabled people in employment, people aged 16 to 64, UK, Q2 2013 to Q2 2021
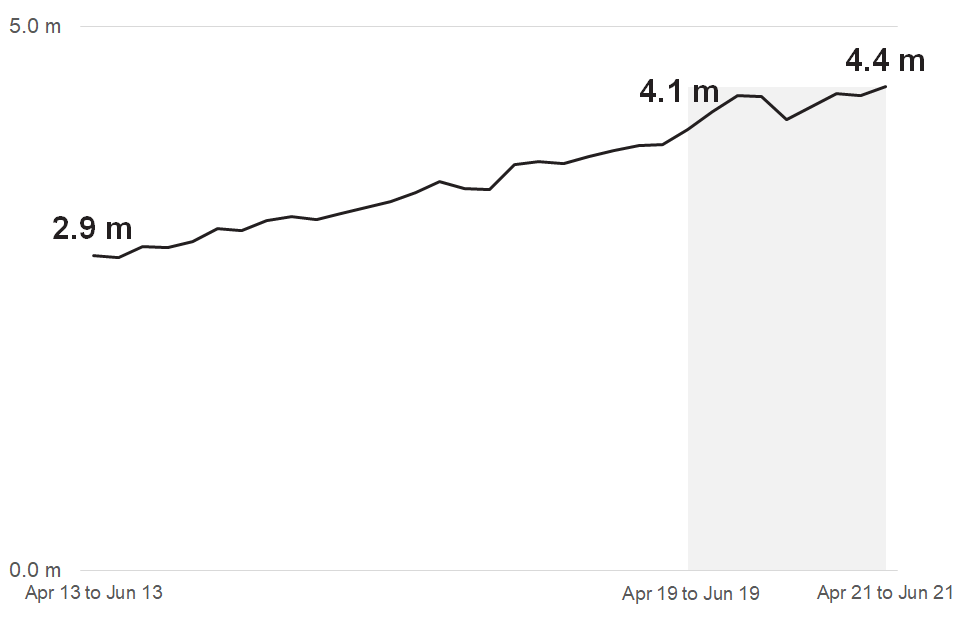
Source: Labour Force Survey – data and definitions can be found in supplementary data table 1.
Estimates are not seasonally adjusted, so comparisons over time should only use the same quarter in each year.
The number of disabled people in employment has increased by 1.5m from 2.9m in Q2 2013 to 4.4m in Q2 2021 (an increase of 53.5%). The number has continued to increase (year-on-year) throughout the coronavirus (COVID-19) pandemic but at a much slower rate - than seen in previous years (see table 1a below). The number of disabled people in employment is now above pre-pandemic levels. There are 390,000 more disabled people in employment in Q2 2021 than there were in Q2 2019.
The longer-term increases in disability employment can be linked to 3 main factors:
- an increase in the disabled population
- a strong labour market (prior to the pandemic)
- a narrowing of the disability employment gap
See Figure 2 for more details.
Table 1a: Number of disabled people in employment, people aged 16 to 64, UK, Q2 2019 to Q2 2021
| Quarter and year | Number of disabled people in employment | Year-on-year change |
|---|---|---|
| Q2 2019 | 4.1 million | 250,000 |
| Q3 2019 | 4.2 million | 350,000 |
| Q4 2019 | 4.4 million | 450,000 |
| Q1 2020 | 4.4 million | 430,000 |
| Q2 2020 | 4.1 million | 90,000 |
| Q3 2020 | 4.3 million | 50,000 |
| Q4 2020 | 4.4 million | 20,000 |
| Q1 2021 | 4.4 million | 10,000 |
| Q2 2021 | 4.4 million | 300,000 |
Source: Labour Force Survey
The disability employment rate is returning to its pre-COVID-19 level
Figure 1b: Disability employment rate, people aged 16 to 64, UK, Q2 2013 to Q2 2021
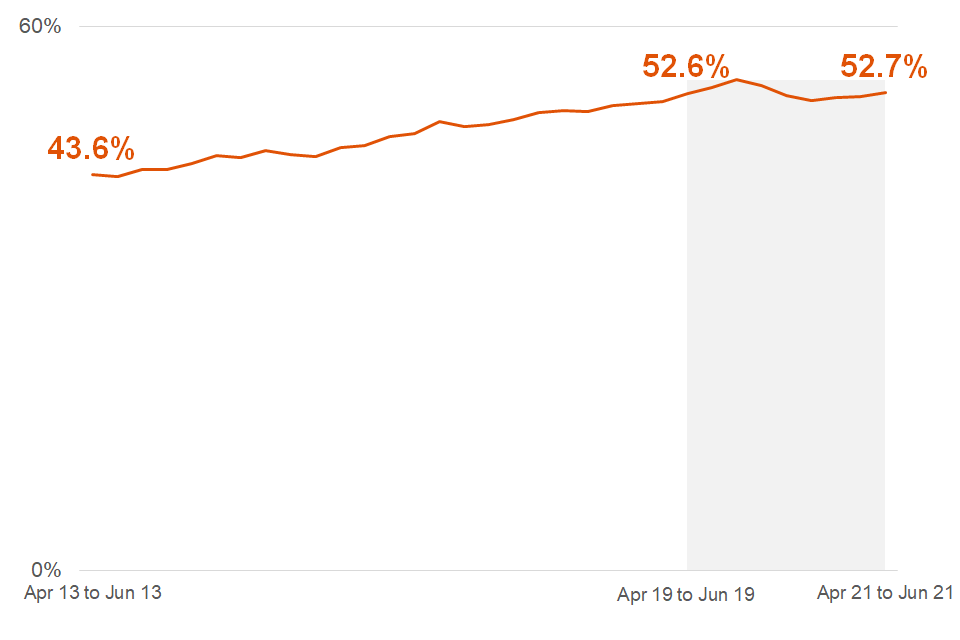
Source: Labour Force Survey – data and definitions can be found in supplementary data table 1.
The disability employment rate has increased by 9.0 percentage points from 43.6% in Q2 2013 to 52.7% in Q2 2021. The rate began to fall (year-on-year) at the start of the coronavirus (COVID-19) pandemic. By Q4 2020 it had fallen 1.9 percentage points compared to the year before (see table 1b below). There are now signs of a return to pre-pandemic levels with the rate in Q2 2021 similar to that seen Q2 2019.
Table 1b: Disability employment rate, people aged 16 to 64, UK, Q2 2019 to Q2 2021
| Quarter and year | Disability employment rate | Year-on-year change |
|---|---|---|
| Q2 2019 | 52.6% | 1.9 |
| Q3 2019 | 53.2% | 2.0 |
| Q4 2019 | 54.1% | 2.6 |
| Q1 2020 | 53.5% | 1.8 |
| Q2 2020 | 52.3% | -0.3 |
| Q3 2020 | 51.8% | -1.5 |
| Q4 2020 | 52.2% | -1.9 |
| Q1 2021 | 52.3% | -1.2 |
| Q2 2021 | 52.7% | 0.3 |
Source: Labour Force Survey.
The disability employment gap is starting to narrow again
Figure 1c: Disability employment gap (percentage point), people aged 16 to 64, UK, Q2 2013 to Q2 2021
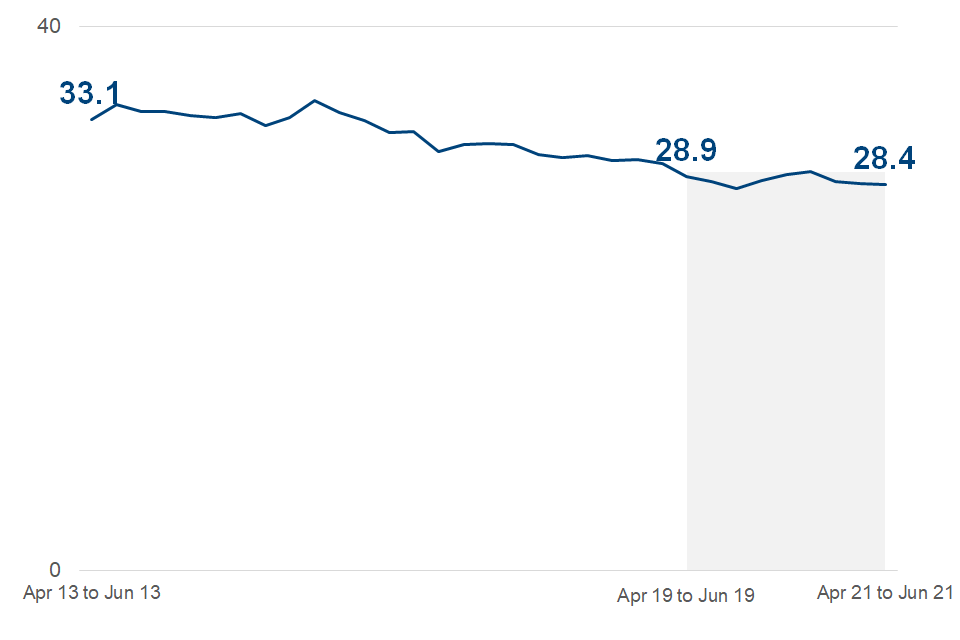
Source: Labour Force Survey – data and definitions can be found in supplementary data table 1.
The disability employment gap has decreased by 4.8 percentage points from 33.1 percentage points in Q2 2013 to 28.4 percentage points in Q2 2021. The gap started to widen (year-on-year) at the start of the coronavirus (COVID-19) pandemic (see table 1c below). This is the first time the gap has widened across more than one quarter in the last eight years. There are now signs of trends improving with the gap, in Q2 2021, reaching a level below that seen in Q2 2019.
Table 1c: Disability employment gap (percentage point), people aged 16 to 64, UK, Q2 2019 to Q2 2021
| Quarter and year | Disability employment gap | Year-on-year change |
|---|---|---|
| Q2 2019 | 28.9 | -1.5 |
| Q3 2019 | 28.6 | -1.6 |
| Q4 2019 | 28.1 | -2.1 |
| Q1 2020 | 28.7 | -1.3 |
| Q2 2020 | 29.1 | 0.1 |
| Q3 2020 | 29.3 | 0.7 |
| Q4 2020 | 28.6 | 0.5 |
| Q1 2021 | 28.5 | -0.2 |
| Q2 2021 | 28.4 | -0.7 |
Source: Labour Force Survey.
The increasing number of disabled people in employment is being driven by 3 main components of change
There are 4 major components of change in the number of disabled people in employment:
- overall working-age population
- disability prevalence
- non-disabled employment rate
- the employment rate gap
Each of these factors had shown improvements since 2013 to 2014. However, we do not know which components had the most impact. This is because it is not possible to directly measure the impact of each component, because the components interact with each another.
An indirect measure of each component can be modelled using a hypothetical scenario by assuming that, while that component followed the path observed in the data, all other components remained constant at the levels observed in Q2 2013 – this is the earliest comparable date using the current definition of disability so has been used as the baseline. A similar approach can be used to estimate the interactions between components.
For example, the combined impact of increases in both disability prevalence and in non-disabled employment is greater than the sum of the impact of prevalence alone and the impact of non-disabled employment alone. That difference gives us an estimate of the ‘interaction’ effect between these 2 components of change. See Background information and methodology for more details on how these estimates are derived.
These estimates are intended to give a broad indication of the impact of the different components. They tell us about the components of change, but not the causes. Neither do they capture all interactions. For example, an increase in disability prevalence could impact on the disability employment gap, even without any changes in employment, if prevalence increased faster among those already in employment than among those out of work.
Figure 2: Number of disabled people in employment by component of change, people aged 16 to 64, UK, Q2 13 to Q2 21
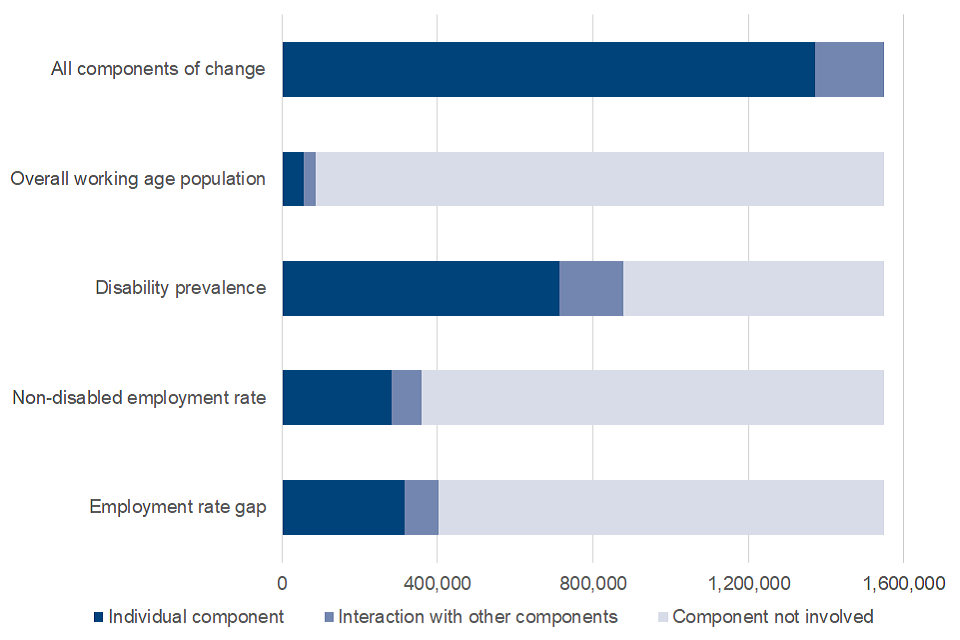
Source: Labour Force Survey – data and definitions can be found in supplementary data table 2.
In the 8 years between Q2 2013 and Q2 2021, the number of disabled people in employment increased by 1.5 million, from 2.9 million to 4.4 million. Figure 2 shows how much of this increase can be attributed to four components of change. For each component, a range is given. The lower end of the range shows the estimated impact of that component in isolation (dark blue bar); the upper end gives the impact including all interaction effects with the other components (mid-blue bar) and the light blue shaded area is any increase where the component is not involved. Therefore, the same interaction effects can appear in the chart under more than one component. However, taken as a whole, these interactions had a relatively small impact.
The impact of each component on the increase in the number of disabled people in employment is estimated as:
- disability prevalence (710,000 – 880,000 – 50%)
- disability employment gap (320,000 – 400,000 – 25%)
- non-disabled employment rate (280,000 – 360,000 – 20%)
- working age population (60,000 – 90,000 – 5%)
5. Populations
The next section looks at how the working-age population has changed over the last 8 years. In particular, how changes for different demographics have impacted the number of people who report having a long-term health condition or disability.
1 in 5 of the working-age population are classed as disabled
Figure 3a: Proportion of the population with a long-term health condition or disability, people aged 16 to 64, UK, 2020 to 2021
Source: Annual Population Survey – data and definitions can be found in supplementary data table 3.
A person is classified as having a:
-
long-term health condition if they answer ‘Yes’ to question 1 (see below)
-
disability if they answer ‘Yes’ to question 1 and either ‘Yes, a lot’ or ‘Yes, a little’ to question 2
-
severe disability if they answer ‘Yes’ to question 1 and ‘Yes, a lot’ to question 2
| Questions | Response options |
|---|---|
| 1. Do you have any physical or mental health conditions or illnesses lasting or expected to last 12 months or more? | Yes |
| No | |
| 2. Does your condition or illness reduce your ability to carry-out day-to-day activities? | Yes, a lot |
| Yes, a little | |
| No |
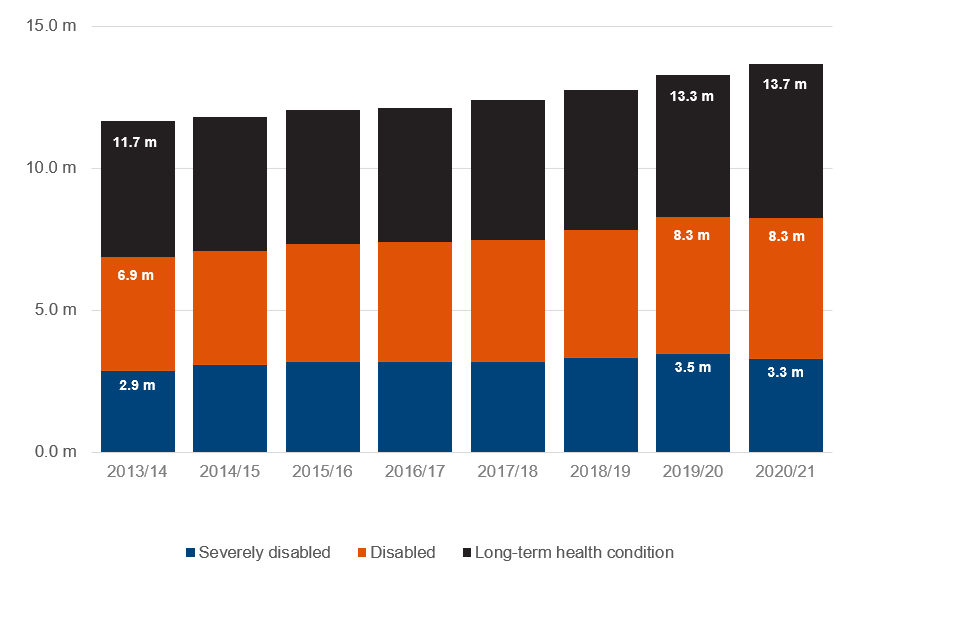
More people are reporting a long-term health condition or disability than did so 8 years ago
Figure 3b: Number of people by health and disability status, people aged 16 to 64, UK, 2013/14 to 2020/21
Source: Annual Population Survey – data and definitions can be found in supplementary data table 3.
The working-age population in the UK has increased by 0.78 million over the last 8 years, to reach 41.3 million in 2020 to 2021. The rate of increase averaged 0.4% a year between 2013/14 and 2016/17 but has slowed to 0.2% a year since then and has decreased by 0.1% in the last 12 months. This is the first time this has happened in the last 8 years.
More people are now reporting a long-term health condition or disability in 2020 to 2021 than did so 8 years ago. The number of people reporting a long-term health condition increased by nearly 2m (17.0%) between 2013/14 and 2020/21. Of these nearly 1.4m (19.9% increase) stated that their condition limited their day-to-day activities (classifying them as disabled) with a further 0.43m (15.2% increase) also stating that these activities were limited a “a lot” (classifying them as severely disabled).
While the number of people reporting a long-term health condition has continued to increase during the past year, the number classed as being disabled has stayed roughly the same. The number of people classed as being severely disabled has fallen in the past 12 months.
Increases in the number of people who are classed as being disabled could be due to a number of factors, including changes in public awareness and attitudes towards disability but these are not the only factors. We have seen in other functional based surveys – such as the Adult Psychiatric Morbidity Survey which do not rely on people self-reporting disability - increases in prevalence for some conditions which may be due to changes in society and health, including behaviours associated with diet and levels of physical activity.
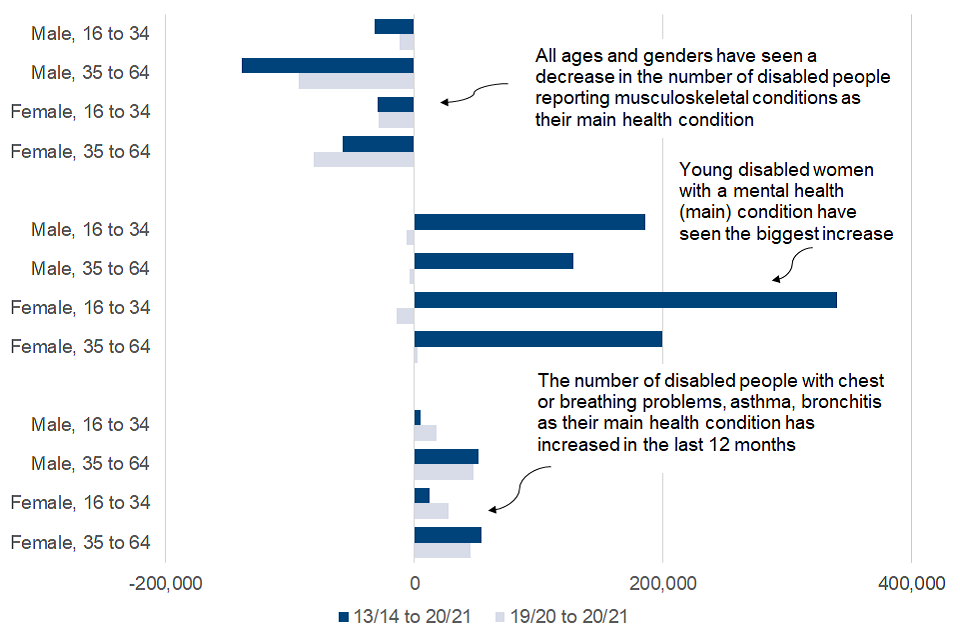
The increasing number of people reporting a disability is being driven by an increase in mental health conditions
Figure 4: Change in the number of disabled people by age, gender and main health condition, disabled people aged 16 to 64, UK, 2013/14 to 2020/21 and 2019/20 to 2020/21
Source: Annual Population Survey – data and definitions can be found in supplementary data table 4.
The increasing number of people being classed as disabled is largely being driven by an increase in mental health conditions. The number of disabled people with a mental health condition as their main condition has increased by 850,000 (68.6%) between 2013/14 and 2020/21. This compares to musculoskeletal conditions which have shown a decrease of 260,000 (10.8%) in the same period. However, there are still 2.1m disabled people (25.8%) whose main heath condition is musculoskeletal. There are also 1.4m disabled people (17%) who report having both a mental health and a musculoskeletal condition.
The increase in the number of people being classed as disabled has been greater for:
- women, 920,000 (24.4%), compared to men, 450,000 (14.4%)
- younger people (aged 16 to 34), 770,000 (45.9%) compared to older people (aged 35 to 64), 590,000 (11.4%)
The largest increase across age, gender and health condition was for women aged 16 to 34 with a mental health condition (as their main condition) who saw an increase of 340,000 (131.5%). The largest increase by main health condition in the last 12 months was for people reporting chest or breathing problems, asthma or bronchitis. The size of this group stayed roughly the same (around 500,000) between 2013/14 and 2019/20 but increased to 620,000 in 2020/21. The increase is likely to be linked to the coronavirus (COVID-19) pandemic.
Longer-term increases in the number of disabled people reporting a mental health condition as their main condition have not been replicated in the last 12 months. The number stayed roughly the same in 2020 to 2021, compared to the year before where the number increased by 210,000. The number of disabled people reporting mental health condition as their main or secondary condition in the last year has increased by 7.5% (compared to an average of 7.1% between 2014/15 and 2019/20).
This suggests that disabled people are still increasingly likely to report having a mental health condition. However, in the last 12 months this is more likely to have been alongside another condition that has a greater impact on their day-to-day activities. See supplementary data tables 5a and 5b for more details.
There may be other factors involved such as fall in the number of depression diagnoses which may mean people are less likely to report a mental health condition. This is covered in more detail in the Office for National Statistics (ONS) article Are we facing a mental health pandemic?.
Musculoskeletal conditions include problems or disabilities connected with the arms, hands, legs, feet, back or neck. Mental health conditions include depression, bad nerves, anxiety, mental illness or other nervous disorders.
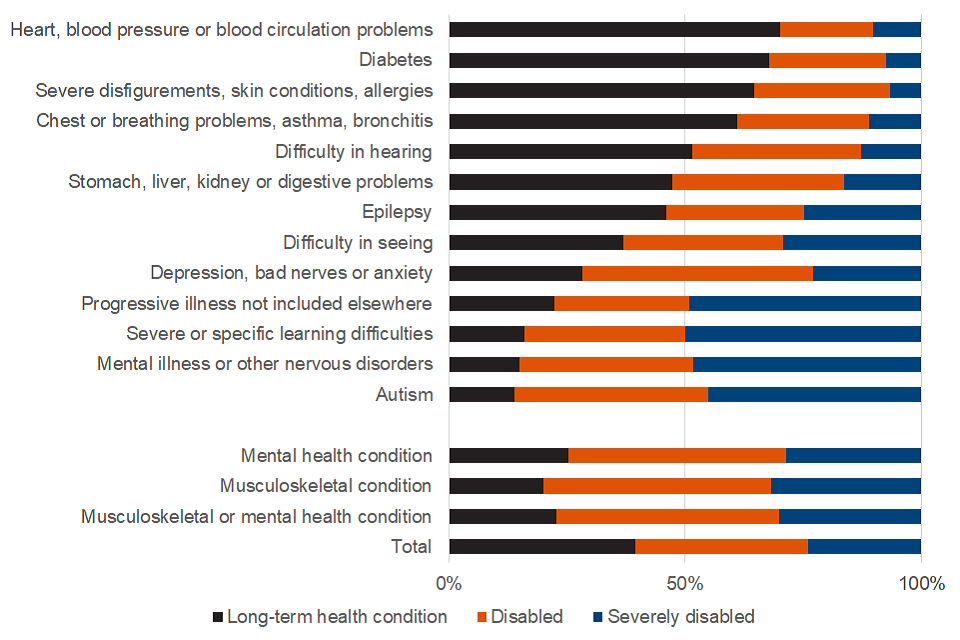
Some health conditions have a bigger impact on day-to-day activities than others
Figure 5: Proportion of people by main health condition and health and disability status, people aged 16 to 64, UK, 2020/21
Source: Annual Population Survey – data and definitions can be found in supplementary data table 5a.
There are large differences in the impact a person’s main health condition has on their day-to-day activities. For example, 6.7% of people with severe disfigurements, skin conditions, allergies reported that their condition effected their day-to-day activities “a lot”. This compares to severe or specific learning difficulties (49.8%), progressive illness (49.2%), mental illness or other nervous disorders (48.3%) and autism (45.1%).
People with a mental health (main) condition were less likely to report that it effected their day-to-day activities compared to people with a musculoskeletal condition. However, there is a large difference between the two conditions that make up the total mental health figure. Around a half of all people who reported a mental illness or other nervous disorder said that their condition effected their day-to-day activities “a lot”. This compares to people with depression, bad nerves or anxiety where the equivalent figure was around a quarter.
Estimates for some health conditions are based on small sample sizes and therefore subject to a higher degree of uncertainty. The data for all health conditions can be found in supplementary data table 5a. The equivalent data for main or secondary health conditions can be found in supplementary data table 5b.
6. Labour market status
The next section looks at the labour market status of individuals, specifically whether they are in employment or not. Employment is defined as anyone who has done one hour or more of paid work and those who have a job that they are temporarily away from (for example, because they are on holiday or off sick). People who are not in employment will be either unemployed or economically inactive. These breakdowns are shown for different characteristics, by disability status and over time.
Younger people have the lowest employment rates but the disability employment gap increases with age
Figure 6: Proportion of people in employment by disability status and age, people aged 16 to 64, UK, 2020 to 2021
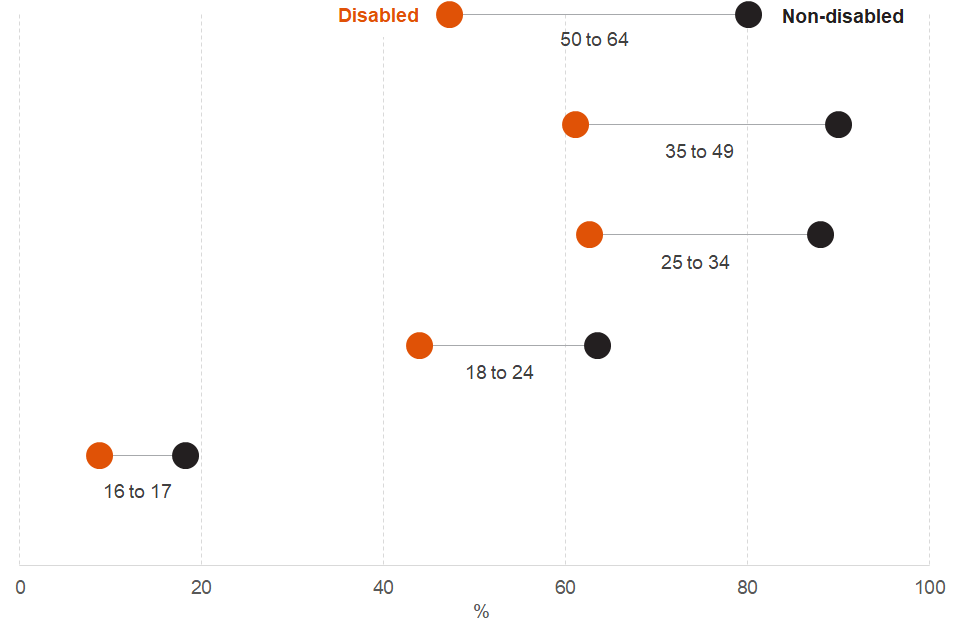
Source: Annual Population Survey – data and definitions can be found in supplementary data table 6.
Employment rates for disabled people, across all ages, are significantly lower than those of non-disabled people. For both disabled and non-disabled people, employment rates generally increase with age up to the age of 50 where they start to decrease.
16 to 17-year-olds have the lowest employment rates but this is because they are more likely to be in full-time education than in employment. The disability employment gap increases with age with those aged 50 to 64-years-old having the largest gap (32.9 percentage points compared to 19.6 percentage points for 18 to 24-year olds). The 50 to 64-year-old age group makes up over 40% of the working-age disabled population.
The 50 to 64-year-old age group is the only age group (excluding 16 to 17-year-olds who are more likely to be in full-time education) to see a significant decrease in disability employment rates over the past year.
Disabled women are now slightly more likely to be in employment than disabled men
Figure 7: Proportion of people in employment by disability status and gender, people aged 16 to 64, UK, 2013/14 to 2020/21.
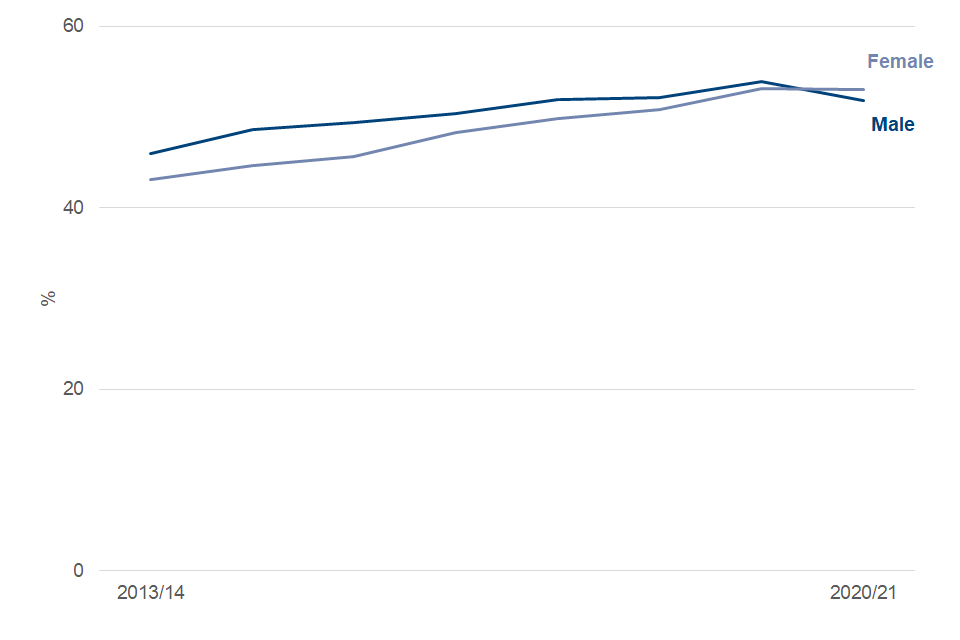
Source: Annual Population Survey – data and definitions can be found in supplementary data table 7.
The difference between the employment rates for disabled men and women and has been closing for a number of years with disabled women now slightly more likely to be in employment.
Over the past eight years the employment rate for disabled women has increased by around 9.9 percentage points from 43.1% in 2013 to 2014 to 53.0% in 2020 to 2021. The employment rate for disabled men in the same period increased by around 5.8 percentage points from 46.0% to 51.8%. In the past year employment rates for disabled women have stayed stay roughly the same but disabled men have seen a fall of around 2.1 percentage points. A similar pattern has been seen for non-disabled people.
The disability employment gap is wider for men (31.8 percentage points compared to 24.0 percentage points for women). The gap has closed for both men and women over the past eight years but at a similar rate (4.4 percentage points for men and 4.8 percentage points for women).
Disabled people whose main health condition is musculoskeletal are more likely to be in employment compared to those with a mental health condition
Figure 8: Proportion of disabled people in employment by main or secondary health condition, people aged 16 to 64, UK, 2020 to 2021
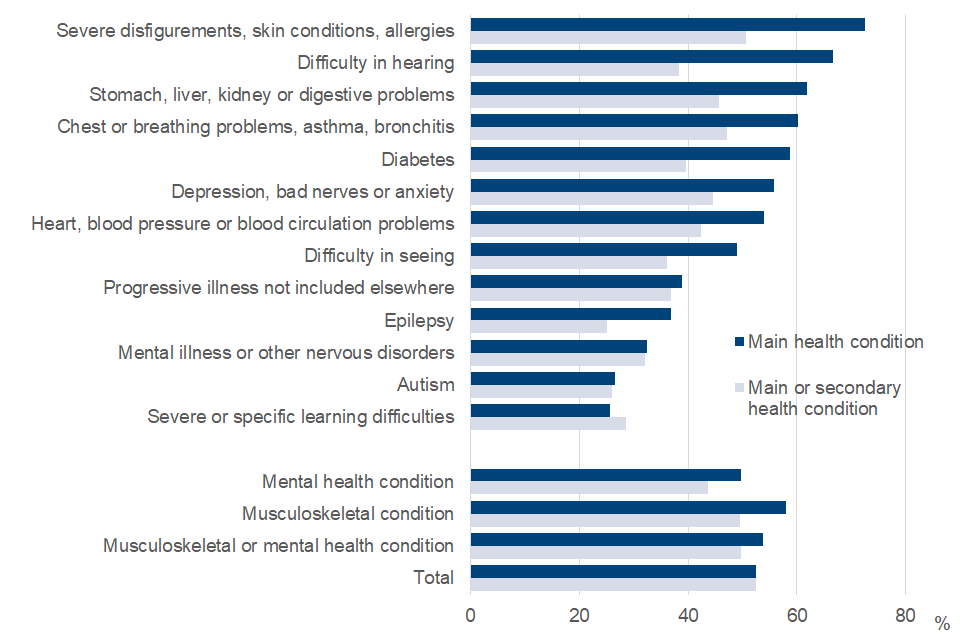
Source: Annual Population Survey – data and definitions can be found in supplementary data tables 8a and 8b.
There is a lot of variation in employment rates for different health conditions. For example, people whose main health condition is severe disfigurements, skin conditions, allergies are nearly three times more likely to be in employment compared to someone whose main health condition is severe or specific learning difficulties (72.5% compared to 25.6%). Disabled people whose main health condition is musculoskeletal are more likely to be in employment compared to those with a mental health condition.
The difference in employment rates for different conditions may be related to the effect the condition has on a person’s day-to-day activities. For example, 6.7% of people with severe disfigurements, skin conditions, allergies reported that their condition effected their day-to-day activities “a lot” compared to 49.8% for severe or specific learning difficulties (see supplementary data table 5a).
Employments rates for health conditions where the condition is secondary are generally lower than those for main conditions. This is because people with a secondary condition will, by definition, have more than one health condition. We know that the more health conditions a person has the less likely they are to be in employment (see supplementary data table 9).
Disabled people with one health condition are more than twice as likely to be in employment than those with five or more conditions
Figure 9: Proportion of disabled people in employment by number of health conditions, people aged 16 to 64, UK, 2020 to 2021
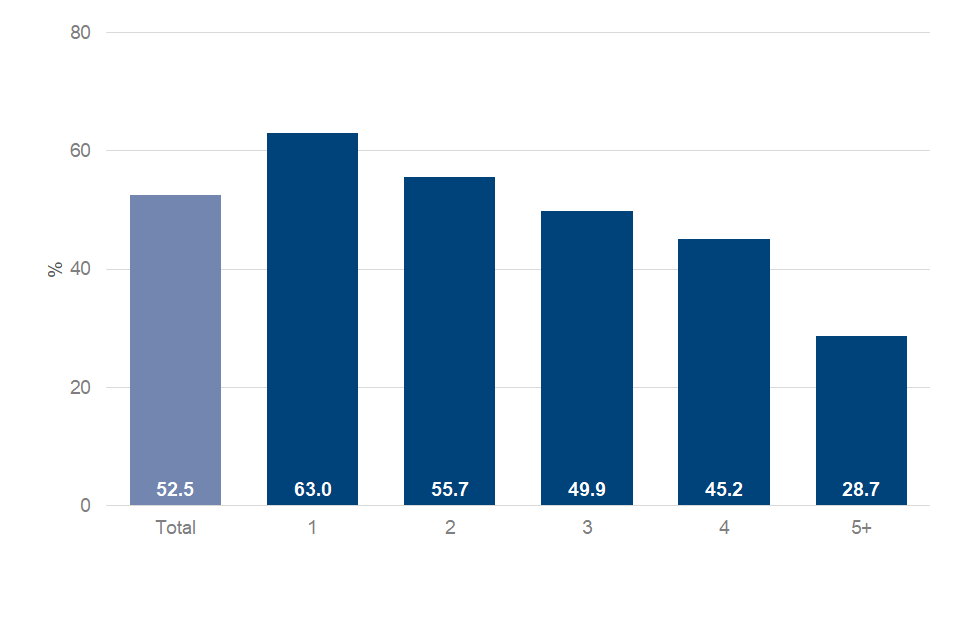
Source: Annual Population Survey – data and definitions can be found in supplementary data table 9.
Nearly two-thirds of disabled people with one health condition are in employment. The employment rate for disabled people with one health condition is around 10.5 percentage points higher than the rate for disabled people as a whole. Employment rates decline as the number of health conditions increases. Less than a third of disabled people with 5 or more heath conditions are in employment.
In the past year the number of disabled people with one health condition has fallen for the first time in the last eight years, by 370,000 (10.2%). The number of disabled people with 5 or more heath conditions stayed roughly the same between 2013/14 and 2019/20 but has increased by 190,000 (16.6%) in the past year.
A disabled person with A levels is as likely to be in employment as a non-disabled person with no qualifications
Figure 10: Proportion of people in employment by disability status and highest qualification, people aged 16 to 64, UK, 2020 to 2021
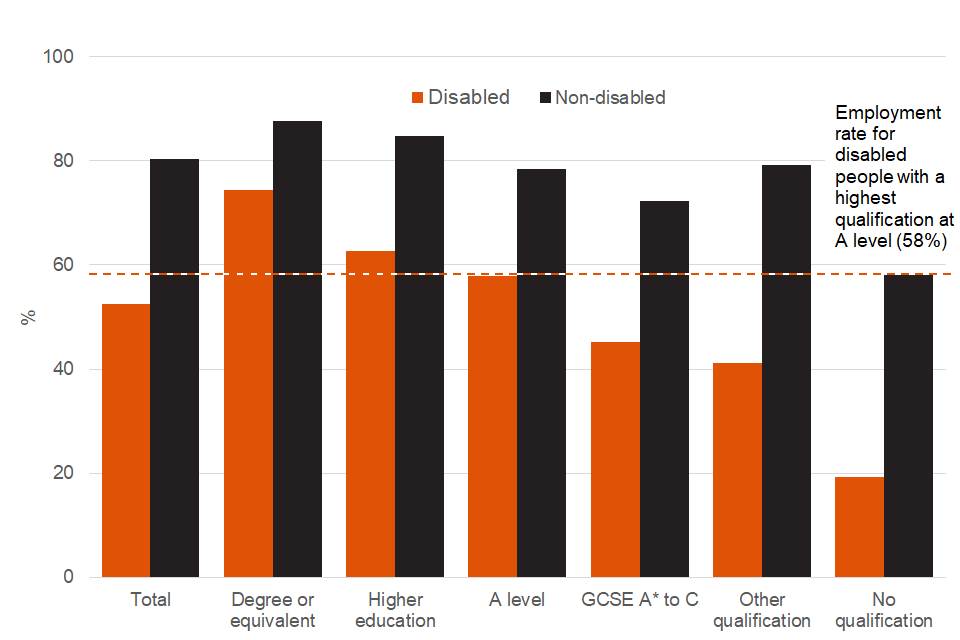
Source: Annual Population Survey – data and definitions can be found in supplementary data table 10.
Generally, the higher the qualification a person has the more likely they are to be in work. However, disabled people are less likely to be in work at all qualification levels. Non-disabled people with a degree are around 13.2 percentage points more likely to be in work compared to their disabled counterparts. For those with no qualifications the difference is three times greater with non-disabled people around 39.1 percentage points more likely to be in work. Disabled people with a highest qualification at A level are as likely (58.0%) to be in employment as a non-disabled person with no qualifications (58.5%).
Disabled people of White ethnicity have the largest disability employment gap
Figure 11: Proportion of people in employment by disability status and ethnicity, people aged 16 to 64, UK, 2020 to 2021
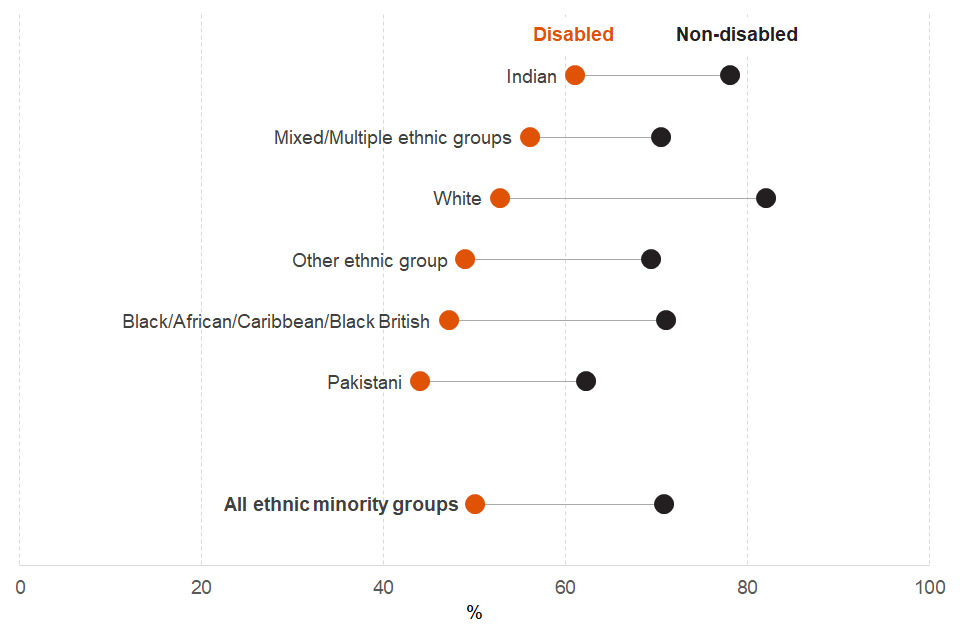
Source: Annual Population Survey – data and definitions can be found in supplementary data table 11.
Disabled people of every ethnicity are less likely to be in employment compared to their non-disabled counterparts. People of Indian ethnicity have the highest disability employment rate (61.1%) with people of Pakistani ethnicity the lowest (44.1%). However, the difference between these, and other groups, is not statistically significant.
Disabled people of White ethnicity have the largest disability employment gap (29.3 percentage points). This is due in part to them also having the highest non-disabled employment rate (82.1%). The disability employment gap for all ethnic minority (non-White) groups is around 20.8 percentage points. This is smaller than the disability employment gap for all groups which is around 27.9 percentage points.
Estimates for Bangladeshi, Chinese and any other Asian background ethnic groups are based on small sample sizes and therefore subject to a higher degree of uncertainty. The data for all ethnic groups can be found in supplementary data table 11.
Despite falling across most areas of the UK there are still large differences in the disability employment gap in different parts of the country
Figure 12: Disability employment gap (percentage points) by country and region, ages 16 to 64, UK, 2013/14 to 2020/21
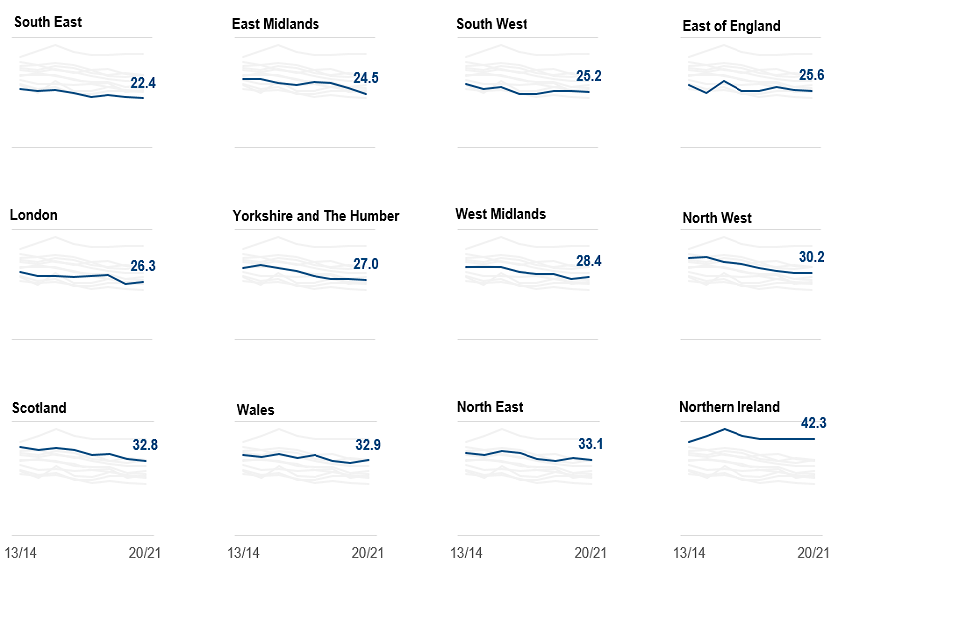
Source: Annual Population Survey – data and definitions can be found in supplementary data table 12.
In 2013 to 2014, regions with the smallest disability employment gap included the South East, East of England and South West (around 27 to 29 percentage points), while the largest gap was in Northern Ireland (41.0 percentage points). Scotland and Wales, as well as the North West and the North East all had a figure significantly above the overall UK disability employment gap.
By 2020 to 2021, Northern Ireland, Wales, the North East and the East of England were the only areas not to have seen a significant fall in the disability employment gap. However, the list of areas with a gap above the overall UK figure has remained the same. In the past year London and Wales were the only areas to see the disability employment gap widen by more than 1 percentage point. However, this change was not statistically significant.
Local Authorities with the largest disability employment gaps tend to be concentrated within certain areas of the country
Figure 13: Disability employment gap (percentage points) by Local Authority, people aged 16 to 64, Great Britain, 2017 to 2019
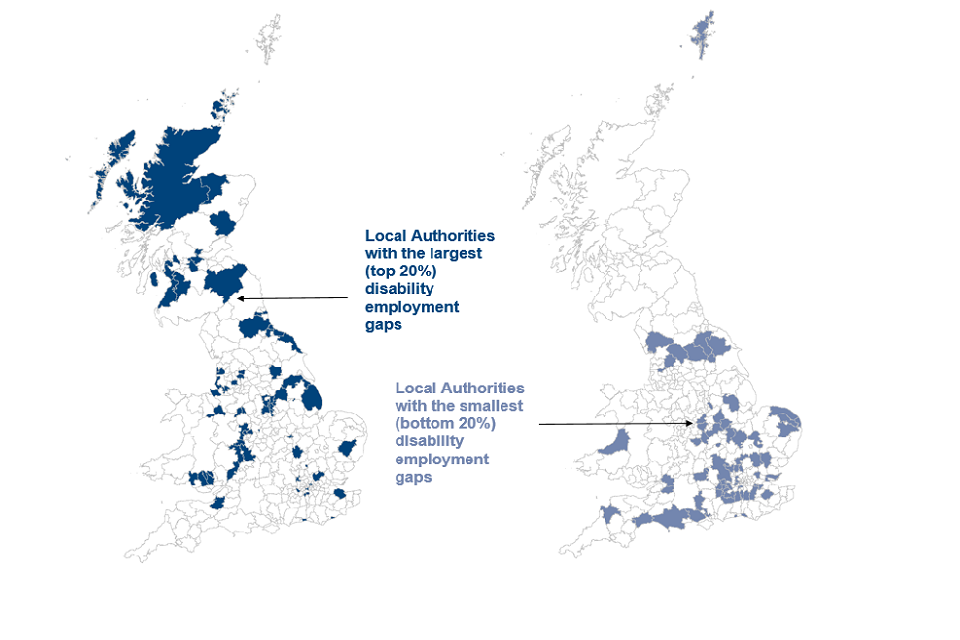
Source: Annual Population Survey – data and definitions can be found in supplementary data table 13a.
Local Authorities, with largest disability employment gaps, can be found across most regions and countries of the UK. However, many of these are concentrated in Scotland, Wales, the North East and West Midlands. For example, Local authorities with the largest (top 20%) disability employment gaps include Inverclyde in Scotland (47.7 percentage points) and Neath Port Talbot in Wales (44.5 percentage points). The gap for the UK as a whole between 2017 and 2019 was around 28.9 percentage points.
In contrast, Local Authorities with the smallest disability employment gaps tend to be found in clusters across the country, including parts of Yorkshire and the Humber, East Midlands, South East, South West and London. Local Authorities with the lowest disability employment gap include Harrogate (8.4 percentage points) and Harrow (9.7 percentage points).
Data for Northern Ireland is not available below country level and is therefore not shown in the Local Authority map above (Figure 13). Data for all Local Authorities, regions and countries of the UK, including Northern Ireland, can be found in supplementary data table 13a. The equivalent data for Parliamentary Constituencies can be found in supplementary data table 13b.
7. Employment
The next section looks at differences between disabled and non-disabled people who are in employment.
Disabled workers are most likely to work in the health, retail and education industries
Figure 14: Proportion of people employed in each industry by disability status, employed people aged 16 to 64, UK, 2020 2021
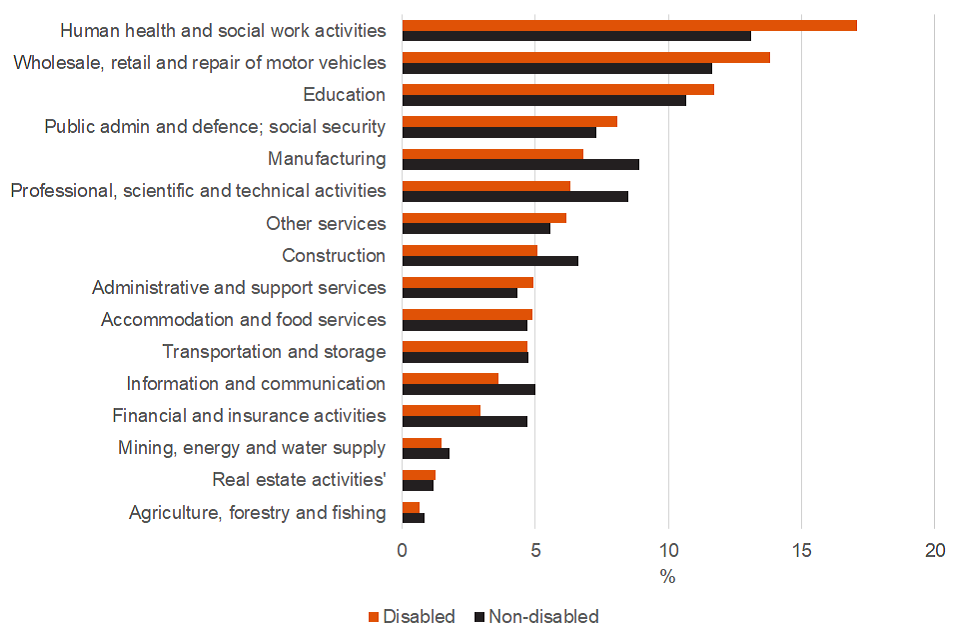
Source: Annual Population Survey – data and definitions can be found in supplementary data table 14.
The industries both disabled people and non-disabled people are most likely to work in are:
- Human health and social work activities
- Wholesale, retail trade and repair of motor vehicles
- Education
These 3 industries accounted for 42.6% of disabled and 35.4% of non-disabled workers. Disabled workers are least likely to be employed in Agriculture, forestry and fishing, as were non-disabled workers (each less than 1%).
Certain industries have been impacted more than others by the coronavirus (COVID-19) pandemic. The proportion on disabled people working in Human health and social work activities and Public administration and defence; social security has increased over the past year (by around 1 percentage point). Conversely, the proportion on disabled people working in Accommodation and food services, Construction and Manufacturing has decreased over the same period (again by around 1 percentage point). Similar patterns have been seen for non-disabled workers.
Disabled workers are less likely to be in higher-skilled occupations
Figure 15: Proportion of people in employed in each occupation by disability status, people aged 16 to 64, UK, 2020 to 2021
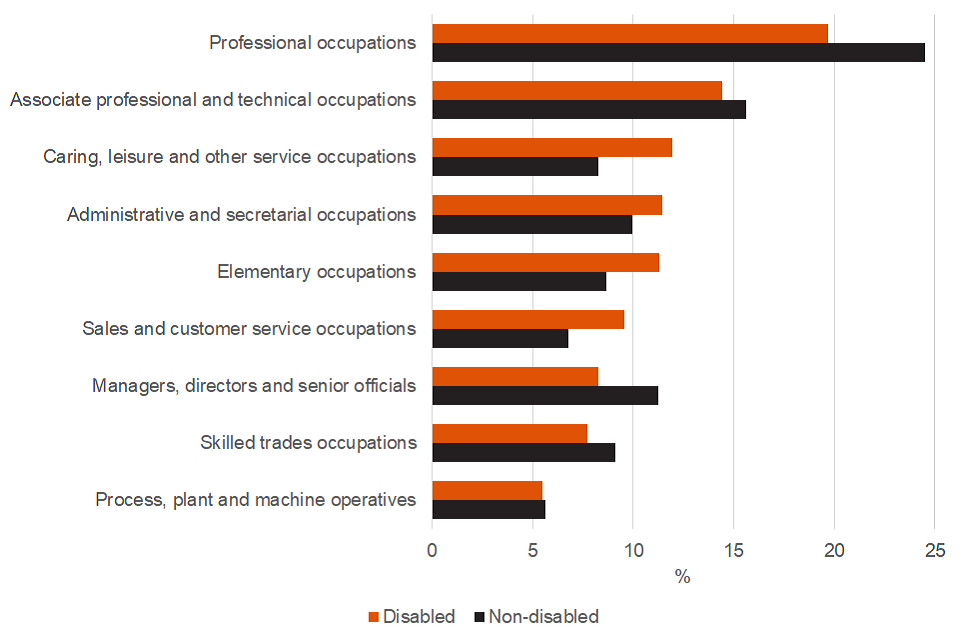
Source: Annual Population Survey – data and definitions can be found in supplementary data table 15.
Both disabled and non-disabled workers are most likely to be employed in Professional occupations (19.7% of disabled people and 24.5% of non-disabled people). The least common occupation for both groups of workers is Process, plant and machine operatives (around 6% for each group). Disabled workers (11.3%) are more likely than their non-disabled counterparts (8.7%) to be employed in Elementary occupations, and are less likely to work in the three highest-skilled occupations (Managers, directors and senior officials; Professional; and Associate professional and technical occupation).
The past year has seen a shift in that proportionately fewer disabled people are working in some lower skilled occupations (Elementary occupations down by 1.0 percentage point) and proportionately more are working in some higher skilled occupations (Professional; and Associate professional and technical occupations up by 1.8 and 1.0 percentage points respectively). Similar patterns have been seen for non-disabled workers with the proportion of people working in skilled trades occupations and as managers, directors and senior officials also seeing a fall for both groups over the past year.
Disabled workers are still slightly more likely to be self-employed
Figure 16: Proportion of people in employment who are self-employed by disability status, employed people aged 16 to 64, UK, 2013/14 to 2020/21
Source: Annual Population Survey – data and definitions can be found in supplementary data table 16.
The gap between the proportion of disabled and non-disabled workers who are self-employed has been closing for a number of years. In 2013/14 the proportion of disabled workers who were self-employed was 15.7% compared to 13.5% for non-disabled workers. By 2019/20 these figures had, fallen to 14.8% (for disabled workers) and risen to 14.1% (for non-disabled workers). The gap had therefore closed from 2.1 percentage points in 2013 to 2014 to 0.7 percentage points in 2019 to 2020.
Both disabled and non-disabled people have seen a significant fall, in the proportion of workers who are self-employed, during the past year. For disabled workers the proportion has fallen, by 1.2 percentage points, to 13.6%. For non-disabled workers there was a fall, of 1.4 percentage points, to 12.7%.
Disabled workers are more likely to be working part-time
Figure 17: Proportion of people in employment by disability status and working pattern, people aged 16 to 64, UK, 2020 to 2021
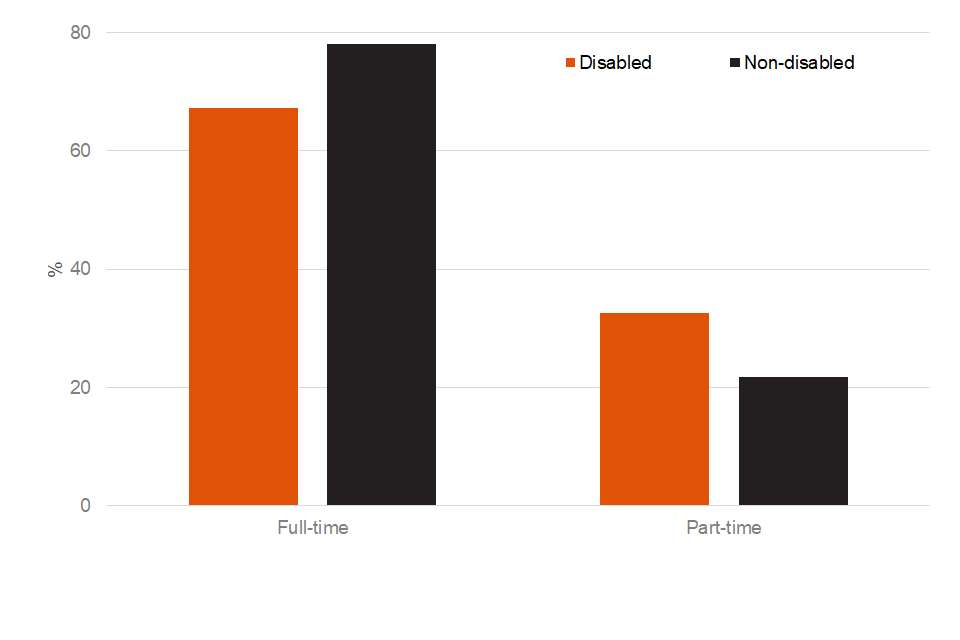
Source: Annual Population Survey – data and definitions can be found in supplementary data table 17.
Disabled workers are less likely to be working full-time compared to non-disabled workers and consequently more likely to be working part-time. The past year has seen a slight shift towards full-time employment with the percentage of disabled workers working full-time increasing from 65.4% to 67.3%. A similar pattern has been seen for non-disabled workers but to a lesser extent (increasing from 76.9% to 78.1%). These changes are at least double the magnitude of any other annual change seen in the previous seven years.
Disabled workers are more likely to be employed in the public sector
Figure 18: Proportion of people in employment by disability status and sector, employed people aged 16 to 64, UK, 2020 to 2021
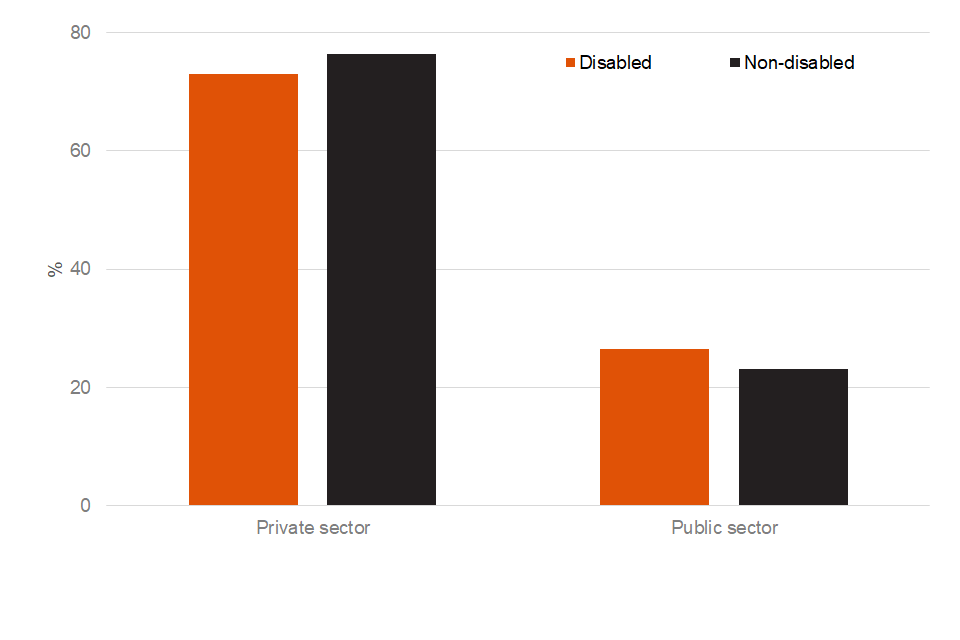
Source: Annual Population Survey – data and definitions can be found in supplementary data table 18.
Disabled workers are less likely to working in the private sector than non-disabled workers and consequently more likely to be working in the public sector. The past year has seen a shift towards public sector employment with the proportion of disabled workers working in the public sector increasing from 23.7% to 26.5%. A similar pattern has been seen for non-disabled workers but to a lesser extent (increasing from 21.5% to 23.1%). The increase, in the proportion of disabled workers working in the public sector, is nearly 7 times greater than any other seen in the previous seven years. For non-disabled workers this is the first significant increase in both the number and proportion of public sector employees since at least 2013 to 2014.
These patterns are a consequence of the industries disabled and non-disabled people are more likely to work in (see supplementary data table 14). Disabled people are more likely to work in Human health and social work activities, Public admin and defence; social security and Education which are predominately public sector industries.
Disabled people are equally likely to be working for a small or medium sized employer
Figure 19: Proportion of people in employment by disability status and employer size, employees aged 16 to 64, UK, 2020 to 2021

Source: Annual Population Survey – data and definitions can be found in supplementary data table 19.
The proportion of employees working for small or medium sized employers is roughly the same for both disabled and non-disabled people. There has been a shift in the past year with both disabled and non-disabled employees being more likely to work for medium or large employers as opposed to small employers. Small employers however still make up the largest group – 43.5% of all employees.
Disabled people are more likely to be temporarily away from work
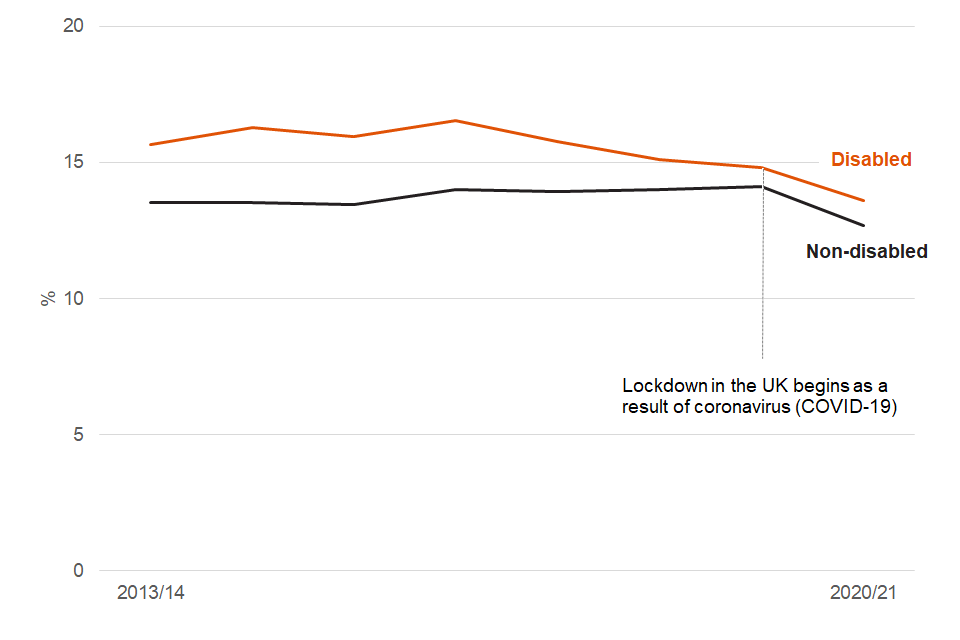
Figure 20: Two-year percentage point change in the proportion of people who were temporarily away from work by disability status, employed people aged 16 to 64, UK, April 2015 to June 2021
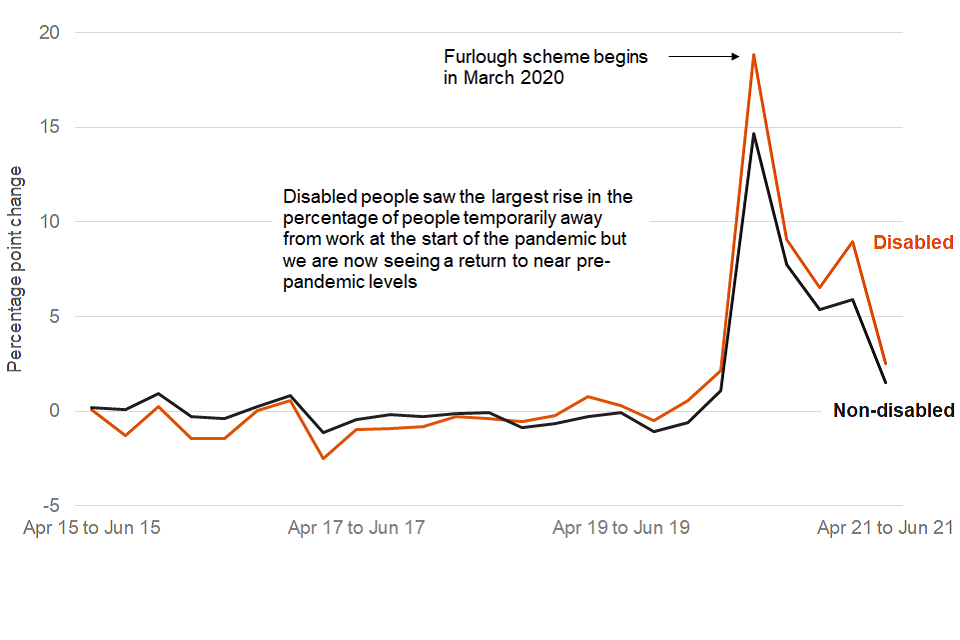
Source: Labour Force Survey – data and definitions can be found in supplementary data table 20.
The number of people temporarily away from work tells us how many people are away from work that they expect to return to. There are many reasons someone could be temporarily away from paid work such as being off sick, on maternity or paternity leave or being furloughed.
Historically (since 2013), the percentage of disabled people who were temporarily away from work has been relatively stable, ranging between 9% and 14% compared to 5% and 9% for non-disabled people. However, since the start of the pandemic this trend has changed dramatically with the percentage of disabled people temporarily away from work rising to around 28.6% in Q2 2020. The equivalent figure for non-disabled people was 20.7%. The large increase is likely to have been driven by the national lockdown and the introduction of the Coronavirus Job Retention Scheme (known as the furlough scheme) in March 2020.
From the high in Spring 2020 the change in the number of people temporarily away from work has generally followed a downward trend (apart from a spike in early 2021 when more stringent lockdown measures were in place). It is now just above levels seen before the pandemic with the gap between disabled and non-disabled people also narrowing (compared to its widest point at the start of the pandemic). The data is not yet available to provide an assessment of disability employment following the closure of the furlough scheme in September 2021.
We do know from the Office for National Statistics (ONS) article An overview of workers who were furloughed in the UK that more disabled workers have been furloughed than non-disabled workers (28% versus 26%), but the difference was not significant once personal and job characteristics were accounted for.
Disabled people are more likely to be working fewer hours
Figure 21: Two-year change in average hours worked by disability status, employed people aged 16 to 64, UK, Apr 15 to Jun 21
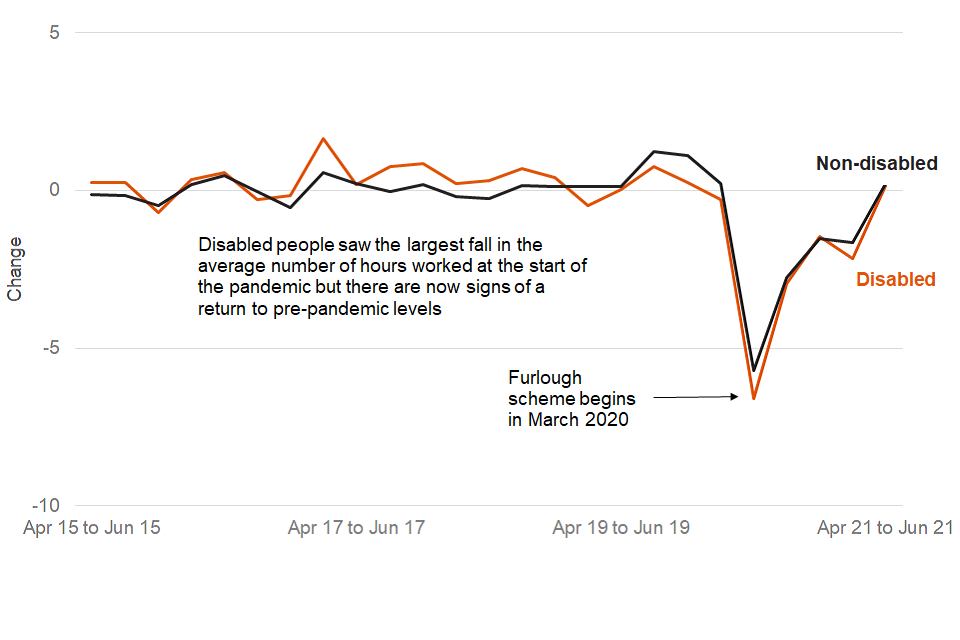
Source: Labour Force Survey – data and definitions can be found in supplementary data table 21.
Historically (since 2013), the average number of hours worked by disabled people has been relatively stable, ranging between 26 and 28 hours compared to 31 and 33 hours for non-disabled people. This is linked to disabled workers being more likely to be working part-time (see supplementary data table 17).
However, since the start of the pandemic this trend has changed dramatically with the average number of hours worked by disabled people falling to 21.4 hours in Q2 2020. The equivalent figure for non-disabled people was 26.8 hours. The large decrease is likely to have been driven by the national lockdown and the introduction of the Coronavirus Job Retention Scheme (known as the furlough scheme) in March 2020.
From the low in Spring 2020 the change in the average number of hours worked has generally followed an upward trend (apart from a fall in early 2021 when more stringent lockdown measures were in place). It is now at levels seen before the pandemic with the gap between disabled and non-disabled people also disappearing. The data is not yet available to provide an assessment of disability employment following the closure of the furlough scheme in September 2021.
We do know from the Office for National Statistics (ONS) article An overview of workers who were furloughed in the UK that more disabled workers have been furloughed than non-disabled workers (28% versus 26%), but the difference was not significant once personal and job characteristics were accounted for.
Disabled employees are as likely to be in ‘quality work’ as non-disabled employees
Figure 22: Proportion of employees by disability status and quality of work indicator, people aged 16 to 64, UK, 2018
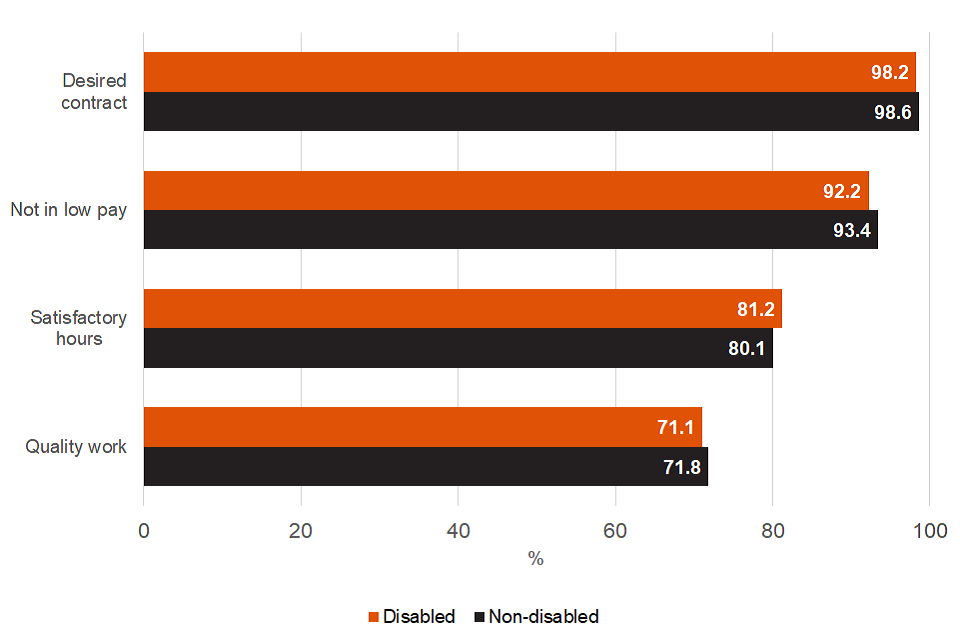
Source: Annual Population Survey – data and definitions can be found in supplementary data table 22.
The data in this sub-section is originally sourced from the article Job quality indicators in the UK – hours, pay and contracts: 2018 published by the Office for National Statistics (ONS) in December 2019. The data is experimental and is the first exploratory analysis of the indicators of quality work. More information on the data, definitions and plans for future research can be found in the article.
This analysis does not constitute a government definition of quality work.
The ONS defined quality work through 3 key measures:
- hours worked
- pay
- desired contract type
Good hours – employees who are not working more than 48 hours per week, do not wish to work more hours in their current job and are not looking for a replacement or supplementary job to increase their hours worked
Not in low pay – employees who are earning above two-thirds of median pay nationally
Desired contract type – employees who either have a permanent contract or those with non-permanent contracts for reasons other than being unable to secure a permanent contract.
While a similar proportion of disabled employees and non-disabled employees are in quality work (71.1% and 71.8%, respectively); disabled employees compared with non-disabled employees are:
- more likely to work satisfactory hours (81.2% vs 80.1%)
- more likely to be in low pay (7.8% vs 6.6%)
- less likely to have their desired contract (98.2% vs 98.6%)
However, these differences are not statistically significantly different from each other.
8. Flows
The next section focusses’ mainly on the movements, or flows, between employment status (in or not in work) from one year to the next. Employment status is taken measured a year apart so will not include movements within the year. For example, a person may be in employment when they complete the survey in the first year, move out of employment (and then back in) and be in employment when they are surveyed the following year. In this scenario the person would be classed as having remained in employment.
People who move out of employment will be either unemployed or economically inactive.
Estimates are averaged over the period 2014 to 2019 to increase precision. The latest flows data available from the Annual Population Survey (APS) covers a period prior to the coronavirus (COVID-19) pandemic.
In general, disabled people are more likely to move out of work and less likely to move into work, compared to non-disabled people, over the course of a year.
- on average around 340,000 disabled workers move out of work each year and 380,000 workless disabled people move into work (includes people who were classed as disabled at the start of the year)
- disabled workers move out of work at nearly twice the rate (8.8%) of non-disabled workers (4.9%). Workless disabled people move into work at nearly one-third of the rate (11.0%) of workless non-disabled people (26.9%)
Nearly 1 in 3 people classed as being disabled one year are no longer classed as being disabled the next
Figure 23: Flows between disability and employment status, people aged 16 to 64, UK, 2014 to 2019
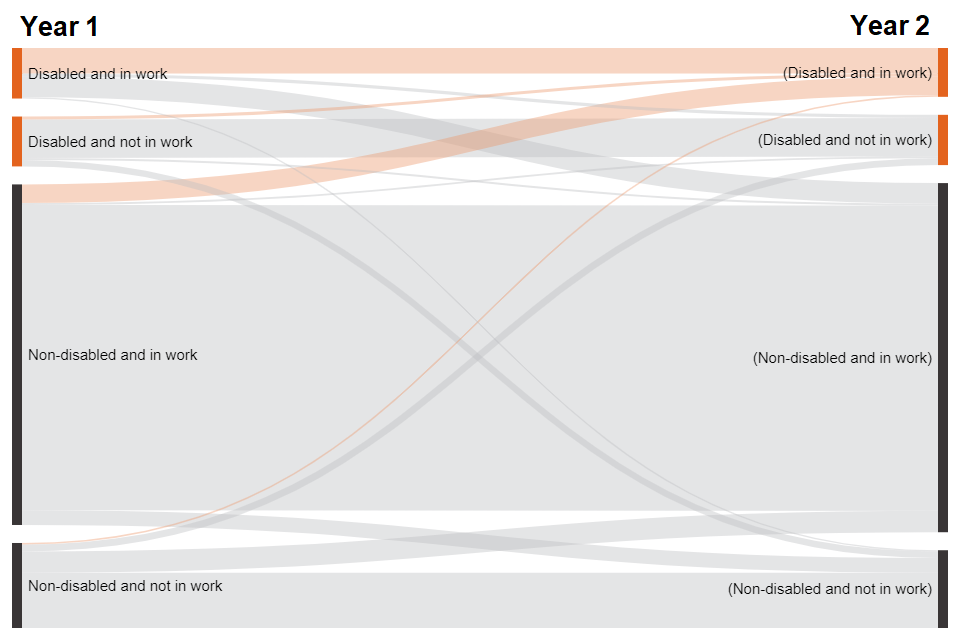
Source: Annual Population Survey – data and definitions can be found in supplementary data table 23.
Figure 23 shows how people move between the different disability and employment states from one year to the next. This is taken as an average between 2014 and 2019 with the thickness of the line representing the number of people. By far the biggest group is non-disabled people who are in work one year and still in work and still classed as non-disabled the next.
Nearly 1 in 3 people classed as being disabled one year are no longer classed as being disabled the next. This suggests that disability is not static and that it can change throughout the course of a person’s lifetime. For disabled people in work one year 91.3% are still in work the following year. Of these 44.6% are no longer classed as being disabled. This suggests that people are more likely to change their status from disabled to non-disabled if they are in work.
The orange lines in Figure 23 show the disability and employment status in year one of all the disabled people who were in work in year two. 58.5% of them are disabled people who have remained in work (52.3%) or moved into work (6.2%). The other 41.5% are non-disabled people who have remained in work (38.4%) or moved into work (3.1%) and are now classed as disabled.
Disability and employment status is measured approximately a year apart so will not include movements within the year. For example, a person may be in employment when they complete the survey in the first year, move out of employment (and then back in) and be in employment when they surveyed the following year. In this scenario the person would be classed as having remained in employment. The same situation will apply to changes in disability status. Cases where the person moves from or to and unknown disability status are excluded from the data.
Disabled workers are twice as likely to move out of work if they are working part-time compared to full-time
Figure 24: Proportion of people moving out of work by disability status and working pattern, employed people aged 16 to 64, UK, 2014 to 2019
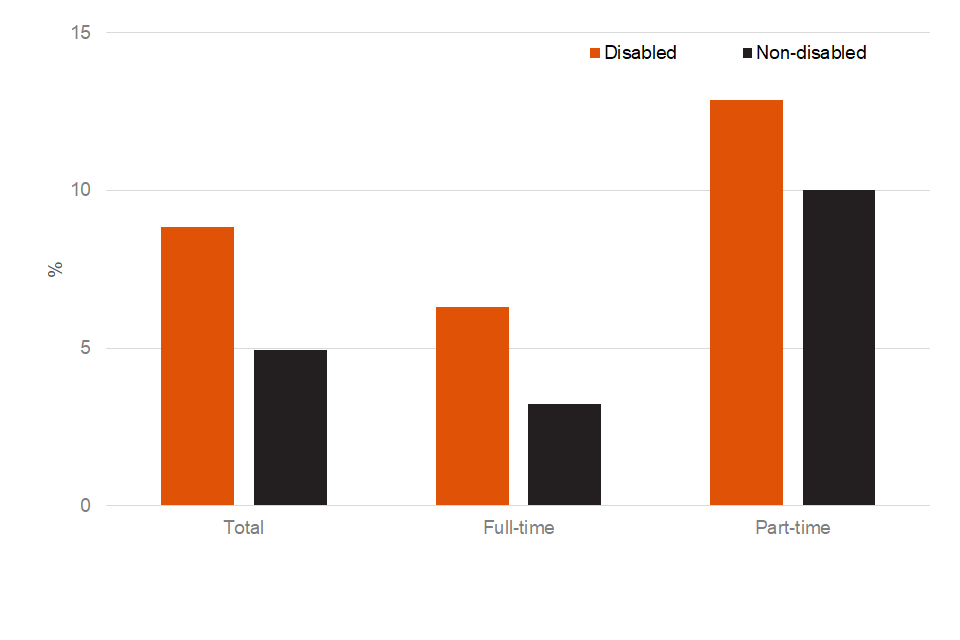
Source: Annual Population Survey – data and definitions can be found in supplementary data table 24.
We know that disabled workers were more likely to be in part-time employment (see supplementary data table 24). Disabled workers in part-time employment are twice as likely to move out of work compared to those working full-time.
A similar pattern can be seen for non-disabled workers but to an even greater extent. Non-disabled workers in part-time employment are three times more likely to move out of work than those in full-time employment.
Unlike in Figure 23 disability status is measured in the first year regardless of whether it changes the following year.
Disabled people are more likely to move out of work if their main health condition is a progressive illness
Figure 25: Proportion of flows by employment status and main health condition, disabled people aged 16 to 64, UK, 2014 to 2019
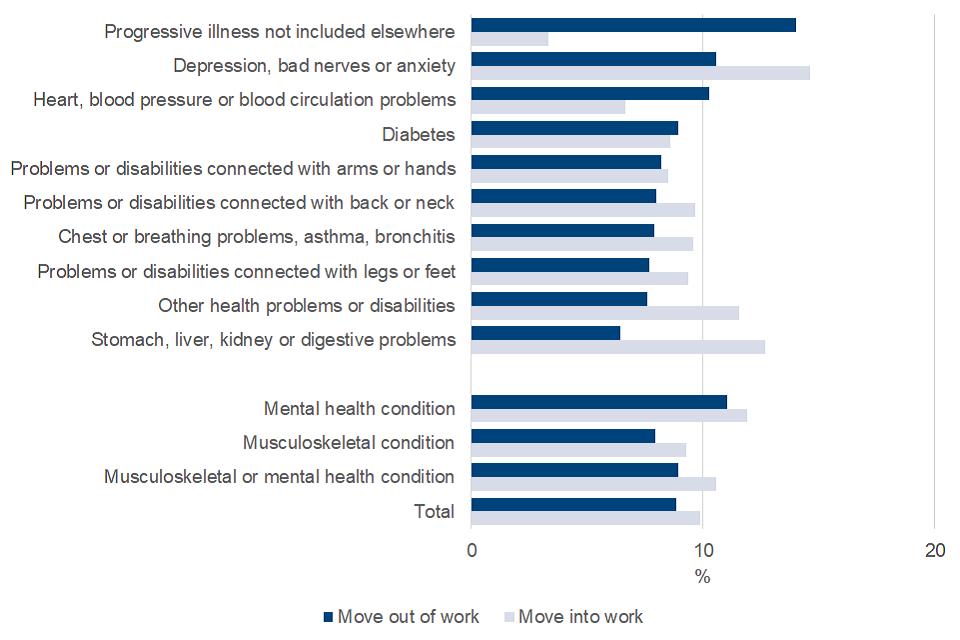
Source: Annual Population Survey – data and definitions can be found in supplementary data table 25a.
Disabled people whose main health condition is either a progressive illness (such as cancer, multiple sclerosis, symptomatic HIV, Parkinson’s disease or Muscular Dystrophy) or depression, bad nerves or anxiety are more likely to move out of work compared to those with other conditions. For example, 14.0% of disabled people with a progressive illness who were in employment one year were no longer in employment the next. This compares to 6.4% for disabled people with stomach, liver, kidney or digestive problems as their main health condition.
Disabled people whose main health condition is depression, bad nerves or anxiety have one of the highest rates of movements out of work (10.6%) and, also one of the highest rates of movements into work (14.6%). This group is the most likely to change their employment status in any given year. Disabled people with a mental health condition are more likely to move both out of work and into work compared to those with a musculoskeletal condition as their main health condition.
Estimates for some health conditions are based on small sample sizes and therefore subject to a higher degree of uncertainty. The data for all health conditions can be found in supplementary data table 25a. The equivalent data for main or secondary health conditions can be found in supplementary data table 25b. Unlike in Figure 23 disability status is measured in the first year regardless of whether it changes the following year.
Additional flows data by age, gender and highest qualification can be found in supplementary data tables 26 to 28.
9. About these statistics
These statistics have been compiled using data from the Labour Force and Annual Population surveys which are produced by the Office for National Statistics (ONS). They follow the same definitions and UK coverage used in the ONS Labour Market Overview. They have been developed using guidelines set out by the UK Statistics Authority and are badged as Official Statistics.
Where to find out more
For more information see the Background information and methodology.
Statement of compliance with the Code of Practice for Statistics
The Code of Practice for Statistics (the Code) is built around 3 main concepts, or pillars:
- Trustworthiness – is about having confidence in the people and organisations that publish statistics
- Quality – is about using data and methods that produce assured statistics
- Value – is about publishing statistics that support society’s needs for information
The following explains how we have applied the pillars of the Code in a proportionate way.
Trustworthiness
Labour Force Survey, Annual Population Survey data have been produced in line with the Code and are used in highly-scrutinised National Statistics publications.
Quality
Several of the key series have been taken directly from a National Statistics publication (Labour Market Overview), produced by the Office for National Statistics (ONS). The data sources used for new analysis in this release are already used for similar analyses in National Statistics publications. The specific analyses included here have been quality-assured, including through peer-review, plausibility checks and validation against other published sources.
Value
This release provides a detailed picture of disability employment up to 2021. It provides important context on the government’s commitment to reduce the disability employment gap, its goal to see one million more disabled people in work between 2017 and 2027, and the strategy set out in Improving lives: the future of work, health and disability in November 2017.
Making this information accessible provides Ministers and stakeholders with an overview of disability employment, while helping to reduce the administrative burden of answering Parliamentary Questions, Freedom of Information requests and ad hoc queries.
By comparing high-level estimates from different data sources, this release also provides an evidence base drawing on a number of different sources, enabling a more rounded picture of broad trends.
Related statistics
The following publications provide additional data, evidence and context on the topics of health, disability and employment.
Access to Work recipients: Statistics on the number of people who had Access to Work provision approved.
Adult Psychiatric Morbidity Survey: Provides data on the prevalence of both treated and untreated psychiatric disorder in the English adult population (aged 16 and over).
Adult Social Care Outcomes Framework (ASCOF): Measures how well care and support services achieve the outcomes that matter most to people.
An overview of workers who were furloughed in the UK: Characteristics of those who have been furloughed in the UK and how the furlough scheme has affected labour market outcomes and skills.
Are we facing a mental health pandemic?: Depression and adults during the pandemic.
Coronavirus and depression in adults: Analysis of the proportion of the adult population of Great Britain experiencing some form of depression. Includes analysis by age, sex and other characteristics.
Coronavirus and GP diagnosed depression in England: Analyses of trends in GP diagnosed depression in the adult population in England.
Coronavirus and the social impacts on disabled people in Great Britain: Indicators from the Opinions and Lifestyle Survey on the social impact of the coronavirus (COVID-19) pandemic on disabled people in Great Britain.
Coronavirus (COVID-19) latest insights: Well-being: Impact of coronavirus (COVID-19) on well-being.
DWP benefits statistics: National and Official statistics on the main benefits administered by the DWP.
Family Resources Survey: An annual report that provides facts and figures about the incomes and living circumstances of households and families in the UK.
Health Survey for England: Monitors trends in the nation’s health and care for adults aged 16 and over, and children aged 0 to 15, living in private households in England.
HMRC coronavirus (COVID-19) statistics: HMRC data about the Coronavirus Job Retention Scheme.
Households below average income (HBAI) statistics: Statistics on the number and percentage of people living in low-income households in the UK.
Labour market status of disabled people: Labour market status (employment, unemployment and inactivity) of disabled people. This table is updated 4 times a year in February, May, August and November. These estimates are sourced from the Labour Force Survey, a survey of households.
Outcomes for disabled people in the UK: Outcomes for disabled people across areas of life: education, employment, social participation, housing, well-being, loneliness and crime. Analysis by disability status and by age, sex, impairment type and severity, country and region based on survey data.
Personal Independence Payment: Includes numbers of claims in payment, new claim registrations, decisions and awards made.
Work and Health Programme: Statistics on people referred to and starting on the Work and Health Programme.
Contact information and feedback
Authors: Arun Mehan and Hasan Uddin
Lead Statistician: Mark Burley
For more information on disability employment statistics, contact the Disability Employment Monitoring team at: team.workandhealthanalysis@dwp.gov.uk
DWP would like to hear your views on our statistical publications. If you use any of our statistics publications, we would be interested in hearing what you use them for and how well they meet your requirements. Please email DWP at:
stats-consultation@dwp.gov.uk.
Press enquiries should be directed to the DWP Press Office: 020 3267 5144
Pre-release access
In addition to staff who are responsible for the production and quality assurance of the statistics, up to 24-hour pre-release access is provided to ministers and other officials. We publish the job titles and organisations of the people who have been granted up to 24-hour pre-release access to the latest disability employment statistics.
Next release
The next annual release of these statistics is expected in Summer 2022. An exact publication date will be listed in the statistics release calendar.
ISBN: 978-1-78659-367-2