Statistics on International Development: final UK aid spend 2020
Updated 8 June 2022

© Crown copyright 2022
This publication is licensed under the terms of the Open Government Licence v3.0 except where otherwise stated. To view this licence, visit nationalarchives.gov.uk/doc/open-government-licence/version/3 or write to the Information Policy Team, The National Archives, Kew, London TW9 4DU, or email: psi@nationalarchives.gov.uk.
Where we have identified any third party copyright information you will need to obtain permission from the copyright holders concerned.
This publication is available at https://www.gov.uk/government/statistics/statistics-on-international-development-final-uk-aid-spend-2020/statistics-on-international-development-final-uk-aid-spend-2020
1. Summary
In 2020:
- the final ODA:GNI ratio was 0.70%
- in 2020, UK Official Development Assistance (ODA) spend was £14,479 million, a decrease of £698 million (4.6 % decrease) on 2019
- UK bilateral ODA spend was £9,533 million (65.8% of total UK ODA) while UK core funding to multilaterals was £4,945 million (34.2% of total UK ODA)
- the Foreign, Commonwealth and Development Office (FCDO) spent £10,664 million in 2020, compared with £11,786 million in 2019 (a decrease of £1,122 million). The FCDO’s share of total UK ODA stood at 73.7% in 2020, compared to an FCDO equivalent of 77.7% in 2019
- non-FCDO spend on ODA (by Other Government Departments and other contributors of UK ODA) was £3,815 million in 2020, compared with £3,391 million in 2019 (an increase of £424 million). The non-FCDO share was 26.3%, up from 22.3% in 2019
- Africa remained the largest recipient of UK region-specific bilateral ODA in 2020 – accounting for 51.8%
- the top 3 recipients of UK bilateral country specific ODA were Ethiopia (£254 million), Nigeria (£241 million) and Somalia (£232 million)
- the largest amount of bilateral ODA was focused on the sectors Health (£1,590m), Humanitarian Aid (£1,531m) and Multisector/Cross-Cutting (£1,112 million)
- in 2020, approximately £1.66 billion of UK bilateral ODA was spent on activities which directly address the COVID-19 pandemic. FCDO accounted for 94.8% of this ODA
Infographic: In 2020 the UK provided £14.5 billion of official development assistance
2. Setting the scene on Official Development Assistance
What is ODA?
Official Development Assistance (ODA) is provided according to the standardised definitions and methodologies of the Organisation for Economic Cooperation and Development’s (OECD) Development Assistance Committee (DAC). ODA (also known as aid) is defined as resource flows to developing countries and multilateral organisations, which are provided by official agencies (e.g. the UK government) or their executive agencies, where each transaction meets the following requirements:
- it is administered with the promotion of the economic development and welfare of developing countries as its main objective
- it is concessional, including grants and soft loans[footnote 1]
Which countries are ODA eligible?
The list of countries eligible to receive ODA is set by the OECD DAC. Gross National Income (GNI) per capita below the World Bank high-income threshold defines the coverage and boundaries of the list. It includes all low, lower-middle and upper-middle income countries, except for those that are members of the G8 or the European Union (including countries with a firm accession date for EU membership). The DAC reviews the list every 3 years. Countries ‘graduate’ if they have surpassed the high- income GNI per capita threshold for the 3 consecutive years prior to a graduation year.
3. About this release
What is in this report?
This report contains the release of finalised UK ODA spend figures for the calendar year 2020, including:
- total UK spend on ODA, the UK’s ODA:GNI ratio and a breakdown of spend by main government department delivery channels (chapter 4)
- analysis of UK ODA spend by recipient country or multilateral organisation, as well as type of assistance and sector (chapter 5)
- comparisons between the UK and other donor countries (chapter 6)
Comparisons between 2019 and 2020 ODA figures are made, as well as trends over the last 5 years (2016 to 2020 inclusive as shown in most tables). This publication updates previous provisional figures of UK ODA for 2020 published in April 2021.
All data tables included in this report are available to download in spreadsheet format. A full micro-dataset is also available in Open Data Standard format on the Statistics on International Development webpage. If you require any other data or information, or if you have any suggestions on how to improve the publication, please contact the statistics team at: statistics@fcdo.gov.uk.
Further information on the technical terms, data sources, quality and processing of the statistics in this publication are found in Annexes 1 to 3 on the Statistics on International Development webpage.
Note to users
FCDO figures
-
on the 2 September 2020, the Department for International Development (DFID) and Foreign and Commonwealth Office (FCO) merged to form a new department - the Foreign, Commonwealth and Development Office (FCDO). This report presents spend in 2020 by former DFID and former FCO as well as total 2020 spend by FCDO. From 2021, the first full year of the merged department, only the FCDO aggregated spend will be available
-
in the report there are comparisons to 2019 FCDO figures. These are based on the sum total of former DFID and former FCO spend given that FCDO did not exist in 2019
Reduction in Gross National Income and ODA
-
in July 2020, in response to an expected decrease in the size of the economy as a result of the COVID-19 pandemic, and therefore a decrease in the value of the 0.7% commitment for 2020, the Government announced a package of reductions in planned ODA spend[footnote 2]. The announcement noted there would continue to be adjustments made to ODA spend in 2020 to respond to further changes in the economy and therefore the value of the 0.7% commitment. It is important to note that the outturn figures shown in this report reflect how the 0.7% commitment was met in 2020 and are likely to differ from figures relating to the Government review process (see background note 7.2 for more information)
-
the Office for National Statistics (ONS) implemented a new methodology for calculating Gross Domestic Product (GDP) in its 2019 Blue Book (the UK National Accounts statistics), which in turn had an impact on GNI. The GNI used to calculate the ODA:GNI ratio for 2019 was based on the pre-2019 Blue Book methodology
-
as stated in Final SID 2019, GNI figures based on the new methodology (ONS headline measure for GNI) were used for managing and reporting 2020 ODA spend (see the explanatory note for more detail). It’s worth noting, therefore, that the change in the ONS headline measure for UK GNI between 2019 and 2020 will not directly match the change in the 2019 and 2020 UK GNI figures reported in SID
4. UK ODA Flows
This chapter provides an overview of UK Official Development Assistance (ODA). It covers the total amount of ODA provided by the UK in 2020, the calculation of the ODA:GNI ratio (section 4.1), longer-term spending trends (section 4.2), breakdowns of UK ODA spend by main delivery channel (section 4.3), and by contributors (section 4.4).
4.1. The ODA:GNI Ratio
The ODA:GNI ratio presents the total amount of UK ODA as a proportion of UK Gross National Income (GNI).
Key Definition: 0.70% commitment
An ODA:GNI target of 0.7% was first agreed internationally in 1970 by the United Nations General Assembly. The UK government made a commitment to spend 0.7% of GNI on ODA from 2013. In 2015 the International Development (Official Development Assistance Target) Act 2015 placed the 0.7% commitment in UK law from 2015 and in each subsequent calendar year.
Following economic and fiscal circumstances of the Coronavirus (COVID-19) pandemic, the UK government announced a temporary reduction in ODA spending in 2021 to spend 0.5% of GNI[footnote 3]. In June 2021, the UK government set out the conditions for the UK’s return to 0.7 per cent – “when the independent Office for Budget Responsibility’s fiscal forecast says that, on a sustainable basis, the UK is not borrowing to finance day-to-day spending and underlying debt is falling”[footnote 4].
Table 1 shows that in 2020:
- the ODA:GNI ratio was 0.70% and the commitment to spend 0.7% of GNI on ODA was met
- UK ODA was £14,479 million, a decrease of £698 million (4.6%) on 2019. This change is driven by the decrease in GNI, and therefore the reduction in the value of the 0.7% commitment, due to the impact of the coronavirus (COVID-19) pandemic on the size of the UK economy. The GNI used to calculate the UK ODA:GNI ratio fell from £2,158 billion in 2019[footnote 5] to £2,074 billion in 2020
Table 1: UK GNI estimates, total UK ODA and ODA:GNI ratios, 2019 and 2020; Current prices (£ millions)
| 2019 [r] | 2020 | ||||
|---|---|---|---|---|---|
| GNI (a) | ODA | ODA:GNI ratio | GNI (b) | ODA | ODA:GNI ratio |
| 2,157,826 | 15,176 | 0.70% | 2,073,880 | 14,479 | 0.70% |
(a) The Gross National Income (GNI) used is measured on a pre-2019 Blue Book methodology. For more detail, please see our Use of New GDP Framework’ explanatory note. (b) GNI in 2020 is measured on the post-Blue Book 2019 level, this is the headline Office for National Statistics (ONS) measure for GNI. [r] As announced in Provisional SID 2020 several minor revisions have been made to 2017, 2018 and 2019 data. Please see background note 7.3: Revisions for details.
4.2. Long-term trends in UK ODA spend
Figure 1 shows the trend in UK ODA since 1970. Overall there has been a steady increase in the level of UK ODA since 1970, with a peak in 2005 and 2006 which was driven by high levels of debt relief, and a steep increase in 2013 when the UK Government first met the 0.7% ODA:GNI target. As the UK commitment to spend 0.7% on ODA is based on the UK GNI (a key economic measure), when GNI increases/decreases, in turn the UK ODA spend will also increase/decrease.
Between 2013 and 2019, UK ODA continued to increase in line with growth in the UK’s GNI. The relatively larger increase in the level of ODA in 2016 (by £1.2 billion) reflects the switch to the European System of Accounts (ESA) 2010 methodology for measuring GNI and the consequent increase in UK ODA to meet the 0.7% ODA commitment on that basis.
The decrease in 2020 ODA spend reflects the decrease in the size of the economy in 2020 as a result of the Coronavirus (COVID-19) pandemic. Figure 1 shows the levels of ODA in 2020 are broadly similar to the amount of ODA spend in 2018 (£14,542 million).
Figure 1: UK ODA levels (£ billions) and ODA:GNI ratios (%), 1970 - 2020.
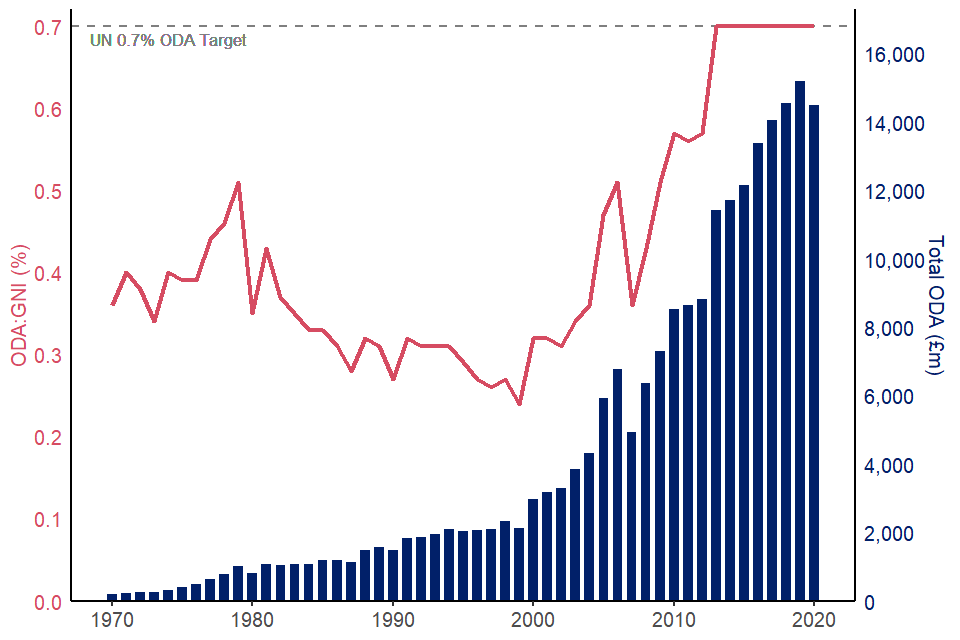
Figure 1 legend: The blue bars are the UK ODA spend from 1970 to 2020, the pink line is the calculated ODA:GNI ratio from 1970 to 2020 and the grey dashed line is the 0.7% ODA:GNI target set by the United Nations General Assembly in 1970. From 2018 onwards, ODA has changed from being measured on a cash basis to being measured on a grant equivalent basis, following a decision taken by the DAC in 2014[footnote 6].
4.3. UK ODA characteristics in 2020
Bilateral and Core Multilateral ODA
Key Definition – Bilateral and Core Multilateral ODA
There are 2 main delivery channels for ODA: bilateral and multilateral.
Bilateral ODA is earmarked spend, i.e. the donor has specified where and/or what the ODA is spent on – this is usually ODA going to specific countries, regions or programmes. There are 2 types of bilateral ODA:
- ‘Bilateral through multilateral’: this is ODA provided by a donor for a specific purpose or fund, using a multilateral organisation as its channel of delivery. For example, support to the World Food Programme’s (WFP) Emergency Operations in Yemen
- ‘Other bilateral’: this is ODA provided by a donor for a specific purpose which is given directly to recipient governments or delivered by through other partners, such as Non-Governmental and Civil Society Organisations, research institutions and universities. For example, delivering family planning services across Malawi through an NGO
Core multilateral ODA is un-earmarked funding from national governments to multilateral organisations[footnote 7], which is pooled with other donors’ funding and disbursed as part of the core budget of the multilateral organisation[footnote 8]. For example, the UK’s contribution to the World Bank International Development Association. Core contributions will fluctuate year-to-year in part due to the payment schedules of the receiving multilateral organisation.
- £9,533 million of UK ODA was delivered through bilateral channels. This was an 8.4% decrease (£871 million) compared to 2019. This change is driven by the decrease in GNI as set out in section 4.1
- £2,632 million of bilateral ODA was delivered through multilateral organisations, a decrease of £598 million compared to 2019. The percentage share of bilateral through multilateral also decreased compared to 2019, from 21.3 % to 18.2%
- multilateral ODA accounted for 34.2% of total UK 2020 ODA, an increase to its percentage share compared to 2019 (31.4%). Despite this slight increase in share, the proportion of UK ODA delivered through core multilateral ODA is still below the share seen each year between 2010 to 2018 (above 36%)
- £4,945 million of UK ODA in 2020 was delivered through core contributions to multilateral organisations. This was a 3.6% increase (£173 million) compared to 2019, partly driven by the UK’s ODA contribution to the IMF Poverty Reduction and Growth Trust (£255 million) and Green Climate Fund (£450 million). The UK did not make a contribution to either of these organisations in 2019
Total UK ODA by main delivery channel (%), 2016 to 2020
| Year | Other Bilateral | Bilateral through Multilateral | Core Multilateral |
|---|---|---|---|
| 2020 | 47.7% | 18.2% | 34.2% |
| 2019 | 47.3% | 21.3% | 31.4% |
| 2018 | 44.4% | 19.1% | 36.5% |
| 2017 | 43.9% | 18.7% | 37.4% |
| 2016 | 44.7% | 19.1% | 36.2% |
Legend: total UK ODA by main delivery channel. The bars for each year represent 100% of total UK ODA spend. The dark blue section represents the proportion of total UK ODA delivered through ‘Other Bilateral’ channels. The lighter blue represents the same measure but for ODA delivered through the ‘Bilateral through Multilateral’ channel. The grey section represents the proportion of total UK ODA that was channelled as core contributions to multilaterals, ‘Core Multilateral’. Note, percentages may not sum to 100 due to rounding.
COVID-19 pandemic
In March 2020, the World Health Organization stated that the COVID-19 outbreak was a global pandemic. Since then, a proportion of UK ODA has been directed to support the international response to COVID-19 including helping developing countries counter its health, humanitarian and socio-economic impacts and supporting vaccination efforts.
In 2020, approximately £1.66 billion[footnote 9]: of UK bilateral ODA was spent on activities which directly addressed the COVID-19 pandemic. FCDO accounted for 95.0% of this ODA.
Please see below for more detail on the UK ODA spend on COVID-19 activities.
Case study: UK ODA focused on COVID activities
4.4. Makeup of UK ODA by Government Department and other contributors of UK ODA
Table 2 shows UK ODA spend broken down by government department and other official sector contributors in 2020. It also shows changes in spend from 2019.
The overall amount of ODA spent in any given calendar year is determined by the size of GNI, however shifts in the percentage shares of departments and other ODA contributors depend on their spending in the given year. See ’Note to Users’ (Page 8) for more information on the UK’s Government’s review of ODA in response to the expected decrease in the size of the economy as a result of the COVID-19 pandemic, and therefore a decrease in the value of the 0.7% commitment for 2020.
Contributors of UK ODA in 2020
- FCDO spent £10,664 million of ODA (73.7% of total UK ODA) in 2020 (of which former DFID: £10,046 million, former FCO: £618 million). This was a decrease of £1,122 million (or 9.5%) compared with the total ODA spend by former DFID and former FCO in 2019
- ODA spend by all contributors other than FCDO (referred to as non-FCDO) totalled £3,815 million in 2020, an increase of 12.5% (or £424 million) on 2019
Of this:
- spend by government departments other than FCDO (known as Other Government Departments) totalled £2,757 million in 2020, an increase of 2.2% (or £59 million) on 2019
- spend by Other Contributors of UK ODA totalled £1,057 million in 2020, an increase of 52.8% (or £365 million) compared to 2019
Table 2: Breakdown of UK ODA by Government Department and Other Contributors of UK ODA [footnote 10]
The largest year on year changes amongst non-FCDO contributors were:
-
the UK’s ODA contribution to the IMF Poverty Reduction and Growth Trust (IMF-PRGT) totalled £255 million in 2020. In 2019 there was no UK ODA contribution to IMF-PRGT
-
Home Office, which spent £597 million in 2020, an increase of £151 million, or 33.9%, on 2019. This was due to increased accommodation costs for asylum seekers to support additional measures put in place as a result of the COVID-19 pandemic
-
EU Attribution (Non-DFID)[footnote 11] which totalled £600 million in 2020, an increase of £119 million (or 24.8%), from 2019. This was a result of spending by the EU in response to the COVID-19 pandemic
-
Conflict, Stability and Security Fund (CSSF), which spent £534 million of ODA in 2020, a decrease of £119 million (18.2%), from 2019
Contributors’ share of UK ODA
-
with former DFID and former FCO having merged, the FCDO is responsible for the majority of the UK ODA budget. In 2020, the FCDO accounted for 73.7% of UK ODA, compared to 77.7% in 2019 (combined shares of former DFID and former FCO)
-
the share of total ODA spend by contributors other than FCDO increased from 22.3% in 2019, to 26.3% in 2020
-
of the non-FCDO contributors, ODA coming from Other Government Departments’ (OGDs) accounted for 19.0 % of total UK ODA, compared to 17.8% in 2019. The departments with the largest ODA shares were: the Department for Business, Energy & Industrial Strategy (BEIS) (6.9% of ODA); the Home Office (4.1%); the Conflict, Stability and Security Fund (3.7%); and the Department of Health and Social Care (1.7%)
-
the largest Other Contributors of UK ODA were the non-DFID element of the UK’s EU Attribution (4.1% of UK ODA); IMF-PRGT (1.8% of UK ODA) and Gift Aid claimed by charities and used for ODA eligible activities (1.1%of UK ODA).
Figure 3: Breakdown of UK ODA by contributor (2016, 2019 & 2020)

Figure 3 legend:
A. Percentage of UK ODA spend by FCDO (former DFID, former FCO), Other Government Departments (OGDs) and Other UK Contributors (Other Contributors) in 2016 (dark blue), 2019 (light blue) and 2020 (grey). BEIS=Department for Business, Energy and Industrial Strategy; FCO=Foreign & Commonwealth Office.
B. Remaining “OGDs” = “Other government departments”: Prosperity Cross-Government Fund, HM Treasury, Department for Environment, Food and Rural Affairs, Department for Work and Pensions, Department for Education, HM Revenue and Customs, Department for Digital, Culture, Media and Sports, Ministry of Defence, Office for National Statistics, Department for International Trade, Export Credit Guarantee Department.
C. remaining “Other UK contributors” = “Other contributors of UK ODA”, Scottish Government, Other In-Donor Refugee Costs, Colonial Pensions administered by DFID and Welsh Government.
5. Analysis of UK ODA spend
Setting the scene
In 2020, there was a reduction in the value of the 0.7% commitment, due to the impact of the coronavirus (COVID-19) pandemic on the size of the UK economy. This has led to a reduction in the amount of UK ODA being delivered through bilateral channels in 2020. A wide range of countries have seen a reduction in the amount of bilateral ODA they received in 2020 compared to 2019. It’s important to note that some of the year-on-year changes will be due to usual fluctuations that can occur such as programme cycles beginning/ending, or humanitarian crises as well as a result of decisions made in response to the fall in the value of 0.7%.
This publication reports on how much UK ODA has been provided to countries in 2020 and compares to 2019 figures. It is important to note that these comparisons are likely to differ from figures relating to the Government review process (see background note 7.2 for more information) and do not compare to planned budgets.
This chapter provides an overview of where UK ODA is spent. Section 5.1 provides a detailed breakdown of ODA spending by recipient region and country; section 5.2 provides a breakdown of ODA spending by sector (for example, health or humanitarian aid); and section 5.3 provides a breakdown of ODA spending to multilateral organisations.
5.1. Regional / Country Breakdowns of Bilateral ODA Spend [footnote 12]
Bilateral ODA (see definitions box section 4.2) includes ODA to specific countries or regions (sections 5.1.1-5.1.5) as well as ODA to multiple countries and/or regions [footnote 13]. Also included is ODA to specific sectors for which there are no designated benefitting country or region, or where benefitting countries are not known until the end of the programme [footnote 14] (section 5.1.6).
5.1.1. Bilateral ODA spend by region
In 2020, 52.9% (£5,041m) of the UK’s bilateral ODA was allocated to a specific country or region. This is a reduction from 2019 (£860m, or 14.6% reduction). This was partly due to a decrease in the amount of ODA provided to Africa and Asia in 2020, as well as a large proportion (65.9%) of the UK’s that was spent on activities to address the COVID-19 pandemic not being allocated to a particular country or region.
As a region, Africa continues to receive the largest proportion of UK bilateral ODA allocated to a specific country or region (51.8%). The amount of bilateral ODA provided by the UK to Africa decreased by £375 million in 2020 to £2,610 million, however the percentage share remained similar to the share in 2019 (50.6%), (Figure 4).
Asia remains the second largest recipient of UK bilateral ODA in 2020 with 39.2% (£1,974m), followed by the Americas with 5.4% (£272 million), Europe with 3.3% (£166 million) and the Pacific with 0.4% (£19 million).
Figure 4: UK Bilateral ODA by recipient region (£ millions), 2009 to 2020
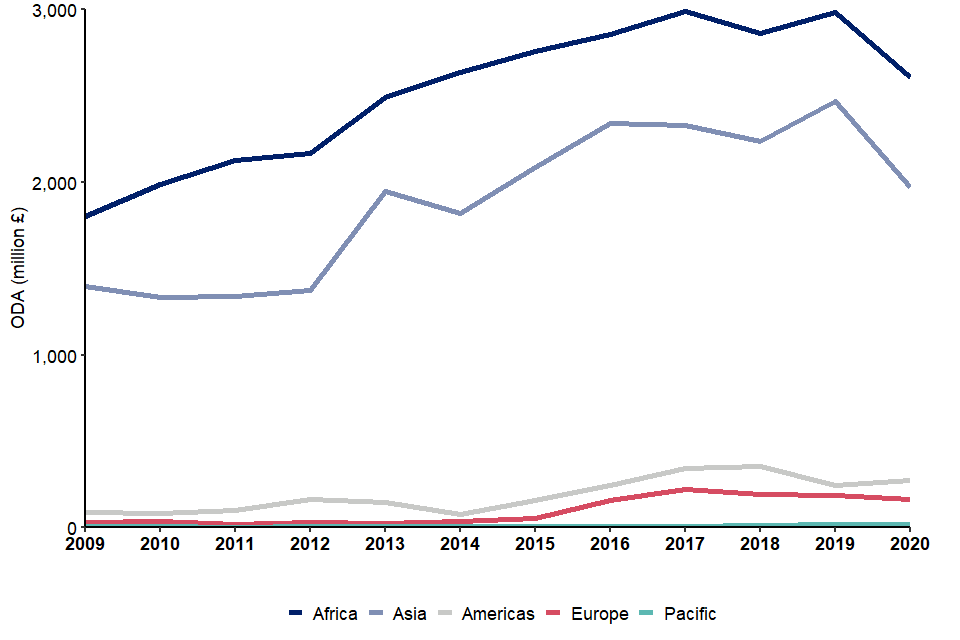
Figure 4 legend: UK bilateral ODA by receiving region (£ millions), 2009 – 2020. Dark blue = Africa, light blue = Asia, grey = Americas, pink = Europe, teal = Pacific.
5.1.2. Changes in the Flow of UK Bilateral ODA by Region
5.1.2.1. Africa
2020: Bilateral ODA to Africa decreased by £375 million (12.6%) from £2,985 million in 2019 to £2,610 million in 2020 (Figure 4). The sector that experienced the largest decrease was the health sector, and the country that experienced the largest country-specific [footnote 15] decrease was Uganda (see 4.1.3.2 for more information).
Over 5 years: Africa has consistently received the largest amount of UK ODA. Bilateral ODA to Africa saw a drop in 2018 to £2,861 million before increasing again in 2019 to £2,985 million. In 2020, bilateral ODA received by Africa fell to similar levels as in 2014 (£2,637 million).
5.1.2.2. Asia
2020: In 2020, the volume of bilateral ODA to Asia was £1,974 million, decreasing by £494 million (20.0%) from 2019 (Figure 4). Asia received 39.2% of bilateral ODA allocated to a specific country or region in 2020, compared to 41.8% in 2019. The sector that experienced the largest decrease was humanitarian aid, and the largest decrease in country-specific ODA was experienced by Pakistan (reduction of £105 million from 2019).
Over 5 years: Between 2016 and 2018 ODA to Asia was similar each year (average of £2,303 million) with a £233 million increase from 2018 to 2019. The subsequent £494 million reduction between 2019 and 2020 results in ODA volumes similar to the amounts reported for 2014 and 2015 (£1,818 million and £2,084 million respectively).
5.1.2.3. The Americas
2020: The Americas received £272 million of UK bilateral ODA in 2020, an increase of £29 million or 11.7% compared to 2019 (Figure 4). The largest country-specific increase was £24 million to Colombia (see case study on page 29), primarily driven by a BEIS programme tackling deforestation and promoting sustainability.
Over 5 years: UK ODA to the Americas is on a smaller scale than to Africa or Asia. Despite the drop in 2019, ODA has returned to an upward trajectory after increasing steadily year-on-year, from £242 million in 2016 to £355 million in 2018.
5.1.2.4. Europe
2020: Europe received £166 million of UK bilateral ODA in 2020, a decrease of £22 million compared to the previous year (Figure 4). The most significant country-specific reduction was seen in Turkey (£4 million decrease from 2019). The largest sector reduction was observed in government and civil society (£11 million decrease from 2019).
Over 5 years: Like the Americas, ODA spend in Europe[footnote 16] is small compared to Asia and Africa. Bilateral ODA to Europe hit a high point in 2017 of £223 million, partly driven by support for displaced refugees during the Syria Crisis, and since then has been steadily decreasing.
5.1.2.5. Pacific
A small proportion of UK bilateral ODA goes to the Pacific (Figure 4). In 2020, UK bilateral ODA to the region was £19 million, 0.4% of total UK bilateral ODA spend allocated to a region or country. This is an increase of £3 million from last year, with Fiji being the largest country specific recipient.
5.1.3. Bilateral ODA spend by Country
In 2020, the UK provided bilateral assistance to 131 countries (broadly the same number as previous years, Figure 5), with spend primarily concentrated in East Africa and the Middle East.
Figure 5: Map of UK Bilateral ODA Spend by Recipient Country: 2020
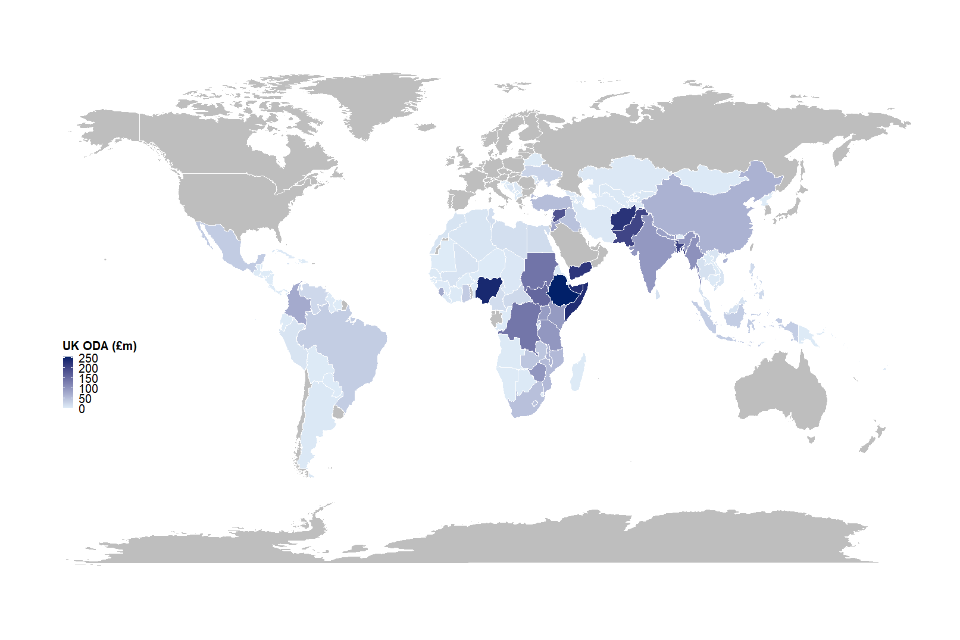
Figure 5 legend: World Map coloured by amount of bilateral ODA spend in recipient country (£ million) in 2020. Highlighted countries are those in receipt of UK bilateral ODA, and colours are based on amount received (dark blue=higher amounts UK Bilateral ODA received, light blue=lower amounts UK Bilateral ODA received).
5.1.3.1. Top 5 country-specific recipients of UK ODA
- UK bilateral ODA spend to the top 5 recipient countries (out of a total of 131 countries) in 2020 decreased from £1,411 million in 2019 to £1,174 million in 2020. They received over a quarter (27.7%) of the total country-specific UK bilateral ODA in 2020, broadly similar to 2019 (28.3%) (Figure 6)
- in 2020 the top 3 recipients of UK bilateral country specific ODA were Ethiopia (£254m), Nigeria (£241m) and Somalia (£232 million) (Figure 6). Spend to these countries accounted for 17.2% of total country-specific UK bilateral ODA
- there is less variation in the amount of the bilateral ODA provided to the top 5 country specific recipients in 2020 compared with 5 years ago: the difference between the top recipient and 5th top recipient is £33 million in 2020 compared with £227 million in 2016
- Ethiopia has become the top recipient of UK bilateral ODA in 2020, after being the second largest recipient in 2019, despite a £45 million reduction from 2020. While being the top recipient in 2014, Ethiopia has primarily been in second position since 2015 (dropping to third in 2016). After 5 consecutive years as the top recipient of UK bilateral ODA, Pakistan has dropped 6 places to become the seventh largest (Figure 7)
- Nigeria has become the second largest recipient of bilateral ODA in 2020 despite a continued decline in ODA since 2017, and a decrease of £16 million from 2019
- in 2020, the UK increased the amount of bilateral ODA to Somalia by £57 million from 2019 after a slight decrease between 2018 and 2019 (Figure 6). This means Somalia experienced the largest country-specific increase in bilateral ODA between 2019 and 2020, partly driven by £44 million of debt relief
- the UK provided £226 million of bilateral ODA to Afghanistan, a £64 million reduction from 2019, making it the fourth largest recipient of UK ODA in 2020. The sector experiencing the largest decrease was government and civil society, with the second largest being humanitarian aid
- after having the largest increase in UK bilateral ODA benefitting a specific country in 2019, Yemen experienced a reduction of £39 million (15.1%) in 2020 and dropped from being the fourth to the fifth largest bilateral ODA recipient. Despite this, total ODA to Yemen is still greater than levels seen from 2016 to 2018. Bilateral ODA to Yemen has generally maintained an upward trajectory since 2009 (Figure 6). The increase in 2019 was in part driven by increased humanitarian assistance to conflict affected populations
Figure 6: Top 5 country-specific bilateral ODA recipients, 2009-2020
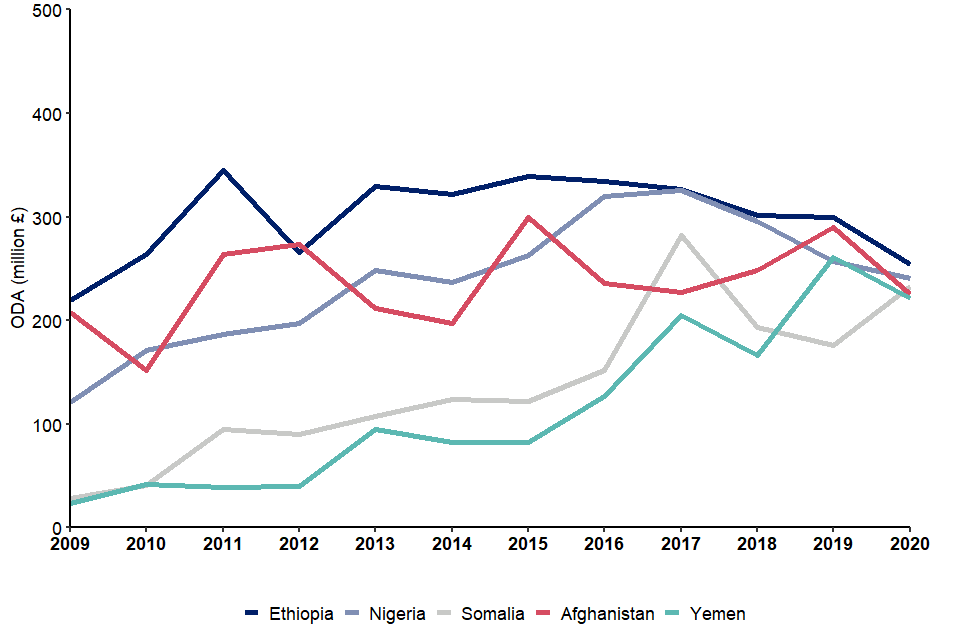
Figure 6 legend: Top 5 Recipients of 2020 UK Bilateral ODA (£ millions), 2009 to 2020. Dark blue = Ethiopia, light blue = Nigeria, grey = Somalia, pink = Afghanistan, teal = Yemen.
5.1.3.2. Other major changes in top 10 country-specific rankings
- Pakistan dropped out of the top 5 with a decrease of £105 million from 2019, giving Pakistan the largest country-specific reduction in bilateral ODA. The sector experiencing the largest decrease was education
- Sudan returned to the top 10 in 2020 for the first time since 2011, climbing 10 places from 2019. Spend increased by £46 million from 2019 to a total of £139 million in 2020, giving Sudan the second largest country-specific increase in bilateral ODA
- Democratic Republic of the Congo moved out of the top 10 following a £48 million bilateral ODA reduction. The sectors experiencing the largest decreases in Democratic Republic of the Congo were Health and Humanitarian Aid
Figure 7: Top 10 recipients of country-specific UK bilateral ODA in 2020
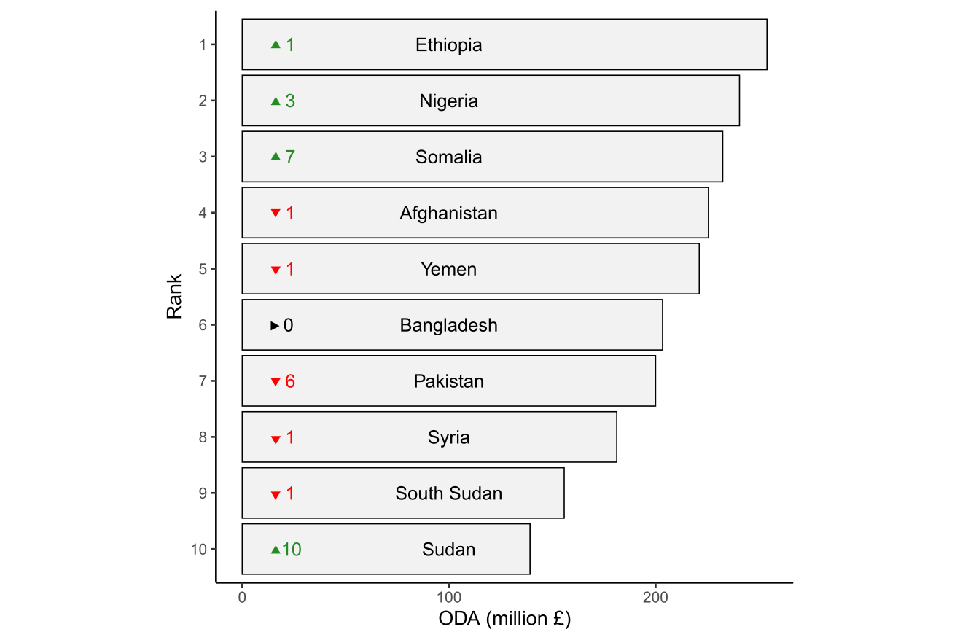
Figure 7 legend: Top 10 Recipients of UK Bilateral ODA in 2020[footnote 17]. The rank (1:10) is on the y-axis, ODA spend (million £) is on the x-axis. The country names and numbers inside each bar are how the rank for that country compared to last year (2019), coloured in red if it’s decreased (with a red downward pointing arrow), green if it’s increased (with a green upward pointing arrow) and black if its unmoving (with black horizontal pointing arrow). For example, Nigeria in 2019 was in 5th position, and in 2020 is in 2nd position (a change of +3).
Case study: top country-specific ODA recipients in top 3 regions over past 5 years[footnote 18]
5.1.4. Income groups
Country income groups
ODA eligible countries are classified into 4 groups – Least Developed Countries (LDC), Other Low-Income Countries (Other LIC), Lower Middle Income Countries (LMIC) and Upper Middle Income Countries (UMIC). The threshold for each income group is based on gross national income per capita published by the World Bank. The list of countries is reviewed every 3 years by the OECD-DAC, and countries exceeding the high-income threshold for 3 consecutive years are no longer ODA eligible.
5.1.4.1. Income groups: country-specific ODA
- LDCs and Other LICs continue to account for the largest proportion of bilateral country-specific ODA spend in 2020 – at 56.5%. UK ODA to UMICs represented 16.0% of UK country specific bilateral ODA in 2020 compared to 13.9% in 2019. The percentage reductions below account for each income group starting at different levels in terms of ODA volume
- total UK bilateral ODA received by LDCs and Other LICs decreased by 14.9% (£418m) from £2,810 million in 2019 to £2,393 million in 2020 (Figure 8)
- in terms of volume, 7 of the top 10 country-specific ODA decreases from 2020 were seen in LDC/Other LICs (Uganda, Afghanistan, Bangladesh, South Sudan, Democratic Republic of the Congo, Mozambique and Ethiopia)
- while LDCs and Other LICs saw the largest reduction in ODA in volume terms, LMICs saw the largest reduction in terms of percentage change - 21.7% decrease compared to 2019, dropping by £322 million
- total UK bilateral ODA received by UMICs decreased by £17 million (2.4%) to £677 million in 2020
Figure 8: Country-specific bilateral ODA by Income Group, 2009 to 2020
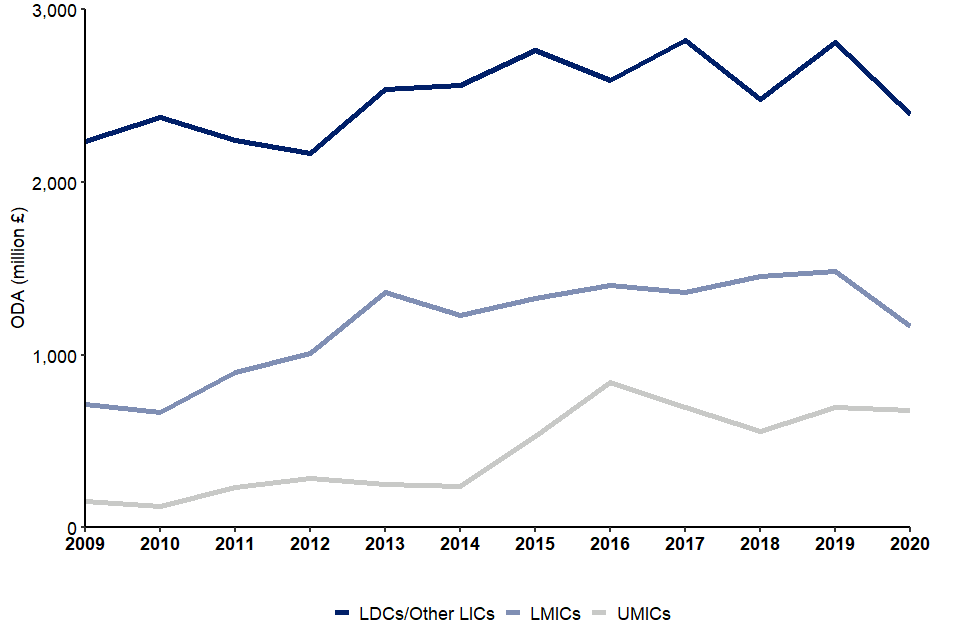
Figure 8 legend: Breakdown of Country-Specific UK Bilateral ODA by Country Income Group, 2009-2020. Dark blue = LDCs/Other LICs (Least Developed Countries/Other Low Income Countries), light blue = LMICs (Lower Middle Income Countries), grey = UMICs (Upper Middle Income Countries).
5.1.4.2. Income groups: FCDO - non-FCDO comparison 2020
- FCDO spent £3,501 million of UK bilateral country-specific ODA - accounting for 82.7% of total UK bilateral country-specific ODA in 2020 (Figure 9)
- the majority of FCDO’s country-specific ODA was provided for the benefit of LDCs or Other LICs in 2020 – 62.0% (£2,170 million)
- non-FCDO contributors spent £733 million of UK bilateral country-specific ODA in 2020, a £34 million increase compared to 2019. The majority of non-FCDO country-specific ODA was channelled to Middle Income Countries – 69.6% (£221 million to LMICs and £290 million to UMICs)
- LDCs and Other LICs received £223 million of non-FCDO bilateral ODA in 2020, this was an increase of £29 million compared to 2019. This was partly driven by debt relief to Somalia
Figure 9: Breakdown of country-specific bilateral ODA by Income Group, 2020
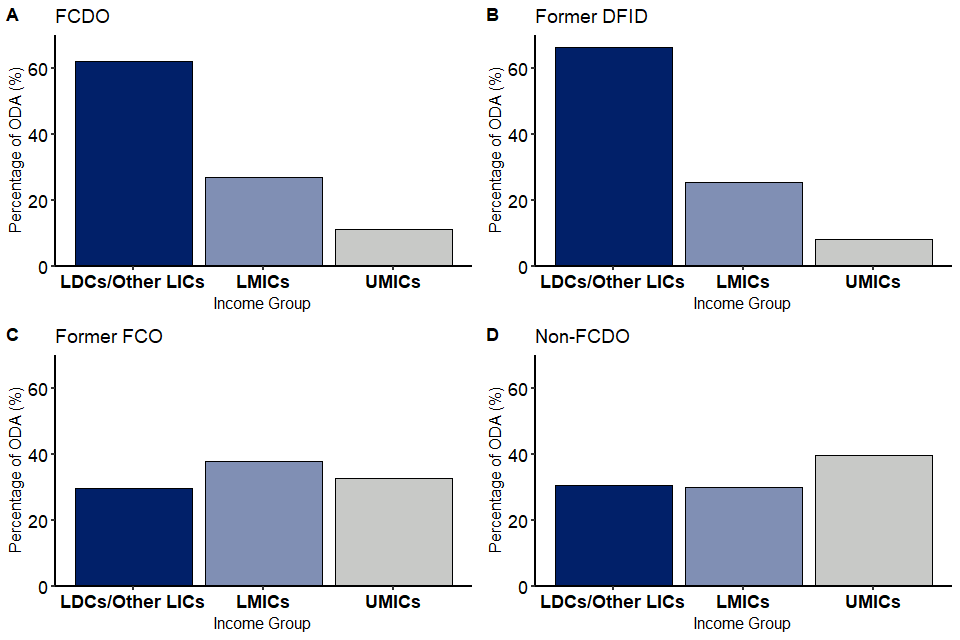
Figure 9 legend: FCDO (A), Former DFID (B), Former FCO (C) and Non-FCDO (D). Breakdown of Country-Specific UK Bilateral ODA by Country Income Group, 2020. Dark blue = LDCs/Other LICs (Least Developed Countries/Other Low Income Countries), light blue = LMICs (Lower Middle Income Countries), grey = UMICs (Upper Middle Income Countries).
5.1.5. Bilateral ODA Spend by Region and Government Department and Other Contributors of UK ODA
In 2020, 94.7% of FCDO’s region-specific bilateral ODA went to countries in Africa and Asia (£3,808 million). Africa has consistently been the largest recipient of FCDO region-specific ODA, with a share of 55.4% in 2020 (see Figure 10A). This is primarily driven by former DFID spend (Figure 10B), as former FCO continue to spend the largest portion of ODA in Asia (Figure 10C).
By contrast, Asia has been the largest recipient of non-FCDO region-specific ODA (Figure 10D), although since 2016 Africa and Asia have steadily become more similar in terms of ODA split. In 2020, non-FCDO ODA contributors spent £395 million in Asia, accounting for 38.8% of their total region-specific spend. Non-FCDO contributors also spent a larger proportion of their ODA in Europe and the Americas (23.0%), compared to FCDO (5.1%).
Compared with 2016 (5 years ago), the percentage share of FCDO’s region-specific bilateral ODA received by Africa and Asia remains broadly similar (Africa increased by 0.7 percentage points; Asia decreased by 0.3 percentage points).
The same but more exaggerated pattern emerges from non-FCDO contributors, with Africa’s share of non-FCDO region specific bilateral ODA in 2020 increasing by 10.3 percentage points compared to 2016, while the share received by Asia decreased by 17.8 percentage points over the same period.
Figure 10: Breakdown of region-specific UK bilateral ODA, 2016 and 2020
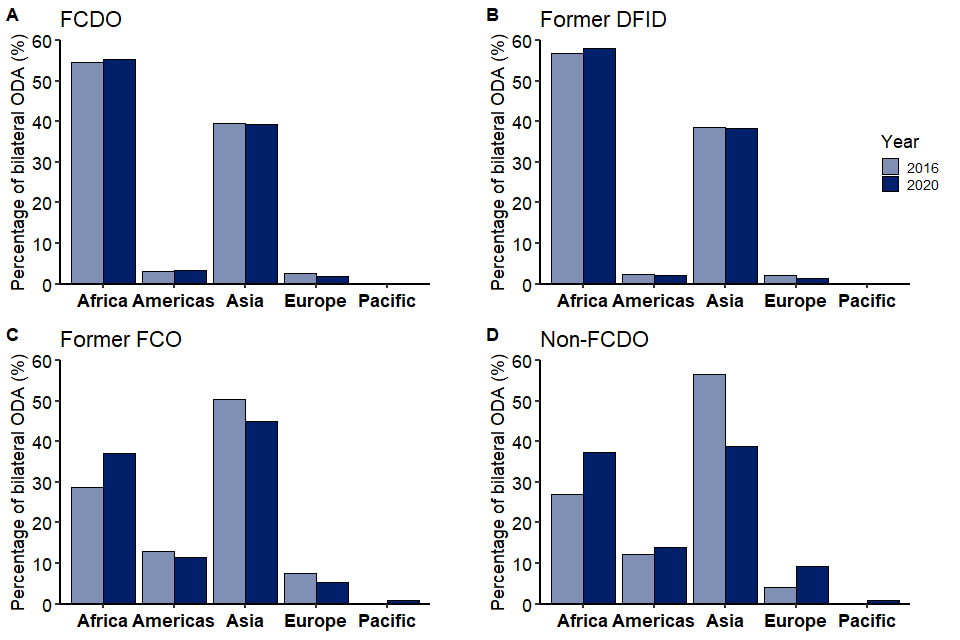
Figure 10 legend: Breakdown of FCDO (A), Former DFID (B), Former FCO (C) and Non-FCDO (D). Country/region-Specific proportion of Bilateral ODA by Region, 2016 and 2020. In light blue are the proportions of UK bilateral ODA by region in 2016, in dark blue are the proportions of UK bilateral ODA by region in 2020. Different regions are on the horizontal axis (Africa, Americas, Asia, Europe, Pacific).
5.1.6. Bilateral ODA Spend with No Single Benefitting Country or Region
In 2020, 47.1% (£4,492 million) of UK bilateral ODA was made up of spend that was not assigned to a single benefitting country or region (i.e. developing country, unspecified ODA) (Figure 11). This is an increase in percentage share but not in volume of spend compared to 2019, when 43.3% (£4,504 million) of bilateral ODA was not assigned to a single benefitting country or region. This value was around 33 to 34% from 2014 to 2017; from 2018 this value has steadily increased. Such spend comprises of, for example, centrally-funded research or programmes that develop policies which aim to benefit several developing countries. It also consists of ODA-eligible expenditure within donor countries, such as the ODA-eligible portion of costs to support asylum seekers and refugees in the UK. See the case study in SID 2018 (p. 34) for more information on ‘Developing country, unspecified’ ODA.
- 35.1% of spend within this category consists of project-type interventions (type of aid code C01) and includes expenditure on multi-country or multi-region projects. As outlined above, these include programmes where there are designated benefitting countries or regions, but it is not possible to directly assign exact spend to them in the current administrative system
- 24.8% of spend within this category consists of expenditure in the UK or another donor country (e.g. support for international development work or asylum seekers/recognised refugees in the UK or another donor country), while 13.5% was for specific programmes or funds managed by international organisations in a specific sector with no designated benefitting countries
- 14.2% was classed as ‘Other’, which includes Other Technical Assistance (includes training and research), Basket Funds and Debt Relief. For example, the FCDO contributed £150 million to the IMF- Catastrophe, Containment and Relief Trust, for COVID-19 related debt relief
- a further 12.4% consists of core support to Non-Governmental Organisations (NGOs) or other delivery partners, such as research institutions, where funds are not earmarked for a particular country/region and work may benefit a wide range of developing countries
- ‘Developing Countries Unspecified’ accounted for 65.9% of UK bilateral ODA was spent on activities to address the COVID-19 pandemic
Figure 11: Breakdown of UK 2020 non-region-specific bilateral ODA
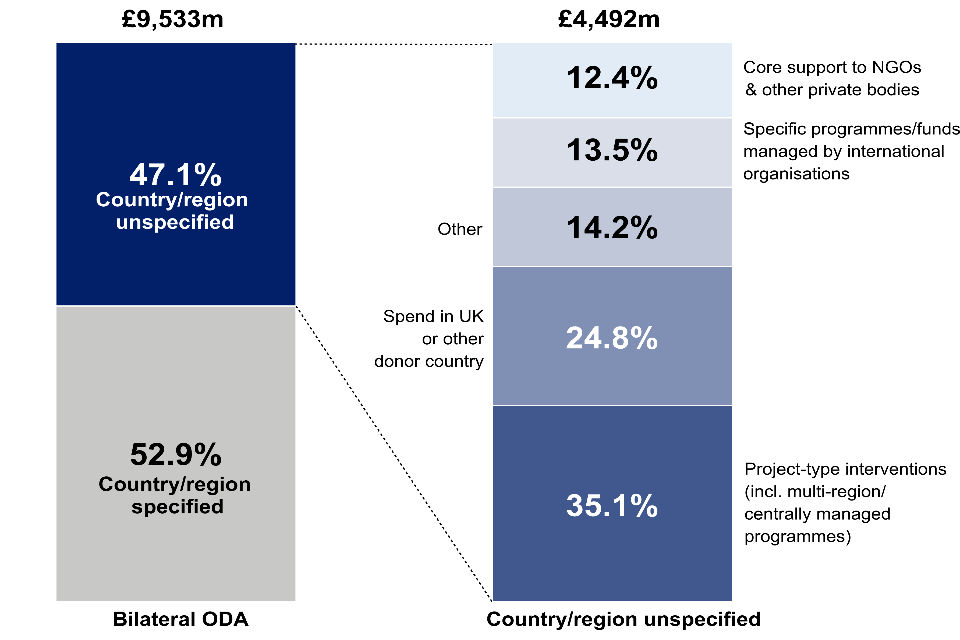
Figure 11 legend: Breakdown of UK non-region-specific bilateral ODA, 2020. Total bilateral ODA = £9.5 billion, of which £4.5 billion (47.1%) is spent in unspecified countries/regions. “Other” includes basket funds/pooled funding, other technical assistance, and debt relief (B04, D02, F01). “Spend in UK or other donor country” includes donor country personnel, scholarships/training in donor country, admin costs not included elsewhere, development awareness and refugees/asylum seekers in donor countries (D01, E01, G01, H01, H02).
5.2. Sector Breakdown of Bilateral ODA Spend
5.2.1. Bilateral ODA spend by sector in 2020
UK ODA is classified into sectors according to its purpose, e.g. the social, economic or humanitarian assistance area it aims to support. There are multiple levels of sector classification used: at the lowest level are sector codes[footnote 19]. that describe specific areas; these are then grouped together into OECD DAC broad sectors. These broad sectors can then be further grouped into major sectors, bringing together related themes to help simplify the key messages. See Annex 1 for more information on what is included in each sector level.
Figure 12 provides an overview of bilateral ODA by major sector in 2020 and shows that UK ODA is spent across a broad range of sectors. A more detailed breakdown of the broad sectors is given in Additional Table A7. The 5 largest sectors for bilateral spend in 2020 were:
1. Health - £1,590 million (16.7% of total UK bilateral ODA). Health was the largest sector of bilateral ODA spend in 2020 (Figure 12). It was the top spend area in 2018 and came second to Humanitarian Aid in 2017 and 2019. Within Health, the top 3 spending areas in 2020 were Medical Research (£373 million), COVID-19 control (£317 million)[footnote 20] and infectious disease control (£169 million). The largest recipient of ‘COVID-19 control’ ODA was ‘Developing Countries Unspecified’ (£258 million), reflecting activities spanning multiple countries and regions. The Health sector has seen the second largest increase (after debt relief) in UK bilateral ODA in 2020 compared to 2019: £164 million more than in 2019.
2. Humanitarian Aid - £1,531 million (16.1%). This sector remained at very similar levels to 2019 (0.3% decrease), after a £237 million increase between 2018 and 2019.
Impact of COVID-19 on sector trends
In 2020, £1.66 billion of UK ODA was directed to support the control of the COVID-19 pandemic and the response to its socio-economic impacts in developing countries.
The majority of the UK’s response to COVID-19 focused on the health impact. Whilst some of this ODA spend has been categorised under the health sector, if the activity was in direct response to a humanitarian appeal then it has been captured under the humanitarian sector. For example, COVID-19 activities in direct response to the United Nations Coordinated Appeal. This is in line with the OECD DAC reporting directives (pg 118).
Due to way in which the UK’s COVID-19 ODA activity and sector code breakdowns are calculated, it is not possible to calculate a COVID-19 sector code breakdown. For more detail on how the sector code breakdown more generally is calculated please see our explanatory note on Multiple Sector Codes and for more detail on how our COVID-19 figures are calculated please see background note 7.6.
3. Multisector/Cross-Cutting - £1,112 million (11.7%). Within this major sector the top 3 spending areas were research/scientific institutions (£327 million), multisector aid (£310 million) and multisector education/training (£138 million). Spend may be assigned to Multisector Aid in cases where contributions are split across a diverse group of sectors, such as Gift Aid donations to a range of NGOs.
The largest recipient of Multisector/Cross cutting ODA was ‘Developing Countries Unspecified’ (£628 million). This reflects activities that span a range of sectors, and also tend to span multiple countries. An example of this would be research and environmental policy that benefits more than one developing country.
4. Government and Civil Society – £1,042 million (10.9%). The top 3 spending sectors in this area were ‘public sector policy and administrative management’ (£186 million), ‘civilian peace-building, conflict prevention and resolution’ (£165 million) and ‘media and free flow of information’ (£108 million). Compared to 2019, Government and Civil Society had a decreased spend of £259 million (19.9%) in 2020, with the majority of this reduction coming from former DFID (£111 million) and CSSF (£105 million).
5. Economic Infrastructure and Services - £934 million (9.8%). This sector saw a decrease of £427 million ODA (31.4%) reported in 2020 compared to 2019, partly resulting from a smaller capital injection from the CDC (the UK’s development bank). This sector saw the largest decrease in ODA from 2019. Within this sector, the majority of spend in 2020 was on Financial Policy and Administrative Management (£491 million).
Figure 12: Bilateral ODA by major sector, 2019 and 2020
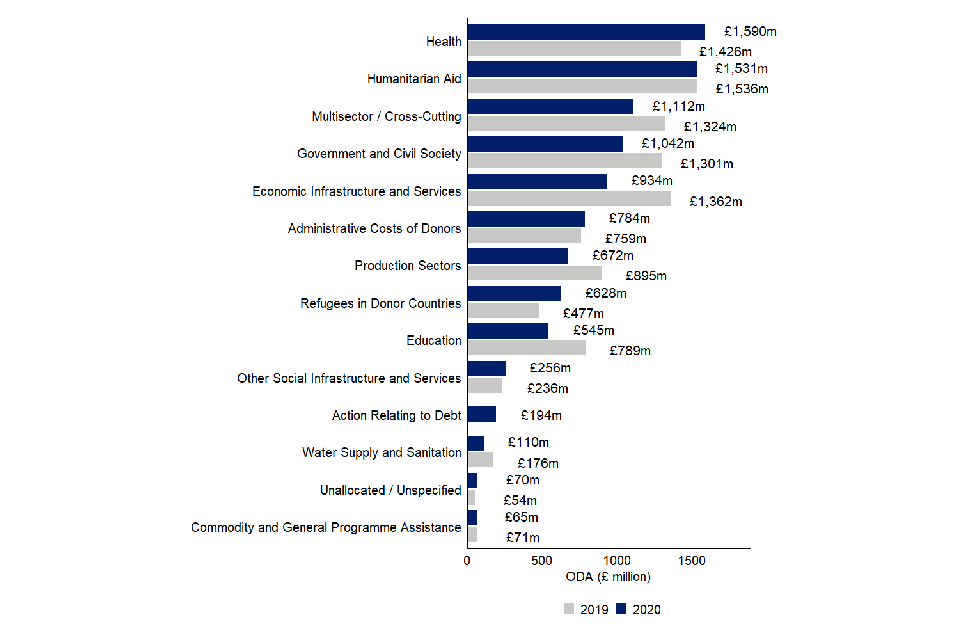
Figure 12 legend: Major Sector Spend – comparison between 2019 and 2020 bilateral ODA (£ millions). Major sectors are ordered from top to bottom by largest 2020 ODA spend. 2020 spend coloured in dark blue, 2019 spend in grey.
The percentage share of total bilateral ODA of the 5 largest sectors in 2020 was 65.1%, a slight decrease from 2019 (66.8%). Outside of the top 5 sectors by bilateral spend, the largest changes between 2019 and 2020 were debt relief (increased by £194 million, largest bilateral debt relief spend since 2008), support for asylum seekers in the UK[footnote 21]. – known as ‘Refugees in Donor Countries’ (increased by £150m) and education (decreased by £244m).
5.2.2. Broad Sector Breakdown of Bilateral ODA Spend by Government Department and other contributors of UK ODA
Figure 13 provides a breakdown of sector spend by FCDO (former DFID, former FCO) and all Other Government Departments and other contributors of ODA (non-FCDO).
-
for FCDO, the sector spend profile reflects greater spend in the social and disaster response sectors, such as Humanitarian Aid (£1,524m) and Health (£1,220 million). FCDO also contributed £777 million to ‘Economic Infrastructure and Services’[footnote 22].
-
non-FCDO spend is on a smaller scale and accounted for the total spend on ‘Refugees in Donor Countries’ (£628 million) which consists of ODA eligible support for refugees in their first year of stay in the UK (for example food and shelter) and was the largest non-FCDO ODA sector in 2020. The next largest sector spend was in ‘Multisector/ Cross Cutting’ (£568 million)
Figure 13: Bilateral ODA by Government Department and Major Sector, 2020
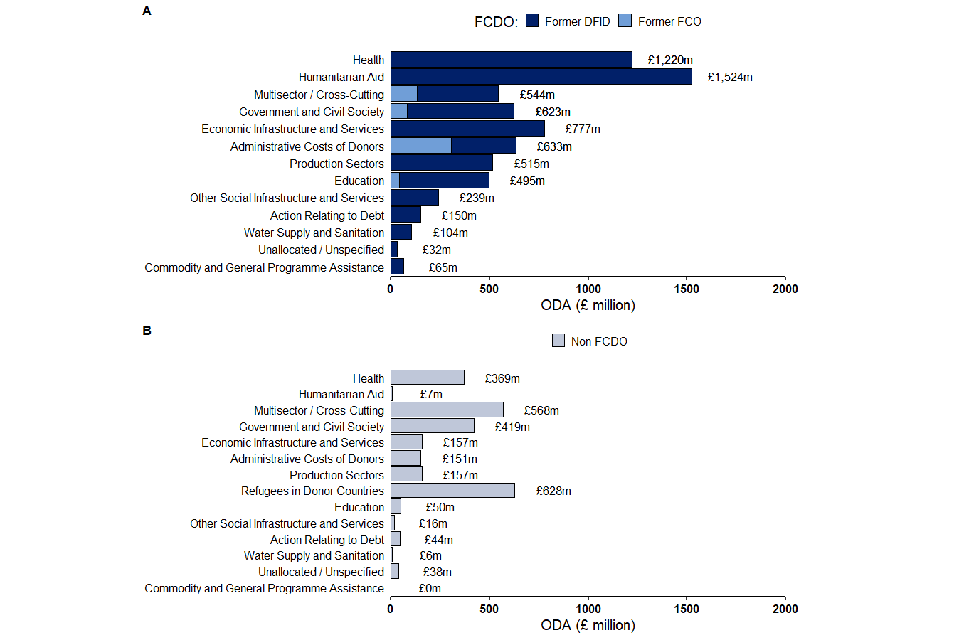
Figure 13 legend: A) FCDO (Former DFID - dark blue and Former FCO - light blue) and B) Other Government Departments’ and Other Contributors of ODA (non-FCDO - grey) spend by sector, 2020 (£ million). Major sectors are ordered from top to bottom by largest 2020 ODA spend.
5.2.3. Sector Breakdown of Bilateral ODA Spend by top 10 recipients of UK bilateral ODA
Figure 14 provides an overview of the highest spending sector for each of the top 10 recipient countries of UK bilateral ODA in 2020. The size of the circles indicates the amount of ODA spent on that sector in that country relative to the other sectors and other countries.
Figure 14: Bilateral ODA by largest Major Sector for the top 10 country-specific ODA recipients, 2020
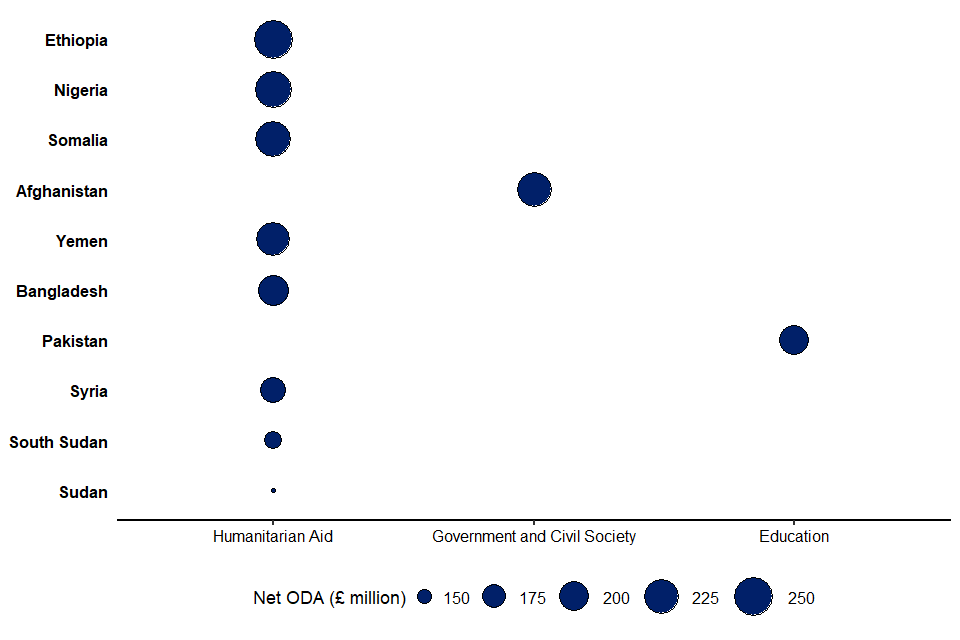
Figure 14 legend: Top 10 recipients of UK country-specific bilateral ODA 2020 and largest sector spend (£ millions). The size of the circles corresponds to the total amount of ODA spent in each country sector.
- the sector Humanitarian Aid received the largest amount of UK ODA in 8 of the top 10 recipient countries in 2020, consistent with 2019
- despite Health accounting for the largest sector spend in 2020, it does not appear in the largest major sectors of the top 10 recipient countries (Figure 14) because a large proportion (62.9%) of it was reported as ‘developing country, unspecified’ or to a specific region
- in Ethiopia, Humanitarian Aid has consistently been the largest sector spend since 2017, in response to drought affected areas, giving access to food assistance and other immediate relief
- in Nigeria, Health was the largest sector in 2016 and 2017, however from 2018 onwards Humanitarian Aid became the top spending sector. This was partly due to an increase in emergency response ODA as a response to conflict, in the form of material relief assistance and services (such as shelter, water, sanitation, health services)
- Somalia remained a top 10 recipient of UK bilateral ODA in 2020 after entering in 2016. UK bilateral ODA to Somalia has steadily increased over the last 10 years, with a particularly sharp increase of £146 million of Humanitarian Aid spending in 2017. Since then, Humanitarian Aid has been the largest sector
- Sudan became a top 10 recipient of UK bilateral ODA in 2020 with the sectors experiencing the largest increases from 2019 being government and civil society, and social infrastructure and services. Despite this, and like most of the other top 10 countries, Humanitarian Aid was the top recipient sector in 2020
Figure 15: Bilateral ODA by Income Group for the Major Sectors, 2020
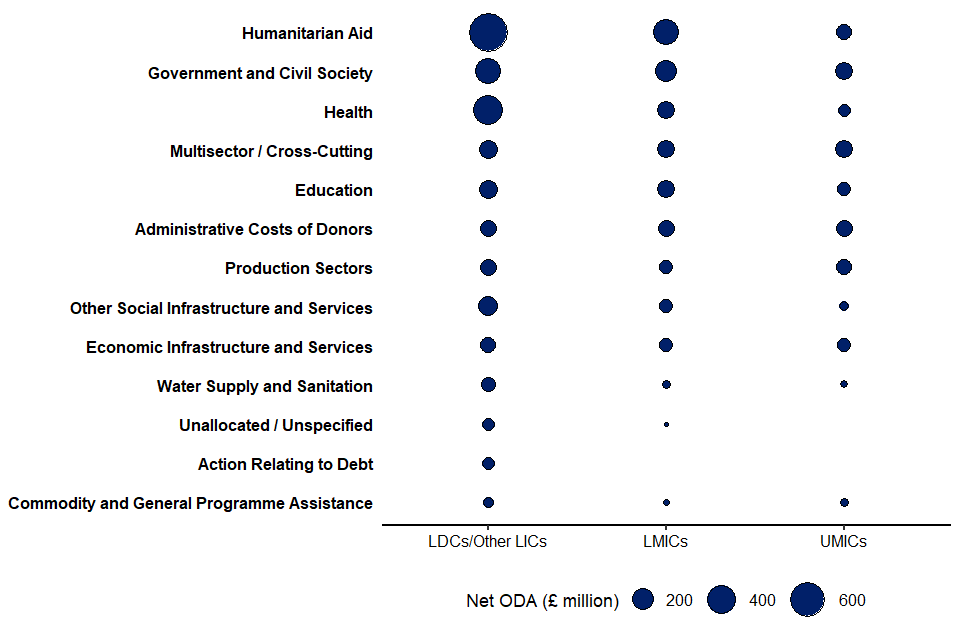
Figure 15 legend: Comparison of sector spend for 2020 UK bilateral ODA between countries of different income groups (£ million). The size of the circles corresponds to the total amount of ODA spent in each income groups sector.
Figure 15 summarises the differences in the main sectors of 2020 UK bilateral ODA spend between countries of different income groups. Least Developed Countries (LDCs/Other LICs) received more Humanitarian Aid (£790m, 33.0% of total bilateral ODA to LDCs/Other LICs) and Health support (£428 million, 17.9% of total bilateral ODA to LDCs/Other LICs), whereas spend and share in these sectors was much lower for Middle Income Countries (Upper and Lower) (£391 million and 21.3% of total bilateral ODA to MICs for Humanitarian Aid, £162m and 8.8% of total bilateral ODA to MICs for Health). Although Humanitarian Aid was the top sector for MICs in 2020, more ODA was spent on ‘Government and Civil Society’ (£310 million, 16.8% of total bilateral ODA to MICs) and ‘Multisector/Cross-Cutting’ sectors (£242 million, 13.1% of total bilateral ODA to MICs) than in LDCs/Other LICs, and there is generally a more even ODA split across the sectors.
5.3. Multilateral Funding
5.3.1. UK Multilateral Funding by Organisation
Multilateral organisations[footnote 23] are an essential part of the international system for humanitarian and development ODA. The UK works with a wide range of organisations, for example to: respond to humanitarian need; develop infrastructure; support economic growth; or ensure that particular diseases are tackled in line with the best available evidence. Multilateral organisations offer economies of scale in their operations and expertise, and often have the mandate and legitimacy to work in politically sensitive situations. Accordingly, they enable individual donor governments, such as the UK, to support development and humanitarian work in a wider range of countries.
For example, the World Bank Group (‘Bank’) International Development Association (IDA), aims to reduce poverty and boost shared prosperity by providing concessional loans and grants to 74 of the poorest and least credit worthy counties.
Table 3 shows the 20 multilateral organisations that received the most core funding (referred to as “Multilateral ODA” from the UK in 2019 and 2020
- the amount of UK ODA to the top 5 multilaterals represented 68.0% of total multilateral ODA in 2020
- the EU remains the recipient of the largest core contribution from the UK. The UK’s share of the EU ODA budget in 2020 was £1,149 million compared to £983 million in 2019. EU attribution fluctuates from year to year because the EU works on a 7 year programming cycle and so EU disbursements in any given year can vary. In addition to the normal fluctuations, the increase in 2020 was driven by COVID-19 response activities
- Gavi, the Vaccine Alliance (Gavi) received £200 million from FCDO in 2020. This funding supported Gavi to restore immunisation services affected by the pandemic, and to strengthen health systems to increase their resilience to COVID-19 and future disease outbreaks
- four of the top 5 receiving organisations of UK multilateral ODA in 2020 were among the top 5 multilaterals in 2019. The Green Climate Fund is now in the top 5 recipients of UK multilateral ODA. With contributions from both FCDO and BEIS totalling £450 million, the Green Climate Fund will finance programmes in a range of developing countries, including the poorest and most vulnerable. It will also leverage private finance in support of low-carbon, climate resilient development
Table 3: Top Twenty Recipients of UK Core Funding to Multilateral Organisations (Multilateral ODA) 2019 and 2020 [footnote 24]
5.3.2. UK Multilateral Funding by Extending Agency
Table 4 shows UK multilateral ODA in 2016, 2019 and 2020 by government agency and delivery channel i.e. bilateral through multilateral ODA (earmarked funding) and core contributions to multilateral organisations (un-earmarked funding).
Core contributions to multilateral organisations:
- FCDO provided the majority of the UK’s core multilateral ODA, accounting for 75.7% (£3,742 million), a decrease on 2019 when FCDO accounted for 85.5% (£4,080m). This decrease in FCDO’s percentage share can be accounted for by an increase in core contributions from non-FCDO actors including IMF-PRGT (£255 million), BEIS (increase of £210 million) and the non-DFID element of the UK’s EU Attribution (£119 million)
- BEIS was the largest non-DFID department to provide core multilateral ODA in 2020, accounting for 4.3% (£210 million), this includes their core contribution to the Green Climate Fund (£200 million)
- over the last 5 years, the share of UK core funding to multilateral organisations from non-FCDO contributors has fallen from 27.2% (£1,316 million) in 2016 to 24.3% (£1,204 million) in 2020
- non-FCDO contributors share in 2020 increased by 9.8 percentage points increase on 2019, due largely to contributions to the Green Climate Fund and IMF-PRGT
A full breakdown of UK ODA by Government Department and Other Contributors of UK ODA and delivery channel in 2016, 2019 and 2020 is available online in Table 10.
Table 4: Multilateral funding, by Government Departments and other contributors, 2016, 2019 and 2020 [footnote 25]
5.3.3. Multilateral Core Funding and Imputed Multilateral Shares
When FCDO or other UK government departments provide core funding to multilateral organisations, the funding is pooled with other donors’ funding and disbursed as part of the core budget of the multilaterals. It is therefore not possible to directly track the use of UK core multilateral funding. However, to provide an indication of the destination and sector of UK multilateral ODA, overall percentages of ODA disbursements by the relevant multilateral organisations are used to impute a UK estimate.
The UK uses data on ODA spend by sector and country/region which is reported by each multilateral organisation to the OECD DAC to estimate what percentage of FCDO and UK core contributions are spent in each country and sector. Where a multilateral organisation does not report to the DAC but the multilateral is only mandated to work in a particular country, region or sector, we allocate all of its core contributions to the relevant country, region or sector. If a multilateral organisation does not report to the DAC but works in multiple sectors and/or countries, then its core contributions are not allocated to a country or sector.
The DAC publish detailed information of the multilaterals’ country and sector spending in December. Because of this timing the latest estimates that are available are for 2019. These shares should be taken as indicative estimates rather than exact amounts of funding, and they are dependent upon multilateral organisations returning disbursement data to the DAC.
When the 2019 figures were published, the methodology was updated and minor improvements were implemented. For information on these improvements, please see the explanatory note.
The estimates for 2019 can be found in our published Table A9 and A10.
6. Comparisons between the UK and other International Donors
Key Definitions
Figures are based on provisional[footnote 26] 2020 ODA data from all 29 Development Assistance Committee (DAC) member countries[footnote 27] except the UK, for which final 2020 ODA data issued.
Prices in nominal terms[footnote 28]: this represents ODA in the monetary value disbursed during year. It does not account for inflation and exchange rates. In most cases, nominal prices have been converted from US dollars (as published by the OECD) to pounds sterling. ODA totals between years will be affected by inflation and exchange rate fluctuations and therefore are not directly comparable.
Prices in real terms[footnote 29]: this represents how much money was disbursed each year, accounting for inflation and exchange rates. These figures provide a guide to actual purchasing power – they are adjusted from the original value so that $1 in a single year would buy the same amount of goods as $1 in every other year. Real term figures are presented as US dollars to remove exchange rate fluctuations. This means that ODA spending in different years are directly comparable. The figures included are fixed at 2019 prices.
6.1.1. ODA Flows and ODA:GNI Ratios by DAC donors
Figure 16: Total ODA from DAC donors, 2000 to 2020
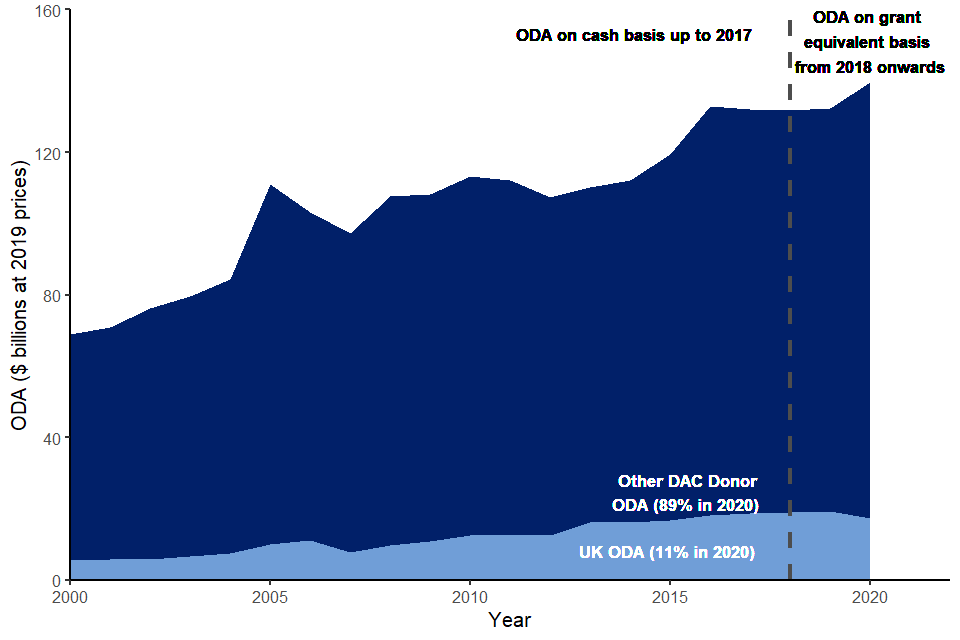
Figure 16 legend: Comparing the UK ODA (billion $) spend with other DAC donor countries for 2000 to 2020. The UK spend is highlighted in turquoise with the other donors in dark blue. This chart uses provisional 2020 spend for other DAC donors. ODA figures are in US dollars at 2019 prices to allow comparison between years.
In general, total ODA provided by DAC country donors has risen over the last decade, as shown in Figure 16. Net ODA is now more than double the amount it was in 2000 in real terms. On average, ODA has increased by about 4% a year in real terms. The average increase in nominal terms is larger, at 6%, as would be expected owing to inflation. However, this masks considerable variation over the years as ODA has been affected by changing global needs (such as the increase in refugees in Europe and the pandemic, which have often boosted ODA, at least in the short term) and macroeconomic affects (such as the financial crisis in 2011 and 2012)[footnote 30].
Total ODA from DAC country donors in 2020 was £125.7 billion (grant-equivalent measure[footnote 31]). This represents relatively large increases from £118.9 billion in 2019 and £115.1 billion in 2018 in nominal terms. In real terms, the increase was more modest, up 3.5% from $152 billion in 2019 to approximately $157 billion in 2020 (in 2019 prices).
Total ODA from DAC country donors in 2020 is the highest level on record. The OECD has noted 2 drivers for the increase from 2019: the DAC members’ contribution to the global response to and recovery from the pandemic, and a more general increase in bilateral sovereign lending by some DAC members[footnote 32].
Over the last decade, total ODA from DAC members has risen by $32 billion, just over a quarter of the 2011 total, in real terms. The UK’s contribution to this rose from about 10.2% in 2011 to a peak of 12.8% in 2019 before falling to 11.1% in 2020.
As demonstrated in Figure 17, the UK remained the third largest DAC donor in 2020 at £14.5 billion, behind the United States (£27.7 billion) and Germany (£22.1 billion).
Figure 17: Provisional ODA from DAC donors, 2020
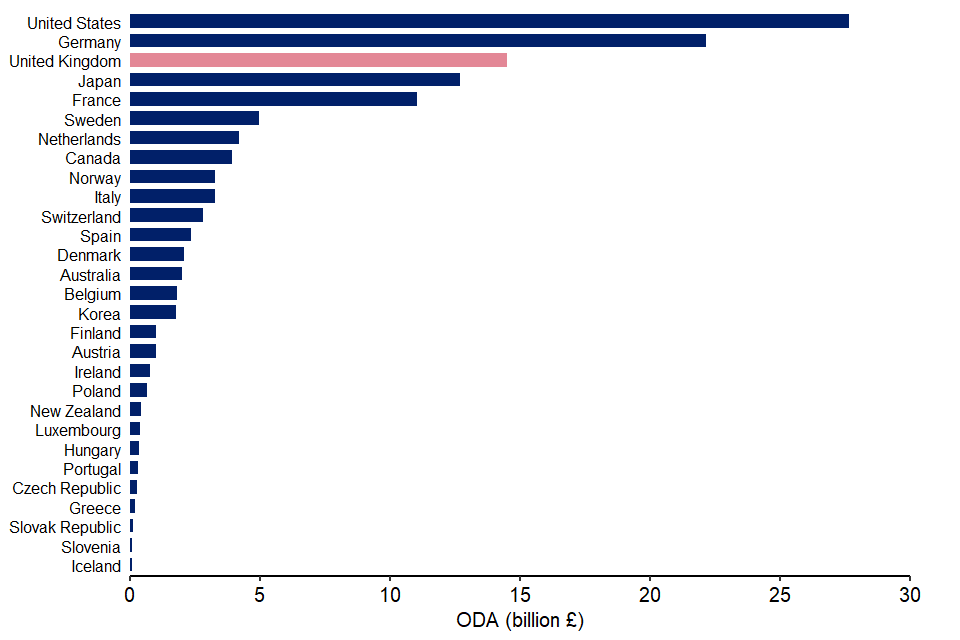
Figure 17 legend: Comparing the UK ODA (billion £) spend with other DAC donor countries in 2020. The UK spend is highlighted in pink with the other donors in dark blue. Note that provisional 2020 spend from other DAC donors is used in this chart.
Figure 18 shows ODA spend as a proportion of gross national income (GNI) in 2020. It highlights that although the United States spent the greatest volume of ODA of any DAC donor (£27.7 billion), this represented a smaller share of its national income when compared with most other donors (0.17% of its GNI, in comparison with a DAC-wide ratio of 0.32%).
Sweden and Norway each provide considerably less ODA than the United States in 2020, at £4.9 billion and £3.3 billion respectively, but in both cases, this equated to over 1% of their national income on ODA. Sweden’s ODA:GNI ratio was 1.14% and Norway’s was 1.11%. Luxembourg had the third highest ODA:GNI ratio at 1.02%.
Along with Sweden, Norway and Luxembourg, only Denmark (0.73%), Germany (also 0.73%) and the UK (0.70%) meet or exceeded the UN’s target of an ODA:GNI ratio of 0.7%.
Figure 18: DAC donors’ provisional ODA:GNI ratio, 2019 and 2020[footnote 33].
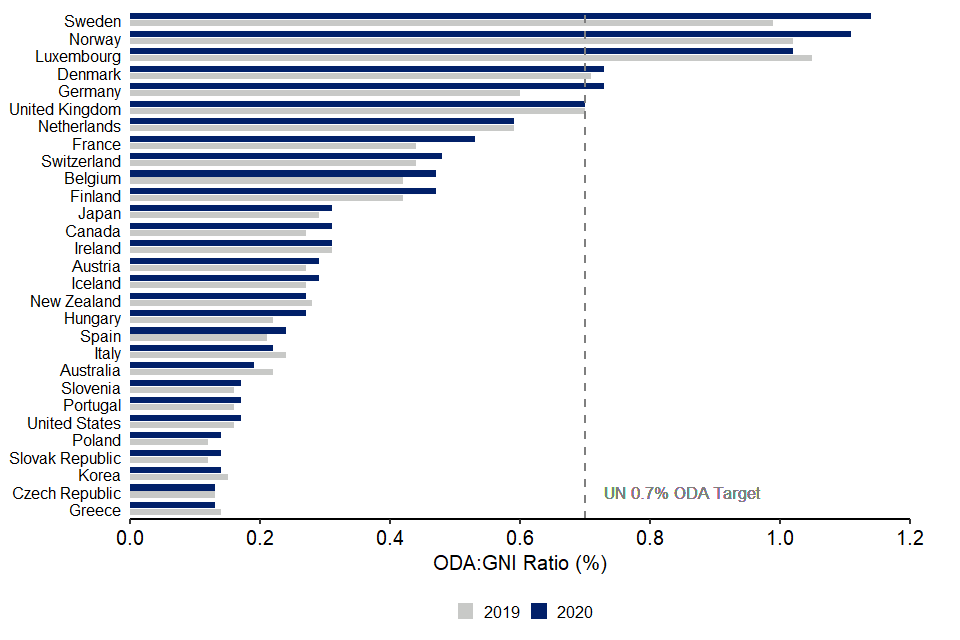
Figure 18 legend: ODA spend in terms of GNI comparing 2019 and 2020 spend for each DAC donor country (ODA:GNI ratio). In dark blue is the 2020 ODA:GNI ratio and in grey is 2019 ratio. The vertical dashed line indicates the 0.7% ODA:GNI UN target. Note that provisional 2020 spend from other DAC donors is used in this chart.
2020 marked the first year since 2016 that Germany met or exceeded the 0.7% target. The other 5 countries mentioned above meet or exceeded target in 2018 and 2019 as well as 2020.
As a combined total, DAC members provided 0.32% of GNI as ODA. This was up slightly from 0.30% in 2019.
6.1.2. ODA Flows by Recipient Countries
The data used for ODA flows by recipient countries is for 2019. For comparability, UK ODA data by recipient countries is also for 2019.
Figure 19 shows the top 15 recipient countries of total ODA from the DAC donor countries in 2019 and the UK’s share of ODA in these recipient countries. It shows:
- thirteen of 15 top recipient countries in 2019 were also in the top 15 in 2018. Myanmar and Somalia entered the list pushing out Pakistan and Tanzania. Despite this, Pakistan remained the largest recipient of UK ODA and Tanzania was 13th on the UK list
- the UK accounted for roughly a quarter of total DAC ODA for Nigeria in 2019 (the UK provided £257 million) and over a fifth of total DAC member ODA going to South Sudan and Yemen (the UK provided £207 million and £260 million respectively). At the other end of the scale, the UK contributed a relatively small proportion of total DAC ODA to Indonesia (4% with £33 million from the UK), India (5% at £108 million) and Iraq (6% at £77 million)
- receiving £2.4 billion in 2019, Afghanistan remains the largest recipient of DAC country donor’s ODA. The UK contributed £290 million (12% of the DAC total) of this. Afghanistan was the third highest recipient of UK ODA in 2019
Figure 19 legend: Top 15 recipient countries of total ODA from the DAC donor countries in 2019 and the UK’s share of ODA in these recipient countries (orange) compared to other DAC countries ODA share (blue).
7. Background Notes
7.1. Definitions and Sources
1. Information on the main definitions and sources used in this publication can be found in Annexes 2 and 3 respectively of the Statistics on International Development publication.
2. UK ODA spend figures for this publication are derived from:
-
former DFID’s ‘ARIES’ database of financial transactions relating to payments and receipts, which is quality assured centrally to ensure that data is complete, coding is correct and spend is in line with OECD definitions of ODA. Former FCO’s data is collected in a similar manner from financial transactions data and quality assured by a dedicated team. These 2 administrative sources comprise 73.7% of total UK ODA in 2020
-
non-FCDO sources are largely derived from financial transaction data. ODA contributors also assess whether the spend is in line with the OECD definitions of ODA. A small proportion of non-DFID spend is estimated, for example Gift Aid on ODA eligible activity. These non-FCDO sources account for around 26.3% in 2020
7.2. Scope
3. This publication presents information on the UK’s Official Development Assistance (ODA) spend in calendar year 2020. Comparisons are made to calendar year 2019. It includes data from UK government departments as well as the Devolved Administrations of the UK and other sources of UK ODA such the portion of the UK’s contribution to the EU that is spent on ODA and the ODA eligible proportion of Gift Aid. Data relating to both Bilateral and Multilateral ODA are included in the scope of this publication.
This publication does not include information on:
- private spending or donations made in support of developing countries, for example by the public, the voluntary sector or through remittances, are not part of the ODA definition and not covered in this publication
- financial year ODA budget allocations, which are set by HM Treasury. Users are advised to use caution when making comparisons between the calendar year figures reported in SID with financial year ODA budget allocations
7.3. ODA spending and reporting
4. In a calendar year, FCDO and HM Treasury will monitor spend by other departments and funds, and movements in GNI during the year[footnote 34]. The UK commitment to spend 0.7% of Gross National Income (GNI) on ODA is reported the year following the spend based on confirmed ODA outturn, and GNI estimates published by the Office for National Statistics.
5. While FCDO will manage its own spending on ODA, FCDO has no control over GNI nor the spending by other government departments and other sources of ODA. After final decisions on UK ODA spending are made the GNI estimate can still shift due to later economic data for the year becoming available, so can the amount of ODA spent by other government departments and ODA contributions from non-departmental sources.
6. Between the spring and the autumn, the previous year’s ODA spending of government departments are finalised. Government departments other than FCDO will provide project-level details that allow the ODA spend to be quality assured by FCDO statisticians. The ONS will release further updates of GNI throughout the year. The final ODA data and the latest GNI estimate are then used to calculate the final ODA:GNI ratio in the autumn publication.
7. FCDO is responsible for collating data and reporting spend on ODA to the Organisation of Economic Development and Co-operation (OECD), including the ODA:GNI ratio.
Difference between Provisional and Final publications
8. The “Statistics on International Development: Provisional Aid Spend 2020” publication outlines provisional ODA spend information and an estimate of GNI for 2020 published by ONS in March to calculate a provisional estimate of the ODA:GNI ratio. Between the spring and the autumn, the ODA spending of government departments and other ODA contributors are finalised.
9. As part of this, other government departments will provide project-level data which will have codes that allocate for each project: sectors, delivery partner, type of aid and other key variables. A project title and description are also provided. These extra details allow the ODA spend to be quality assured using guidance from OECD.
10. The final ODA data and an updated GNI estimate for 2020 released by the ONS in June have been used to calculate the final ODA:GNI ratio in this publication and to report to the OECD. Further information on the data sources, quality and processing of the statistics in this publication are found in Annexes 1-3 on the Statistics on International Development webpage.
ODA:GNI ratio
11. As mentioned above, the ODA:GNI ratio is based on confirmed ODA spend and estimates of GNI published by the Office for National Statistics (ONS). The ONS produce estimates for Gross National Income (GNI) on a quarterly basis. The ONS publishes revisions to GNI estimates as more economic data becomes available. The 2020 final ODA:GNI ratio is based on a GNI estimate published by the ONS on 30 June 2020.
12. In the Blue Book 2019, the ONS implemented a major new methodology framework for GDP, which in turn had a sizable impact on GNI. For the 2019 ODA:GNI ratio, the GNI estimate is based on the pre-Blue Book 2019
13. FCDO moved to the new framework at the start of 2020. For more information please see the explanatory note that was published in September 2019.
EU Attribution
14. The finalised estimate for the UK’s share of the EU ODA budget in 2020 was £1,149 million compared to £983 million in 2019. EU attribution fluctuates from year to year because the EU works on a 7 year programming cycle and so EU disbursements in a given year can vary. Other reasons for fluctuations between years include the change in UK’s share of the EU budget in comparison to other member states and exchange rate variations. In addition to the normal fluctuations, the increase in 2020 was driven by COVID response activities. The estimate in 2019 and 2020 is based on published data from the European Commission on the UK’s share of development expenditure.
15. To avoid double counting, Table 3 reports £27.5 million of the EU attribution figure for the UK’s contribution to EU peacekeeping under the CSSF, as the fund responsible for this spending. This does not affect the overall EU attribution figure.
16. Under the Withdrawal Agreement, the UK committed to meet outstanding commitments from the 2014-2020 EU budget beyond 1 January 2021 including for external action, development and humanitarian aid. This means a declining tail of ODA contributions until 2027 which is part of the wider financial settlement in the Withdrawal Agreement.
17. From 2022 reporting (on 2021 ODA), the full UK attribution of the EU ODA budget will be reported under FCDO. This is in line with UK ODA allocations.
Grant Equivalent
18. From 2018 onwards, Official Development Assistance (ODA) has changed from being measured on a cash basis to a grant equivalent basis, following a decision taken by the DAC in 2014. This change in measure affects official loans to sovereign states and development multilaterals. See our technical note for more information.
19. The headline grant equivalent measure of UK ODA for 2020 was £14,479 million, compared to £15,013 million on the cash basis measurement (a difference of 3.6%).
20. The majority of the difference is due to the UK’s multilateral loan disbursement to the IMF-Poverty Reduction and Growth Trust (IMF-PRGT). In 2020 IMF-PRGT used £255 million ODA under the grant equivalent, (headline ODA measure for 2020) compared with £822 million ODA under the cash flow measure. The remaining difference is due to official loan reflows not being included under the grant equivalent measure.
Revisions and Changes to the Publication
Revisions
21. The revisions process is set out in FCDO’s Revisions Policy.
22. As announced in the Provisional SID 2020 (published April 2021), Statistics on International Development (SID): Final Aid Spend 2019 publication was updated in July 2021 alongside a revisions statement to take account of a set of revisions for 2017-2019 Official Development Assistance (ODA). These revisions were minor, and the trends reported in the SID: Final Aid Spend 2019 publication are unaffected.
23. The effect of these revisions reduced UK ODA by £13 million in 2019 and by £7 million in 2017 and 2018. The revised figure for total UK ODA in 2019 was £15,184 million; the ODA:GNI ratio continued to be 0.70% for all 3 years.
24. In addition to the revisions highlighted in the revisions statement and outlined above, a further set of revisions has now been made alongside this publication. These are reflected in the 2020 report, summary tables and data underlying SID. Again, these revisions are minor and do not affect any previously reported trends.
25. These revisions have removed several programmes from 2017, 2018 and 2019 which have been re-classified recently by BEIS as not ODA eligible. The revised ODA total for BEIS in 2017 is £764 million, in 2018 is £847 million and in 2019 is £953 million, a reduction of £1 million, £3 million, and £7 million respectively.
26. There have also been 2 revisions following data coding errors.
-
the first of these is a type of aid and programme description change for the BEIS programme GB-GOV-13-ICF-0004-CIF, from B02 to B03 in 2019. This means the revised UK ODA total for core contributions to multilateral organisations in 2019 is £4,772,317 thousand
-
the second revision is a sector code change to 2 former DFID programmes in 2019, 300395-102 and 300395-103, from 99810 to 43010
27. The revised figure for total UK ODA in 2019 is £15,176 million; the ODA:GNI ratio continues to be 0.70% for all 3 years.
Accessibility
28. An important part of our SID publications are the summary tables published as excel spreadsheets. These may contain data tables that are difficult to use with screen readers and keyboard-only navigation.
29. We aim to make all SID related spreadsheet documents we publish from now on (SID 2020 onwards) fully accessible.
30. On 30 June 2021 the Government Statistical Service (GSS) published guidance around releasing statistics in spreadsheets. This sets out best practice for accessibility in the statistics produced across Government, for example to enable access to statistics for visually impaired individuals using screen readers. As such, we have followed the guidance where possible and implemented accessibility measures to the summary tables published alongside this report (standard and additional), as well as providing alternative text where necessary to the case studies contained within this report (chapter 9).
31. We have looked at the resources needed to make SID Excel documents published between September 2018 and September 2021, accessible (in line with The Public Sector Bodies (Websites and Mobile Applications) Accessibility Regulations 2018). We believe that making these accessible would be a disproportionate burden. It is also important to note that SID tables published before SID 2020, are updated via the tables accompanying this publication due to revisions (as per para 22 to 29).
32. If you need any of the information published as part of the SID collections (SID 2020 or historical) in a different format please contact us on statistics@fcdo.gov.uk
Afghanistan
33. Due to the security situation in Afghanistan, all information surrounding channel of delivery, project title and project description has been temporarily removed in the data underlying SID. This includes ODA activities in which Afghanistan was the “recipient country” or regionally programmes in which Afghanistan was involved.
7.4. Future developments
34. An important part of National Statistics production is investigating whether a product continues to meet user needs. The ODA statistics team are currently reviewing the SID to identify areas to develop further, as well as testing how best to present and communicate ODA trends. So far, the SID has been peered reviewed by other statisticians. The team has also gathered information on the users of SID and their data needs via a short user feedback launched in April 2021. The team will also organise a vital user feedback seminar with Royal Statistical Society.
35. The team will analyse the feedback response in more detail over winter and will publish a report of the headline findings and a SID future development plan.
36. FCDO is defined as a multi-purpose agency by the OECD, as it carries out both ODA and non-ODA activities. FCDO statisticians are working to develop a suitable methodology that captures the ODA eligible proportion of FCDO administration costs. It will be implemented from ODA 2021 onwards. We will communicate the methodology via an explanatory note at the earliest opportunity.
7.5. Uses and users
37. The main purpose of this publication is to provide timely statistics of ODA expenditure by UK Official sources. They are published prior to the release of final ODA statistics by the OECD DAC for all OECD members.
38. Responses from our short user feedback survey in May 2021 show that our largest user groups include expert analysts/technical users, policy influencers and information foragers (see definitions of each persona). Our users use the SID primarily to find out which countries and sectors receive UK ODA, the bilateral/multilateral split of UK ODA and the amount of ODA spent by each government department.
39. We are always keen to enhance the value of these statistics and welcome your feedback either via our Statistics User Group or via email statistics@fcdo.gov.uk.
7.6. Data Quality
40. The DAC sets the definitions and classifications for reporting on ODA internationally. These are laid out in the DAC Statistical Reporting Directives[footnote 35]. The statistics shown here are reported in line with these directives and are subject to the quality assurance process as described in Annex 3 of Statistics on International Development.
41. The data in the publication is largely based on administrative data and so it is not subject to sampling error.
42. Calendar year financial transaction data are used to compile UK ODA spend statistics. These are extracted from DFID’s ARIES database, and the detailed data is subject to input errors from spending teams. The risk of input error is relatively low for estimates of total spend, and by country/region, and relatively higher for spending by sector (where there is sometimes ambiguity, especially for projects or programmes that cut across sectors) and by funding channel. The quality assurance Annex 3 describes the steps that have been taken by FCDO statisticians to minimise these kinds of input errors, and to produce UK ODA statistics.
43. Temporary sustenance for asylum seekers is ODA eligible for their first 12 months of stay, this includes basic health and education services. DHSC ODA includes support to asylum seekers for the provision of ODA eligible basic health services. For this publication the estimates have been produced by applying a 2020 Gross Domestic Product (GDP) deflator. In 2020, the UK deflators were unusually high due to the treatment of health and education non-market output. Therefore, in future years we may see a decrease in the unit cost used for this calculation.
44. The figure presented for the Welsh Government represents their estimated spend for the financial year 2020/21 and are used as a proxy for their calendar year 2020 spend.
Estimates on ODA spend in response to the Coronavirus (COVID-19) Pandemic
45. The activities captured in the COVID-19 ODA spend figure are designed to help counter the health, humanitarian and socio-economic impacts of the pandemic and to support equitable access to vaccines, treatments and tests. The OECD DAC has requested activity level COVID-19 ODA spend data from all donors. This will be published in their final statistics in late December.
46. The sources of this ODA spend data are as follows:
- former DFID: COVID-19 spend data was captured on the Aid Management Platform, which is the same source[footnote 36] of former DFID spend data on sectors and benefitting country. ODA activities can be tagged either as a COVID-19 activity or as not applicable. Some new ODA activities were designed specifically to address COVID-19 (COVID-19 specific), while some existing programmes were adapted to respond to the crisis (COVID-19 adapted). Former DFID accounted for 95% of UK bilateral ODA activities aiming to address the COVID-19 pandemic.
- former FCO: COVID-19 activities were carried out through the International Programme’s enabling fund, which provides small amounts of discretionary funding to posts /directorates within the FCO for small-scale activities. The Fund is designed to be agile, to allow posts to respond quickly to developing events[footnote 37]
- non FCDO: ODA contributors provided the amount of ODA focused on addressing the COVID-19 pandemic via the usual final data return
47. Please note that the COVID-19 ODA spend figure is an approximate estimate. As part of this publication, there is a COVID-19 ODA activity level dataset, these figures should also be treated as estimates.
48. Approximately half of former DFID’s COVID-19 data is based on activities designed specifically to address COVID-19 (COVID-19 specific). This information is of high quality and we are confident that all the activities focus on addressing the pandemic. The remaining COVID-19 spend is defined as adapted spend. For this spend an estimate has been given for the proportion of the activity’s budget that was focused on addressing COVID-19 for financial year 2020-21. These proportions have been applied to spend made between April to December 2020 for ODA activities identified as “COVID-19 adapted”.
49. The FCDO funds the UK’s Development Finance Institution – CDC – through capital injections. These capital injections are captured in the ODA statistics in the year they are provided, in line with the OECD DAC’s institutional approach[footnote 38]. The 2020 capital injection will not all be spent by CDC in the same calendar year. Therefore, it is not possible to know exactly how much of the 2020 capital injection will be disbursed to new CDC investment commitments made in 2020 to address the COVID-19 pandemic. The disbursement of funds to investment commitments can take multiple years. After discussing with the OECD DAC, the ODA statisticians decided to estimate the amount of ODA CDC has spent on COVID-19 activity by using a proxy COVID-19 co-efficient. The proxy has been calculated by taking total CDC COVID activity disbursements as a proportion of total disbursements in 2020 (49%).
50. In the provisional SID (published April 2021), we excluded ODA activities which result in a COVID-19 adapted programme spend under £1 million. This enabled FCDO statisticians to carry out further quality checks on former DFID’s COVID-19 adapted data over the summer.
51. The total UK COVID ODA figure - £1.66 billion does not include the UK’s core contributions to multilaterals, a proportion of which will have been channelled to address the COVID-19 pandemic. UK Imputed Multilateral Shares for 2020 will be published as usual in early 2022.
7.7. Timing and Releases
52. FCDO releases 2 editions of Statistics on International Development over the year:
-
provisional UK Aid spend will be published in the spring and includes a preliminary estimate of the UK’s ODA:GNI ratio for the previous calendar year. The latest edition of this publication can be found on gov.uk
-
final UK Aid spend is usually published in the autumn. This publication confirms the UK’s ODA:GNI ratio for the previous year, as well as including more detailed analysis of the UK’s Bilateral and Multilateral ODA, and includes the microdata used to produce the publication
7.8. Related statistics and publications
53. The OECD statistics provide ODA breakdowns for DAC donors (including multilaterals). This source is useful when carrying out international comparisons. Figures for DAC donor’s final 2020 ODA will be published in December.
54. The Development Tracker can be used to explore details of the individual development projects that the UK is funding. This allows you to filter projects by country and sector and view further details about the project as published in documents such as the business case and annual review. The tracker uses open data on development projects, compliant with the International Aid Transparency Initiative (IATI) standard, to show where funding by the UK Government and its partners is going and ‘trace’ it through the delivery chain.
7.9. National Statistics
55. The Office for Statistics Regulation (part of the United Kingdom Statistics Authority) designated these statistics as National Statistics in March 2016, in accordance with the Statistics and Registration Service Act 2007 and signifying compliance with the Code of Practice for Statistics. Designation means the statistics carry the National Statistics label and conform to the standards summarised below.
56. Office for Statistics Regulation published their finding from the compliance check of SID which confirmed that it is designated a National Statistics.
57. The Foreign, Commonwealth and Development Office is now responsible for producing the Statistics on International Development statistical series, the designation of National Statistics carries through to the new Department.
58. For information on the work of the UK Statistics Authority
National Statistics
7.10. Contact Details
For enquiries (non-media) about the information contained in this publication, or for more detailed information, please contact:
Alice Marshall
Telephone: 01355 84 36 51
E-mail: statistics@fcdo.gov.uk
Website:https://www.gov.uk/government/organisations/foreign-commonwealth-development-office/about/statistics
For media enquiries please contact the FCDO Press Office on +44 (0)20 7008 3100.
For further information on development issues and FCDO policies, please contact the Public Enquiry Point on 020 7008 5000.
8. Listing of main activities of UK Government Departments and other contributors of UK ODA other than FCDO in 2020
| Non-DFID Government Department or other contributor of UK ODA | Main ODA funded activity in 2020 |
|---|---|
| Department for Business, Energy and Industrial Strategy (BEIS) | The UK’s International Climate Finance (ICF) was established in 2011 to help developing countries tackle climate change and move to sustainable economic growth. It is the government’s primary instrument to deliver the UK’s share of the financial and technical assistance to developing countries required under the £100 billion per annum Climate Finance commitment in the Paris Agreement. ICF spending is split between FCDO (previously DFID), Defra and BEIS. BEIS has spent £2 billion between 2016/17 and 2020/21 primarily on large scale mitigation projects in the following thematic areas: making markets work; halting deforestation and accelerating decarbonisation. Each programme in the portfolio is designed to bring about catalytic change in developing countries. BEIS also manages the Newton Fund and Global Challenges Research Fund (GCRF). The Newton Fund supports bilateral and regional research and innovation partnerships between the UK and selected middle income countries. The aim of this is to address specific global development challenges and build science and innovation capacity. GCRF provides dedicated funding to research focused on addressing global challenges which most significantly impact upon developing countries. It achieves this by supporting challenge-led disciplinary and interdisciplinary research, strengthening capability for research and innovation within developing countries, and providing an agile response to emergencies. |
| Foreign and Commonwealth Office (FCO) | In 2020 the Foreign & Commonwealth Office (FCO) used ODA from its core departmental budget and the Joint Funds (Conflict, Stability and Security Fund, and Prosperity Fund) to support and deliver the strategic objectives of the government’s 2015 Aid Strategy and support delivery of the UN’s Sustainable Development Goals (SDGs). The FCO ODA programmes concentrated on the strategic objectives of promoting global prosperity, and strengthening global peace, security and governance. This section covers ODA spend from the FCO’s core budget. The Joint Funds are covered separately as a whole, regardless of which Government Department spends the money. The FCO spent ODA in 5 ways: 1. Frontline Diplomatic Activity. In line with DAC criteria, the FCO, as a multipurpose agency reports the costs related to diplomatic staff assigned wholly or partly to aid-related duties as ODA expenditure. The FCO also supports and enables the work of other Government Departments on our overseas platform. 2. Chevening scholarships and the International Leadership Programme. HMG is committed to building capacity through education, contributing to multiple SDGs. Chevening operates in about 157 ODA eligible countries and territories, and there are over 50,000 alumni around the world. 3. A portion of the subscription costs to certain international organisations, including the OSCE, Council of Europe, UN and Commonwealth. The eligible coefficient is determined by the DAC. 4. Grants to the BBC World Service, British Council, GB-China Centre, Wilton Park and Westminster Foundation for Democracy for their ODA eligible activities. 5. The International Programme supports the FCO’s wider diplomatic efforts and foreign policy in support of UK interests overseas. All our ODA eligible policy programmes are aligned with FCO Priority Outcomes, National Security Strategy objectives and the Aid Strategy Further information on ODA project/programme expenditure and ODA project/programme objectives for ex-FCO departmental policy programmes can be found on DevTracker and .gov.uk, in the FCDO’s Annual Report, Annual Human Rights report and (for work delivered on behalf of the Cross-Whitehall CSSF and Prosperity Funds) in the CSSF and Prosperity Fund Annual Reports. |
| Conflict, Stability and Security Fund (CSSF) | The Conflict, Stability and Security Fund (CSSF) enables a cross government, integrated response to address Government’s top national security priorities. Its ability to blend ODA and non-ODA is unique across HMG and amongst international donors. This ensures a comprehensive, integrated approach to delivery, drawing together military, development and diplomatic levers. CSSF’s main activities in 2020 were: tackling conflict and building stability overseas; improving capacity and accountability of security and justice actors; strengthening the rules-based international order and its institution, including women, peace and security; tackling serious and organised crime; preventing violent extremism. The CSSF supports and delivers programmes in over 70 countries including Afghanistan, Iraq, Syria, Pakistan and Lebanon. |
| EU Attribution (non-DFID) | This is the estimate for the non-DFID share of the EU ODA budget. EU attribution fluctuates from year to year because the EU works on a 7-year programming cycle and so EU disbursements in a given year can vary. Non-DFID EU contributions include ODA eligible spend in peace, security, democracy, human rights and civil society. |
| Home Office (HO) | In-donor spend on support to asylum seekers and the resettlement of vulnerable people. This is linked to support and shelter for up to 12 months. Work upstream in ODA countries to build capacity and capability in recipient countries in order to improve security, protect children and tackle modern slavery. |
| Department of Health and Social Care (DHSC) | DHSC’s main ODA activities are on the areas of global health, health security and global health research. The Global Health Security programme’s activities in these areas have helped developing countries to reduce preventable deaths and burden from disease; to detect health threats; and to provide rapid and effective response to health threats that emerge. Global health research activities funded innovative research in specific vaccine and vaccine technologies and informed best practice in disease outbreaks interventions and to reduce the threat of antimicrobial resistance. In addition, through the National Institute for Health Research (NIHR), the Global Health Research (GHR) portfolio has supported high-quality applied health research for the direct and primary benefit of people in low and middle-income countries (LMICs). The portfolio aims were delivered through a mix of researcher-led and commissioned calls delivered by NIHR and through partnerships with other global health research funders, through initiatives to develop and advance global health research and career pathways both in LMICs and in the UK. DHSC has also undertaken activities associated with tackling the 2019 Novel Coronavirus outbreak including contributing to the Strategic Preparedness and Response Plan (SPRP) – a one-off contribution of £5 million to the World Health Organization (WHO), earmarked for ODA-eligible countries only. |
| Cross-Government Prosperity Fund | The Prosperity Fund is an innovative cross-government fund, focused on Official Development Assistance (ODA) eligible middle-income countries and emerging economies. It supports the UK’s aim of promoting global prosperity, creating the broad-based and inclusive growth needed for poverty reduction, contributing to the UN Sustainable Development Goals. The Fund works across 5 key themes which are essential to its aim. These are: investment in infrastructure; human capital, innovation and technology; trade; financial and economic reform and ease of doing business. Major projects supported in 2020: 1. Working with 19 cities worldwide to address the urgent challenges of unplanned and overcrowded settlements, congestion and pollution, with a focus on improving transportation, urban planning and resilience, the Future Cities Programme had a spend of £22.7m. 2. Working to strengthen local health systems and improve the quality of care in Brazil, Malaysia, Mexico, Myanmar, the Philippines, South Africa, Thailand, and Vietnam the Global Health Programme had a spend of £19.4m. |
| Gift Aid | The portion of Gift Aid claimed by UK based international development charities that is then used on ODA eligible activities. To understand more about ODA eligible Gift Aid, please see methodology note. |
| Department for Environment, Food and Rural Affairs (DEFRA) | Main activities: 1. International Climate Finance (ICF): ICF enables the UK to meet its international commitments to support developing countries to protect the world’s most biodiverse forests; promote sustainable livelihoods through improved land use and low carbon agriculture; and contribute to global food security and resilience to climate change. 2. The Darwin Initiative: a global competitive grant scheme that funds projects in developing countries and our UK Overseas Territories to help them better manage their natural resources. 3. Illegal Wildlife Trade (IWT) Challenge Fund: a global competitive grant scheme that funds projects in developing countries to develop sustainable livelihoods for communities affected by illegal wildlife trade; strengthen law enforcement and the criminal justice system; and reduce demand for the products of the illegal wildlife trade. International Contributions to Multilateral Organisations and Environmental Agreements (MEAs) Covering subjects including sustainable use of natural resources, sustainable development, air quality, waste management, control of chemicals and food security. Major projects supported in 2020: 1. Global Environment Facility (£25 million): The GEF is a multilateral fund providing loans and grant funding to developing countries, tackling some of the world’s most pressing environmental problems related to climate change, biodiversity loss, land degradation, chemical pollution and international waters. For example, under GEF7 the Global Wildlife Programme will continue to tackle the supply and demand for illegally traded wildlife products across Africa and Asia. 2. Darwin (£8.8 million): In 2020 we supported 140 projects across 58 countries. We ran an additional round in 2020 to support urgent Covid-19 related projects. For example, one project is working to protect 2 internationally important protected areas in the Cambodian Lower Mekong Delta (CLMD) and enhance their connectivity to a healthier wetland landscape. The project promotes resilient sustainable livelihoods, restores wildlife habitat and establishes multiple-use zoning schemes in protected areas. 3. Illegal Wildlife Trade (£4.4m): In 2020 we supported 51 projects across 41 countries. For example, we funded a project that sought to address the low-risk environment that allows high-level criminal and corrupt actors to earn vast profits from illegal wildlife trade. This was achieved by enhancing capacity through training to investigate and prosecute wildlife traffickers through anti-money laundering legislation in Kenya, Tanzania, Mozambique and Zambia. |
| Export Credits Guarantee Department | UKEF is the operating name of the Export Credits Guarantee Department, the UK’s export credit agency. It helps UK exporters by providing insurance to them and guarantees to banks to share the risks involved in providing export finance. It also makes loans to overseas buyers of goods and services from the UK. If an overseas borrower defaults on a UKEF-guaranteed bank loan or if UKEF pays out on an insurance claim, it becomes the owner of the debt and will seek to make recoveries, taking account of UK government policy on debt forgiveness. In certain circumstances this debt is restructured or forgiven. In 2020 UKEF cancelled debt owed by Somalia. The debt cancellation followed Somalia reaching Decision Point under the Heavily Indebted Poor Countries Initiative and on 31 March 2020 receiving a Paris Club debt treatment. The terms of the debt treatment were implemented by UKEF via the UK/Somalia Debt Agreement No. 3 which came into effect on 21 December 2020. |
| HM Treasury (HMT) | HMT ODA relates to development-related administrative costs. |
| BBC World Service | BBC World Service contributes to the BBC’s international news mission by providing trusted, accurate, impartial and independent information and analysis to audiences around the globe. The BBC World Service aims through journalism to contribute to accountability and good governance and improve the welfare and economic development of citizens in developing countries. |
| Department for Work and Pensions (DWP) | DWP pays an annual core contribution to the International Labour Organisation (ILO). DWP spend also includes ODA-eligible benefits to refugees within the first twelve months of stay in the UK as part of the Vulnerable Persons Resettlement (VPR) programme. |
| Department for Education (DfE) | DfE’s ODA covers support of asylum seekers in the first 12 months after they make a claim for asylum in the UK. This support relates to the provision of publicly-funded education services for asylum seekers of compulsory school age. |
| Scottish Government | The Scottish Government, through its £10M pa International Development Fund, supports development work in its partner countries Malawi, Zambia, Rwanda and Pakistan, in pursuit of the Global Goals; in 2020, this included £2M in December 2020 to support these partner countries’ COVID-19 responses, including vaccine preparedness. A separate £1 million Humanitarian Emergency Fund also provides humanitarian funding to support crises as they occur, including during 2020 funding support: for crises in Ethiopia brought on by drought, floods, conflict and locust infestation, Lebanon in the aftermath of the explosion in Beirut, and Niger for the aftermath of severe flooding; and to the Disasters Emergency Committee appeal, to support an emergency response to the COVID-19 crisis, focused on vulnerable displaced communities and refugees. Finally, the Scottish Government’s Climate Justice Fund helps tackle the effects of climate change in the poorest, most vulnerable countries, with a £3 million budget, based on a simple and powerful message: the poor and vulnerable at home and overseas are the first to be affected by climate change, and will suffer the worst, yet have done little or nothing to cause the problem. |
| HM Revenue and Customs (HMRC) | HMRC supports low and middle-income countries revenue authorities to improve their tax administration functions and tax policies to increase revenue collection, providing economic integration, stability and growth. Provision of technical assistance in tax policy and administration issues to support the strengthening of tax systems in low and middle-income countries. Delivery of leadership and tax audit training to tax administration officials from low and middle-income countries. |
| Department for Digital, Culture, Media and Sport (DCMS) | DCMS’s Cultural Protection Fund (CPF) is a world-renowned partnership between DCMS and the British Council that delivers grant funding to local organisations working on cultural heritage protection in 12 conflict-affected countries in the MENA region and contributes towards key HMG stabilisation, security and development objectives. In 20/21 the CPF expanded to protect cultural heritage at risk from climate change and natural disasters in 15 countries, mainly in East Africa and the Indo Pacific, with projects delivered through the British Council, and a new partnership with the Arts and Humanities Research Council. |
| Other In-donor Refugee Costs | Education (for compulsory school age) and healthcare for asylum seekers based in Scotland, Wales and Northern Ireland. Only asylum seekers within the first 12 months after they make a claim for asylum in the UK are included. |
| Ministry of Defence (MoD) | MoD ODA spend includes training in human rights, rule of law, international humanitarian law, protection of civilians in conflict, maritime law, and the UK Hydrographic Office support to developing countries in maritime charting. |
| Department for International Trade (DIT) | DIT’s ODA included a pilot Investment Promotion Programme working with the Prosperity Fund Joint Unit, support for capability and compliance at headquarters, and promotion of prosperity objectives in African countries through DIT’s ODA funded Africa Uplift. Following the Spending Review 2020 settlement, DIT’s ODA work was de-prioritised. All ODA programming was stopped by March 2021. |
| Welsh Government | The Welsh Assembly supports the Wales for Africa programme, which aims to help deliver the Sustainable Development Goals. It also provides small grants to organisations based in Wales to promote development awareness. |
| Colonial Pensions administered by DFID | Pension payments made to ex-members of the UK Overseas Civil Service who were employed directly by developing country governments. |
| Office for National Statistics | ONS ODA is used to provide high-quality technical assistance, mainly through experts from the UK Office for National Statistics, to build the capacity of statistical systems in developing countries. We have key partnerships with national statistical offices globally, primarily in Africa. We set up an ONS and FCDO Data Science Hub to provide training and mentoring to build data science skills, and research into new uses of AI and big data for the SDGs. It enables the ONS SDG team to provide support to developing countries on SDG monitoring, through the provision of the open source tool OpenSDG and technical advice on inclusive data. |
9. Alternative text for one-pager factsheets
59. Main summary factsheet – page 6
This factsheet covers the key headlines of the Final SID 2020.
Box 1: Headlines
- the UK met the ODA target of providing 0.70% of the UK’s Gross National Income (GNI) in 2020
- 65.9% of the UK ODA was spent bilaterally (i.e. going to specific countries, regions or programmes)
- 34.1% of UK ODA was spent as core contributions to multilaterals
- in 2020, £1.66 billion of UK ODA was spent on activities to address the COVID-19 pandemic
Box 2: Total UK net ODA: by contributor
This box presents a line chart of total UK ODA by FCDO, Other Government Departments (OGDs) and Other Contributors of UK ODA from 2009 to 2020. The FCDO line starts at £7.5 billion in 2009 and ends at £10.7 billion in 2020. The FCDO line grows steadily over time with a dip in 2012 and 2020. The OGD line starts at £0.4 billion in 2009 and gradually increases over time to £2.8 billion in 2020. The Other Contributors of UK ODA line starts at £0.3 billion and slowly climbs to £1.1 billion, with a brief decrease in 2018 and 2019.
Box 3: Proportion of total UK net ODA: by contributor
This box contains a line chart for FCDO, OGDs, and Other Contributors of UK ODA. It shows that the FCDO share has fallen from 77.6% to 73.7%, OGD share of UK ODA has increased from 14.6% to 19.0% and Other’s share has stayed broadly the same, accounting for 7.9% in 2016 and 7.3% in 2020.
Box 4: Top 20 recipient countries: UK bilateral ODA, 2020
This box presents a bar chart of the top 20 recipient countries of UK bilateral ODA in 2020 from the largest – Ethiopia (£254 million) to the 20th – Jordan (£81 million). All the values in the bar chart are found in Table 6
Box 5: Top 5 sectors: proportion of UK bilateral ODA, 2020
This box presents a bar chart of the percentage share of the top 5 sectors - Health, Humanitarian, Multisector, Government & Civil Society and Economics & Infrastructure Services. All the values in the bar chart are found in Table 8.
Box 6: UK bilateral ODA by region, 2020
This box presents a bar chart of UK region-specific spend broken down by region – Africa (£2,610 million), Asia (£1,974 million), Americas (£272 million), Europe (£166 million) and Pacific (£19 million).
58. COVID factsheet: page 16
The infographic sets out some key background information, breakdowns and programme examples related to the amount of UK ODA that was spent on COVID-19 activities.
Box 1: Background
- COVID-19 was declared a global pandemic in March 2020. The UN Sustainable Development Goals[footnote 39] progress report 2021 concludes that - the pandemic has exposed and intensified inequalities within and among countries. The poorest and most vulnerable people having a greater risk of becoming infected by the virus
- the World Bank estimates that the pandemic led up to 97 million additional people being pushed into extreme poverty in 2020[footnote 40]
- in April 2020, DAC members published a joint statement[footnote 41] that spoke of the importance of ODA in supporting national responses to the COVID-19 crisis in developing countries
Box 2: Headlines
- £1.66 billion of UK ODA was spent on activities to support the control of the COVID-19 pandemic and the response to its social economic impacts in developing countries
- 17% of total UK bilateral ODA was spend on COVID-19 activities
- based on provisional data, the UK was the third largest donor in terms of COVID-19 related ODA
Box 3: By recipient country/region
- the majority of UK ODA that was spent on activities to address the COVID-19 pandemic (66%) benefitted multiple countries or all developing countries rather than a single specific country or region. For example, the UK’s contributions to Coalition for Epidemic Preparedness Innovations (CEPI)
- the remaining proportion is made up of – 2% (£38 million) earmarked for specific regions and 32% (£528 million) earmarked for specific countries
- countries in receipt of country-specific ODA that was spent on activities to address the COVID-19 pandemic included Bangladesh (£64 million), Yemen (£48 million), Nigeria (£34 million), Pakistan (£30 million) and Jordan (£29 million)
- then there is a graphic which includes a bar split by proportion into developing country unspecified, regional specific and country specific. There is a map which shows that the spread of UK country-specific ODA that was spent on activities to address the COVID-19 pandemic was wide with most developing countries receiving some country-specific ODA
Box 4: UK COVID ODA by other (non-FCDO) contributors
- FCDO accounted for 95% of UK COVID spent on COVID-19 related activities. The remaining £86m was delivered by Other Government Departments (OGDs) and Other Contributors of ODA
- then there is a bar chart that shows the different amounts of ODA extended by different OGD – CSSF £43.9 million, DHSC: £20.9 million, BEIS £17.4 million, Scottish Government £0.3 million, ONS £0.02 million
Box 5: Data need to knows
- it is important to note that UK COVID ODA figure are estimates
- 50% of the UK COVID ODA spend has been calculated by applying a COVID co-efficient to total ODA activity spend for existing programmes that were adapted to address COVID but had wider remits.
- these figures do not include the UK Imputed Multilateral Shares (see section 5.3.3 for why)
- for more details on the strengths & weaknesses of this data please see background note 7.6
Box 6: Use of ODA in UK COVID response
Examples of the kind of activities delivered through UK ODA include:
- setting up and supporting COVAX - an international mechanism for financing and delivering vaccines to 92 of the world’s poorest countries. With our support COVAX has made great progress on delivering vaccines across the world. This spend will be captured from 2021-2029
- contributing to the International Monetary Fund’s Catastrophe Containment and Relief Trust (CCRT) to help the poorest countries meet their debt repayments which has allowed them to focus their limited resources on responding to the pandemic
- supporting 1.5 million marginalised girls in Sub-Saharan Africa and South Asia to benefit from a quality education through our flagship Girls’ Education Challenge programme by ensuring remote teaching techniques reach key cohorts of girls of school-age using no-tech or low-tech learning. This is keeping girls safe and learning through COVID-19
- supporting at least 100,000 internally displaced people and vulnerable urban poor in Somalia, including by decongesting crowed informal settlements to reduce the risk of transmitting the virus
60. Region factsheet: page 29
This is a case study of the top country-specific ODA recipients in the top 3 regions over the past 5 years.
Box 1: Africa – Ethiopia
The top region ODA recipient is Africa, with the top country in Africa being Ethiopia. In 2020, the social and economic impact of COVID-19 pandemic and conflict in the Tigray region, coupled with a locust invasion and natural disasters, resulted in the number of people in humanitarian need more than doubling. In 2020, the UK provided £254 million of ODA to Ethiopia, with the largest recipient sector being humanitarian aid (£103 million). The next 3 largest recipient sectors were Health (£55 million), Other Social Infrastructure and Services (£29 million) and Government and Civil Society (£14 million). The largest provider of UK ODA to Ethiopia was the FCDO, providing £249 million. BEIS was the next largest UK contributor, providing £4 million. The UK is the 2nd largest G7 contributor of Humanitarian Aid to Ethiopia, after the USA, with Germany as 3rd largest contributor.
Box 2: Asia – Pakistan
The second highest region recipient is Asia, with the top country averaged over the last 5 years being Pakistan. In 2020, the COVID-19 pandemic in 2020 created a public health emergency with substantial disruptions to education and food supply, as well as floods impacting food security, water sanitation & hygiene. In 2020, the UK provided £200 million of ODA to Pakistan, with the largest recipient sector being education (£48m). Despite this, Pakistan saw a decrease in ODA going towards education from 2019, of which the largest reductions were seen in the basic education sector (by £35 million). The largest provider of UK ODA to Pakistan was the FCDO (£179 million). CSSF was the next largest UK contributor (£18 million). Of the G7 countries the US is generally the largest ODA provider to Pakistan, although in 2004 Japan was the largest donor. In 2019, the UK overtook the US as being the largest G7 ODA provider to Pakistan.
Box 3: Americas – Colombia
The third highest recipient region are the Americas, of which Colombia was the top recipient country over the last 5 years. Being one of the world’s most diverse countries, it is important to protect Colombia’s biodiversity and counter deforestation. Additionally, after decades of civil war, there is a need to build peace, stability and prosperity. The UK provided Colombia an average of £20 million per year over the last 10 years. The 2020 increase was driven in part by a £43m BEIS programme to tackle deforestation and promote sustainability. From 2016-2018 CSSF was the largest provider of ODA to Colombia, while in 2019 it was the FCDO. The largest provider of UK ODA to Colombia in 2020 was BEIS, with £55 million. FCDO was the next largest UK provider, with £9 million. In 2016 and 2017 the UK provided around £24 million ODA to Colombia, which steadily increased to 2020 when the UK provided £73 million, with the largest recipient sector in 2020 being production sectors (£46 million).
-
A glossary, explaining key terms used throughout this report, is available in Annex 1 ↩
-
See the Government statement ↩
-
https://www.gov.uk/government/news/changes-to-the-uks-aid-budget-in-the-spending-review ↩
-
https://www.gov.uk/government/news/government-sets-out-conditions-for-returning-to-07-aid-target ↩
-
The Gross National Income (GNI) used for reporting the ODA:GNI ratio in 2019 was measured on a pre-2019 Blue Book 2019 methodology. For more detail, please see explanatory note ↩
-
For more information on the grant equivalent measure and the historical cash measurement, please see background note 7.3 (paragraphs 18 to 20) ↩
-
The multilateral must be on the OECD DAC list of eligible multilaterals in order to receive unearmarked funding. The list also states the proportion of a core contribution to each multilateral that can be counted as ODA, and is driven by proportion of ODA eligible work the multilateral carries out ↩
-
The UK contribution could be used for different programmes or initiatives as well as general operations of the organisation. See section 5.3.3 for information on how we estimate which countries and sectors the UK core contributions benefit ↩
-
Please see the background note section 7.9 for information on ODA COVID-19 data collection, quality, and calculation. ↩
-
Note 1. Figures may not sum to totals due to rounding. Note 2. FCDO figures are the total sum of former FCO and former DFID ODA spend. Note 3. CSSF includes the contribution to EU peacekeeping activities as the fund responsible for the spend. This contribution is not counted in the EU attribution (non-DFID) figure to avoid double-counting. The total UK EU attribution is not affected, the estimate for the UK’s total share in 2020 is £1,149 million. Note 4. For this publication the basic health support for asylum seekers have been produced with a health unit cost (per capita cost) for 2020. Note 5. ONS ODA for 2019 was £316,068 and £238,443 in 2020. Note 6. This includes ODA eligible in-donor refugee costs which have been administered by the devolved administrations. Note 7. Welsh Government record their ODA by financial year. [r]: As announced in Provisional SID 2020 several minor revisions have been made to 2017, 2018 and 2019 data. Please see background note 7.3: Revisions for details. z is not applicable, “0” is null and “[low]” is less than half the smallest unit displayed. ↩
-
CSSF includes a contribution of £27.5 million for peacekeeping activities carried out by the EU, as it is the fund responsible for the spend. This is not counted in EU Attribution (non-DFID). From 2021, the full UK Attribution of the development share of the EU budget will be reported under FCDO. This is in line with ODA allocations. ↩
-
In 2019, frontline diplomatic activity (the majority of FCO’s administrative costs, which are reported under FCO spend as ‘Aid-related frontline diplomacy in support of aid flows to …’) were reported at the country level compared to recent years when they were reported at the regional level. This could have an impact on the recent trends of some recipient countries. ↩
-
For some multi-country/region programmes, the current administrative system does not allow recording of spend by individual recipients. Improvements to the system are being considered but for this publication, where this is the case spend is reported as bilateral ODA spend with no single benefitting country or region (section 5.1.6). ↩
-
The Global Partnership for Education is an example of a sectoral-specific fund where amounts allocated to countries is not known in advance. ↩
-
The term ‘country-specific’ is used here because countries may also benefit from regional programmes that benefit multiple countries these would be reported under regional codes such as “Africa, regional”. ↩
-
European countries that received ODA in 2020 were: Albania, Belarus, Bosnia-Herzegovina, Kosovo, Moldova, Montenegro, North Macedonia, Serbia, Turkey and Ukraine. ↩
-
For breakdowns of spend to the top 20 recipients, see Table 6 on the publication landing page. ↩
-
https://ethiopia.un.org/sites/default/files/2020-09/Ethiopia%20HRP%20Mid%20Year%20Review%202020%20-%2031%20Aug%20final.pdf ↩
-
From 2017, a single project could allocate spend to one or more sectors codes. See our note on Multiple Sector Codes for Project Activity – Analysis 2017 which looks at the impact of this methodology change. ↩
-
The COVID-19 sector code was introduced by the OECD DAC in 2020. It does not cover all UK COVID-19 activities such as responses to international humanitarian appeals and COVID-19 activities on the socio-economic impacts of the pandemic. ↩
-
See section 4.4 on non-FCDO trends for Home Office asylum seeker spend. ↩
-
Economic Services & Infrastructure include programmes that focus on Transport, Energy Generation, Banking & Financial Services and Business. See Annex 1 for more detail. ↩
-
Defined as ODA-eligible multilateral organisations for core (unearmarked) contributions by the OECD DAC, see http://www.oecd.org/dac/stats/annex2.htm ↩
-
The UK may also provide funding to these organisations for specific programmes, which would be recorded as bilateral spend through a multilateral organisation. ↩
-
Note 1. Figures may not sum to totals due to rounding. Note 2. FCDO figures are the total sum of former FCO and former DFID ODA spend. Note 3. CSSF includes the contribution to EU peacekeeping activities as the fund responsible for the spend. Note 4. For this publication the basic health support for asylum seekers have been produced with a health unit cost (per capita cost) for 2020.z is not applicable, “0” is null and “[low]” is less than half the smallest unit displayed. For a full breakdown of UK-ODA by government department and other contributors to UK ODA by delivery channel for 2016, 2019 and 2020 please see Table 10. [r] As announced in Provisional SID 2020 several minor revisions have been made to 2019 data. Please see background note 7.3: Revisions for details. ↩
-
Finalised figures for DAC members will be published in December 2021, therefore we are using provisional figures in this chapter. To illustrate the impact of using provisional figures, DAC members’ provisional ODA for 2019 was £119.7billion. This decreased to £118.9 billion for final ODA for 2019 – a decrease of 0.7 per cent. ↩
-
The EU is also a DAC member but has not been included in this chapter. ↩
-
The OECD refers to nominal prices as ‘current’ prices (i.e. current for each individual year). ↩
-
The OECD refers to real prices as ‘constant’ prices (i.e. the series uses one year as the constant price across all years). ↩
-
https://www.oecd.org/dac/financing-sustainable-development/development-finance-data/Longterm-ODA.xls ↩
-
From 2018 onwards, Official Development Assistance (ODA) has changed from being measured on a cash basis to a grant equivalent basis, following a decision taken by the DAC in 2014. For more information please see the Grant Equivalent Technical note. ↩
-
For further analysis on DAC country donors, see the OECD report on donor’s provisional figures: https://www.oecd.org/dac/financing-sustainable-development/development-finance-data/ODA-2020-detailed-summary.pdf ↩
-
Figure 18 is based on the provisional 2020 ODA data from all 29 DAC member countries, except the UK for which final 2020 ODA data is used. ↩
-
GNI is monitored using forecasts published by the independent Office for Budget Responsibility (OBR) to manage the 0.7% commitment. ↩
-
See the SID accompanying annexes for more information on FCDO’s assessment of assurance of the administrative data. ↩
-
https://www.oecd.org/dac/financing-sustainable-development/development-financestandards/What-is-ODA.pdf ↩
-
Updated estimates of the impact of COVID-19 on global poverty: Turning the corner on the pandemic in 2021? (worldbank.org), June 2021 ↩