Statistics on International Development: Final UK Aid Spend 2018
Updated 7 April 2020

© Crown copyright 2020
This publication is licensed under the terms of the Open Government Licence v3.0 except where otherwise stated. To view this licence, visit nationalarchives.gov.uk/doc/open-government-licence/version/3 or write to the Information Policy Team, The National Archives, Kew, London TW9 4DU, or email: psi@nationalarchives.gov.uk.
Where we have identified any third party copyright information you will need to obtain permission from the copyright holders concerned.
This publication is available at https://www.gov.uk/government/statistics/statistics-on-international-development-final-uk-aid-spend-2018/statistics-on-international-development-final-uk-aid-spend-2018--2
Additional Tables and Annexes are available.
About this release
The publication focuses on the key international measure of official aid spend, known as Official Development Assistance (ODA). Box 1 explains the definition of ODA.
Box 1 - Key definition: Official Development Assistance
Official Development Assistance (ODA) is produced according to the standardised definitions and methodologies of the Organisation for Economic Cooperation and Development’s (OECD) Development Assistance Committee (DAC). ODA is defined as resource flows to developing countries (according to the OECD DAC list of ODA recipient countries) and multilateral organisations, which are provided by official agencies (e.g. the UK Government) or their executive agencies, where each transaction meets the following tests:
- It is administered with the promotion of the economic development and welfare of developing countries as its main objective; and
- It is concessional, including grants and soft loans (ODA is calculated on a grant equivalent basis for 2018 ODA statistics. For more details see the background note 4.1.)
A glossary, explaining key terms used throughout this report, is available in Annex 1 of SID.
It contains the release of finalised UK ODA spend figures for the calendar year 2018, including total UK spend on ODA, the UK’s ODA:GNI ratio, trends in the last 5 years (2014 to 2018 inclusive as shown in most tables) and breakdowns by government department, recipient country or multilateral organisation, type of assistance and sector.
This publication updates previous provisional figures of UK ODA for 2018 published in April 2019[footnote 1]. On the 20 December 2019, this publication was updated to take account of a set of revisions for 2018 ODA. For more information, see Revisions Statement.
All data tables included in the publication are available to download in spreadsheet format. A full micro-dataset is also available in Open Data Standard format on the Statistics on International Development webpage.
Further information on the technical terms, data sources, quality and processing of the statistics in this publication are found in Annexes 1-3 on the Statistics on International Development webpage.
UK ODA spend figures for this publication are derived from:
a) DFID’s ‘ARIES’ database of financial transactions relating to DFID payments and receipts, which is quality assured centrally to ensure that data is complete, coding is correct and spend is in line with OECD definitions of ODA. This administrative source comprises 75% of total UK ODA in 2018
b) Non-DFID sources, who also assess whether the spend is in line with the OECD definitions of ODA. These non-DFID sources accounted for around 25% in 2018 and are largely derived from financial transaction data also. A small proportion of non-DFID spend is estimated, for example Gift Aid on ODA eligible activity.
Private spending or donations made to support developing countries, for example by the public, the voluntary sector or through remittances, are not part of the ODA definition and not covered in this publication. Information on this spend can be found in the Office for National Statistics, Living costs and Food Survey or the Charities Aid Foundation’s UK giving report.
If there are any tables or data not available from this publication that you need for your own analysis, or if you have any thoughts about how to improve the publication, please contact the statistics team at: statistics@dfid.gov.uk.
UK ODA Flows
This section provides an overview of UK Official Development Assistance (ODA). It covers the amount of UK ODA spent, the calculation of the ODA:GNI ratio, breakdowns of UK ODA spend by main delivery channel, and by Government Departments and other contributors.
The ODA:GNI Ratio
The ODA:GNI ratio presents the amount of UK Official Development Assistance (ODA) as a proportion of Gross National Income (GNI).
The ODA:GNI target of 0.7% was first agreed internationally in 1970 by the United Nations General Assembly. The UK government made a commitment to invest 0.7% of GNI on ODA from 2013. In 2015, the International Development (Official Development Assistance Target) Act placed the commitment to spend 0.7% of GNI on ODA in UK law from 2015 onwards.
Box 2 - ODA headline measure
For 2018 onwards, ODA has changed from being measured on a cash basis to being measured on a grant equivalent basis, following a decision taken by the DAC in 2014.
The new measurement is designed to allow loans to be compared more transparently alongside grants and incentivise lending to least developed countries. The measurement only effects official loans; grants are treated the same as previous years. Official loans are those to a developing country or a development organisation such as the multilaterals eligible for un-earmarked funding.
In 2018, the UK only had 1 official multilateral loan, to the IMF- Poverty Reduction Growth Trust (IMF-PRGT). Therefore, in this publication, the new measure mainly affects the total of the ‘core contributions to multilaterals’ element of UK spend, which fluctuates year on year.
The headline grant equivalent measure of UK ODA for 2018 is £14,552 million, compared to £14,591 million on the cash basis measurement (a decrease of 0.3%).
See section 4.1.3 in the background note and our technical note for more information.
Table 1 reports the ODA:GNI ratio for the calendar year 2018 based on the ODA grant equivalent measure and current international standard for measuring GNI (ESA[footnote 2] 2010).
The UK provided a total of £14,552 million of ODA in 2018. This represented an increase of 3.5% (£493m) between 2017 and 2018.
Table 1: GNI estimates and ODA:GNI Ratios, 2017 and 2018; Current Prices (£ millions)
The ODA:GNI ratio for 2018 was 0.70%, and therefore the UK met the 0.7% commitment, as set out by the International Development Act 2015.
Long-term Trends in UK ODA
Figure 1 shows the trend in UK ODA since 1970. Overall there has been a steady increase in the level of UK ODA since 1970, with a spike in 2005 and 2006 which was driven by high levels of debt relief[footnote 3]., and then a steep increase in 2013 when the UK Government first met the 0.7% ODA:GNI commitment.
The relatively larger increase in the level of ODA in 2016 reflects the switch to the European System of Accounts (ESA) 2010 methodology for measuring GNI and the consequent increase in UK ODA to meet the 0.7% ODA commitment on that basis.
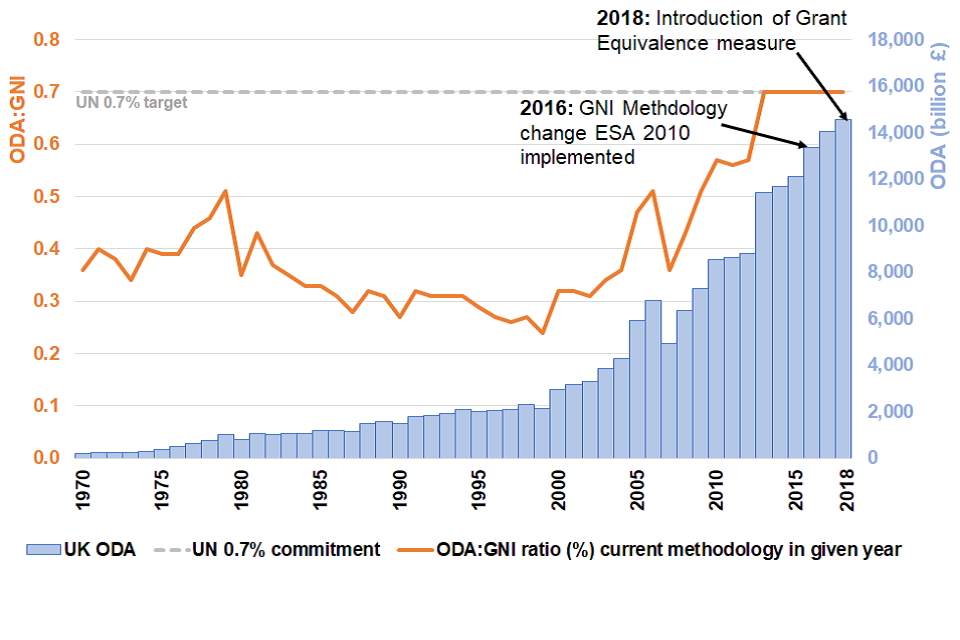
Figure 1
UK ODA by Main Delivery Channel
There are 2 main delivery channels for ODA: bilateral and multilateral.
Bilateral ODA is earmarked spend, this means that the donor has specified where and what the ODA is spent on – this is usually ODA going to specific countries, regions or programmes. There are 2 types of bilateral ODA:
- ‘Bilateral through multilateral’: this is earmarked ODA spent through multilateral organisations. Example - Support to the International Organisation for Migration (IOM) for provision of Water, Sanitation and Hygiene for the South Sudan Humanitarian Assistance
- ‘Other bilateral’: this is earmarked ODA spent through other delivery partners, such as Non-Governmental and Civil Society Organisations, research institutions and universities or directly by the government. Example - Delivering family planning services across Malawi through an NGO
Core multilateral ODA is un-earmarked core funding from national governments to multilateral organisations[footnote 4], which are pooled with other donors’ funding and disbursed as part of the core budget of the multilateral organisation. Therefore, the UK contribution could be used for different programmes or initiatives as well as general operations of the organisation. See section 3.3.3 for information on how we estimate which countries and sectors the UK core contributions benefit.
Example - UK contribution to the World Bank International Development Association.
Table 2 shows the UK provided £9,263 million of bilateral ODA in 2018, an increase of £460 million (5.2%) on 2017. By comparison, £5,289 million was provided in core contributions to multilaterals in 2018, an increase of £33 million (0.6%) on 2017. This relatively larger increase in bilateral spend for 2018 contrasts with 2017, when core contributions to multilaterals were the largest driver of increasing ODA in that year.
Bilateral and multilateral loans together comprised 0.2% of UK ODA in 2018 compared with 11.1% in 2017. A main driver of the decrease seen in 2018 is due to a fall in spend to the IMF-Poverty Reduction Growth Trust (IMF-PRGT) fund. In 2018, IMF-PRGT used £26 million (grant equivalent); or £83 million (in cash flow terms)[footnote 5]of UK ODA, compared with £726 million (cash flow) in 2017.
Table 2: Total UK ODA: by Delivery Channel (Bilateral, Multilateral)
Figure 2 presents the breakdown of total ODA by main delivery channel over the last 5 years. Between 2015 and 2018, despite movement in the volumes of bilateral and multilateral ODA, the shares have remained stable at around 63-64% and 36-37% respectively. This in part reflects the variance in core contributions to multilaterals, as the contributions of national governments and the payment schedules of the receiving organisations are managed on different multi-year cycles.
The multilateral must be on the OECD DAC list of eligible multilaterals in order to receive unearmarked funding. The list also states want proportion of a core contribution to each multilateral can be counted as ODA. Cash flows were the ODA headline measure before 2018 ODA.
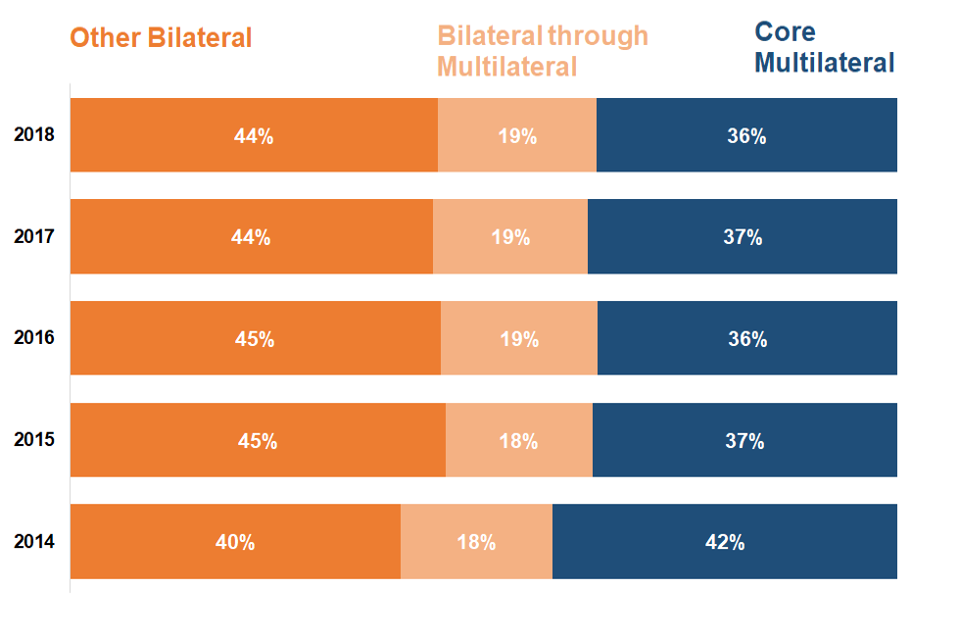
Figure 2
Makeup of UK ODA by Government Department and other contributors of UK ODA
Table 3 shows the contribution of government departments and other contributors of UK ODA in 2018, including:
Main contributors of UK ODA
- DFID spent £10,897 million of ODA in 2018. This was an increase of £793 million (or 7.8%) compared with 2017. In contrast to UK ODA overall, the increase in DFID ODA is driven mostly by an increase of core contributions to multilateral organisations, £1,931 million paid to the World Bank International Development Association
- DFID’s ODA represented 74.9% of total UK ODA in 2018, compared to 71.9% in 2017. This was the first increase in DFID’s share of ODA since 2014
- ODA spend by non-DFID government departments was £2,963 million in 2018, an increase of £384 million (or 15%) on 2017. ODA spend by other contributors of UK ODA was £692 million, a decrease of £684 million (49.7%). Combined, non-DFID ODA represented £3,655 million (or 25.1%) of total ODA in 2018, compared with £3,955 million (28.1%) in 2017
- In 2018 the largest non-DFID ‘departmental’ or fund shares of ODA were: Department of Business, Energy & Industrial Strategy (BEIS) (5.8% of ODA); the Foreign and Commonwealth Office (4.4%); the Conflict, Stability and Security Fund (CSSF) (4.2%); and the Home Office (2.3%)
- The largest other sources of ODA were non-DFID EU attribution which was £471 million (3.2% of UK ODA) and Gift Aid which was £148 million (1.0% of UK ODA). Non-DFID EU contributions[footnote 6]. include ODA eligible spend in peace, security, democracy, human rights and civil society
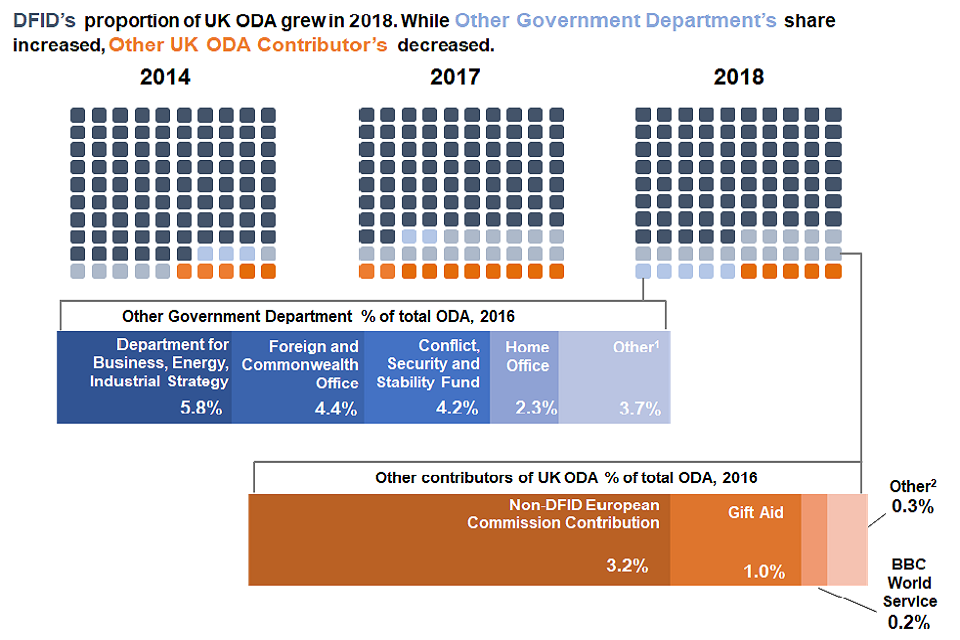
Figure 3
Main ODA changes between 2017 and 2018
- In 2018, there was a reduction in spend of £684 million by other contributors of ODA, driven by a reduced use of UK funding of the IMF - Poverty Reduction and Growth Trust (PRGT). IMF PRGT ODA decreased by £700 million, from £726 million in 2017 to £26 million in 2018[footnote 7].
- The reduction in spend by other contributors was partially offset by an increase in spend by non-DFID government departments, which increased by £384 million in 2018. Overall, the non-DFID ODA decreased by £300 million in 2018
- Department of Health and Social Care spent £195 million in 2018, representing the largest increase of any contributor, almost doubling the amount of ODA they spent in 2017 (£101m). This primarily reflected increased funding to develop new vaccines for diseases with epidemic potential and health research for the main benefit of patients and the public in low- and middle-income countries
- BEIS, which tackles climate change and supports research in developing countries and was the highest non-DFID contributor, spent £851 million of ODA in 2018 – an increase of £85 million on 2017
- HM Treasury provided a contribution to the Asian Infrastructure Investment Bank in 2018, which drove the increase in its ODA spend to £83 million in 2018. In 2017, HMT only spent ODA on eligible admin costs.
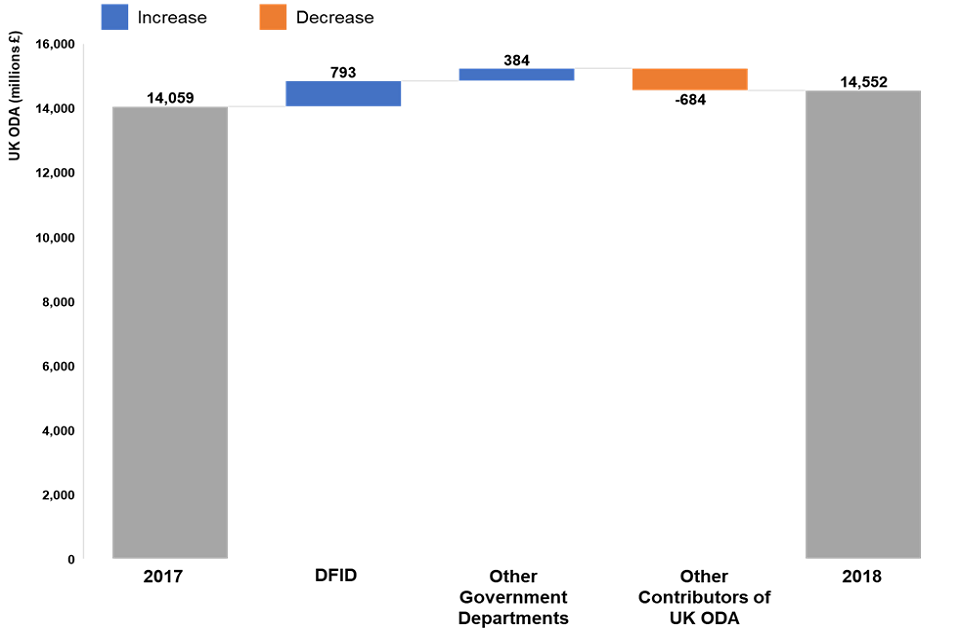
Figure 4
Table 3: Breakdown of UK ODA: by Government Department and Other Contributors of UK ODA
Cross - Government Funds
There are 2 cross-government funds, the Conflict, Stability and Security Fund (CSSF) and the Cross-Government Prosperity Fund. These funds are overseen by the National Security Council (NSC)[footnote 8]. that sets overall strategic direction. Individual departments that bid for funding are accountable for their own spending and delivery under the given fund.
Conflict, Stability and Security Fund
CSSF delivers ODA activities to tackle instability and prevent conflicts. In 2018, £605 million was delivered through the fund, an increase of £51 million compared to 2017. This was driven by increased spending by the Foreign and Commonwealth Office (FCO) and DFID. FCO remained the largest recipient, spending 69.5% of total CSSF ODA. Department for Education and Centre for Environment, Fisheries and Aquaculture Science (an Executive Agency of Defra) received funding for the first time.
Cross-Government Prosperity Fund[footnote 9].
The Cross-Government Prosperity Fund promotes economic reform and development in recipient countries. In 2018, £94 million was delivered through the Cross-Government Prosperity Fund. This was an increase of £48 million compared to 2017, reflecting increased spending by FCO and DFID, as well as new HM Treasury spend on technical assistance projects. FCO remained the largest recipient, spending 55.3% of total Cross-Government Prosperity Fund ODA. HM Treasury (HMT), Department for Digital, Culture, Media and Sports and Department for International Trade received funding for the first time.
Table 4
Comparisons between the UK and other International Donors
The analysis in this chapter is based on provisional[footnote 10] 2018 ODA data from all 29 Development Assistance Committee (DAC) member countries[footnote 11]. except the UK, for which final 2018 ODA data is used. As explained in the ‘About this release’ all DAC members moved to using the new grant-equivalent measure for 2018.
ODA Flows and ODA:GNI Ratios by DAC Donors
The introduction of the grant-equivalent measure primarily affects countries with a high proportion of loans in their 2018 ODA portfolio. The UK’s ODA spend is only slightly affected by this change as most of its ODA is issued through grants. However, Japan – who provides most of its ODA through loans – experienced a 41% increase in grant-equivalent ODA compared to the cash-flow measure in 2018. This most likely due to official loan reflows being included in the cash measure. For similar reasons, Portugal’s ODA spend increases by 14% and Spain’s by 11% under the grant-equivalent measure.
Total ODA from DAC country donors in 2018 was £114.7 billion (grant-equivalent measure). Total ODA from DAC country donors on a cash-basis for 2018 was £111.9 billion, which represents a real terms[footnote 12] decrease of 2.0% compared to 2017. The decline in DAC country donors total can be partially attributed to less ODA being spent on the least developed countries and on hosting refugees as arrivals slowed.[footnote 13] .
Figure 5 shows the UK remained the third largest DAC donor in 2018 at £14.6 billion, behind the United States (£25.7bn) and Germany (£18.7bn). The UK’s share of total DAC ODA was 12.7%, this is similar to 2017 (12.3%).
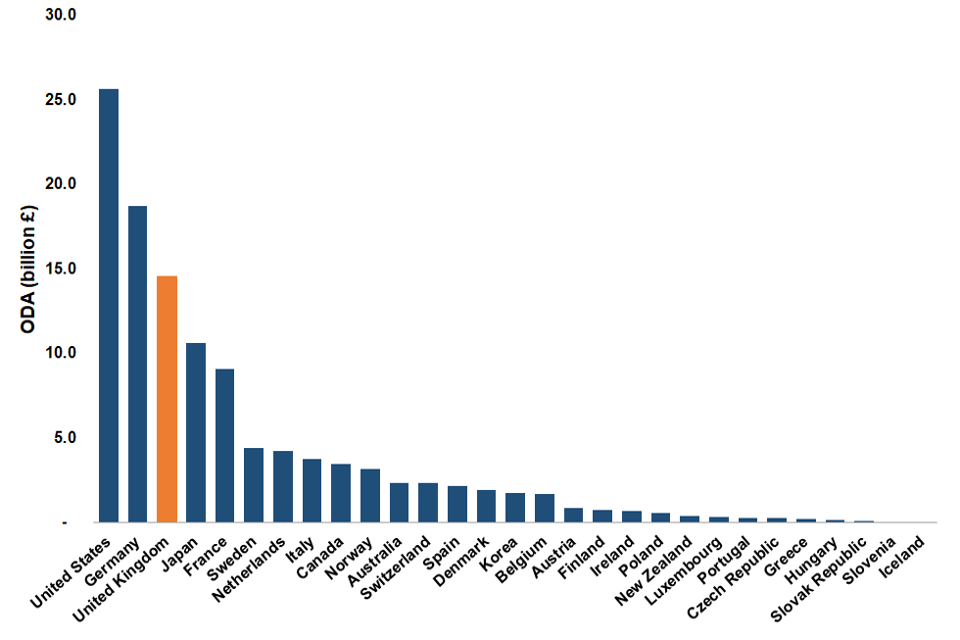
Figure 5
Figure 6 shows ODA spend in terms of gross national income (GNI) in 2018. It highlights that although the United States was the leading DAC donor with £25.7 billion, this represented 0.17% of its GNI. In comparison, Sweden’s ODA spend (£4.4bn) was approximately a sixth of the United States’ but its ODA:GNI ratio was 1.04% showing that Sweden spends a larger share of its national income on ODA.
In 2018, the UK was one of 5 DAC donors – along with Denmark, Luxembourg, Norway and Sweden – to either meet or exceed the UN’s target of an ODA:GNI ratio of 0.7%. The same countries also met or exceeded the target in 2017. In 2018, the UK remained the country with the fifth highest ODA:GNI ratio with 0.70%; Sweden had the highest with 1.04%. The top 11 countries remained unchanged from 2017.[footnote 14]
Figure 6: DAC Donors’ Provisional ODA:GNI Ratio, 2017 and 2018[footnote 15]
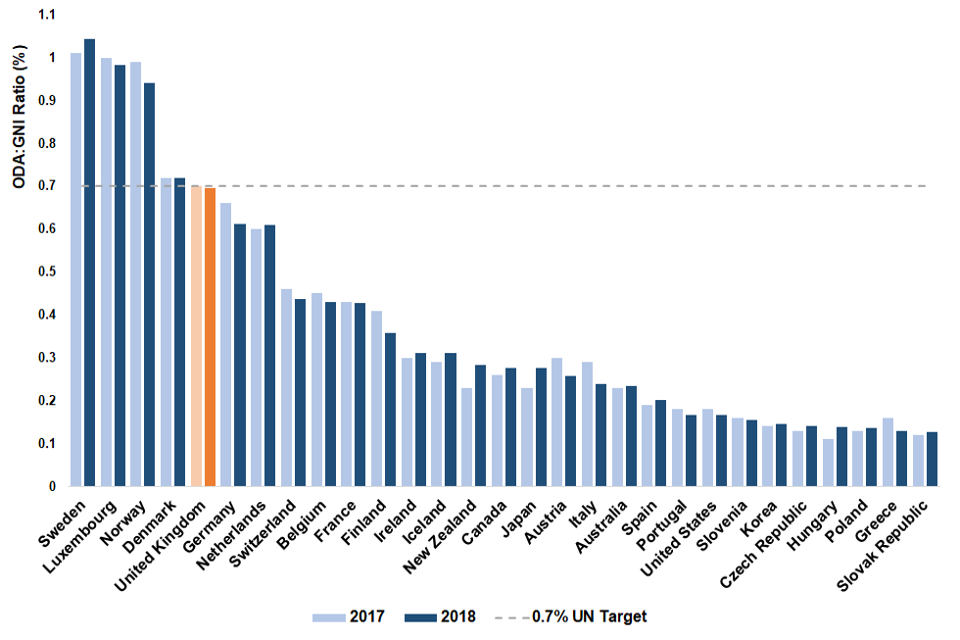
Figure 6
ODA Flows by Recipient Countries
The data used for DAC ODA flows by recipient countries is for 2017. For comparability, UK ODA data by recipient countries is also for 2017.
Figure 7 shows the top 15 recipients of DAC ODA in 2017 and the UK’s share of DAC ODA in these countries. It shows:
- In 2017, the UK’s share of DAC ODA was 15% or more in a third of the top 15 DAC recipient countries: Ethiopia, Nigeria, Pakistan, Syria and Tanzania. This is similar to 2016
- Of the top 5 DAC recipient countries (Afghanistan, India, Syria, Iraq and Bangladesh), 2 (Syria and Afghanistan) were among the top 5 UK ODA recipients. The remaining top recipients of UK ODA were Pakistan, Ethiopia and Nigeria
- Afghanistan remains the largest recipient of DAC country member’s ODA totalling £2.2 billion in 2017. Pakistan, which of the top 15 was the recipient of the largest UK share of DAC ODA (41%), fell five places to 15th largest DAC recipient in 2017
- Four of the top 15 DAC ODA recipients received less than 5% of their total ODA from the UK[footnote 16]. with Vietnam receiving 0.6% in 2017
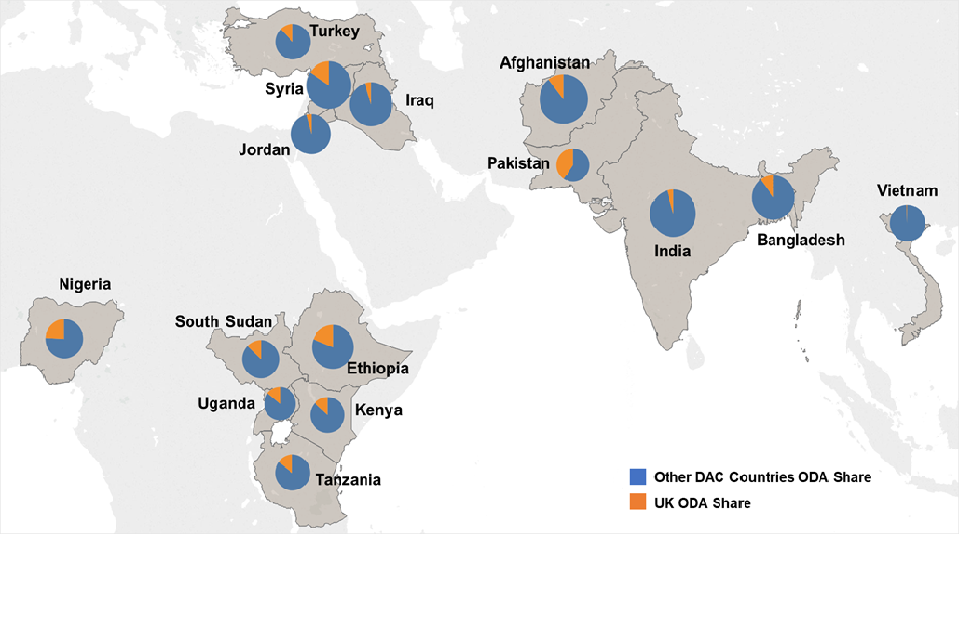
Figure 7
Analysis of UK ODA spend
Regional / Country Breakdowns of Bilateral ODA Spend
Bilateral ODA is earmarked spend either through multilateral organisations or other delivery partners, compared with multilateral ODA which is un-earmarked funding to multilateral organisations.[footnote 17] Bilateral ODA includes spend to specific countries or regions (sections 3.1.1-3.1.5) as well as spend to multiple countries and/or regions. [footnote 18] Also included is spend within specific sectors for which there are no designated benefitting country or region or where benefitting countries are not known until the end of the programme[footnote 19] (section 3.1.6).
Bilateral ODA spend by region
In 2018, 61.1% (£5.7bn) of the UK’s bilateral ODA was allocated to a specific country or region. This is a reduction on 2017 when the allocated share was 67.0% (£5.9bn). The increase in bilateral ODA unassigned to either country or region in 2018 in particular is discussed in case study on page 34.
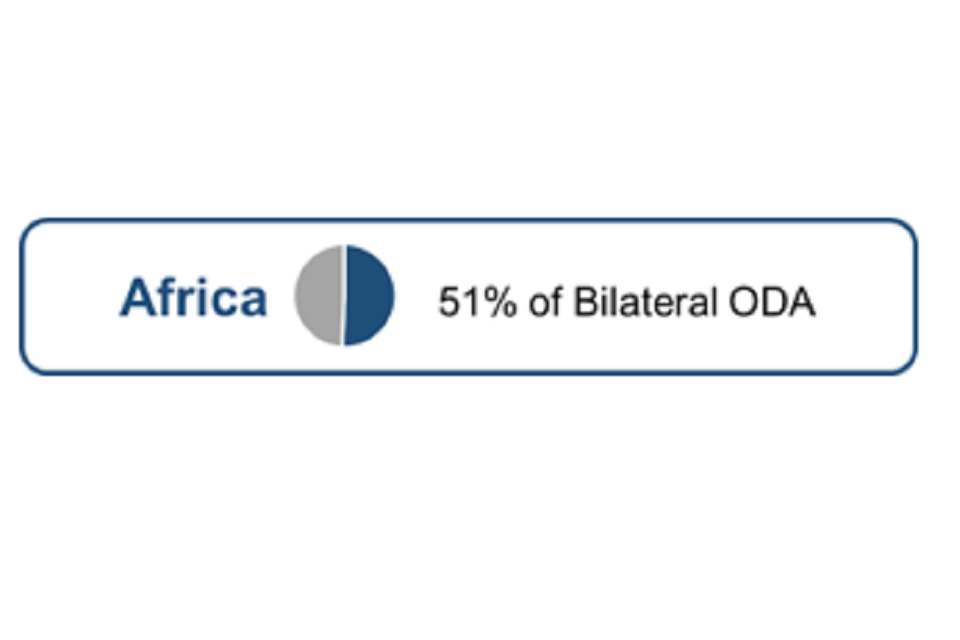
Africa continues to be the region receiving the largest proportion of UK bilateral ODA allocated to a specific country or region (50.6%). This is in line with Africa’s percentage share in 2017 (50.8%), as the reduction in spend specifically to countries or regions in Africa (from £3.0bn in 2017 to £2.9bn in 2018) is proportionate to the overall reduction in country or region specific spend.
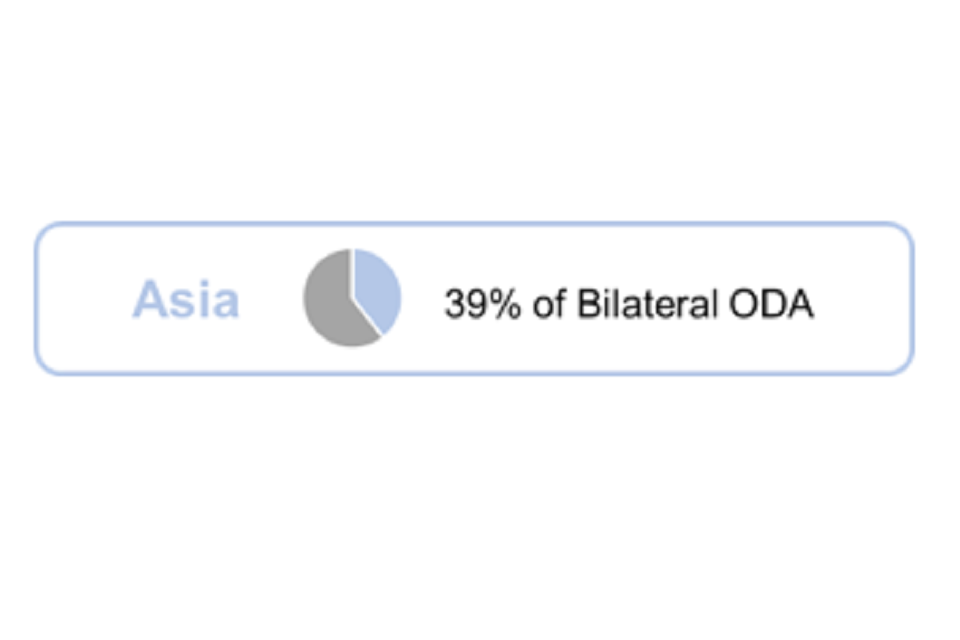
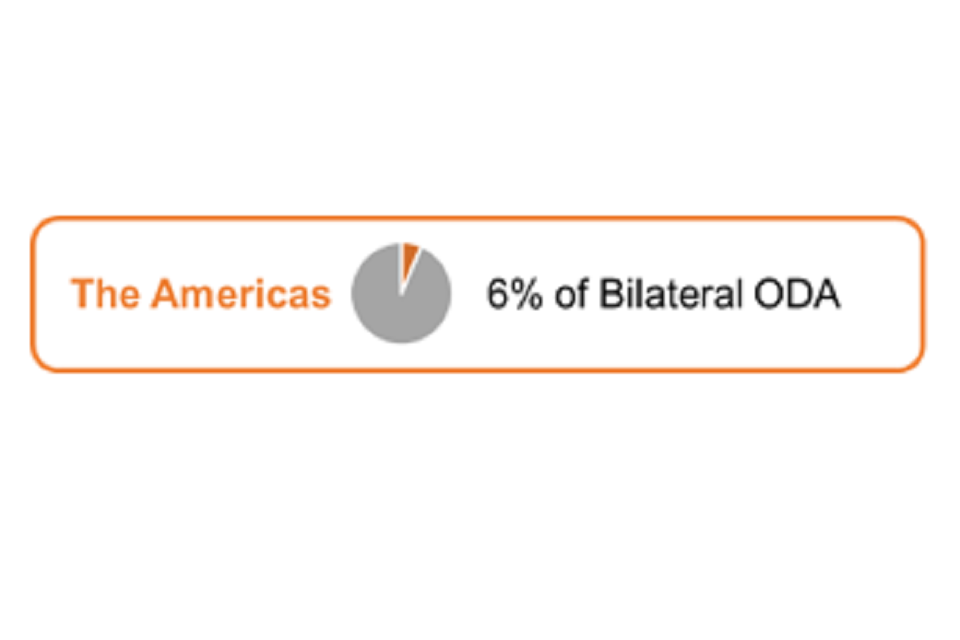
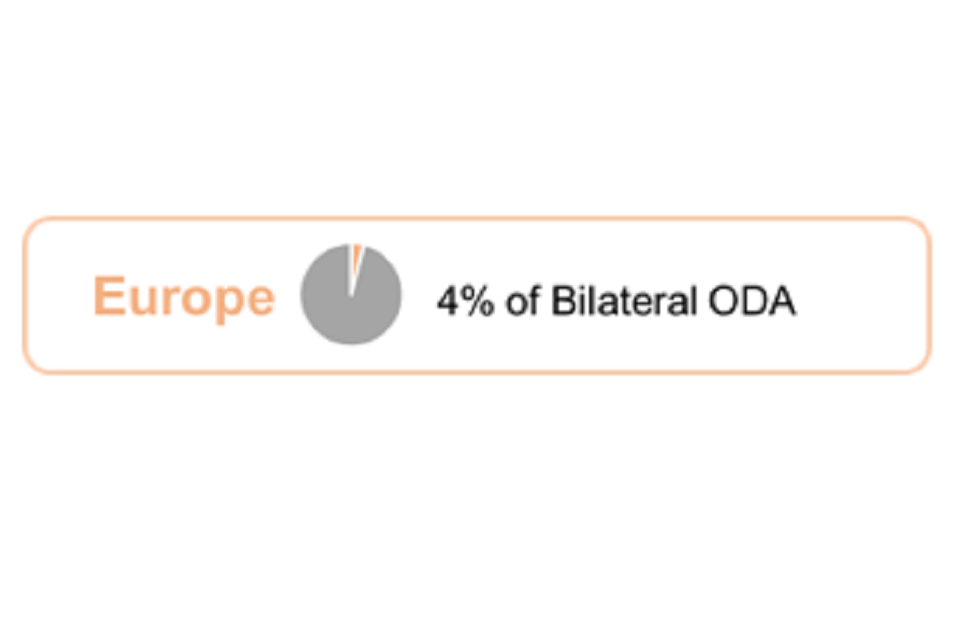
Asia remains the second largest recipient of UK bilateral ODA in 2018 with 39.5% (£2.2bn), followed by the Americas with 6.3% (£0.4bn), Europe with 3.4% (£0.2bn) and the Pacific with 0.2% (£11m).
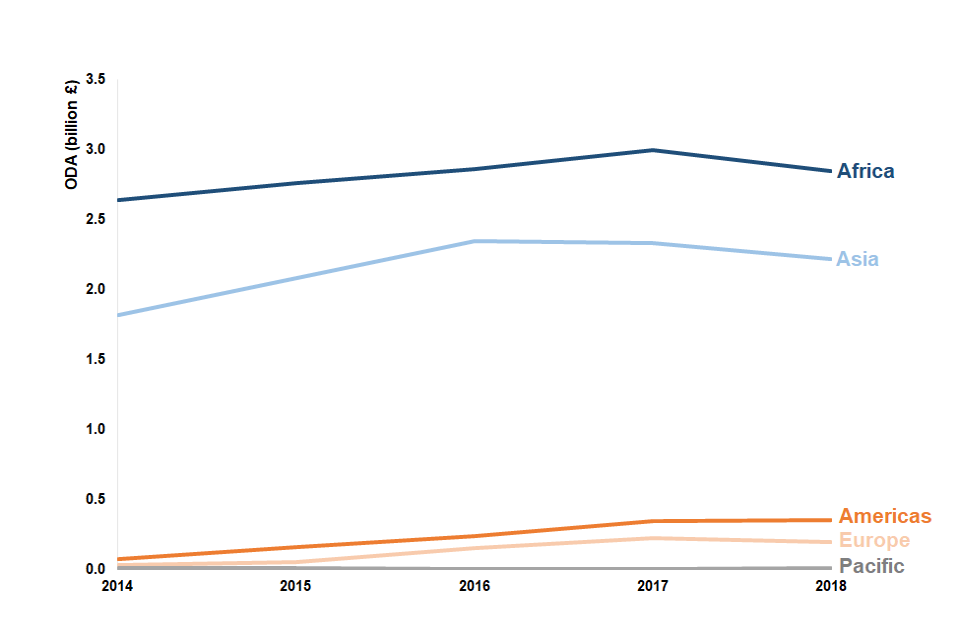
Figure 8
Changes in the Regional Flow of UK Bilateral ODA
Africa breakdown
2018: Bilateral ODA to Africa decreased by 4.4% (£133m) from £2,996 million in 2017 to £2,863 million in 2018. The largest reduction in spend to African countries was to Somalia, where spend decreased by £88 million. However, spend to Somalia remains above pre-2017 levels, after which funding increased sharply in response to humanitarian crises[footnote 20] . Over 5 years: Many of the countries (approximately 70%) classified as “Least Developed Countries” on the OECD DAC list of recipient countries are in Africa and they account for a significant share of UK bilateral ODA overall. Therefore, Africa has consistently received the largest amount of UK ODA. Bilateral ODA to Africa increased steadily between 2014 (£2,637m) and 2017 (£2,996m). Although dropping in 2018 (£2,863m), it remains 8.6% higher than in 2014.
Asia breakdown
2018: In 2018, the volume of bilateral ODA to Asia was £2,235 million. This represents a reduction of 4.1% compared to 2017, when spend to the region was £2,330 million. The biggest reductions were to Syria and Pakistan (see section 3.1.2 for more information).
Over 5 years: Spend to Asia has increased by 22.9% over the past 5 years, from £1,818 million in 2014 to £2,235 million in 2018. Between 2014 and 2016 bilateral ODA to Asia increased by £526 million to £2,344 million, driven by increased spend to Pakistan (improving social infrastructure and economic-stability and growth), Jordan and Syria (in response to the Syrian Crisis, including support to displaced refugees).
Americas breakdown
2018: In 2018 the Americas received £355 million of UK bilateral ODA, an increase of 2.8% (£10m) on 2017. Most of this spend was for infrastructure development in both the Caribbean and South America.
Over 5 years: ODA to the Americas is on a smaller scale than spend to Africa and Asia, however it has increased steadily over the past 5 years from £73 million in 2014 to £355 million in 2018.
Europe breakdown
2018: Europe received £195 million of UK bilateral ODA in 2018, a 12.7% (£28m) decrease on the previous year. The most significant reduction was seen in Turkey (£65m decrease since 2017) reversing previous increases in funding to support displaced refugees in the Syria Crisis.
Over 5 years: Like the Americas, ODA spend in Europe[footnote 21] is small compared to Asia and Africa. Bilateral ODA to Europe has increased from £34 million in 2014 to £195 million in 2018.
Pacific A very small proportion of UK bilateral ODA goes to the Pacific, generally between 0.1 and 0.2%. In 2018, UK bilateral ODA to the region was £11 million, surpassing £10 million for the first time in the past 5 years.
Bilateral ODA spend by Country
In 2018, the UK provided bilateral assistance to 135 countries.
- In 2018 the top 3 recipients of UK bilateral ODA were Pakistan (£331m), Ethiopia (£301m) and Nigeria (£297m). Spend to these countries accounted for 20.6% of total country-specific UK bilateral ODA
- The volume of ODA to Pakistan decreased for the second year running from £463 million in 2016 to £402 million in 2017 and £331 million in 2018, driven by reduced spend on Education and Economic Infrastructure[footnote 22]. Nevertheless, Pakistan has remained the top recipient of UK bilateral ODA for the fourth consecutive year
- Jordan (12th highest recipient of UK ODA in 2018) saw the biggest increase with spend more than doubling from £61 million in 2017 to £138 million in 2018, although remaining below the level in 2016 (£175m). Primary objectives include providing humanitarian assistance, basic services and economic opportunities to Syrian and Palestinian refugees[footnote 23]
- The Democratic Republic of Congo moved into the top 10 recipients of UK bilateral ODA, as spend increased from £166 million in 2017 to £204 million in 2018 in response to escalating humanitarian crises[footnote 24]
- Somalia saw the largest reduction in ODA, with spend decreasing from £282 million in 2017 to £194 million in 2018. This follows a spike in 2017, driven by increased humanitarian assistance to conflict and disaster affected populations
- In 2018, there was a £83 million reduction in ODA to Syria. However, this was driven by the reallocation of spend on the Vulnerable Person’s Resettlement Scheme (VPRS) from Syria to developing country unspecified, as the programme now benefits refugees from other countries[footnote 25]. UK ODA to Syria (excluding £114m spent on the VPRS) was £200 million in 2017 and £231 million in 2018, therefore other UK ODA to Syria increased in 2018
- The total UK bilateral ODA spend to the top 5 recipient countries decreased from £1,652 million in 2017 to £1,409 million in 2018. As a percentage share of total country-specific UK bilateral ODA the top five accounted for 31.2% of the total in 2018, a slight reduction from 2017 when they comprised 33.8% of the total
Figure 9 shows the top 10 recipients of UK bilateral ODA in 2017 and 2018 as well as movement in and out of the top 10, for example the Democratic Republic of Congo was the 11 highest recipient in 2017 and the 6 highest in 2018.
Figure 9: Top 10 Recipients of UK Bilateral ODA[footnote 26].
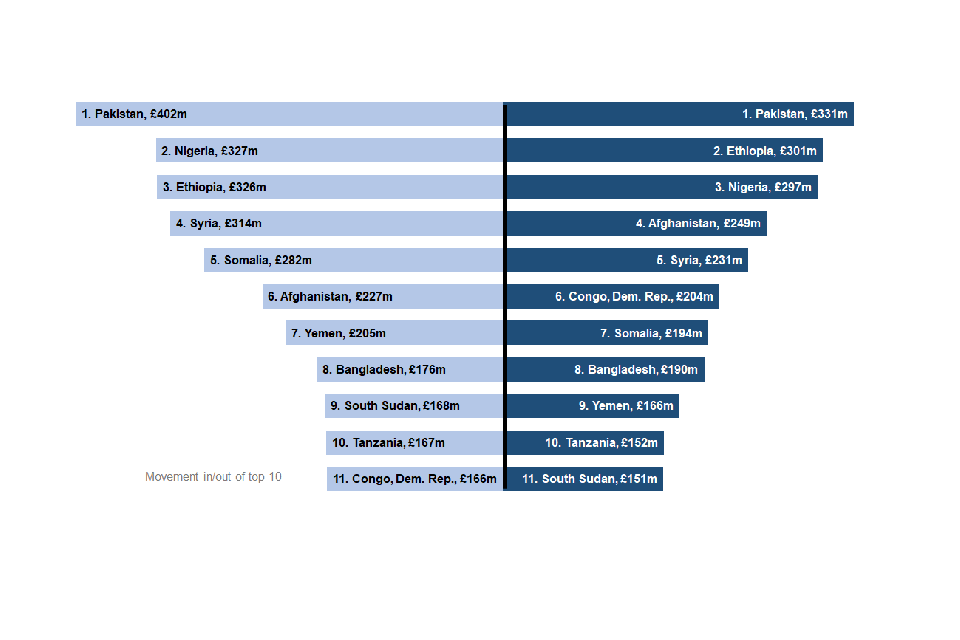
Figure 9
Figure 10 shows, for the top 5 recipients in 2018, total UK bilateral ODA from 2009 onwards. Spend to Pakistan increased significantly between 2012 and 2016 from £189 million to £463 million, however, has since decreased to £331 million in 2018. Spend to Syria has also increased significantly over time, from approximately £1 million in 2009 to £352 million in 2016. The apparent reduction in ODA to Syria in 2018 is a result of the reallocation of VPRS as discussed above. Spend to each of Ethiopia, Nigeria and Afghanistan fluctuated year-to-year and increased overall between 2009 and 2018.
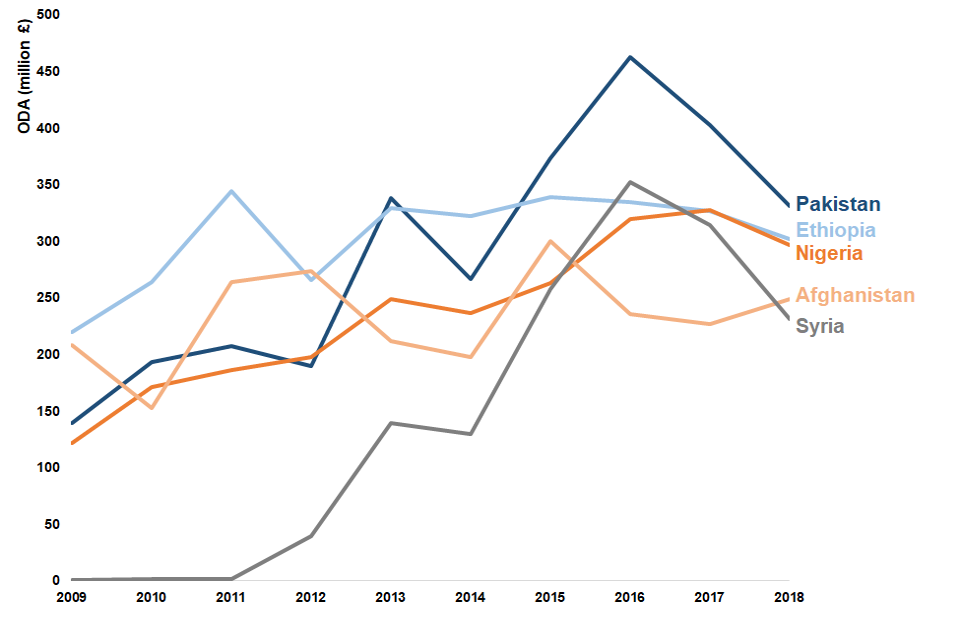
Figure 10
Income groups
ODA eligible countries are classified into 4 groups – Least Developed (LDC), Other Low Income (Other LICs), Lower Middle Income (LMIC) and Upper Middle Income (UMIC) Countries. These are based on gross national income per capita published by the World Bank. The list of countries is reviewed every 3 years by the OECD-DAC. The most recent update was effective from 2018, therefore some trends could be driven by a shift between groups. For example, Jordan was previously classified as Upper Middle Income and is now Lower Middle Income[footnote 27].
- Total UK bilateral ODA to Least Developed (LDC) and Other Low Income (Other LICs) Countries decreased by 11.7% (£330m) to £2,496 million in 2018. This reflects a general reduction in the level of country or region specific spend as well as a slight shift in spend towards Low Middle Income countries (LMICs)
- Spending to LMICs represented 32.3% (£1,458m) of UK country specific bilateral ODA in 2018, compared to 27.9% (£1,363m) in 2017. This increase is a result of the reclassification of Kenya in 2018 (recipient of £116m), from Other LIC to LMIC and the reclassification of Jordan (recipient of £138m) from UMIC to LMIC
- Despite the shift to LMIC, LDC and Other LIC continue to account for the largest proportion of bilateral ODA spend in 2018 – at 55.3% of UK country-specific spend
- Spending to UMICs represented 12.4% in 2018 compared to 14.2% in 2017, again reflecting the reclassification of Jordan from UMIC to LMIC
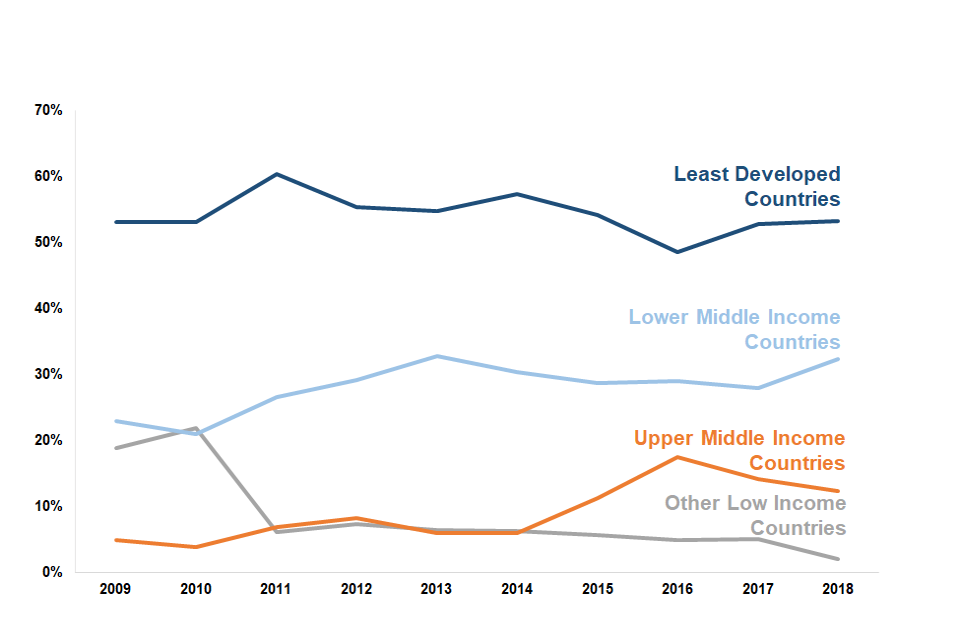
Figure 11
DFID is the main spender of UK bilateral country-specific ODA (£3,630m or 80.4%). The majority (62.5%) of DFID’s spend went to Least Developed or Other Low Income Countries in 2018. Non-DFID contributors spent £883 million in 2018, 38.1% of which went to LMICs, 36.2% to UMICs and 25.7% to Least Developed or Other Low Income Countries. This is illustrated in Figure 12.
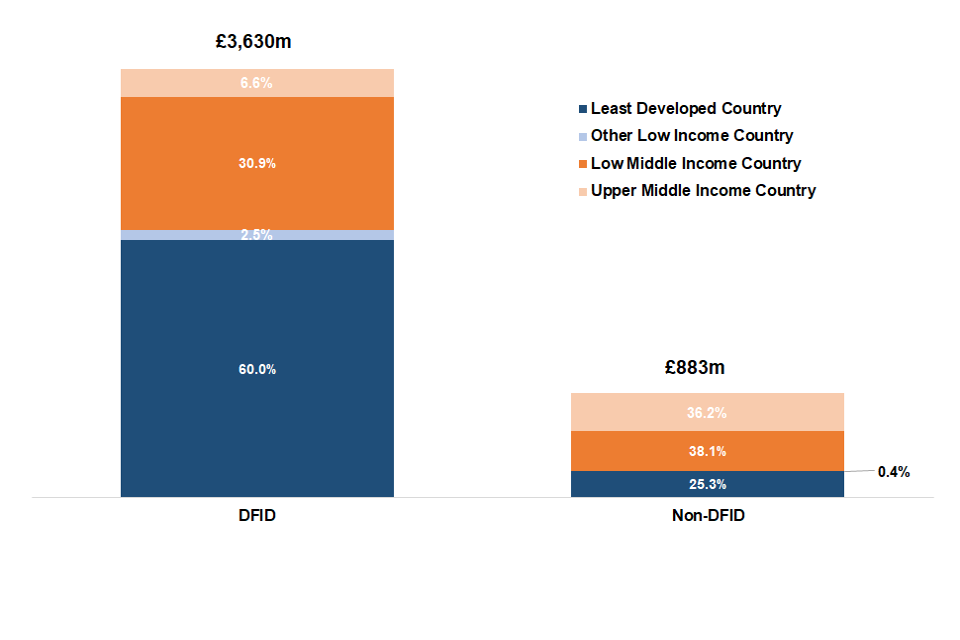
Figure 12
Bilateral ODA Spend by Region and Government Department and Other Contributors of UK ODA[footnote 28].
In 2018, 94.7% of DFID’s regional-specific bilateral ODA went to countries in Africa and Asia (£3,962m). Africa has consistently been the largest recipient of DFID region-specific ODA since 2010, with a share of 57.7% in 2018 (see Figure 13).
By contrast, the largest recipient of non-DFID region-specific ODA is generally Asia. In 2018, non-DFID ODA contributors spent £690 million in Asia, accounting for 46.8% of their total spend. Non-DFID contributors also spent a larger proportion of their ODA in Europe and the Americas (22.7%), compared to DFID (5.2%).
Figure 13 also shows the regional breakdown of DFID and Non-DFID bilateral ODA in 2014 for comparison. There has been an increase in the proportion of ODA going to the Americas and Europe, particularly from non-DFID contributors. Combined the Americas and Europe accounted for 14.1% of non-DFID bilateral ODA in 2014 and 22.7% in 2018.
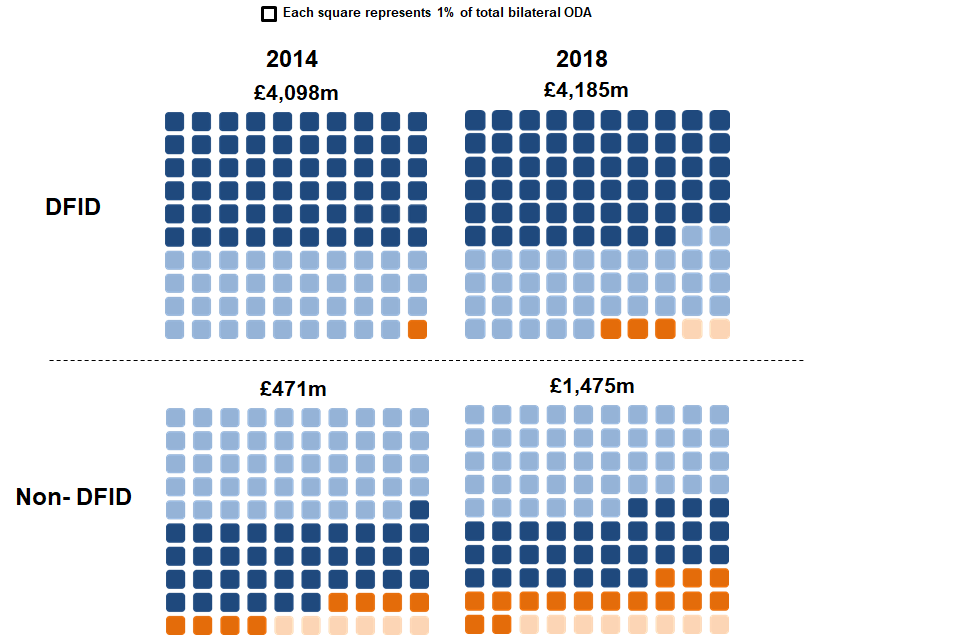
Figure 13
Figure 14 below shows:
- DFID provides most of its ODA to priority countries in Sub-Saharan Africa and Asia
- Other UK Government Departments and other contributors of ODA provide their ODA in smaller amounts to a much larger spread of countries across the world. In 2018, non-DFID contributors provided ODA to 150 countries and regions, compared to 56 for DFID
- DFID’s contribution to Asian countries is concentrated in the Middle East region and south and central Asia. Non-DFID sources contribute to Asian countries across the whole region
- A similar trend is seen in Africa – DFID spend is concentrated mainly on central, southern and eastern Africa while non-DFID spend is more spread across the region
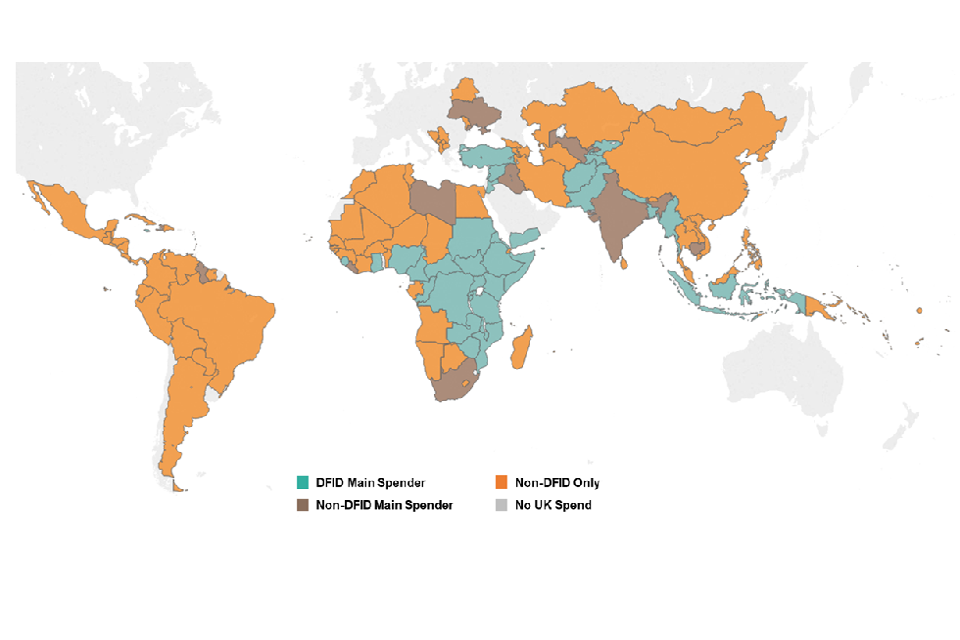
Figure 14
Bilateral ODA Spend with No Single Benefitting Country or Region
In 2018, 38.9% (£3,603m) of UK bilateral ODA was made up of spend that was not assigned to a single benefitting country or region (i.e. developing country, unspecified ODA). This is an increase compared to 2017 when 33.0% (£2,902m) of bilateral ODA was not assigned to a single benefitting country or region. Such spend comprises of, for example, centrally-funded research and other global public goods or programmes that develop policies that aim to benefit several developing countries. It also consists of ODA-eligible expenditure within donor countries, such as costs to support asylum seekers in the UK. See the case study on page 34 for more information on developing country, unspecified ODA.
- 43.1% of spend within this category consists of project-type interventions and includes expenditure on multi-country or multi-region projects. As outlined above, these include programmes where there are designated benefitting countries or regions, but it is not possible to directly assign exact spend to them in the current administrative system[footnote 29]
- 21.6% of the unspecified ODA was allocated to supporting international development work and refugees in the UK or another donor country, while 13.9% was for specific programmes or funds managed by international organisations in a specific sector with no designated benefitting countries. For example, in 2018 DFID contributed to the Global Partnership for Education, a multilateral organisation supporting close to 70 developing countries to ensure that every child receives a quality basic education
- A further 10.1% consists of core support to Non-governmental Organisations (NGOs) or other delivery partners, such as research institutions, where funds are not earmarked for a particular country/region and work may benefit a wide range of developing countries
Figure 15: Breakdown of UK Bilateral ODA, 2018.[footnote 30]
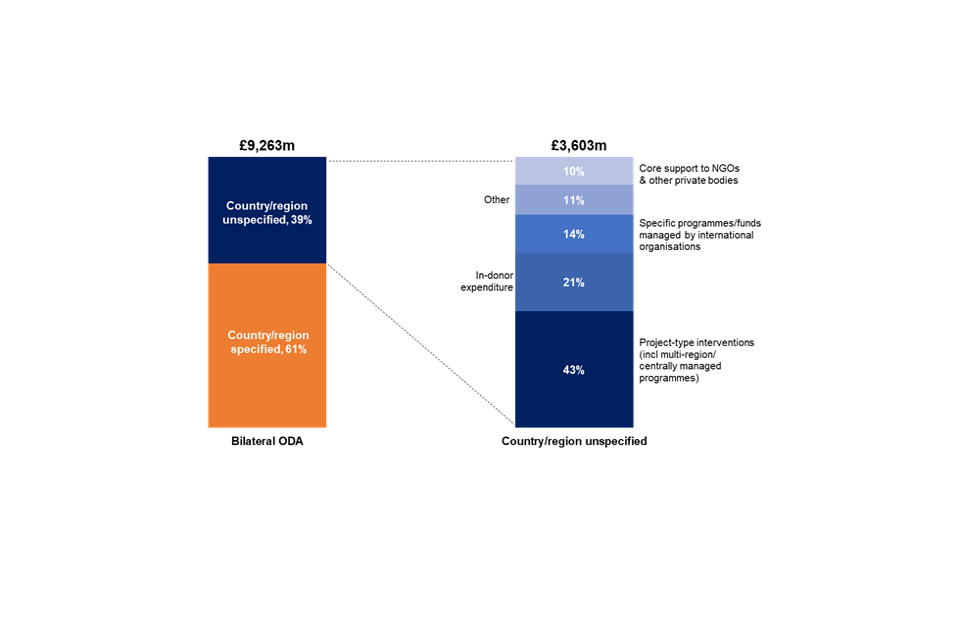
Figure 15
View full size version of infographic: Case Study: UK ODA ‘Developing Country Unspecified’
Broad Sector Breakdown of Bilateral ODA Spend
Bilateral ODA spend by sector in 2018
UK ODA can be classified into broad sectors depending on its purpose, e.g. the social, economic or humanitarian assistance area it aims to support. Each broad sector summarises a number of sector codes; these are more specific areas that underlie the broad sector. See Annex 1 for more information on what is included in each broad sector. From 2018, a single project can allocate spend to one or more broad sectors.[footnote 31]
Figure16 provides an overview of bilateral ODA by broad sector in 2018 and a more detailed breakdown of the sectors is given in Additional Table A7. The 5 largest sectors for bilateral spend in 2018 were:
-
Multisector/Cross-Cutting - £1,329 million (14.3%). Within this broad sector the top 3 spending areas were Multisector Aid (£329m), Research or Scientific Institutions (£300m) and Environmental Policy and Administrative Management (£240m). For example, Gift Aid payments (of which there was £148 million in 2018) are assigned Multisector Aid to reflect the diverse sectors within which NGOs operate.
The largest recipient of Multisector/Cross cutting ODA was ‘Developing Countries Unspecified’ (£708m), this reflects that research and environmental policy will often benefit more than 1 developing country. This broad sector saw a £139 million increase in spend in 2018 compared to 2017, largely due higher spend allocated to urban development and management and environmental sector codes. -
Health - £1,323 million (14.3%). This was an increase of £30 million compared to 2017, due to increased spending by Department of Health and Social Care. Within Health, the top 3 spending areas in 2018 were Medical Research (£346m), Family Planning (£175m) and Health Policy and Administrative Management (£171m).
-
Humanitarian Aid - £1,299 million (14.0%). The top 3 recipients of Humanitarian Aid spend were Syria (£160m), Yemen (£148m) and Democratic Republic of the Congo (£105m). This broad sector has seen the largest decrease in 2018 compared to 2017 (£155m), the first decrease in humanitarian spend over the past 5 years. This is discussed in detail on page 41.
-
Government and Civil Society - £1,195 million (12.9%). This sector includes the top 3 spending areas Civilian Peace-Building, Conflict Prevention and Resolution (£277m), Public Sector Policy and Administrative Management (£158m) and Media and Free Flow of Information (£105m). Compared to 2017, Government and Civil Society had an increased spend of £31 million in 2018.
-
Economic Infrastructure and Services - £1,134 million (12.2%). This sector includes Financial Policy and Administrative Management (£551m), Business Policy and Administration (£115m) and Energy Generation, Renewable Sources (£93m). This broad sector saw the largest increase in 2018 compared to 2017 of £361 million, largely due to increased spending in financial policy and administrative management (£268m increase compared to 2017). The year-on-year change also reflects an increase in spend through CDC for equity and debt investments in companies developing projects delivering infrastructure services in developing countries, including power and telecoms.
The percentage share of total bilateral ODA of the 5 largest broad sectors in 2018 was 67.8%, broadly unchanged from 2017 (66.7%). Outside of the top five sectors by bilateral spend, the largest changes between 2017 and 2018 were Administrative Costs of Donors (increased by £115 million) and Education (decreased by £99 million).
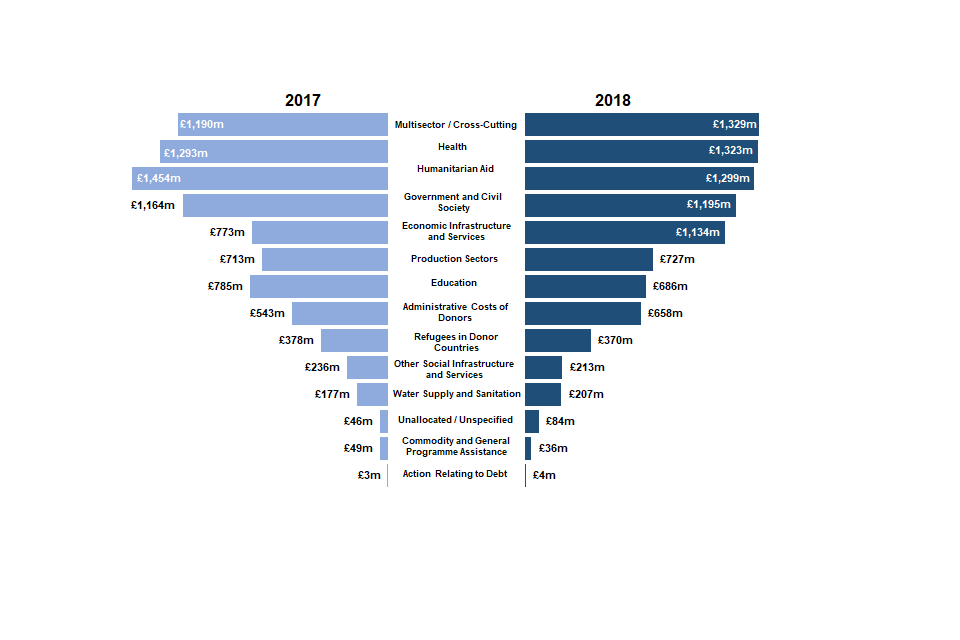
Figure 16
Figure provides a breakdown of sector spend by DFID and all Other Government Departments and other contributors of ODA (non-DFID).
- For DFID, the sector spend profile reflects greater spend on the social and disaster response sectors, such as ‘Humanitarian Aid’ (£1,287m) and ‘Health’ (£1,056m). DFID also contributed £1,031 million on ‘Economic Infrastructure and Services’
- Non-DFID spend is on a smaller scale and has a sector profile that reflects a greater spend in broad sector areas such as research and policy, the top being ‘Multisector / Cross Cutting’ (£786m). Non-DFID departments account for the total spend on ‘Refugees in Donor Countries’ (£376m) as they are responsible for supporting refugees based in the UK. This spend consists of ODA eligible support for refugees in their first year of stay in the UK, such as food and shelter
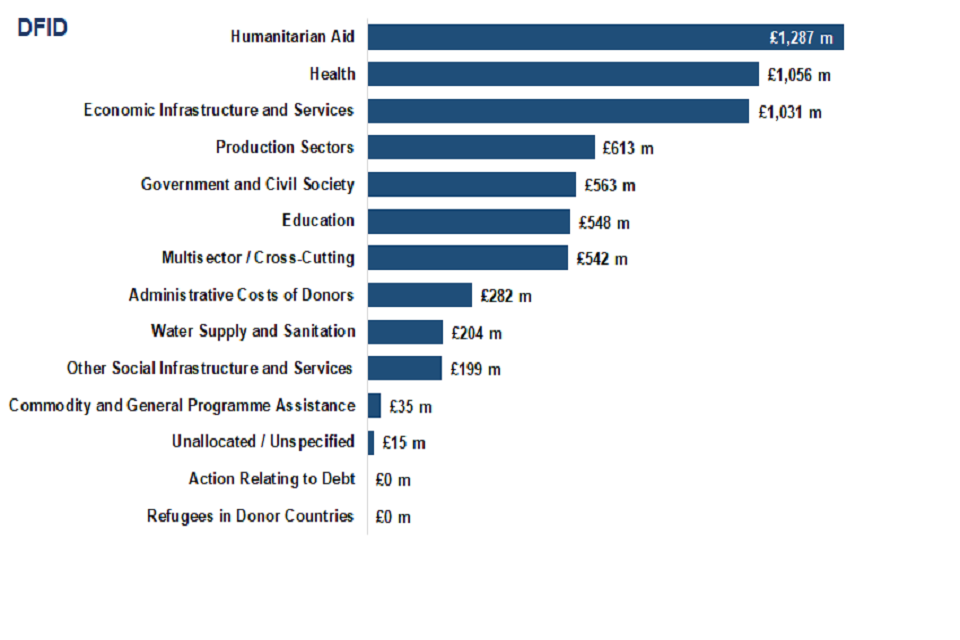
Figure 17 part 1
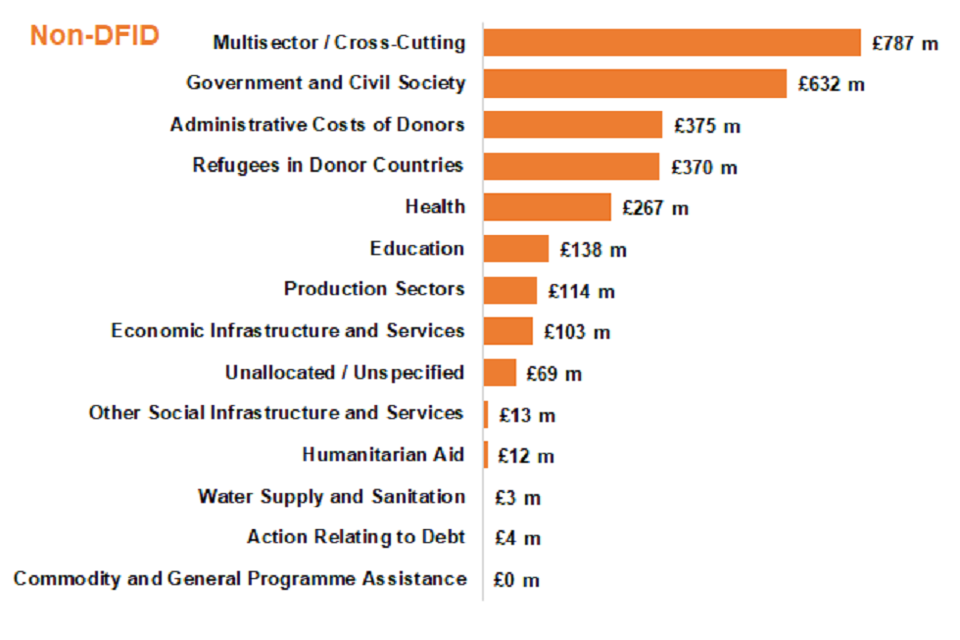
Figure 17 part 2
Broad Sector Breakdown of Bilateral ODA Spend by top 10 recipients of UK bilateral ODA
Figure18 provides a breakdown of the top 10 recipient countries of UK bilateral ODA in 2018, and the highest spending sector in each year since 2014.[footnote 32]
- Some countries in the top 10 have a consistent highest sector year on year (e.g.Pakistan, Syria, Yemen and Afghanistan), while for others the sectors tend to change (e.g. Ethiopia, Tanzania, Bangladesh)
- ‘Humanitarian Aid’ was the sector which received the highest UK ODA in 7 countries out of the top 10 for 2018, increasing by one country since 2017
- In Pakistan, ODA spend on ‘Education’ has been consistently highest over the past 5 years (over £100m per year)
- In Ethiopia, ‘Humanitarian Aid’ has now been the largest sector spend since 2017, in response to drought affected areas, giving access to food assistance, water and health services. Before 2017 the highest broad sector spend in Ethiopia varied
- The highest spend sector in Nigeria has shifted to ‘Humanitarian Aid’ from ‘Health’, in response to the crisis in the North East of Nigeria
- Over the past 5 years in Afghanistan the highest sector spend has consistently been on ‘Government and Civil Society’, this is largely driven by contributions to a Reconstruction Trust fund
- Democratic Republic of Congo became a top ten recipient of UK bilateral ODA in 2018 due to the increase in ‘Humanitarian Aid’ spend which has been the highest sector in the country for the last 2 years. Prior to 2017, ODA spend was greatest in ‘Health’
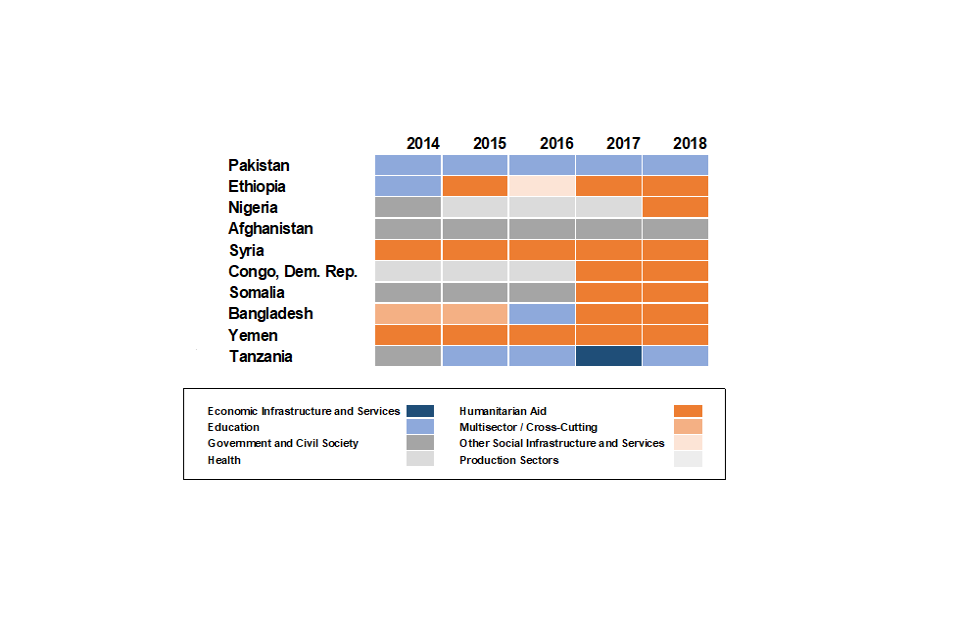
Figure 18
View full size version of infographic: Case Study: Humanitarian ODA
Multilateral Funding
UK Multilateral Funding by Organisation
Multilateral organisations[footnote 33] are an essential part of the international system for humanitarian and development ODA. The UK works with a wide range of organisations, for example to respond to humanitarian need, to develop infrastructure to support economic growth, or to ensure that particular diseases are tackled in line with the best available evidence. Multilateral organisations offer economies of scale in their operations and expertise, and often have the mandate and legitimacy to work in politically sensitive situations. Accordingly, they enable individual donor governments, such as the UK, to support development and humanitarian work in a wider range of countries.
For example, the International Development Association (IDA), which is part of the World Bank Group, has been the largest recipient of UK multilateral ODA since 2013. IDA aims to reduce poverty by providing concessional loans and grants for programs that boost economic growth, reduce inequalities, and improve people’s living condition. Its activities include, among others, primary education, basic health services, clean water and sanitation or agriculture and institutional reform.
Table 5 shows the top 20 multilateral organisations that received the most core funding (Multilateral ODA) from the UK in 2017 and 2018.
- The top 5 multilaterals’ shares represented 73.3% of total multilateral ODA in 2018, similar to 2017 (70.4%). In 2014, the top 5 multilateral organisations’ share of UK multilateral ODA was 68.3%. IDA remained the largest recipient of UK multilateral ODA and increased by £600 million from 2017, accounting for over a third of total core contributions to multilaterals in 2018
- Four of the top 5 receiving organisations of UK multilateral ODA in 2018 were among the top 5 multilaterals in 2017. The Global Alliance for Vaccines and Immunization is now in the top 5 recipients of UK multilateral ODA. While the International Monetary Fund – Poverty Reduction and Growth Trust fell from being the 3rd highest recipient of core funding from the UK in 2017 to the 21st highest recipient in 2018[footnote 34]
[Table 5: Top Twenty Recipients of UK Core Funding to Multilateral Organisations (Multilateral ODA[footnote 35] 2017 and 2018](https://assets.publishing.service.gov.uk/government/uploads/system/uploads/attachment_data/file/832372/Table-9.ods)
UK Multilateral Funding by Extending Agency
Table 6 shows multilateral UK ODA in 2017 and 2018 by government agency and delivery channel i.e. by bilateral through multilateral ODA (earmarked funding) and core contributions to multilateral organisations (un-earmarked funding).
Bilateral through multilateral ODA:
- DFID provided 86.6% (£2,422m) of bilateral though multilateral ODA in 2018, a reduction on 2017 when DFID provided 88.1% (£2,320m)
- The Department for Business, Energy and Industrial Strategy (BEIS) remains the largest department other than DFID to provide bilateral through multilateral ODA, accounting for 5.8% (£163m) in 2018
- Other significant contributors of bilateral through multilateral ODA in 2018 included the Conflict, Stability and Security Fund (4.9% or £136m) and Cross-Government Prosperity Fund (1.2% or £33m)
- Since 2014, the share of bilateral through multilateral ODA accounted for by non-DFID contributors has increased from 5.5% (£118m) to 13.4% (£374m) in 2018
Core contributions to multilateral organisations:
- DFID also provides the majority of the UK’s core multilateral ODA, accounting for 85.5% (£4,520m), an increase on 2017 when DFID accounted for 72.1% (£3,791m)
- HM Treasury was the largest non-DFID department to provide core multilateral ODA in 2018, accounting for 1.6% (£83m). The spend was a core contribution to the Asian Infrastructure Investment Bank (AIIB). HM Treasury spent no multilateral ODA in 2017
- The biggest reduction in core multilateral funding was by BEIS. BEIS core contributions accounted for 0.8% (£41m) of UK multilateral ODA in 2018 compared to 2.4% (£128m) in 2017, primarily due to lower contributions to the Green Climate Fund
- Over the last 5 years, the share of UK core funding to multilateral organisations from non-DFID contributors increased from 13.4% (£652 million) in 2014 to 14.5% (£769 million) in 2018
A full breakdown of UK ODA by Government Department and Other Contributors of UK ODA and delivery channel in 2014, 2017 and 2018 is available online in Table 10, and details on the funding of multilaterals in 2017 and 2018 are available online in Additional Table A8.
Table 6: Multilateral funding, by Government Departments and other contributors, 2014, 2017 and 2018[footnote 36]
Multilateral Core Funding and Imputed Multilateral Shares
When DFID or other UK government departments provide core funding to multilateral organisations, the funding is pooled with other donors’ funding and disbursed as part of the core budget of the multilaterals. It is therefore not possible to directly track the use of UK funding for core multilateral purposes. However, to provide an indication of the destination and sector of UK multilateral ODA, overall percentages of ODA disbursements by the relevant multilateral organisations are used to impute a UK estimate.
The UK uses the reported OECD DAC breakdown of ODA disbursements for each multilateral organisation to estimate what percentage of DFID and UK core contributions are spent in each country and sector. Where a multilateral organisation does not report its disbursements to the DAC but the multilateral is only mandated to work in a particular country, region or sector, we allocate all of its core contributions to the relevant country, region or sector. If a multilateral organisation does not report to the DAC but works in multiple sectors and/or countries, then its core contributions are not allocated to a country or sector.
The DAC publish detailed information of the multilaterals’ country and sector spending in December. Because of this timing the latest estimates that are available are for 2017. These shares should be taken as indicative estimates rather than exact amounts of funding, and they are dependent upon multilateral organisations returning disbursement data to the DAC.
The estimates for 2017 can be found in our published Table A9 and A10.
Background Notes
Reporting and monitoring the ODA Spend and the ODA:GNI ratio
UK ODA spend includes DFID spend, ODA spend by government departments other than DFID and other sources of ODA (such as EU attribution and Gift Aid). DFID and HMT monitor spend by other departments and funds and movements in GNI during the year using forecasts published by the independent Office for Budget Responsibility (OBR) to ensure the 0.7% commitment is met. The UK commitment to spend 0.7% of GNI on ODA is reported the year following the spend based on confirmed ODA outturn and GNI estimates published by the Office for National Statistics.
The Office for National Statistics (ONS) publishes revisions to Gross National Income (GNI) estimates as more economic data becomes available. The provisional ODA:GNI ratio was based on the GNI estimate published in March 2019.
The ONS are planning to implement a new methodology framework for calculating Gross Domestic Product (GDP), which will impact GNI. The ONS will start publishing Gross National Income (GNI) estimates under the new methodology from 30 September 2019 (more information can be found on the ONS website). The ODA:GNI ratio for 2018 outlined in this publication uses the most recent GNI estimate available at the time of publication which was published by the ONS in June under the current methodology. This is consistent with the methodology framework in place at the time of our provisional publication.
DFID is responsible for collating data and reporting spend on ODA to the Organisation of Economic Development and Co-operation (OECD), including the 0.7 ODA:GNI ratio commitment.
Difference between Provisional and Final publications
The “Statistics on International Development: Provisional Aid Spend 2018” publication outlines provisional ODA spend information and an estimate of GNI for 2018 published by ONS in March to calculate a provisional estimate of the ODA:GNI ratio. Between the spring and the autumn, the ODA spending of DFID and other government departments are finalised.
As part of this, other government departments will provide project-level data which will have codes that allocate for each project: sectors, delivery partner, type of aid and other key variables. A project title and description are also provided. These extra details allow the ODA spend to be quality assured using guidance from OECD.
The final ODA data and an updated GNI estimate for 2018 released by the ONS in June have been used to calculate the final ODA:GNI ratio in this publication and to report to the OECD. Further information on the data sources, quality and processing of the statistics in this publication are found in Annexes 1-3 on the Statistics on International Development webpage.
What’s changed in this release?
As announced in a previous edition of Statistics on International Development (SID), this publication presents ODA for 2018 on a grant equivalent basis. The grant equivalent methodology affects how the values of official loans disbursed by departments and other contributors are scored as ODA, which is different from the previous cash flow methodology used to present ODA in 2017.
Official loans are those to a developing country or a development organisation such as the multilaterals eligible for unearmarked funding. In 2018, the UK only had one official multilateral loan and a small amount of official loan reflows (from loans to both multilateral and countries).[footnote 37] The effect of this change is:
- In 2018, IMF-PRGT used £26 million (grant equivalent, headline ODA measure for 2018); compared with £726 million (cash flow, headline ODA measure for 2017) in 2017. Comparing cash flows, IMF-PRGT used £83 million of UK ODA in 2018 compared with £726m in 2017
- Official loan reflows are not included under the grant equivalent measure. In 2018, these equated to £18 million
- Private loans (including reflows) are not currently affected by the grant equivalent measure
- Since our only official loan disbursement was to a multilateral, our bilateral time series of country and sector spend is not affected by the grant equivalent measure
- The UK’s commitment to spend 0.7% of Gross National Income is measured on the headline ODA measure for a given year
More information on this change can be found in an explanatory note which has been updated with finalised data and in the OECD reporting directives for ODA.
This year, final SID is being published earlier than in previous years (generally in October or November) as part of efforts to improve the timeliness of our release in line with feedback from users and good practice in producing official statistics. This improvement in timeliness means that this publication predates the forthcoming methodology revision by ONS. DFID will outline plans for future reporting under the new methodology in due course.
In-donor refugee costs
In 2017, the DAC agreed clarifications to the reporting directives on In Donor Refugee Costs to improve consistency, comparability and transparency. Following this, DFID conducted a statistical review of the UK’s ODA reporting in this area of spend. This publication implements the clarifications for 2018 ODA on temporary sustenance for refugees for the first 12 months of stay.[footnote 38] The DAC is currently validating donor methodologies for in-donor refugee costs so further refinements may be made in future.
Calculations for ODA eligible spend on in-donor refugee costs rely on Home Office asylum seeker and refugee data. In 2018, for 6 months daily asylum seeker data was not available due to Home Office transitioning to a new data platform during which an estimation was used.
EU Attribution
The estimate for the UK’s share of the EU ODA budget in 2018 is £951 million compared to £911 million in 2017. EU attribution fluctuates from year to year because the EU works on a 7-year programming cycle and so EU disbursements in a given year can vary. The estimate in 2017 and 2018 is based on published data from the European Commission on the UK’s share of development expenditure.
In Table 3, £27.5 million for the UK’s assessed contribution to ODA eligible EU civilian peacekeeping missions is reported in these statistics by the Conflict, Stability and Security Fund, as the fund responsible for spending. This avoids double counting in Table 3 and the total UK EU attribution is not affected.
Scope
This publication presents information on the UK’s spending on Official Development Assistance (ODA). It includes data from DFID, other government departments and other contributors to UK ODA including the Devolved Administrations. Data relating to both Bilateral and Multilateral ODA are included in the scope of this publication. This publication does not include information on:
- Results achieved in international development through the UK’s ODA spend. This information is published separately found here
- Development Tracker. You can explore details of the individual development projects that the UK is funding by using the Development Tracker. This allows you to filter projects by country and sector and view further details about the project as published in documents such as the business case and annual review. The tracker uses open data on development projects, compliant with the International Aid Transparency Initiative (IATI) standard, to show where funding by the UK Government and its partners is going and ‘trace’ it through the delivery chain
- DFID’s non-ODA development spend. A separate set of tables containing National Statistics for DFID’s Gross Public Expenditure on Development (GPEX) for 2017/18. GPEX statistics show DFID’s gross spending on development, including spending to countries and organisations that are not ODA-eligible. Further information on the definition of GPEX statistics and the difference from ODA can be found in our technical note. GPEX statistics for 2018/19 will be published in Spring 2020
Future developments
The Office for Statistics Regulation (OSR), the regulatory arm of the UK Statistics Authority, has completed a short review of compliance[footnote 39]: of DFID’s Statistics on International Development (SID) against the Code of Practice for official statistics. Which confirmed that SID continues to be designated as National Statistics. OSR’s full findings, published on 18th September, can be found on the UKSA website.
In future versions of “Statistics on International Development”, the production team will look to improve the statistics in line with the recommendations from the OSR.
The OECD DAC is currently reviewing all DAC members methodologies for calculating ODA eligible in-donor refugee costs. The UK submitted its methodology in May 2019 and is engaging with the DAC to validate its methodology. This review may result in future refinements on how this area of spend is reported as ODA.
The UK is participating in the OECD DAC Peer Review process in 2019/20. This is an in-depth investigation of the UK’s development systems and policies. Results of the review are likely to be published April 2020. To understand further what a DAC Peer Review involves please see the OECD guidance.
As mentioned above in 4.1.3, the ONS are planning to implement a new methodology framework for calculating Gross Domestic Product (GDP), which will impact GNI. DFID will outline plans for future reporting under the new methodology in due course.
Uses and users
The main purpose of this publication is to provide timely statistics of ODA expenditure by the UK government. They are published prior to the release of final ODA statistics by the OECD DAC for all OECD members.
During a consultation conducted in 2014, users told us that they use the statistics for a variety of purposes: preparing material for briefs; PQs and public correspondence; inclusion in reports and reviews and providing data for research and monitoring. The users represent the government, civil society and non-government organisations, students and academia and the media.
We are always keen to enhance the value of these statistics and welcome your feedback either via our Statistics User Group or via email statistics@dfid.gov.uk.
Data Quality
Calendar year financial transaction data are used to compile UK ODA spend statistics. These are extracted from DFID’s ARIES database, and the detailed data is subject to input errors from spending teams. The risk of input error is relatively low for estimates of total spend, and by country/region, and relatively higher for spending by sector (where there is sometimes ambiguity, especially for projects or programmes that cut across sectors) and by funding channel. The quality assurance Annex 3 describes the steps that have been taken by DFID statisticians to minimise these kinds of input errors, and to produce UK ODA statistics.
The figure presented for the Welsh Assembly Government represents their estimated spend for the financial year 2018/19 and are used as a proxy for their calendar year 2018 spend. The Scottish Government have reported calendar year for the first time for 2018 spend. This figure has been adjusted to ensure that there is no double counting with financial year 2017/18 which was used as a proxy for calendar year 2017 spend.
Data Revisions
DFID data for this publication is based on an extract of the ARIES database taken in June 2018, after the end of the calendar year 2018 and financial year 2018/19. Other Government Department data are collected during May and June, and are quality assured over the summer. Where we do have to revise information included in this publication, we will follow the procedures set out in our revisions policy.
Publication Cycle
DFID releases 2 editions of Statistics on International Development over the year:
- Provisional UK Aid spend will be published in the spring and includes a preliminary estimate of the UK’s ODA:GNI ratio for the previous calendar year. The latest edition of this publication can be found on GOV.UK
- Final UK Aid spend is usually published in the autumn. This publication confirms the UK’s ODA:GNI ratio for the previous year, as well as including more detailed analysis of the UK’s Bilateral and Multilateral ODA, and includes the microdata used to produce the publication.
Related Statistics and Publications
- DFID’s Annual Report provides information on DFID’s results achieved, spending, performance and efficiency, and the OECD DAC aid statistics;
- Other related publications include the 0.7% ODA:GNI target.
National Statistics
The United Kingdom Statistics Authority has designated these statistics as National Statistics, in accordance with the Statistics and Registration Service Act 2007 and signifying compliance with the Code of Practice for Statistics. Designation means the statistics carry the National Statistics label and conform with the standards summarised in the box below:
National Statistics Status
Contact Details
For enquiries (non-media) about the information contained in this publication, or for more detailed information, please contact:
Alice Marshall
Telephone: 01355 84 36 51
E-mail: statistics@dfid.gov.uk
DFID statistics on GOV.UK For media enquiries please contact the DFID Press Office on +44 (0) 20 7023 0600. For further information on development issues and DFID policies, please contact the Public Enquiry Point on 0845 300 4100.
Listing of main activities of UK Government Departments and other contributors of UK ODA other than DFID in 2018
| Non-DFID Government Department or other contributor of UK ODA | Main ODA funded activity in 2018 |
|---|---|
| Department for Business, Energy and Industrial Strategy (BEIS) | BEIS’s ODA is spent on International Climate Finance, jointly managed with DFID and DEFRA. This spending is helping developing countries reduce their emissions in line with the ambition set out in the Paris Agreement. It supports them to deal with the impacts of climate change by building their capacity to act themselves and by catalysing large scale public and private finance investments. BEIS funding supports large scale mitigation projects in the following thematic areas: making markets work; halting deforestation, and accelerating decarbonisation. BEIS also manages the Newton Fund and Global Challenges Research Fund (GCRF). The Newton Fund sup ports bilateral and regional research and innovation partnerships between the UK and selected middle income countries. The aim of this is to address specific global development challenges and build science and innovation capacity. GCRF provides dedicated funding to research focused on addressing global challenges which most significantly impact upon developing countries. It achieves this by supporting challenge-led disciplinary and interdisciplinary research, strengthening capability for research and innovation within developing countries, and providing an agile response to emergencies. |
| Foreign and Commonwealth Office (FCO) | The FCO uses its ODA budget to support and deliver the strategic objectives of the government’s 2015 Aid Strategy, which aligns the government’s global efforts to defeat poverty, tackle instability and create prosperity in developing countries. This includes both ODA activity delivered directly by the FCO, and grants to external organisations to deliver on its behalf. The International Programme delivers a range of interventions in ODA-eligible countries including in support of Human Rights, Democracy and the Rules Based International System, Open Futures, and Strengthening Maritime Security, supporting wider FCO diplomatic efforts and foreign policy overseas. Frontline Diplomatic Activity includes project facilitation costs covering planning, implementation and resources as part of ODA projects across the globe, in accordance with the OECD DAC criteria. FCO spend also includes ODA-eligible core contributions to multilateral organisations, and support to Wilton Park conferences, the International Leaders Programme, the Great Britain-China Centre (GBCC), the Westminster Foundation for Democracy (WFD) and Chevening scholarships. The FCO supports the British Council’s work overseas with UK and local partners to deliver ODA programmes in developing economies. It also supports the BBC World Service to provide accurate, impartial and independent news and analysis to developing, fragile and closed societies across the globe, including where free speech is limited. |
| Conflict, Stability and Security Fund (CSSF) | CSSF’s main activities in 2018 were: tackling conflict and building stability overseas; improving capacity and accountability of security and justice actors; strengthening the rules-based international order and its institution, including women, peace and security; economic development; tackling serious and organised crime; preventing violent extremism. CSSF focus countries include Afghanistan, Iraq, Syria, Pakistan and Lebanon. |
| EU Attribution (non-DFID) | The estimate for the non-DFID share of the EU ODA budget. EU attribution fluctuates from year to year because the EU works on a 7-year programming cycle and so EU disbursements in a given year can vary. Non-DFID EU contributions include ODA eligible spend in peace, security, democracy, human rights and civil society. |
| Home Office (HO) | In-donor spend on support to asylum seekers and the resettlement of vulnerable people. This primarily is linked to food and shelter for up to 12 months. Work upstream in ODA countries to build capacity and capability in recipient countries in order to improve security, protect children and tackle modern slavery. |
| Department of Health and Social Care (DHSC) | The Department of Health and Social Care pays an annual subscription to the World Health Organisation (WHO) – a proportion of which is ODA eligible. DHSC funds research for low- and middle-income countries through the National Institute for Health Research and provides funding to the Fleming Fund which aims to improve data and surveillance of Antimicrobial Resistance (AMR). DHSC ODA also includes support to asylum seekers for the first 12 months for the provision of ODA eligible publicly-financed health services. |
| Gift Aid | The ODA eligible proportion of Gift Aid claimed by UK based international development charities. To understand more about ODA eligible Gift Aid, please see methodology note. |
| Cross-Government Prosperity Fund | The Prosperity Fund is an innovative cross-government fund, focused eligible middle income countries and emerging economies. It supports the UK’s aim of promoting global prosperity, creating the broad-based and inclusive growth needed for poverty reduction, contributing to the UN Sustainable Development Goals. The highest spending programme (£18.8m) was AIIB’s Special Fund which provides technical assistance and consultancy to Asian developing countries (including India, Indonesia, Myanmar, Pakistan, Vietnam, Bangladesh and Nepal) to help prepare high-quality infrastructure projects for AIIB financing. |
| HM Treasury (HMT) | HMT ODA relates to a core contribution to the Asian Infrastructure Investment Bank (AIIB) and development-related administrative costs. |
| Department for Environment, Food and Rural Areas (DEFRA) | DEFRA’s ODA spend delivers against international climate, biodiversity and development objectives. Its International Climate Finance seeks to deliver climate mitigation and adaptation benefits focused on protecting the world’s most biodiverse forests, promoting sustainable livelihoods through improved land use and agricultural practices, and contributing to global food security. Defra’s ODA spend also supports the conservation and sustainable management of natural resources and biodiversity, both terrestrial and marine, through initiatives including the Darwin Initiative and the Illegal Wildlife Trade Challenge Fund. Defra’s ODA programming supports the delivery of all four UK Aid Strategy objectives by strengthening global peace, security and governance, strengthening resilience and response to crises, promoting Global Prosperity and tackling extreme poverty and helping the world’s most vulnerable. |
| BBC World Service | BBC World Service contributes to the BBC’s international news mission to address the global gap in provision of trusted news by broadcasting and distributing accurate, impartial and independent news and analysis in developing countries. The BBC World Service aims through journalism to contribute to accountability and good governance and improve the welfare and economic development of citizens in developing countries. |
| IMF – Poverty Reduction and Growth Trust Fund (IMF-PRGT) | UK core contribution to IMF-PRGT. The IMF-PRGT supports low income countries, such as Afghanistan and Sierra Leone, with macroeconomic assistance. |
| Department for Work and Pensions (DWP) | DWP pays an annual core contribution to the International Labour Organisation (ILO), of which 60% scores as ODA. DWP spend also includes ODA-eligible benefits to refugees within the first 12 months of stay in the UK as part of the Vulnerable Persons Resettlement (VPR) programme. |
| Cabinet Office (CO) | In April 2018, the UK hosted the Commonwealth Heads of Government Meeting (CHOGM) where leaders from Commonwealth countries gathered to reaffirm their common values, address shared global challenges and agree how to create a better future for all, especially the young. Cabinet Office’s ODA relates to relevant eligible costs such as supporting attendance of ODA eligible countries delegates and the share of activities which had for main objective to address the specific challenges and needs of developing countries for example |
| Department for Education (DfE) | DfE’s ODA covers support of asylum seekers in the first 12 months after they make a claim for asylum in the UK. This support relates to the provision of publicly-funded education services for asylum seekers of compulsory school age. |
| Scottish Government | The Scottish Government, though its £10m pa International Development Fund, supports development work in its partner countries Malawi, Zambia, Rwanda and Pakistan, in pursuit of the Global Goals. A separate £1m Humanitarian Emergency Fund also provides humanitarian funding to support crises as they occur, including during 2018 emergency aid for people affected by conflict in Syria, Yemen and South Sudan, and to support those affected by the Indonesia tsunami. Finally, the Scottish Government’s Climate Justice Fund helps tackle the effects of climate change in the poorest, most vulnerable countries, with a £3m budget. |
| HM Revenue and Customs (HMRC) | HMRC supports developing countries revenue authorities to improve their tax administration functions and tax policies to increase revenue collection, providing economic integration, stability and growth. Provision of technical assistance in tax policy and administration issues to support the strengthening of tax systems in developing countries. Delivery of leadership and tax audit training to tax administration officials from developing countries. |
| Department for Digital, Culture, Media and Sport (DCMS) | DCMS’s Cultural Protection Fund supports developing countries, mainly in Middle Eastern conflict zones, to protect and restore their cultural heritage. |
| Other In-donor Refugee Costs | Education (for compulsory school age) and healthcare for asylum seekers based in Scotland, Wales and Northern Ireland. Only asylum seekers within the first 12 months after they make a claim for asylum in the UK are included. |
| Ministry of Defence (MoD) | MoD ODA spend includes training in human rights, rule of law, international humanitarian law, protection of civilians in conflict, maritime law, and the UK Hydrographic Office support to developing countries in maritime charting. |
| UK Export Finance (Export Credits Guarantee Department) | The ODA reported for 2018 covers the UK debt forgiveness for Cuba, arising from the activities of UK Export Finance (UKEF). |
| Colonial Pensions administered by DFID | Pension payments made to ex-members of the UK Overseas Civil Service who were employed directly by developing country governments. |
| Welsh Assembly | The Welsh Assembly supports the Wales for Africa programme, which aims to help deliver the Sustainable Development Goals. It also provides small grants to organisations based in Wales to promote development awareness. |
| Office for National Statistics | Office for National Statistics technical assistance to build capacity of statistical systems in developing countries. |
-
https://www.gov.uk/government/statistics/statistics-on-international-development-provisional-uk-aid-spend-2018 ↩
-
European System of Accounts ↩
-
See commitments made by the UK and other donors at the 2005 G8 Summit in Gleneagles ↩
-
The multilateral must be on the OECD DAC list of eligible multilaterals in order to receive unearmarked funding. The list also states want proportion of a core contribution to each multilateral can be counted as ODA ↩
-
Cash flows were the ODA headline measure before 2018 ODA ↩
-
For more information see background note 4.1.5 ↩
-
See section 1.2 for more information ↩
-
For information on the NSC, please see: https://www.gov.uk/government/groups/national-security-council ↩
-
For more information on the Cross-Government Prosperity Fund please see: https://www.gov.uk/government/publications/cross-government-prosperity-fund-programme ↩
-
To illustrate the impact of using provisional figures, DAC members’ provisional ODA for 2017 was £113.8 billion. This increased to £114.8 billion for final ODA for 2017 – an increase of 0.9 per cent ↩
-
The EU is also a DAC member but has not been included in this chapter. ↩
-
Real terms figures have been adjusted for exchange rates and inflation ↩
-
This analysis is from the OECD, for more information: http://www.oecd.org/dac/financing-sustainable-development/development-finance-data/ODA-2018-detailed-summ ary.pdf ↩
-
Statistics on International Development, Final UK Aid Spend, 2017, p17, [Figure 5](https://assets.publishing.service.gov.uk/government/uploads/system/uploads/attachment_data/file/771136/Statistics-on-International-Development-Final-UK-Aid-Spend-2017-jan-revisions.pdf ↩
-
Figure 5 is based on the provisional 2018 ODA data from all 29 DAC member countries, except the UK for which final 2018 ODA data is used ↩
-
Iraq = 4.7 per cent; India = 4.5 per cent; Jordan = 4.2 per cent; Vietnam = 0.6 per cent
↩ -
As defined on the OECD DAC list of ODA-eligible international organisations ↩
-
For some multi-country/region programmes, the current administrative system does not allow recording of spend by individual recipients. Improvements to the system are being considered but for this publication, where this is the case spend is reported as bilateral ODA spend with no single benefitting country or region (section 3.1.4). ↩
-
The Global Partnership for Education is an example of a sectoral-specific fund where amounts allocated to countries is not known in advance ↩
-
More information on UK humanitarian ODA to Somalia in 2017 can be found on gov.uk article ↩
-
European countries that received ODA in 2018 were: Albania, Belarus, Bosnia-Herzegovina, Former Yugoslav Republic of Macedonia, Kosovo, Moldova, Montenegro, Serbia, Turkey and Ukraine ↩
-
The overall reduction in bilateral ODA to Pakistan in 2018 was £71m. There was a £23m reduction in support to the Punjab Education Fund and a £54m reduction in spend on the Pakistan Economic Corridors Programme ↩
-
DFID Democratic Republic of Congo Profile: July 2018](https://assets.publishing.service.gov.uk/government/uploads/system/uploads/attachment_data/file/723135/Democratic-Republic-Congo-July-2018.pdf) ↩
-
The Vulnerable Person’s Resettlement Programme accounted for £114m of UK bilateral ODA in 2017, all of which was attributed to Syria. In 2018, the programme accounted for £104m and was attributed to developing country, unspecified. The overall reduction in bilateral ODA to Syria between 2017 and 2018 was £83m. ↩
-
For breakdowns of spend to the top 20 recipients, see Table 6 on the publication landing page. ↩
-
Income group classifications can be found on the [OECD website](http://www.oecd.org/dac/financing-sustainable-development/development-finance-standards/DAC_List_ODA_Recipients2018to2020_flows_En.pdf ↩
-
Please see Table C5 in Excel Tables: Statistics on International Development 2018 for underlying data. ↩
-
We are investigating whether geocoded data in DFID’s system will allow multiple benefitting countries and regions to be recorded in these statistics ↩
-
Totals may sum to more than 100 per cent due to rounding. ↩
-
The OECD DAC methodology changed in 2017 to allow reporting of spend against multiple broad sectors, and this approach is used throughout this section. Prior to this, the methodology required that all spend for a given project be reported against the sector in which the largest percentage of spend occurred. With this methodology change, 2018 data are not directly comparable with those prior to 2017, and so the focus will be on the sector breakdown of bilateral ODA spend in 2018 rather than trends over time ↩
-
While the breakdown in 2018 is not directly comparable to that for the years prior to 2017 due to the methodology change described above, it is illustrative of the trend in sector spending between 2014 and 2018. ↩
-
Defined as ODA-eligible multilateral organisations for core (unearmarked) contributions by the OECD DAC, see http://www.oecd.org/dac/stats/annex2.htm ↩
-
For further information see section 3.1.3 ↩
-
The UK may also provide funding to these organisations for specific programmes, which would be recorded as bilateral spend through a multilateral organisation. ↩
-
“z” is not applicable, “0” is null and “~” is less than half the smallest unit displayed. Only departments and other contributors with 2018 core multilateral or bilateral through multilateral ODA have been included. For a full breakdown of UK-ODA by government department and other contributors to UK ODA by delivery channel for 2014, 2017 and 2018 please see table 10. ↩
-
Official loans to developing countries are known as Sovereign Loans. ↩
-
For more information please see Statistics on International Development: Final UK Aid Spend 2017, p45-46 and Statistics on International Development: Provisional UK Aid Spend 2018, p13 ↩
-
[https://www.statisticsauthority.gov.uk/osr/what-we-do/compliance-checks/] ↩