Statistics on International Development: Provisional UK Aid Spend 2018
Published 4 April 2019

© Crown copyright 2019
This publication is licensed under the terms of the Open Government Licence v3.0 except where otherwise stated. To view this licence, visit nationalarchives.gov.uk/doc/open-government-licence/version/3 or write to the Information Policy Team, The National Archives, Kew, London TW9 4DU, or email: psi@nationalarchives.gov.uk.
Where we have identified any third party copyright information you will need to obtain permission from the copyright holders concerned.
This publication is available at https://www.gov.uk/government/statistics/statistics-on-international-development-provisional-uk-aid-spend-2018/statistics-on-international-developmentprovisional-uk-aid-spend-2018
About this release
This publication provides provisional statistics about the amount of Official Development Assistance (ODA) the UK provided in 2018, including UK ODA as a percentage of Gross National Income (GNI) (the ODA:GNI ratio) and various other breakdowns of ODA spend. ODA[footnote 1] is the internationally-agreed classification of foreign aid financing and is measured in accordance with international standards.
Key Definition: Official Development Assistance
Official Development Assistance (ODA) is produced according to standardised definitions and methodologies controlled by the Organisation for Economic Cooperation and Development (OECD). ODA is defined as resource flows to developing countries and multilateral development institutions, which are provided by official agencies (e.g. the UK Government) or their executive agencies, where each transaction meets the following tests:
- administered with the promotion of the economic development and welfare of developing countries as its main objective
- concessional (i.e. grants and soft loans)
The spend figures in this publication are provisional and based on summary data with limited sector and geography breakdowns. Figures for 2018 are presented on a grant equivalent basis, which is the new standard for reporting headline ODA figures and primarily affects the value of loans in ODA[footnote 2]. GNI estimates are complied by the Office of National Statistics (ONS) and are revised each quarter as more economic data becomes available[footnote 3]. A final estimate of UK ODA, the ODA:GNI ratio and more detailed breakdowns of spend will be published in autumn 2019 in ‘Statistics on International Development’ (SID) which will be available on ‘Statistics at DFID’ . More information about the UK governments approach to aid spending is set out in the UK aid: tacking global challenges in the national interest.
The ODA:GNI commitment of 0.7% was first agreed internationally in 1970 by the United Nations General Assembly. The UK government made a commitment to invest 0.7% of GNI on ODA from 2013. In 2015 the International Development (Official Development Assistance Target) Act placed the commitment to spend 0.7% of GNI on ODA in UK law from 2015 and in each subsequent calendar year.
Key Points
- The provisional ODA:GNI ratio for 2018 is 0.70%
- in 2018 the amount of ODA provided by the UK Government was £14,546 million. This represented an increase in the headline of £487 million, up from £14,059 million in 2017
- ODA can be bilateral (where the donor has earmarked spend for a specific country, activity, project or programme) or multilateral (where funds from national governments are pooled with other donors’ funding and disbursed as part of the core budget of the multilateral organisation for ODA eligible activity). In 2018 UK bilateral ODA was £9,242 million while UK multilateral ODA was £5,304 million
- in 2018, 63.5% of UK ODA was bilateral; 36.5% was core multilateral contributions – this percentage split is broadly similar to that reported in 2017
- The Department for International Development provided 74.9% of total UK ODA in 2018, up from 71.9% in 2017. The share of other UK ODA contributors (this includes other Government Departments and non-departmental contributors) was 25.1%, down from 28.1% in 2017
- Statistics on bilateral ODA by geographic region are currently only available for DFID spend. As a percentage of DFID’s bilateral country or region-specific spending, Africa received the largest share (57.5%) in 2018, representing £2,385 million. Africa’s share fell marginally compared with 2017, when Africa received £2,594 million (it was 58.6%)
The ODA:GNI Ratio
The ODA:GNI ratio presents UK Official Development Assistance (ODA) spend against UK Gross National Income (GNI).
Table 1 shows that in 2018:
- the ODA:GNI ratio is 0.70%. The commitment to spend 0.7% of GNI on ODA has been met
- UK ODA was £14,546 million, an increase of £487 million (3.5%) on 2017
Table 1: UK GNI Estimates, total UK ODA and ODA:GNI Ratios; Current Prices (£ millions) 2017 and 2018.
Figure 1 shows the trend in UK ODA since 1970. Overall there has been a steady increase in the level of UK ODA since 1970, with a spike in 2005 and 2006 which was driven by high levels of debt relief[footnote 5], and then a steep increase in 2013 when the UK Government first met the 0.7% ODA:GNI target.
The jump in the level of ODA in 2016 reflects ONS’s switch to the European System of Accounts (ESA) 2010 methodology for measuring GNI and the consequent need to increase UK ODA to meet the 0.7% ODA commitment. In 2018, ODA is measured on a grant equivalent basis for the first time, which affects loans:
Figure 1: UK ODA Levels between 1970 and 2018
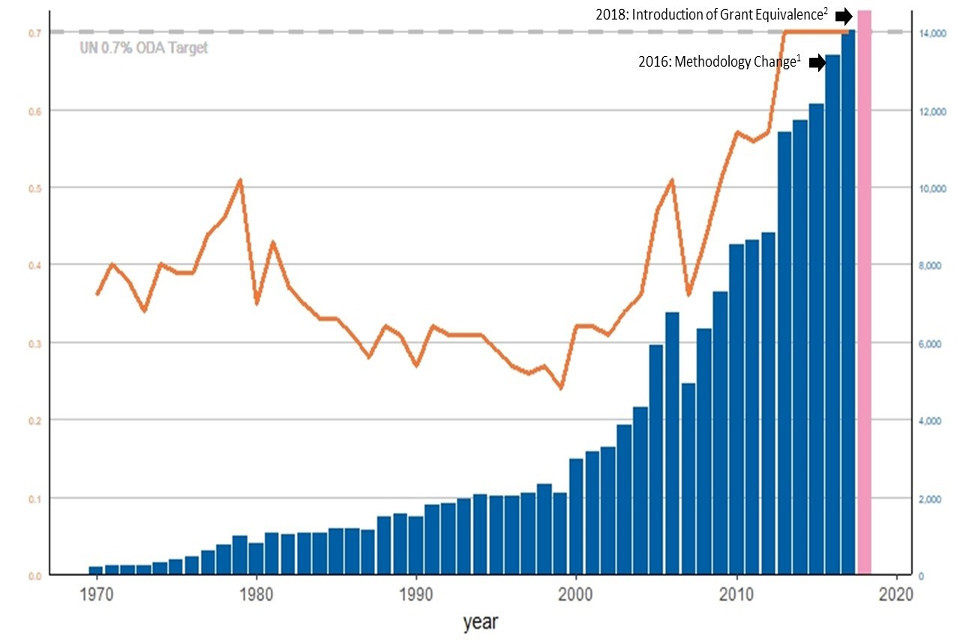
Figure 1: UK ODA Levels between 1970 and 2018
Figure 1 notes
-
For the years 2013-2015 (transition years) the ESA 1995 GNI was used to calculate the ODA:GNI ratio. For more information on the different GNI measures used to calculate the ratio see figure 17 in the background note on the Statistics on International Development: 2017 publication.
-
Underlying data for this graph can be found in the accompanying excel file ‘SID Provisional UK aid spend 2018 - accompanying tables’. The bar for 2018 is a lighter colour to represent that this figure is provisional and measured on a grant equivalent basis.
UK Bilateral and Multilateral ODA
There are 2 main channels of delivery for ODA: bilateral and multilateral. Bilateral ODA is earmarked spend which the donor has control over – this is usually ODA going to specific countries, regions or programmes. Bilateral ODA also includes funding to multilateral organisations for specific programmes or in specific countries; this is referred to as ‘bilateral ODA through a multilateral organisation’.
Multilateral ODA describes funds from national governments which are pooled with other donors’ funding and disbursed as part of the core budget of the multilateral organisation for ODA eligible activities. Core contributions will fluctuate from year to year in part due to the payment schedules of the receiving multilateral organisation.
Table 2 shows that in 2018:
- £9,242 million of UK ODA was delivered through bilateral channels. This represents 63.5% of total UK ODA
- £1,265 million of bilateral ODA was for humanitarian assistance (8.7% of total UK ODA). This represents a reduction (£178m) in humanitarian spend compared with 2017 when UK aid responded to drought across East Africa[footnote 6]
- £5,304 million were core contributions to multilaterals (36.5% of total UK ODA). This compares to £5,256 million (37.6%) in 2017. The fall in share was mainly due to a lower contribution to the International Monetary Fund in 2018 compared with 2017
Table 2: UK Official Development Assistance 2017 to 2018
Breakdown of UK ODA by government departments, cross-government funds and non-department sources
Table 3 shows the contribution of government departments and other contributors of UK ODA in 2018 and changes in ODA spend from 2017. The analysis presented in the table is based on summary provisional returns from government departments, and more detailed spending data will be available in Statistics on International Development published in autumn 2019.
The overall amount of ODA spend is determined by the size of GNI, however shifts in the percentage shares of departments and other ODA contributors depend on their spending in the given year.
Largest Contributors of UK ODA
- DFID spent £10,896 million (74.9% of total UK ODA) in 2018.
- ODA spent by departments other than DFID and other contributors of UK ODA was £3,650 million (25.1% of total UK ODA). While departments other than DFID spend increased in 2018 by £378 million, the reduced use of UK funding by the IMF - Poverty Reduction and Growth Trust in 2018 led to an overall fall in the non-DFID share of total UK ODA
- in 2018, the largest government department shares of ODA (excluding DFID) were: the Department of Business, Energy & Industrial Strategy (BEIS) (5.8% of ODA); the Foreign and Commonwealth Office (4.4%[footnote 7]); the Conflict, Stability and Security Fund (4.2%); and the Home Office (2.3%)
- The largest non-departmental sources were non-DFID EU[footnote 8] attribution (3.2% of UK ODA) and ODA eligible Gift Aid (1.0% of UK ODA). Non-DFID EU contributions include ODA eligible spend in peace, security, democracy, human rights and civil society
Main changes in ODA between 2017 and 2018
- Department of Health and Social Care spent £195 million in 2018, which was almost double the amount of ODA they spent in 2017 (£101 million). This primarily reflected increased funding to develop new vaccines for diseases with epidemic potential and health research for the main benefit of patients and the public in low- and middle-income countries
- BEIS, which tackles climate change and supports research in developing countries, spent £849 million of ODA in 2018 – an increase of £84 million on 2017
- HM Treasury provided a contribution to the Asian Infrastructure Investment Bank in 2018, which drove the increase in its ODA spend
- the IMF-PRGT used £26 million (grant equivalent); or £83 million (in cash flow terms) of UK funding in 2018, compared with £726 million (cash flow) in 2017
Table 3: DFID and Non-DFID ODA 2017-2018; ordered by 2018 ODA
Trend in departmental and other contributors’ share of UK ODA
As a percentage of total UK ODA, DFID’s share has fallen since 2014, which is in line with the approach set out in the UK Aid Strategy, which states “to respond to the changing world, more aid will be administered by other government departments, drawing on their complementary skills”. However, in 2018 there was a reverse of this trend as DFID’s share increased to 74.9% of UK ODA compared with 71.9% in 2017 to meet the 0.7% commitment.
Figure 2: Proportion of UK ODA accounted for by DFID, Other Government Departments and Other contributors of ODA: 2014 TO 2018
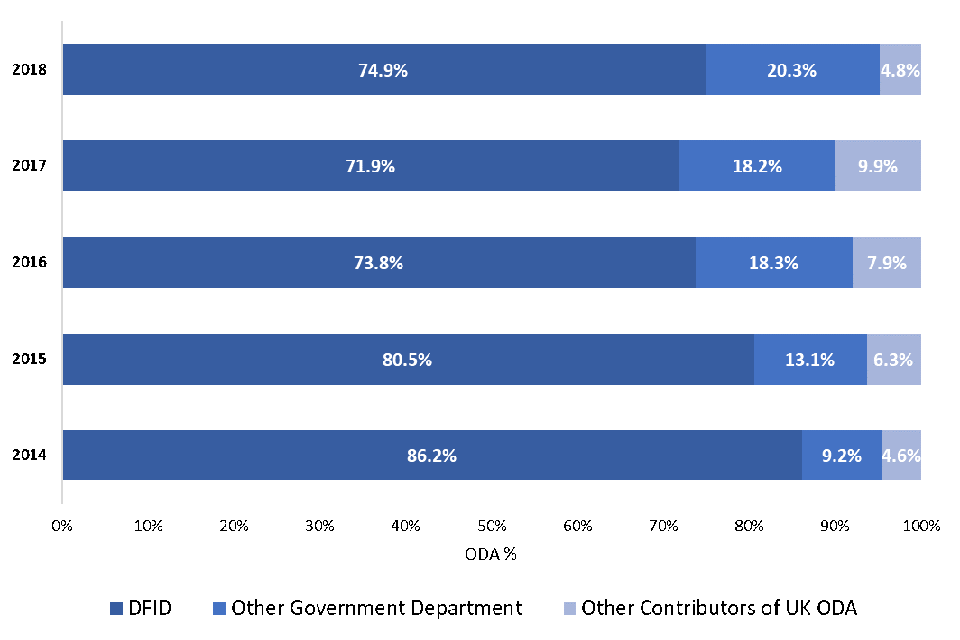
Figure 2: Proportion of UK ODA accounted for by DFID, Other Government Departments and Other contributors of ODA: 2014 to 2018
Figure 2 notes
- Figures may not sum to totals due to rounding.
DFID Region-Specific Bilateral ODA
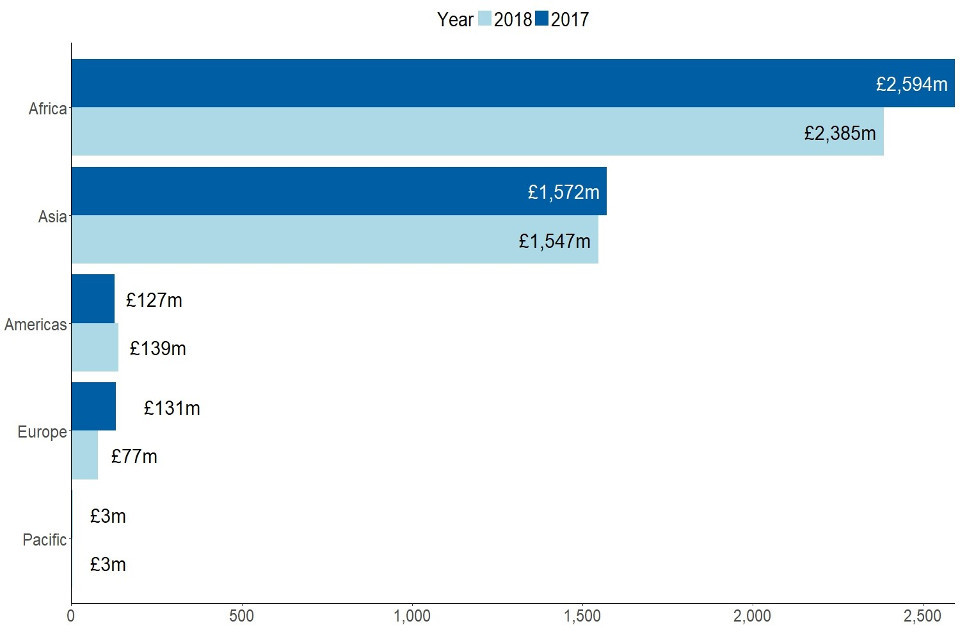
Figure 3 presents the breakdown of DFID’s region-specific bilateral ODA. These figures represent only part of the picture on UK ODA spend for each region because similar data from government departments other than DFID and other contributors of UK ODA is not available with this provisional release. Also, core contributions to multilateral organisations, or spend that is not assigned to a specific country or region is not included.
- in 2018, DFID region-specific bilateral ODA was £4,150 million compared to £4,427 million in 2017, a reduction of £276 million. This fall reflects more spend through centrally funded programmes In 2018 that benefit multiple countries or multiple regions,
- in 2018 Africa received £2,385 million of DFID bilateral ODA, a £209 million decrease compared to 2017 when the region received £2,594 million. The biggest reduction was in Somalia reversing successive increases in 2016 and 2017 in response to humanitarian crisis[footnote 9]
- Africa remained the largest recipient of DFID bilateral ODA in 2018, representing 57.5% of the total
- In 2018, Asia received £1,547 million of bilateral ODA from DFID – a fall of £25 million compared to 2017 primarily driven by a decrease in spending in Pakistan
- DFID bilateral spend in Europe fell from £131 million in 2017 to £77 million in 2018. This reflects a reduction in spend to Turkey, which previously experienced an increase due to the impact of the Syrian refugee crisis
Figure 3: DFID’s Region-Specific Bilateral ODA 2017-2018[footnote 10]
DFID’s Region-Specific Bilateral ODA 2017-2018
ODA spend by region will be presented for all UK expenditure in the ‘Statistics on International Development’ publication that will be published later in the year.
DFID Non-Region-Specific Bilateral ODA
Bilateral ODA spend by DFID on projects which were not assigned to any single recipient country or region amounted to £2,225 in 2018, this accounts for 34.9% of DFID’s total bilateral ODA expenditure. This consists of, for example, centrally-funded research and other global public goods or programmes that develop policies that benefit several developing countries and cannot be meaningfully recorded to a single benefitting country or region. Figure 4 provides a breakdown of this expenditure.
Figure 4: Breakdown of DFID’s Non-Region Specific Bilateral ODA in 2018
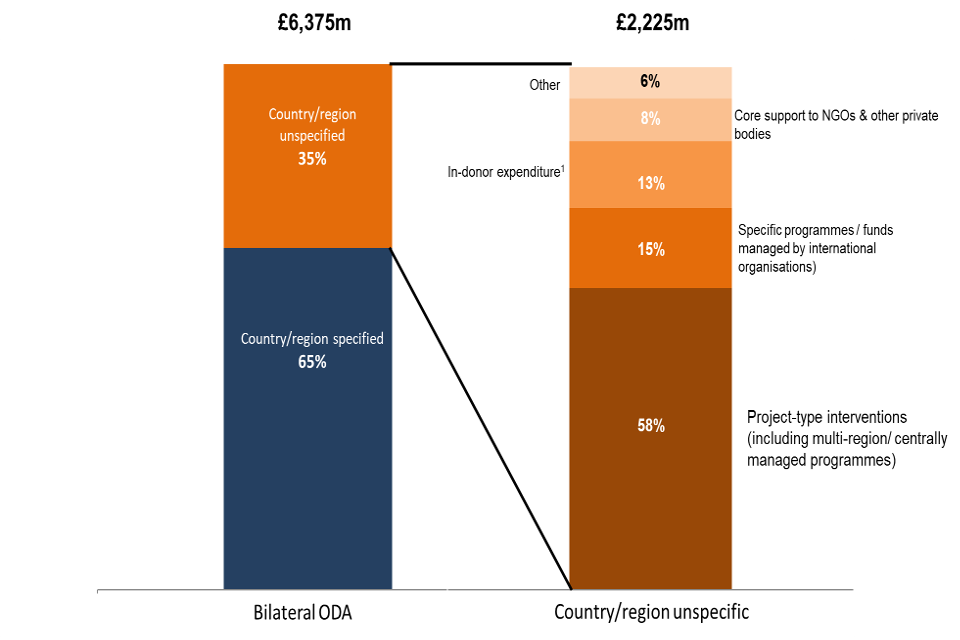
Figure 4: Breakdown of DFID’s Non-Region Specific Bilateral ODA in 2018
Figure 4 notes
-
Donor expenditure relates to ODA-eligible activities conducted within countries that donate aid, including the United Kingdom. ODA spend in the UK to support development work overseas or refugees within the UK are both examples of in-donor expenditure.
-
Numbers may not sum due to rounding
Background notes
Definitions and Sources
Information on the main definitions and sources used in this publication can be found in Annexes 2 and 3 respectively of the Statistics on International Development publication.
In Official Development Assistance (ODA) statistics, grants are wholly concessional by definition and have a grant element of 100%. For loans to qualify, this implies a grant element of at least:
- 45% for bilateral loans to the official sector of Least Developed Countries and other Low Income Countries (calculated at a discount rate of 9%)
- 15% for bilateral loans to the official sector of Lower Middle Income Countries (calculated at a discount rate of 7%)
- 10% for bilateral loans to the the official sector of Upper Middle Income Countries (calculated at a discount rate of 6%)
- 10% for loans to multilateral institutions (calculated at a discount rate of 5% for global institutions and multilateral development banks, and 6% for other organisations, including the sub-regional organisations)
Revisions and Changes to the Publication
The revisions process is set out in DFID’s Revisions Policy.
As announced in a previous edition of Statistics on International Development (SID), this publication presents ODA for 2018 on a grant equivalent basis - the new standard for reporting ODA spend figures. The grant equivalent methodology affects how the values of loans disbursed by departments and other contributors are scored as ODA, which is different from the previous cash flow methodology used to present ODA in 2017. More information on this change can be found in an explanatory note and in the OECD reporting directives for ODA.
This publication also implements the findings of a recent review of in-donor refugee costs methodology, which were reported in SID and aligns to the costs reported in 2018 with the clarifications agreed by the OECD Development Assistance Committee in 2017. Among the changes implemented is an appropriate allocation of costs to the devolved governments of Northern Ireland, Scotland and Wales to reflect their policy responsibility. These costs were previously reported by the Department of Health and Social Care and Department for Edinburgh in 2017.
ODA spending and reporting
The UK commitment to spend 0.7% of GNI on ODA is measured based on ODA spending and GNI estimates published by the Office for National Statistics in the year following the target year. During the spending year, DFID and HMT monitor ODA spending and the latest information on GNI to ensure the 0.7% commitment is met.
UK ODA spend includes DFID spend, non-DFID departmental spend and other sources of ODA (such as EU attribution and Gift Aid). DFID and HMT monitor spend by other departments and funds during the year and estimate the likely contribution from non-departmental sources of ODA. DFID and HMT monitor movements in GNI during the year using GNI forecasts published by the independent Office for Budget Responsibility (OBR). While DFID manages its own spending on ODA, DFID has no control over GNI nor the spending by other government departments and other sources of ODA. After final decisions on DFID ODA spending are made the GNI estimate can still shift due to later economic data for the year becoming available and methodological changes introduced by ONS to improve GNI measurement. The amount of ODA spent by other government departments and ODA contributions from non-departmental sources can also be subject to change.
DFID is responsible for collating data and reporting spend on ODA to the Organisation of Economic Development and Co-operation (OECD), including the 0.7 ODA:GNI ratio commitment.
This publication uses an estimate of GNI for 2018 published by ONS in March and provisional ODA spend information to calculate a provisional estimate of the ODA:GNI ratio. Between the spring and the autumn, the ODA spending of DFID and other government departments are finalised. Other government departments will provide project-level details that allow the ODA spend to be quality assured. The ONS will release further updates of GNI for 2018. The final ODA data and an updated GNI estimate for 2018 are then used to calculate the final ODA:GNI ratio in the autumn publication, and to report to the OECD
ODA:GNI Ratio
The ONS publish revisions to GNI estimates as more economic data becomes available. To enable comparability against international data we do not revise the back series to take into account any further revisions made to GNI estimates.
The recent changes on how we have reported the ODA:GNI ratio in previous editions of SID were described in the Statistics on International Development: 2017 publication.
Over the coming months ONS will introduce a new framework to produce future gross domestic product estimates, which could have an impact on the GNI estimates published later this year.
Cross-Government funds
The Conflict, Stability and Security Fund (CSSF) provides development and security support to countries which are at risk of conflict or instability. It’s the only cross- government fund which uses both ODA spend and non-ODA spend to deliver and support security, defence, peacekeeping, peace-building and stability activity, under the strategic direction of the National Security Council (NSC). Only the ODA-eligible spending from the CSSF is reported in this publication. Details of departmental ODA spending from the CSSF will be published in Statistics on International Development this autumn.
The cross-Government Prosperity Fund was introduced in 2016, replacing the FCO Prosperity Fund. The new fund, which is accountable to a cross-government board, promotes economic reform and development in recipient countries and contributes to poverty reduction in ODA-eligible countries. For more information please see The cross-Government Prosperity Fund and Statistics on International Development, which will be published this autumn.
EU attribution
The estimate for the UK’s share of the EU ODA budget in 2018 is £925 million compared to £991 million in 2017. EU attribution fluctuates from year to year because the EU works on a 7 year programming cycle and so EU disbursements in a given year can vary. The estimate in 2017 and 2018 is based on published data from the European Commission on the UK’s share of development expenditure.
To avoid double counting, Table 3: DFID and Non-DFID ODA 2017-2018; ordered by 2018 ODA reports £27.5 million of the EU attribution figure for the UK’s contribution to EU peacekeeping under the CSSF, as the fund responsible for this spending. This does not affect the overall EU attribution figure.
Future developments
In May the Office for Statistics Regulation will carry out a compliance check of Statistics on International Development. The check will assess the extent to which the publication aligns with the Code of Practice for Statistics, which was refreshed in February 2018. We will keep users informed of any recommendations and developments because of this check.
Timing and Releases
Final 2018 ODA data will be available in the 2019 edition of Statistics on International Development: Final UK Aid Spend 2018, which will be available from the DFID website or from the National Statistics publication Hub in autumn 2019. The final publication date for SID will be pre-announced on the online timetable.
Provisional 2018 ODA statistics for all members of the OECD will also be published by the OECD Development Assistance Committee (DAC) in April 2019, final data is normally published by the OECD in December.
Quality
Data for this publication comes from the following sources:
- DFID’s ARIES database that records financial transactions relating to DFID payments and receipts. It also includes information on the dates of transactions, where the transactions took place and in which sector. This is information is primarily inputted by spending teams in DFID country offices and central departments, with some quality assurance carried out at input and centrally to ensure that spend is in line with OECD definitions of ODA
- Other Government Departments and contributors have similar databases to record ODA transaction data – although some accounting systems are unable to provide calendar year information
As the data in the publication is largely based on administrative data it is not subject to sampling error. However these provisional statistics may change between now and the final release in autumn 2019 as the data is further audited and assured as part of the closing of accounts and statistical quality assurance processes.
The DAC sets the definitions and classifications for reporting on ODA internationally. These are laid out in the DAC Statistical Reporting Directives. The statistics shown here are reported in line with these directives and are subjected to a quality assurance process as described in Annex 4.
The figure presented for the Welsh Assembly Government and Scottish Government represents their estimated spend for the financial year 2018/19 and are used as a proxy for their calendar year 2018 spend. The Welsh Assembly Government and Scottish Government are currently reviewing their reporting procedures with a view to being able to report calendar year figures going forward.
Related Statistics and Publications
DFID’s Annual Report provides information on DFID’s results achieved, spending, performance and efficiency.
The OECD statistics provide ODA breakdowns for DAC donors (including multilaterals). This source is useful when carrying out international comparisons. Figures for DAC donor’s provisional 2018 ODA will be published in early April.
Uses and users
The main purpose of these statistics is to provide timely summary statistics on ODA expenditure by the UK government. They are published prior to the release of provisional ODA statistics by the OECD DAC for all OECD members.
Based on user feedback, these statistics are used for a variety purposes: preparing material for briefs; PQs and public correspondence; inclusion in reports and reviews and providing data for research and monitoring. Our users represent the government, civil society and non-government organisations, students and academia and the media.
We are always keen to enhance the value of these statistics and welcome your on-going feedback either via our Statistics User Group or via email statistics@dfid.gov.uk.
National Statistics
The Office for Statistics Regulation (part of the United Kingdom Statistics Authority) designated these statistics as National Statistics in March 2016, in accordance with the Statistics and Registration Service Act 2007 and signifying compliance with the Code of Practice for Statistics. Designation means the statistics carry the National Statistics label and conform to the standards summarised below.
For information on the work of the UK Statistics Authority.
National Statistics Status
Contacts
For media enquiries please contact the DFID Press Office on 0207 023 0600. For enquiries (non-media) about the information contained in this Statistical Release, or for more detailed information, please contact:
Michael Morris – Statistics Adviser
DFID
22 Whitehall
London
SW1A 2EG
Tel: 020 7023 0497
Email: statistics@dfid.gov.uk
For further information on development issues and DFID policies, please contact:
Public Enquiry Point: 0845 300 4100
E-mail: enquiry@dfid.gov.uk
Website: Department for International Development
-
All ODA figures in this release are reported net of loan and other repayments ↩
-
Revisions and Changes to the Publication section gives more detail ↩
-
See Office for National Statistics, Quarterly National Accounts ↩
-
See commitments made by the UK and other donors at the 2005 G8 Summit in Gleneagles ↩
-
See background note ↩
-
Figures may not sum to totals due to rounding. Analysis of non-country/region specific ODA set out in section 6. ↩