Domestic road freight statistics, United Kingdom: 2025
Published 27 May 2026

© Crown copyright 2026
This publication is licensed under the terms of the Open Government Licence v3.0 except where otherwise stated. To view this licence, visit nationalarchives.gov.uk/doc/open-government-licence/version/3 or write to the Information Policy Team, The National Archives, Kew, London TW9 4DU, or email: psi@nationalarchives.gov.uk.
Where we have identified any third party copyright information you will need to obtain permission from the copyright holders concerned.
This publication is available at https://www.gov.uk/government/statistics/road-freight-statistics-2025/domestic-road-freight-statistics-united-kingdom-2025
About this release
These are accredited official statistics and were independently reviewed by the Office for Statistics Regulation in December 2016. Accredited official statistics are called National Statistics in the Statistics and Registration Service Act 2007. For more information, see the ‘about these statistics’ section.
This statistical release summarises the domestic activity of GB-registered Heavy Goods Vehicles (HGVs) operating in the UK during 2025. It covers the amount and type of goods carried, as well as the origin and destination of the HGV and the distance travelled.
This statistical release also summarises the activity of Northern Ireland (NI)-registered HGVs operating in the UK and in the island of Ireland during 2025.
The information is derived from surveys of businesses that operate HGVs.
Statistics on HGV driver vacancies in the UK during 2025 is available.
The previous annual statistical release on domestic road freight for 2024 is also available.
Definitions
HGV: a vehicle with a gross vehicle weight of more than 3.5 tonnes. The gross vehicle weight is the weight of the vehicle plus the maximum possible weight of goods that can be carried.
Quarter: a calendar year quarter. In this publication, quarter 1 refers to January to March, quarter 2 refers to April to June, quarter 3 refers to July to September, and quarter 4 refers to October to December.
Goods lifted: the weight of goods carried, measured in tonnes. This is a measure of the amount of goods transported around the UK by HGVs.
Goods moved: the weight of goods carried, multiplied by the distance hauled, measured in tonne kilometres. This is a measure of the total activity of GB-registered HGVs, accounting for both the distance travelled by each vehicle and the weight of its load.
In 2025,
1.53 billion tonnes
of goods were lifted by GB-registered HGVs operating in the UK, a 3% decrease compared to 2024.
Infographic 1: Total amount of domestic goods lifted, goods moved, and vehicle kilometres travelled by GB-registered HGVs in 2025 and quarterly trends Table RFS0101
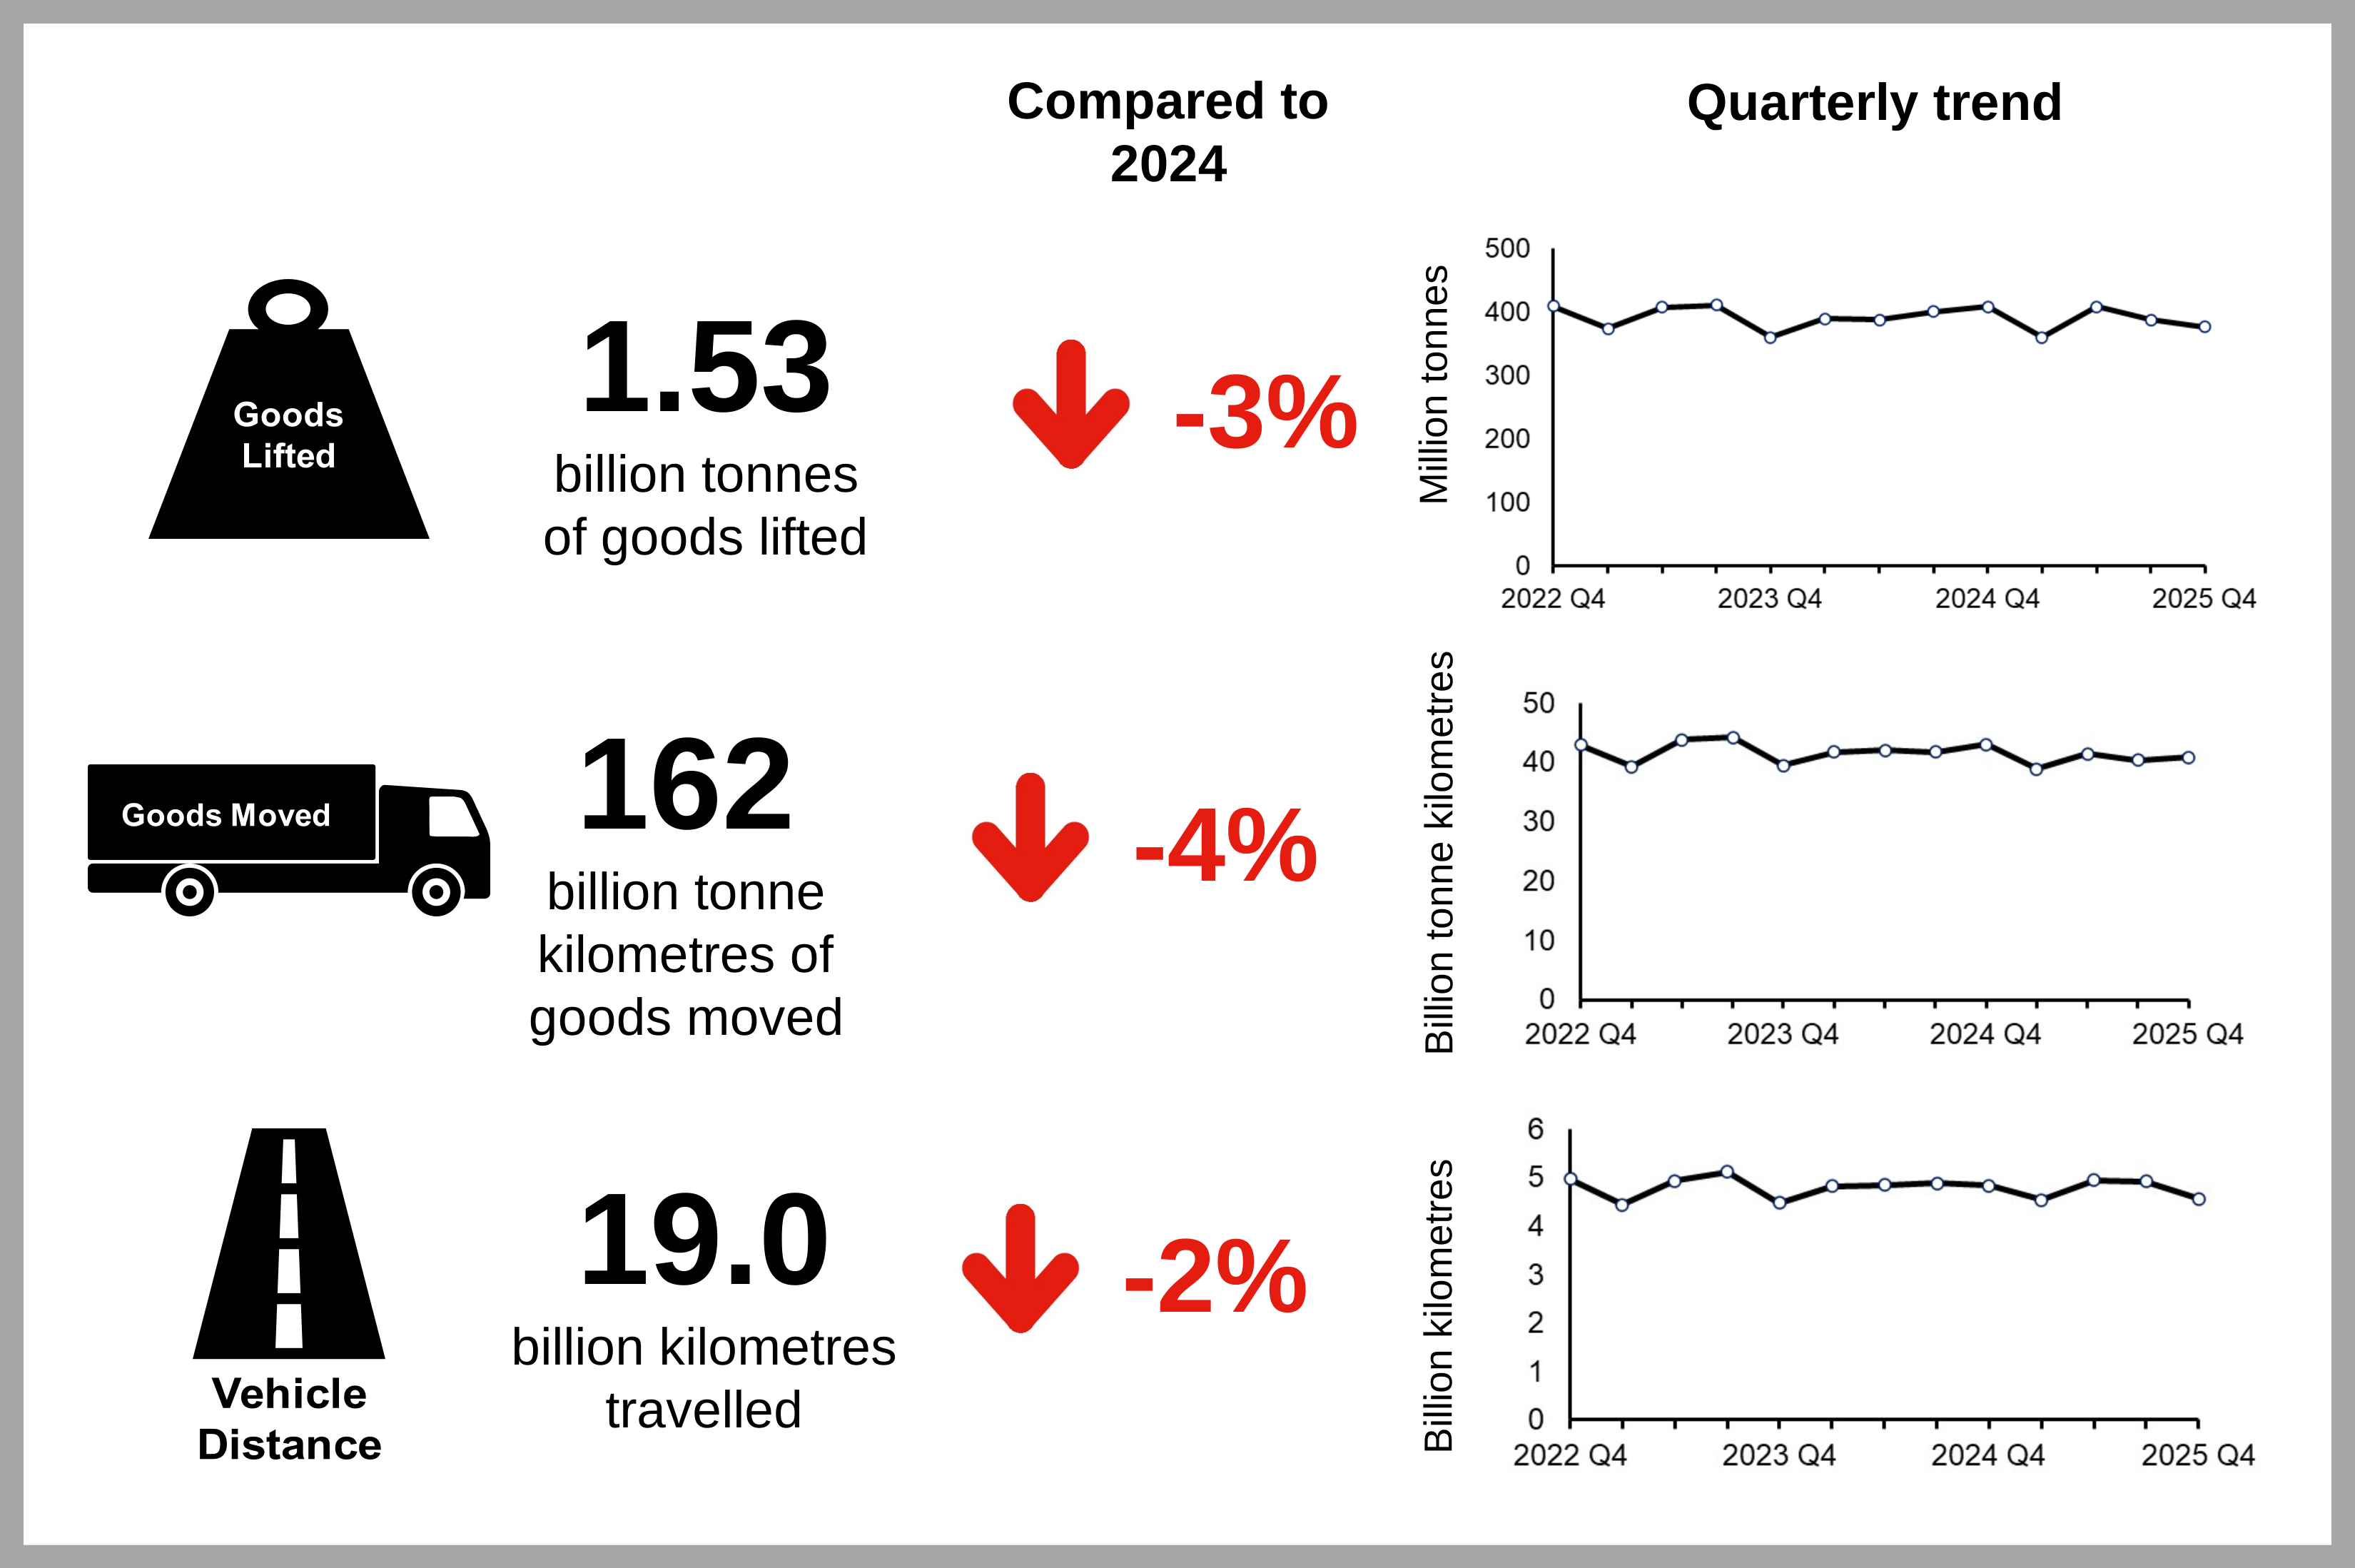
Infographic 1 shows that in 2025, GB-registered HGVs transporting freight within the UK:
-
lifted 1.53 billion tonnes of goods, which is 3% less than in 2024 (1.59 billion tonnes)
-
moved 162 billion tonne kilometres of goods, which is 4% less than in 2024 (168 billion tonne kilometres)
-
travelled 19.0 billion kilometres, which is 2% less than in 2024 (19.4 billion kilometres)
Trends
In 2025, the total amount of goods lifted decreased by 3% compared to 2024 to 1.53 billion tonnes. During 2025 the amount of goods lifted varied across the quarters. Between April and June 2025, 408 million tonnes were lifted, compared to 360 million tonnes between January and March 2025. The amount of good lifted across 2025 varied by up to 14% per quarter. The amount of good lifted in 2024 was slightly more stable, varying by no more than 8% per quarter.
Commodities lifted by GB-registered HGVs
Definition
Commodity: goods are classified into commodity types and sub-categories by the ‘standard goods classification for transport statistics 2007’ NST2007.
In 2025, the top 5 commodities lifted accounted for 72% of all goods lifted by GB-registered HGVs in the UK (1.1 out of 1.53 billion tonnes), similarly to 2024 where it accounted for 73% of all goods lifted (1.16 out of 1.59 billion tonnes).
Infographic 2: Top 5 commodity types lifted by GB-registered HGVs in 2025 Table RFS0104
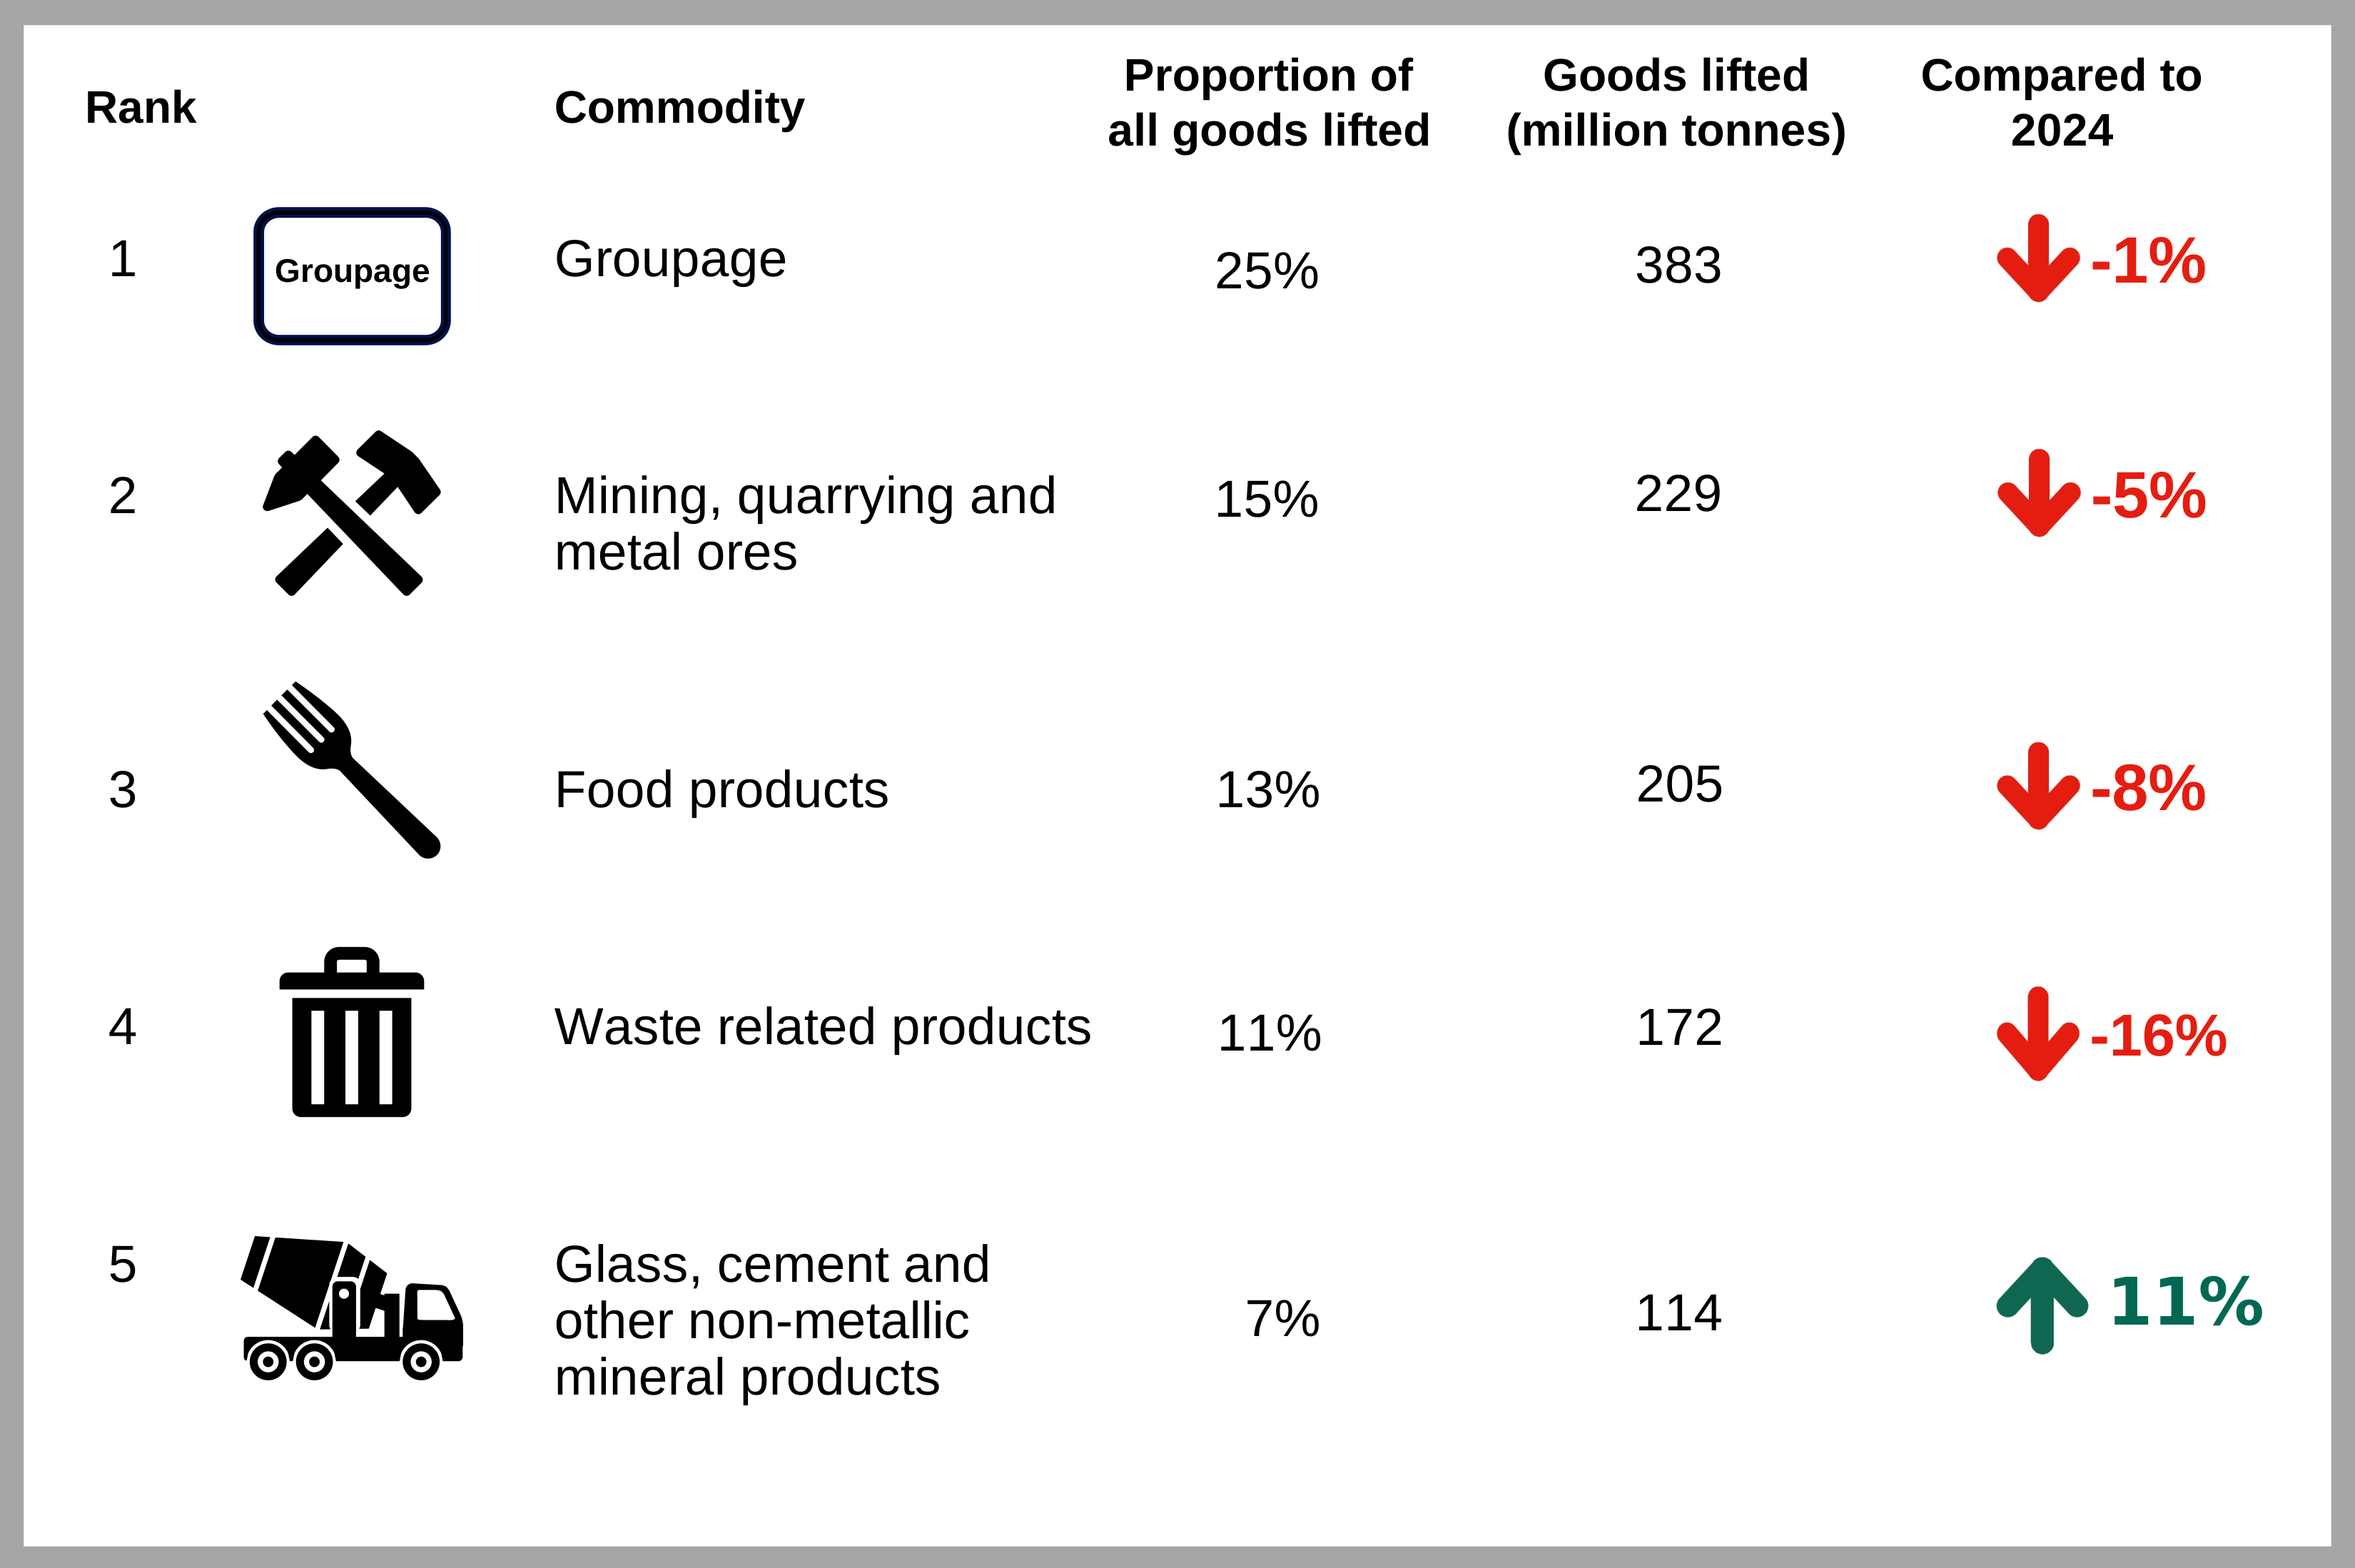
Note: Due to rounding, the sum of the top 5 commodity proportion of all goods lifted may not equal the proportion calculated from the goods lifted figures.
Infographic 2 shows the top 5 commodity types lifted by GB-registered HGVs in 2025.
The most common type of haul lifted in 2025 was groupage (25% of goods by weight, 383 million tonnes), which is where consignments contain a mixture of different commodities with no single main type of good. This was also the most common type in 2024 (24% of goods by weight, 386 million tonnes).
The top 5 commodities type lifted remained the same as the top 5 in 2024. The biggest difference was for glass, cement and other non-metallic mineral products, were the amount of goods lifted in 2025 (114 million tonnes) was 11% more than in 2024 (103 million tonnes).
Dangerous goods lifted by GB-registered HGVs
Note
The nine dangerous goods classes are: flammable liquids, gases, corrosive substance, flammable solids, oxidisers and organic peroxides, toxic and infectious substance, radioactive materials, explosives, and miscellaneous substances.
In 2025, 5% of all goods lifted within the UK were declared as dangerous goods, accounting for 72 million tonnes. This is a similar proportion to 2024 where 5% of all goods lifted were declared as dangerous goods, accounting for 77 million tonnes.
Chart 1: Dangerous goods lifted by GB-registered HGVs by dangerous goods class in 2025 Table RFS0118
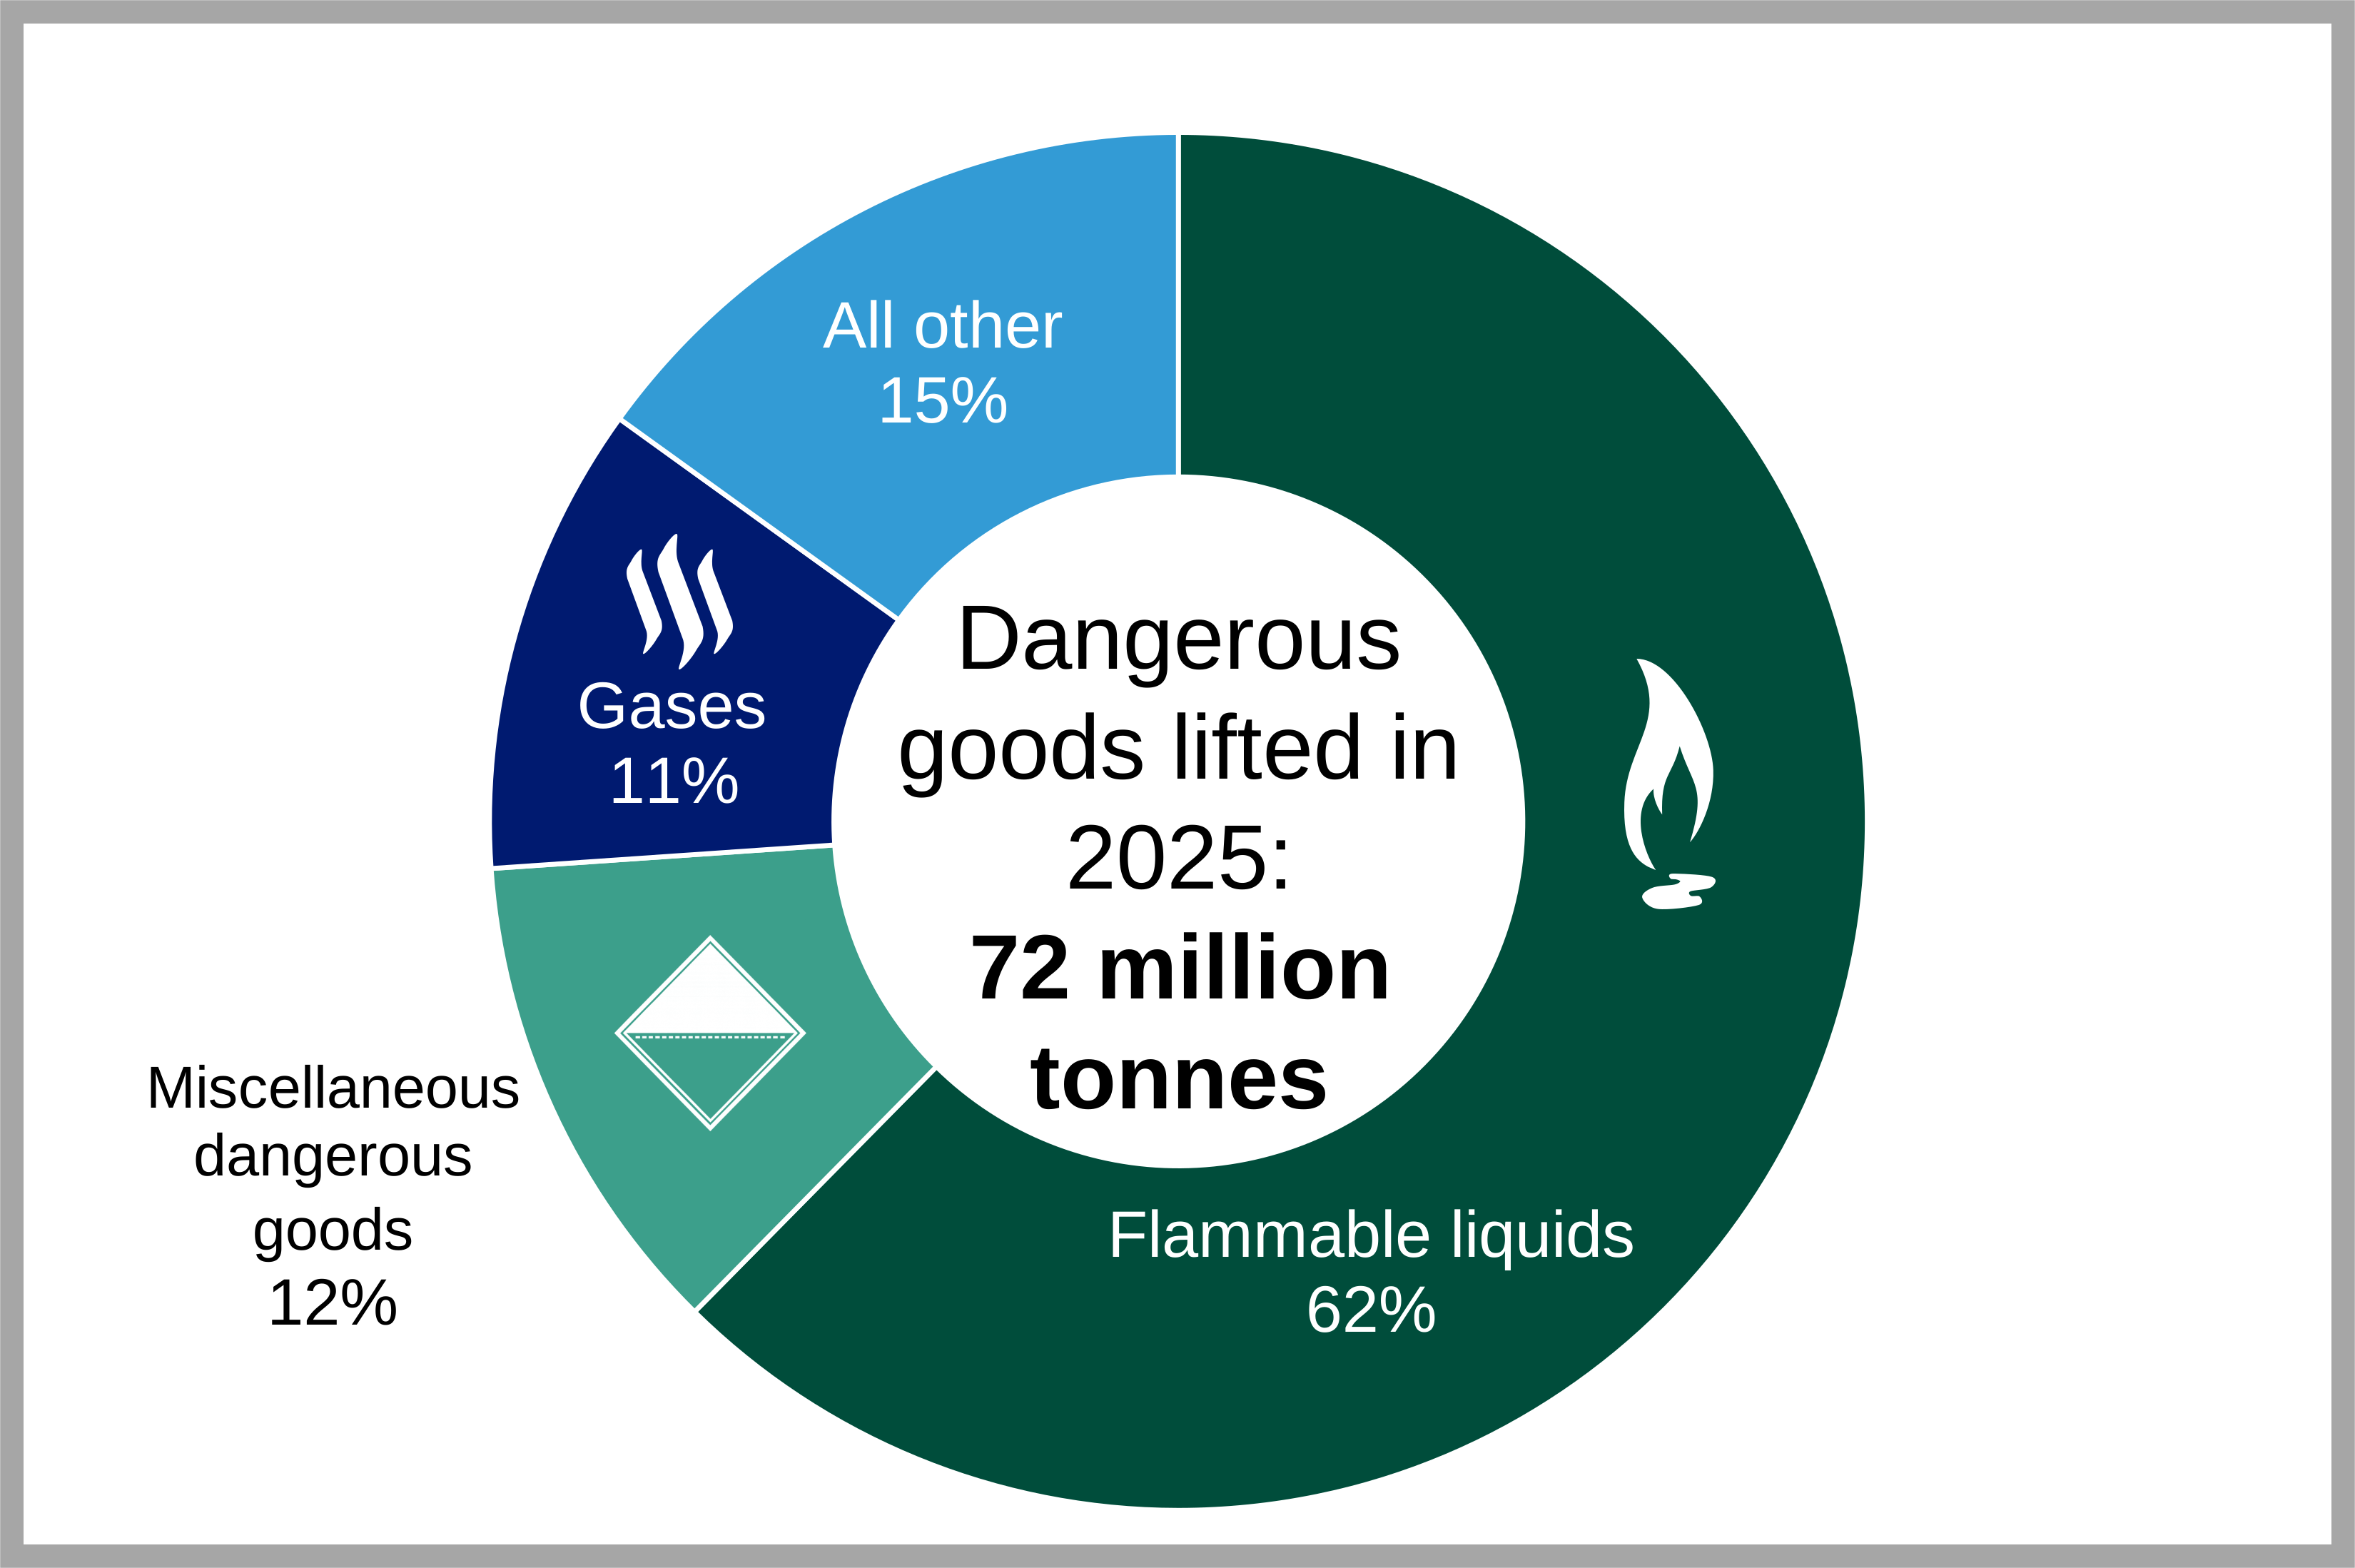
Chart 1 is a doughnut chart which shows that dangerous goods transported in 2025 were predominantly flammable liquids (45 million tonnes, 62%), for example, petrol, gasoline, kerosene, jet fuel, ethanol, acetone, and toluene. This continues the trend seen in 2024 where dangerous goods were predominantly flammable liquids (50 million tonnes, 66%).
The second most common dangerous goods class lifted in 2025 was miscellaneous, accounting for 8 million tonnes. This was 2 million tonnes more than in 2024 (6 million tonnes). However miscellaneous accounted for 12% of all dangerous goods lifted in 2025 compared to 8% in 2024.
Gases were the third most common dangerous goods class in 2025 with 8 million tonnes lifted, accounting for 11% of all dangerous goods lifted. This is slightly down from 2024 where 9 million tonnes of gases were lifted, accounting for 12% of all dangerous goods lifted.
Intermodal road freight activity by GB-registered HGVs
Definitions
Inter-modal: In this publication, an inter-modal journey is an HGV journey where a different mode of transport is used to transfer goods to or from the HGV.
Journey: goods transported from an origin to a destination by an HGV.
In 2025, the 1.53 billion tonnes of total goods lifted by GB-registered HGVs in the UK equated to 163 million HGV journeys.
Of the 163 million total HGV journeys, 5% (7.3 million journeys) involved at least one element of inter-modal activity. This is a similar proportion to 2024, where 4% (6.2 out of 165 million journeys) involved at least one element of inter-modal activity.
For goods lifted instead of journeys, out of the 1.53 billion tonnes of total goods lifted in 2025, 9% (130 million tonnes) were lifted using HGVs and at least one other different mode of transport.
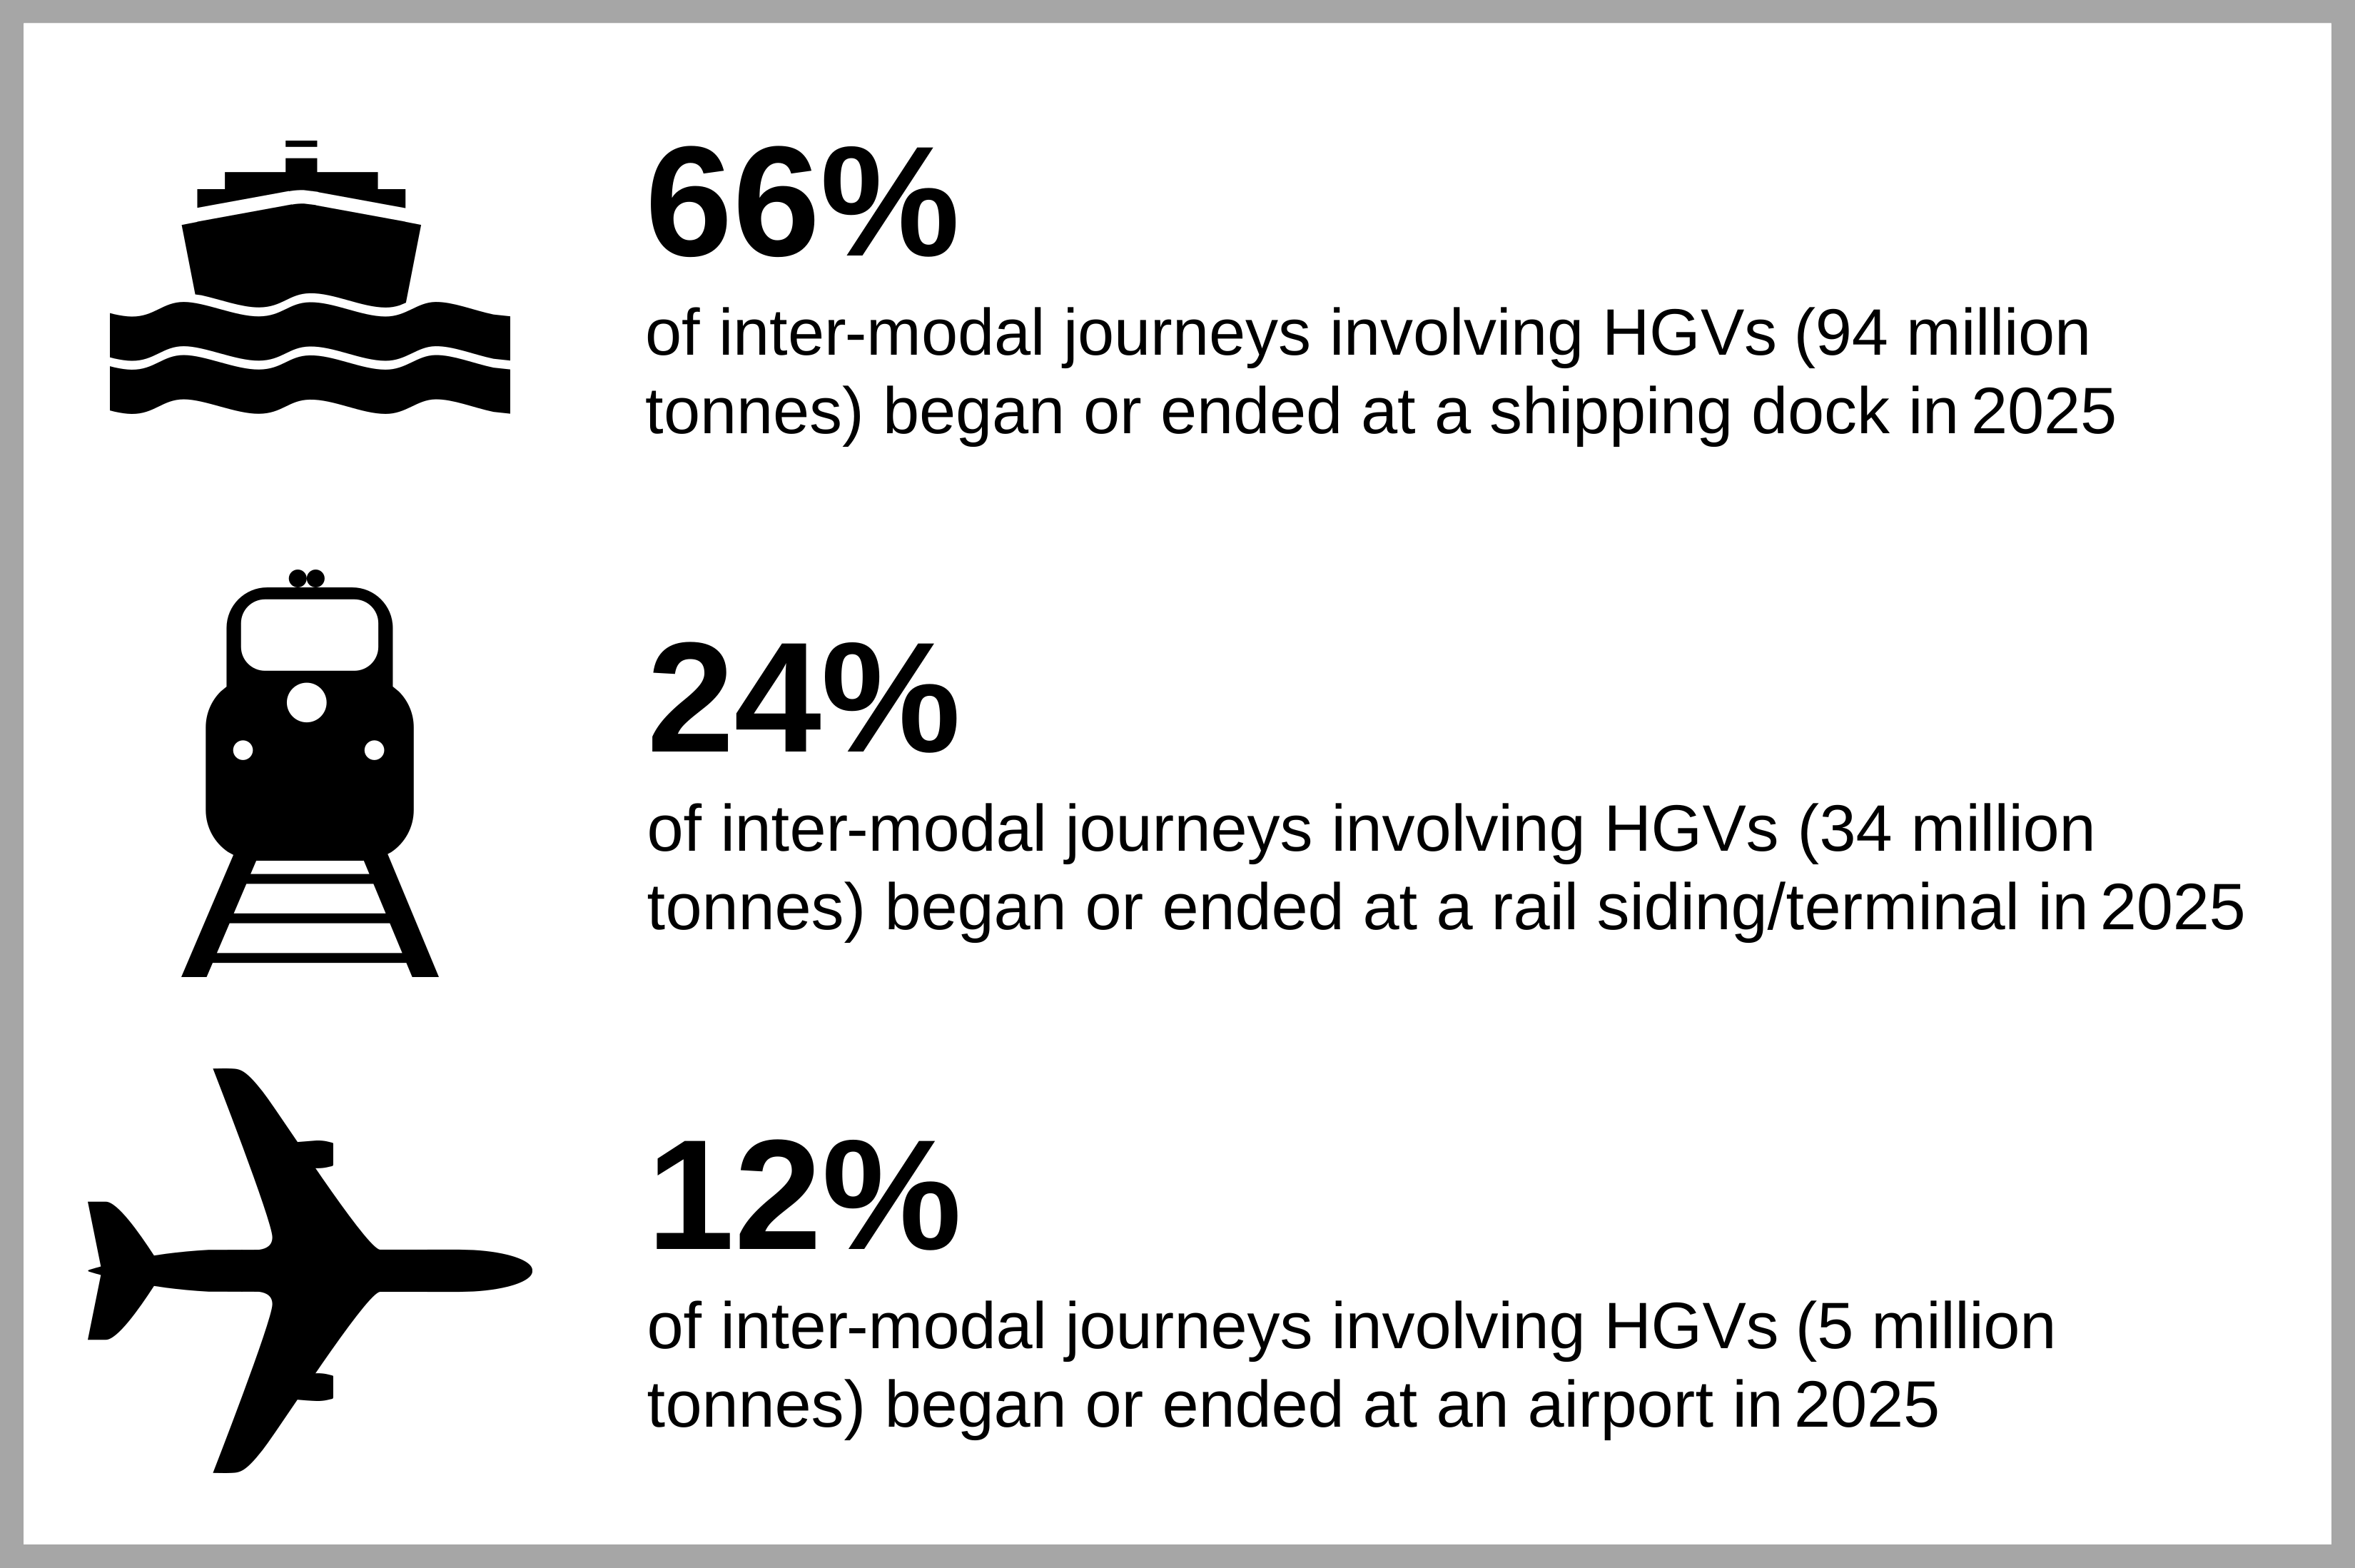
Infographic 3: Proportion of inter-modal journeys involving GB-registered HGVs by mode of transport, in 2025 Table RFS0132
Note
The proportions of inter-modal journeys by mode may not equal to 100%. This is because an intermodal journey will appear in more than one mode if both the origin and destination of an HGV journey are intermodal sites.
Infographic 3 shows that in 2025, out of all HGV inter-modal journeys, 66% began or ended their journeys at a shipping dock, 24% began or ended their journeys at a rail sliding or terminal, and 12% began or ended their journeys at an airport.
In 2025, the proportion of journeys that started and ended at a rail siding or terminal and at a shipping dock was similar to 2024. The proportion of journeys that started and ended at an airport (12% of journeys) increased by 2 percentage points from 2024 (10% of journeys).
Intermodal commodities lifted by GB-registered HGVs
The three most common commodities transported on inter-modal trips during 2025 differs from the top three commodities for all journeys (see the section ‘Commodities lifted by GB-registered HGVs’): For intermodal journeys, there were
-
37.9 million tonnes of groupage (29% of inter-modal tonnage was carried in consignments of mixed goods)
-
15.0 million tonnes of food products (12% of inter-modal tonnage)
-
12.5 million tonnes of coke and refined petroleum products (10% of inter-modal tonnage)
Groupage remained the most common commodity type transported on inter-modal trips similar compared to 2024 (31.0 million tonnes, 25% of inter-modal tonnage).
Method of transportation of goods lifted by GB-registered HGVs
The receptacle or method used to transport goods differs for inter-modal goods compared to goods transported solely by HGVs, reflecting the requirements of transferring goods between modes of transport.
Definitions
Methods of transportation:
Solid Bulk: Commodity in granular form transported unpacked in large quantities, for example, coal.
Liquid bulk: Commodity in liquid form transported unpacked in large quantities, for example, petroleum or crude oil.
Palletised goods: Commodity transported in a pallet, to support goods giving stability to commodity during transportation, for example, beverages.
Large freight container (shipping containers): Commodity transported in a container with strength suitable to withstand shipment, storage, and handling, for example, large reusable steel boxes, corrugated boxes.
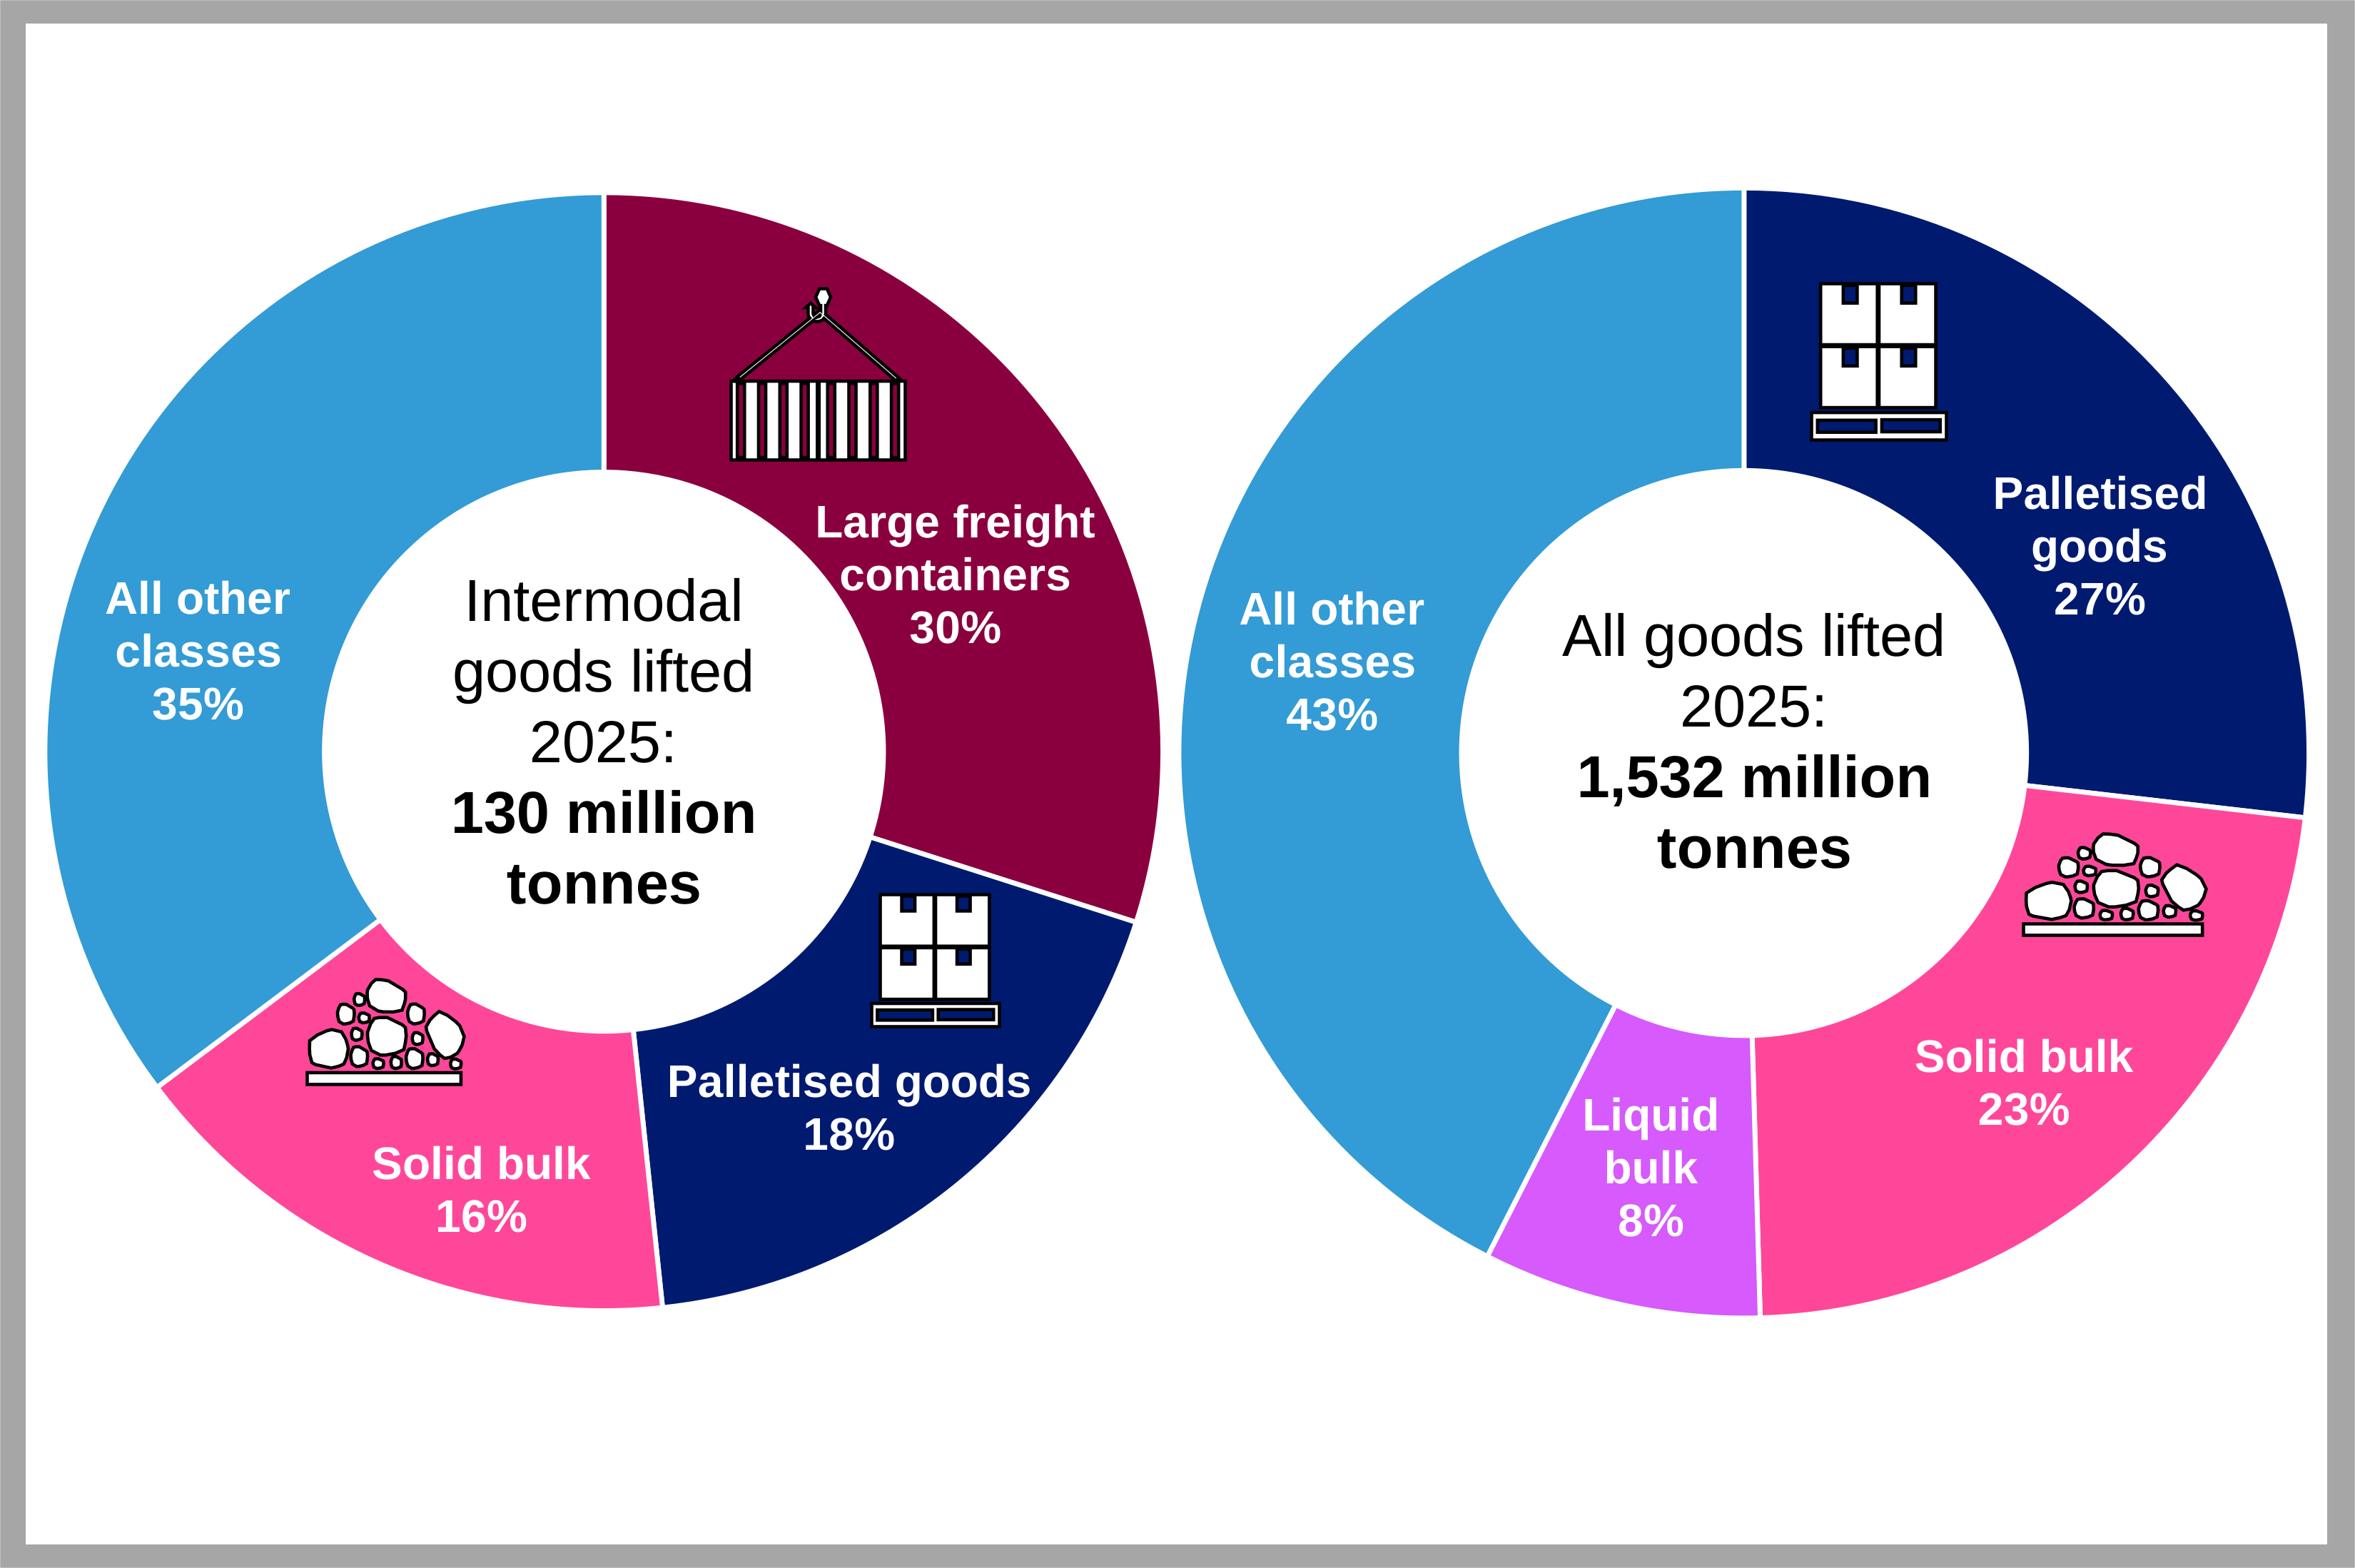
Infographic 4: Goods lifted by GB-registered HGVs, by method of transportation for inter-modal journeys, and all journeys, in 2025 Table RFS0119 and Table RFS0135
Note: Due to rounding, totals may not appear to equal the sum of their parts.
Infographic 4 has 2 doughnut charts which shows that in 2025, large freight containers (including iso containers) were the most common method of transportation used to transfer goods for inter-modal journeys (30% of journeys), followed by palletised goods (18%) and solid bulk (16%).
However, across all road freight journeys, the most common method of transportation was palletised goods (27% of journeys), followed by solid bulk (23%).
Freight operations
Empty running of GB-registered vehicles
Infographic 5: Distance travelled by empty GB-registered HGVs in the UK, million kilometres, in 2025 Table RFS0117
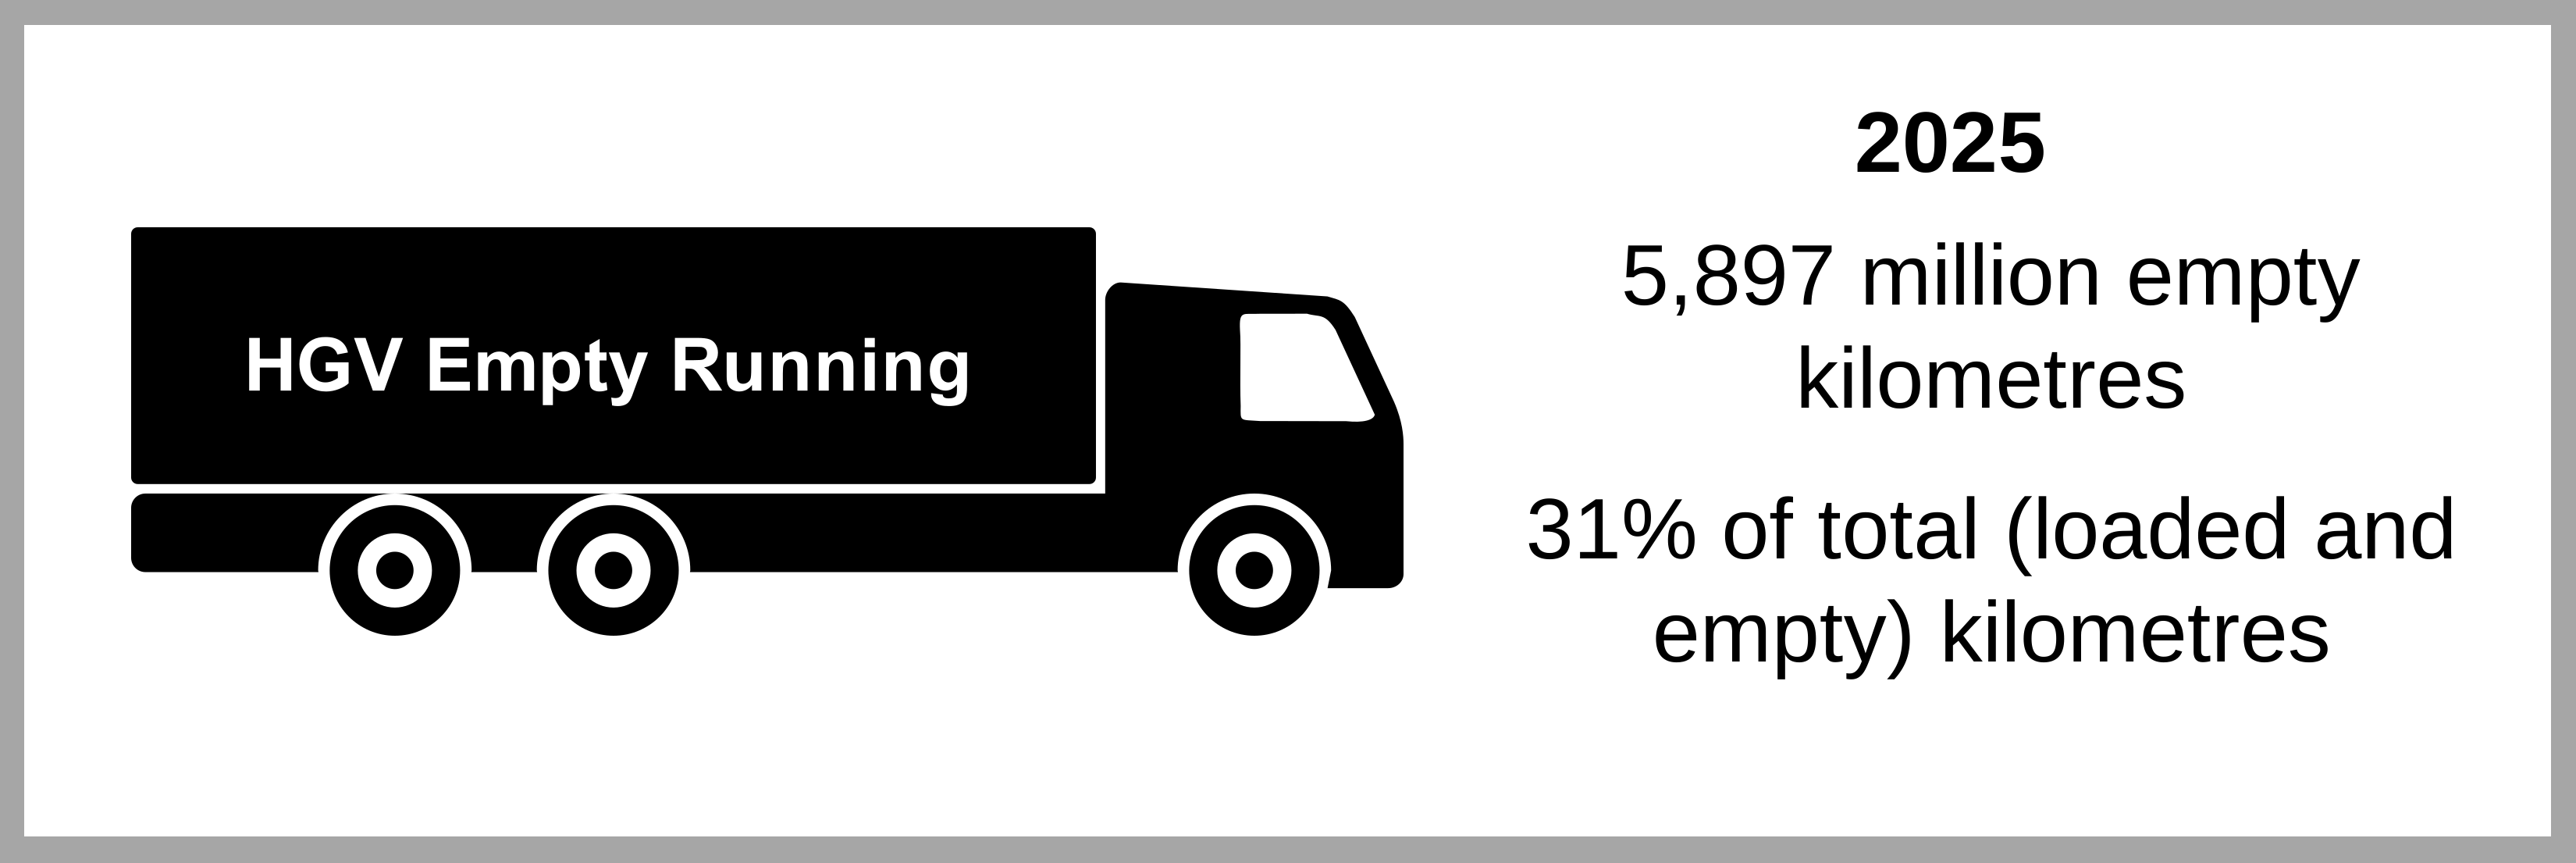
Infographic 5 shows that in 2025, GB-registered HGVs travelled 5,897 million kilometres whilst empty. This is 31% of total (loaded and empty) vehicle kilometres travelled during the same period (18,975 million kilometres). A similar proportion of total vehicle kilometres were travelled empty in 2024 as in 2025 (30% compared to 31%).
Average length of haul of GB-registered vehicles
Definition
Average length of haul: Calculated by dividing the total tonne kilometres (goods moved) by the total tonnes lifted (goods lifted). This is not the average distance travelled by HGVs, but an internationally recognised measure of the average distance travelled by each tonne of freight.
In 2025, the average length of haul was 105 kilometres for GB-registered HGVs, 1% lower than 2024 (106 kilometres).
The average length of haul for articulated HGVs was 134 kilometres, compared to rigid HGVs at 58 kilometres. This is consistent with the trends seen in 2024, where the average length of haul for articulated HGVs was also 134 kilometres, and rigid HGVs were 58 kilometres Table RFS0108.
Goods lifted by vehicle type GB-registered HGVs
Infographic 6: Goods lifted by GB-registered HGVs by vehicle type in 2025 Table RFS0109
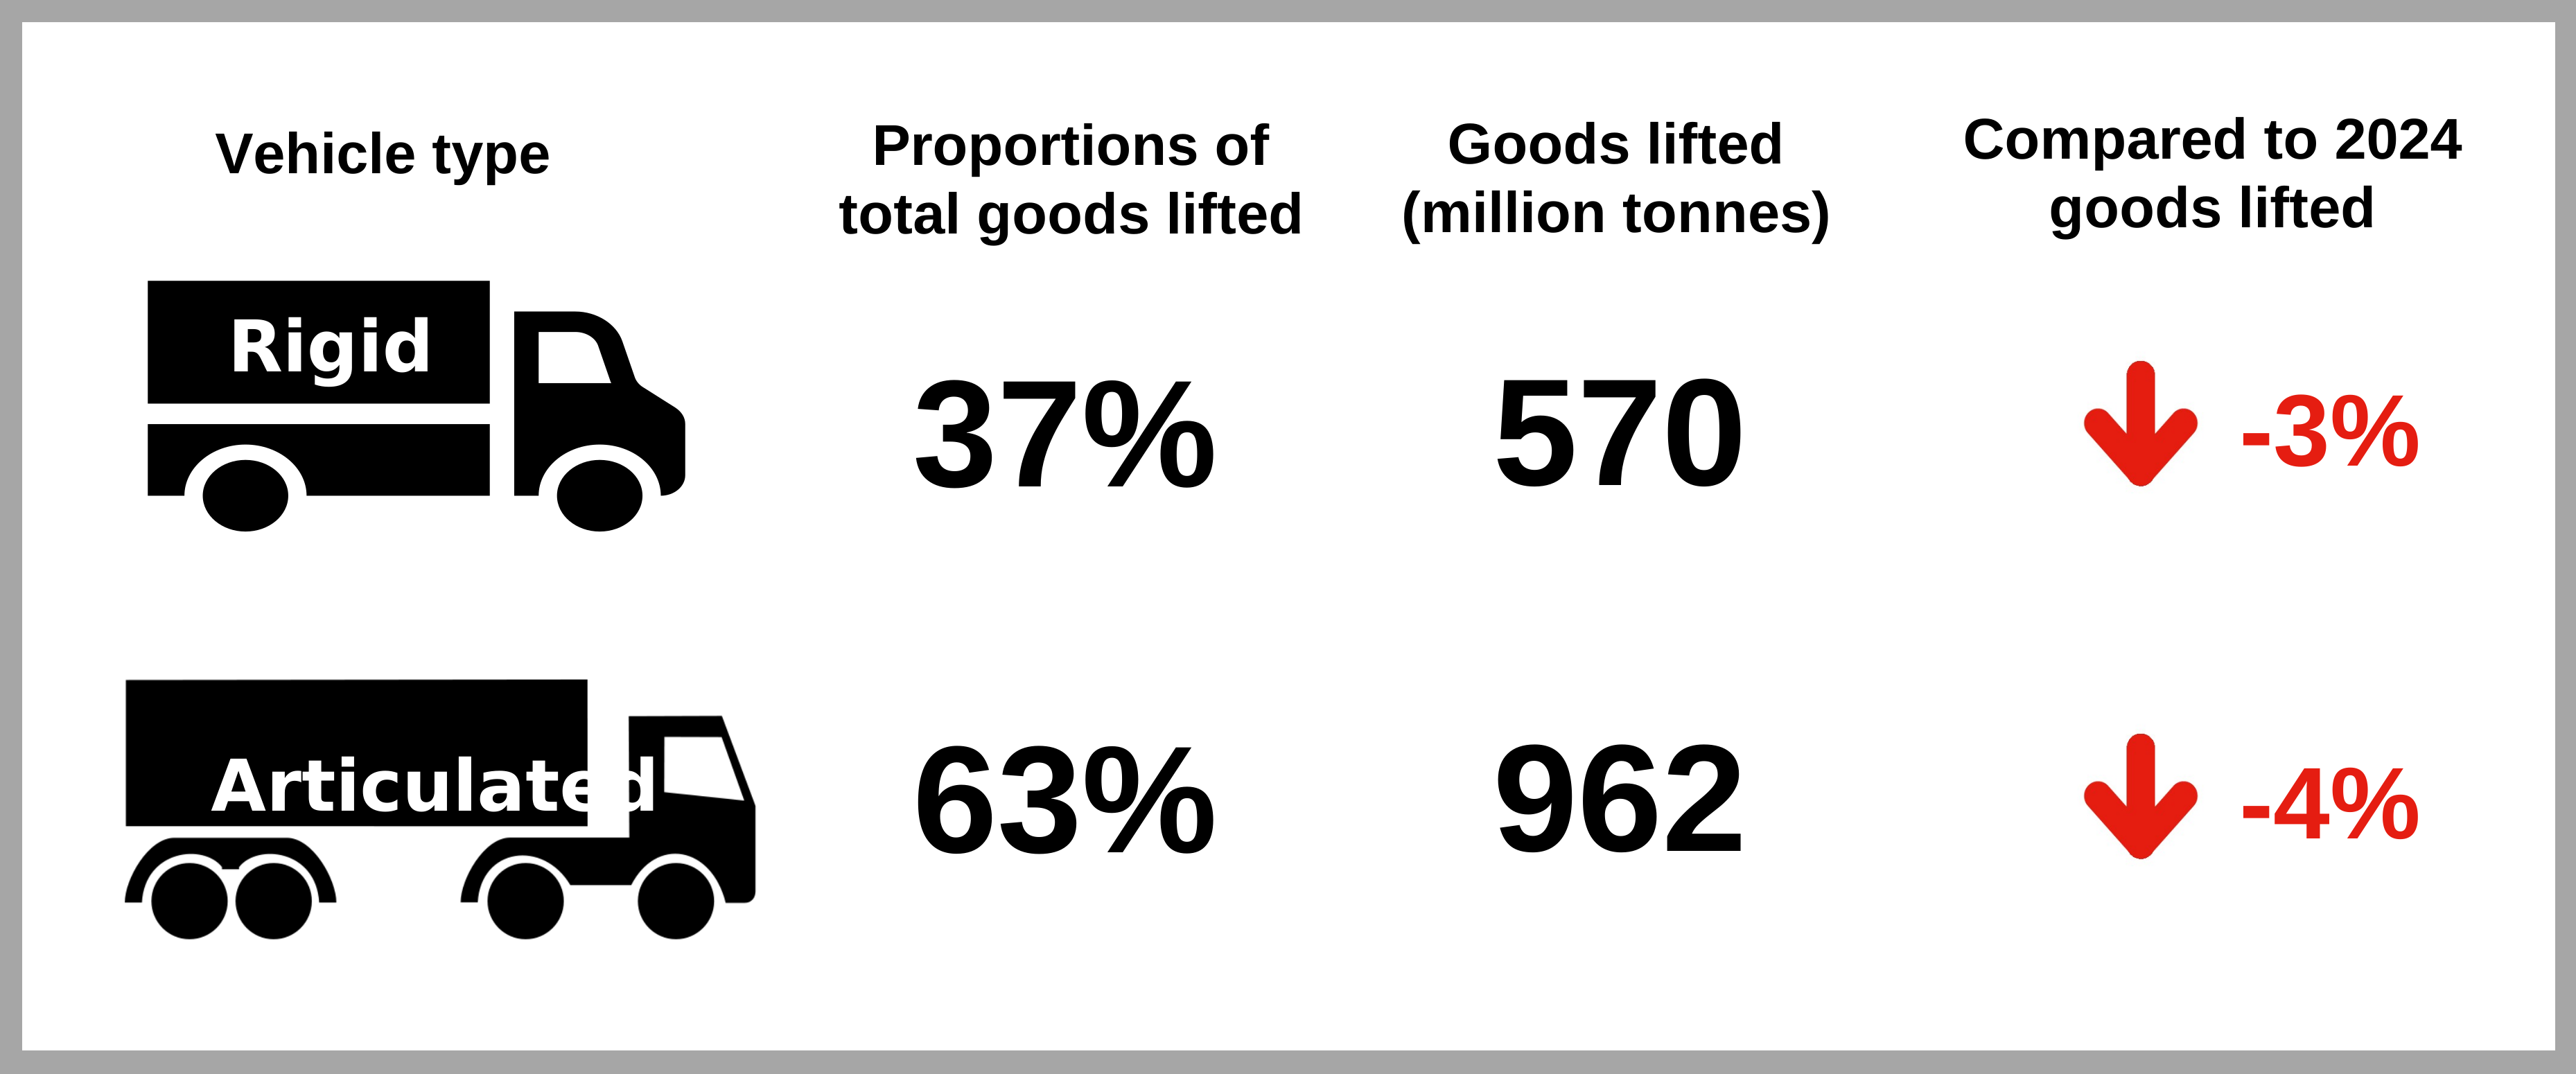
Infographic 6 shows that in 2025, rigid vehicles lifted 37% of total goods (570 out of 1,532 million tonnes) and articulated vehicles lifted 63% of total goods (962 million tonnes).
The percentage share is the same as 2024, when rigid vehicles lifted 37% of total goods (588 out of 1,586 million tonnes) and articulated vehicles lifted 63% of total goods (998 million tonnes).
Road freight activity by Northern Ireland registered HGVs
Note
The domestic road freight haulage survey for Northern Ireland (NI) measures road freight activity within the UK by HGVs registered in Northern Ireland and is run in parallel to the domestic road freight haulage survey for GB-registered vehicles.
The surveys sample sizes are proportional to the numbers of HGV in each country. Due to a smaller sample size for the NI survey, further breakdowns are often not possible to avoid disclosure.
Infographic 7: Road freight activity of NI-registered HGVs within the UK, in 2025 Table RFS0130

Infographic 7 shows that in 2025, within the UK, NI-registered HGVs transporting freight:
-
lifted 67.1 million tonnes of goods, which is 13% more than in 2024 (59.1 million tonnes)
-
moved 5.9 billion tonne kilometres of goods, which is 6% less than in 2024 (6.3 billion tonne kilometres)
Of the total amount of goods lifted by NI-registered vehicles within the UK, 79% (52.8 million tonnes) were lifted completely within Northern Ireland. This compares to the 73% (43.0 million tonnes) of the total amount of goods lifted in 2024 within the UK.
Further sources of information
Other statistics related to freight and trade are available:
International road freight statistics
Road goods vehicles travelling to Europe
ONS UK trade statistical bulletins
Port freight annual statistics
Rail freight statistics factsheet
About these statistics
These statistics were independently reviewed by the Office for Statistics Regulation in December 2016. They comply with the standards of trustworthiness, quality and value in the Code of Practice for Statistics and should be labelled ‘accredited official statistics’.
Data source
Previously domestic road freight data was collected via paper surveys until 1 August 2021, when the method to collect data transitioned to an online survey.
This annual statistical release summarises the domestic activity of GB-registered heavy goods vehicles (HGVs) operating in the UK during 2025. It covers the amount and type of goods carried, as well as their origin and destination and the distance the HGVs travelled.
A separate chapter is available on HGV driver vacancies in the UK, up to December 2025. It covers HGV driver vacancies, the impact of vacancies on deliveries, financial incentives and wage increases for HGV drivers.
Accompanying data tables are available which give further detail on the key results presented in this statistical release.
Further information about the statistics and methodology in this report can be found in the road freight domestic and international statistics guidance.
Strengths and weaknesses of data
The domestic road freight figures in this release are derived from a continuous survey sent to road freight businesses, the domestic road haulage survey. The survey provides information on the activity of UK-registered HGVs operating across the UK only.
These statistics excludes foreign-registered HGVs and vehicles with a gross vehicle weight of 3.5 tonnes or less (light goods vehicles and vans).
The figures also exclude GB-registered HGVs when operating outside of the UK. For information on GB-registered HGVs making international trips please see the accompanying international road freight statistics.
This survey is based on a stratified sample of HGVs. Figures are weighted to be representative of the HGV population however, like any survey, the figures in this publication are estimates with potential sampling errors. The sample sizes and sampling error estimates of the statistics can be found within Table RFS0129, broken down by type and weight of vehicle. In 2025, there were 8,346 GB-registered vehicles in the sample.
During 2026, the Road Freight team implemented significant changes to its data processing methods, introducing a greater level of automation and thereby reducing the need for manual intervention. These enhancements have improved the efficiency of data handling and enabled the production of more timely statistical publications. The benefits of these improvements are already evident and will continue to be reflected in future releases
Guidance on the methods used to compile these statistics can be found in the road freight statistics notes and definitions.
This release uses administrative data from DVLA and DVSA. More detail is available on the impact of this on the quality of these statistics.
Data comparability and 2021 methodology change
Before quarter 3 2021, data was collected via paper questionnaires. At the start of quarter 3 2021, the survey forms transitioned from paper to online format. Here, the vehicle operator provides the same information as previously requested in the paper survey. The new online survey has been made more intuitive based on extensive user testing.
The structure has been streamlined and guidance provided for each relevant question to aid interpretation. This increases the likelihood of respondents providing information that more accurately reflects the vehicles true activity, therefore providing more accurate estimates of the overall HGV population.
Due to the methodology change, comparisons between paper (before quarter 3 2021) and online data should not be made. This means no long-term data trends are available for these statistics. More information regarding the methodology change can be found within the methodology note. Long term trends on the level of HGV traffic in Great Britain over time are available in DfT’s road traffic statistics.
Instructions for printing and saving
Depending on which browser you use and the type of device you use (such as a mobile or laptop) these instructions may vary.
You will find your print and save options in your browser’s menu. You may also have other options available on your device. Tablets and mobile device instructions will be specific to the make and model of the device.
How to search
Select Ctrl and F on a Windows laptop or Command and F on a Mac
This will open a search box in the top right-hand corner of the page. Type the word you are looking for in the search bar and press enter.
Your browser will highlight the word, usually in yellow, wherever it appears on the page. Press enter to move to the next place it appears.
Contact us
Road freight statistics
Email roadfreight.stats@dft.gov.uk
Media enquiries 0300 7777 878
To hear more about DfT statistical publications as they are released, follow us on X at DfTstats.