RRCGB 2025: Vehicles involved
Published 30 July 2026

© Crown copyright 2026
This publication is licensed under the terms of the Open Government Licence v3.0 except where otherwise stated. To view this licence, visit nationalarchives.gov.uk/doc/open-government-licence/version/3 or write to the Information Policy Team, The National Archives, Kew, London TW9 4DU, or email: psi@nationalarchives.gov.uk.
Where we have identified any third party copyright information you will need to obtain permission from the copyright holders concerned.
This publication is available at https://www.gov.uk/government/statistics/reported-road-casualties-great-britain-final-results-2025/rrcgb-2025-vehicles-involved
About this chapter
This chapter provides details of the vehicles involved in reported road collisions in Great Britain, covering collision involvement rates and risk to occupants and other road users for different vehicle types.
1. Main findings
Based on data on road collisions in Great Britain reported to the police up to 2025:
- Cars account for the majority of vehicles involved in road collisions. In 2025, 60% of vehicles in fatal collisions, and 69% of vehicles in collisions overall were cars. This reflects the fact that cars account for the majority of road traffic.
- Motorcycles had the highest collision involvement rates when distance travelled is taken into account. Per billion miles travelled, motorcycles were substantially more likely to be involved in fatal, serious and overall injury collisions than any other vehicle type.
- Collision involvement rates have generally fallen over the past two decades. Involvement rates in fatal and serious collisions declined for most vehicle types, with some of the largest reductions seen for heavy goods vehicles.
- The risk posed by a collision varies considerably by vehicle type. While most people killed in collisions involving motorcycles or pedal cycles were the rider or cyclist themselves, the majority of fatalities in collisions involving heavy goods vehicles were other road users.
- Larger vehicles generally present greater risk to other road users. Per vehicle billion miles travelled, the number of other road users killed was highest for buses and coaches followed by heavy goods vehicles in 2025. However, cars were involved in the largest number of fatalities affecting other road users, reflecting the prevalence of cars in traffic.
Further breakdowns by vehicle type, collision severity and casualty outcome are provided in the sections below and in the accompanying data tables and factsheets.
2. Vehicles involved in collisions
2.1 Numbers
Chart 1 and Table 1 show the proportion and number of vehicles involved in road injury collisions of different severities in 2025:
- Cars accounted for 60% of vehicles in fatal collisions, and 69% of vehicles in collisions of all severities
- The proportion of motorcycles involved in collisions increases with collision severity, indicating that collisions involving motorcyclists are more likely to result in fatal or serious outcomes
- HGVs accounted for 7% of vehicles involved in fatal collisions, compared with 2% of vehicles involved in collisions overall. In contrast, pedal cycles accounted for 4% of vehicles involved in fatal collisions, compared with 9% of vehicles involved in collisions overall.
These broad overall patterns have varied relatively little over the past decade and reflect the prevalence of vehicles in traffic as well as the risk of vehicles being in a collision, which is considered further below.
Chart 1: Share of vehicles involved in reported road collisions by severity and vehicle type, Great Britain 2025 RAS0502
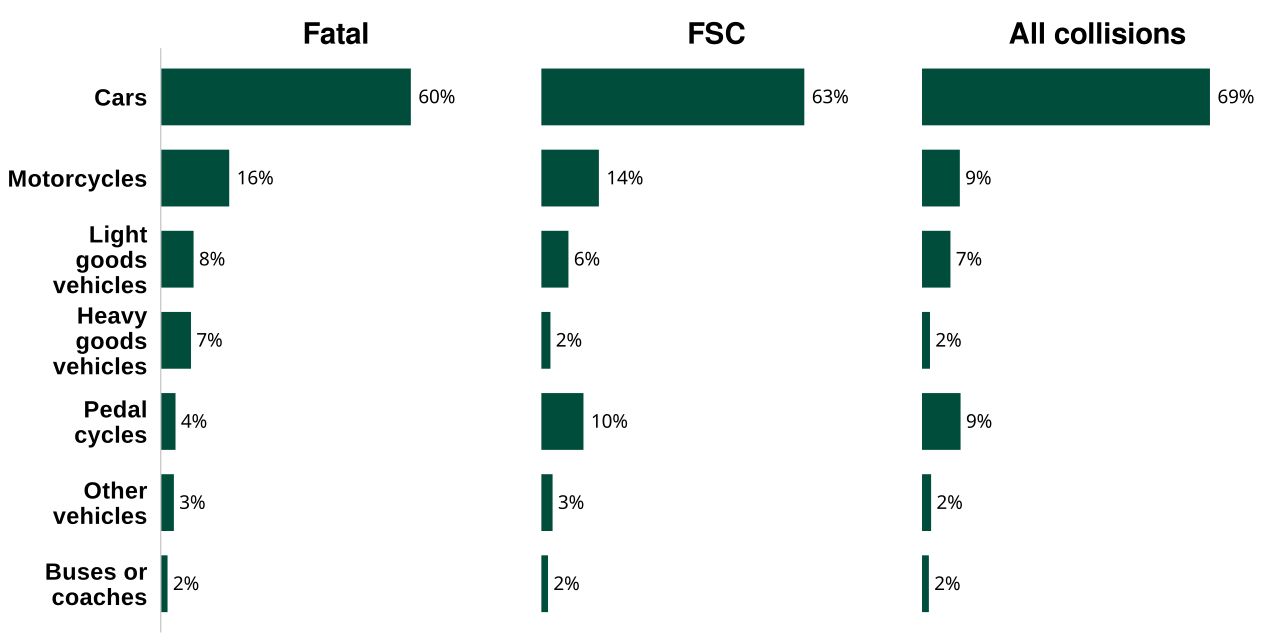
Table 1: Number of vehicles involved in reported road collisions by severity and vehicle type, Great Britain 2025 RAS0502
| Vehicle type | Fatal | FSC | All collisions |
|---|---|---|---|
| Cars | 1,537 | 29,957 | 127,122 |
| Motorcycles | 421 | 6,554 | 16,695 |
| Light goods vehicles | 202 | 3,085 | 12,555 |
| Heavy goods vehicles | 186 | 1,034 | 3,517 |
| Pedal cycles | 91 | 4,797 | 17,021 |
| Other vehicles | 81 | 1,278 | 4,015 |
| Buses or coaches | 42 | 760 | 3,023 |
| All vehicles | 2,560 | 47,465 | 183,948 |
Other vehicles. The above table shows the main vehicle types; a more detailed breakdown is available in table RAS0502, including horses and powered personal transporters (largely e-scooters).
2.2 Involvement rates
Chart 2 shows the involvement rate of different vehicle types per billion vehicle miles travelled, which adjusts for the impact of traffic volumes. This shows that:
- Rate of involvement in collisions of all severities per billion miles are considerably highest for motorcyclists, followed by pedal cyclists and then buses and coaches
- LGVs (vans) have the lowest involvement rates, followed by HGVs and cars – except for fatal collisions, where HGVs have higher rates than cars.
These figures relate to the risk of vehicles being involved in collisions; the nature of this risk (whether to users of the vehicle or other road users) is considered further below.
Chart 2: Vehicles involved in reported road collisions per billion vehicle miles, by vehicle type and severity, Great Britain 2025 RAS0502
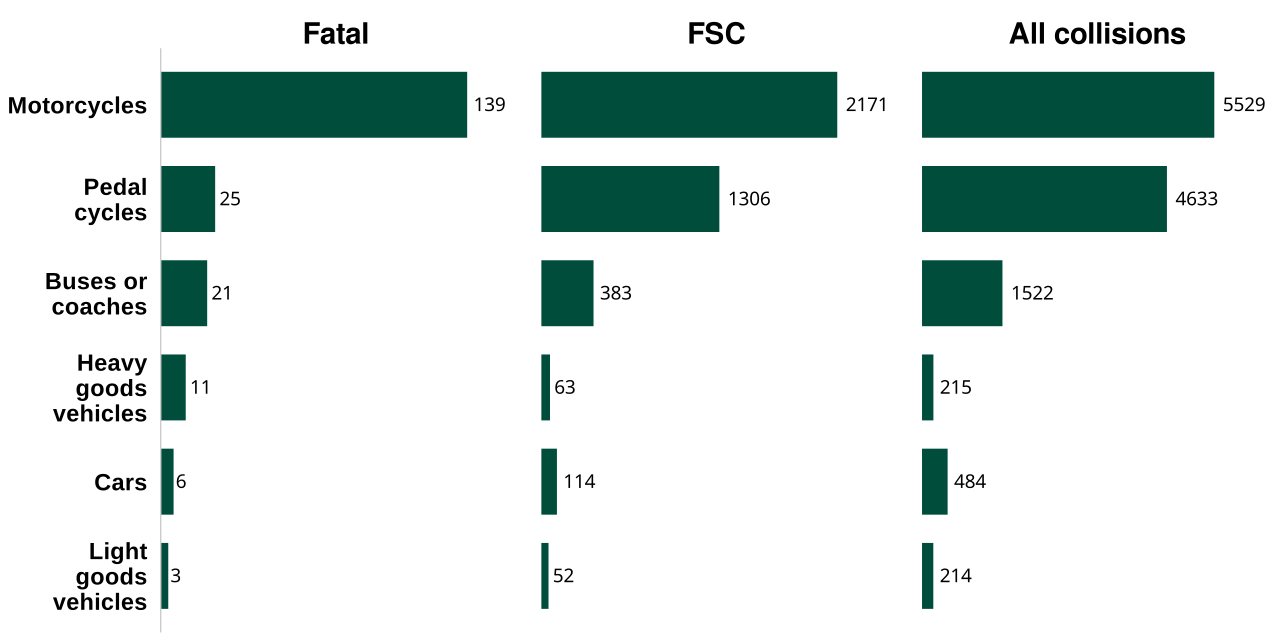
Table 2: Vehicle reported road casualty involvement rates per billion (vehicle) miles by road user type, Great Britain 2025 RAS0502
| Vehicle type | Fatal | FSC | All collisions |
|---|---|---|---|
| Motorcycles | 139 | 2,171 | 5,529 |
| Pedal cycles | 25 | 1,306 | 4,633 |
| Buses or coaches | 21 | 383 | 1,522 |
| Heavy goods vehicles | 11 | 63 | 215 |
| Cars | 6 | 114 | 484 |
| Light goods vehicles | 3 | 52 | 214 |
3. Recent trends
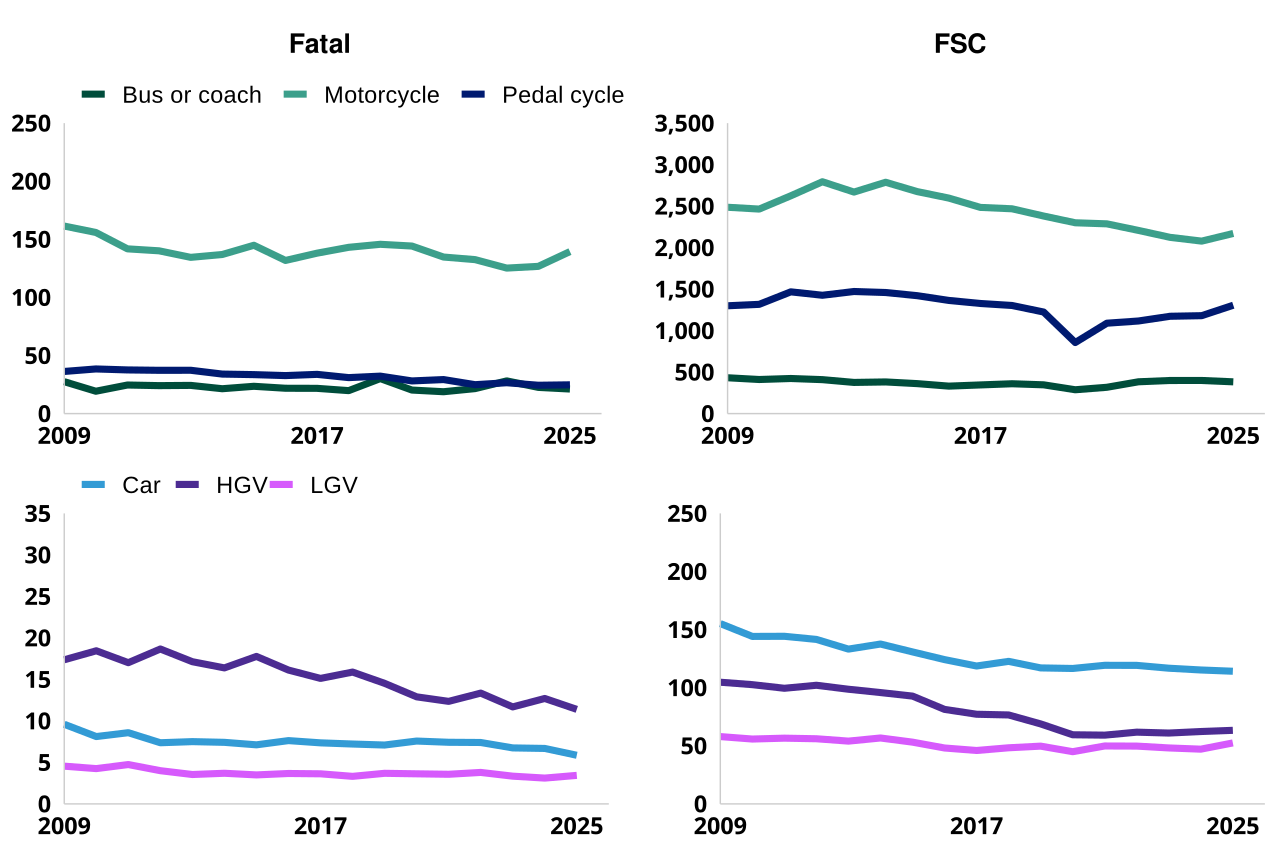
In general, collision involvement rates (defined as the number of vehicles involved in collisions per billion vehicle miles travelled) have declined over the past decade, reflecting a reduction in the overall number of collisions. Chart 3 shows the trend in involvement rates for fatal and FSC collisions over the past decade:
- In general, vehicle collision involvement rates have fallen over this period; this reflects a reduction in the number of collisions as well as increases in vehicle traffic. However reductions have been smaller in the last decade than in the previous one.
- The biggest percentage reduction over this period has been for heavy goods vehicles
- In 2025, there were increases in the FSC involvement rate for motorcycles and pedal cycles, though year on year changes should be treated with caution.
Chart 3: Vehicles involved in fatal and FSC collisions per billion vehicle miles, Great Britain, 2009 to 2025 RAS0502
4. Casualties in collisions by vehicle type
Vehicles involved in collisions present different levels of risk to their occupants and to other road users. This section explores casualty risk for different types of vehicles in collisions.
4.1 Casualties by vehicles involved
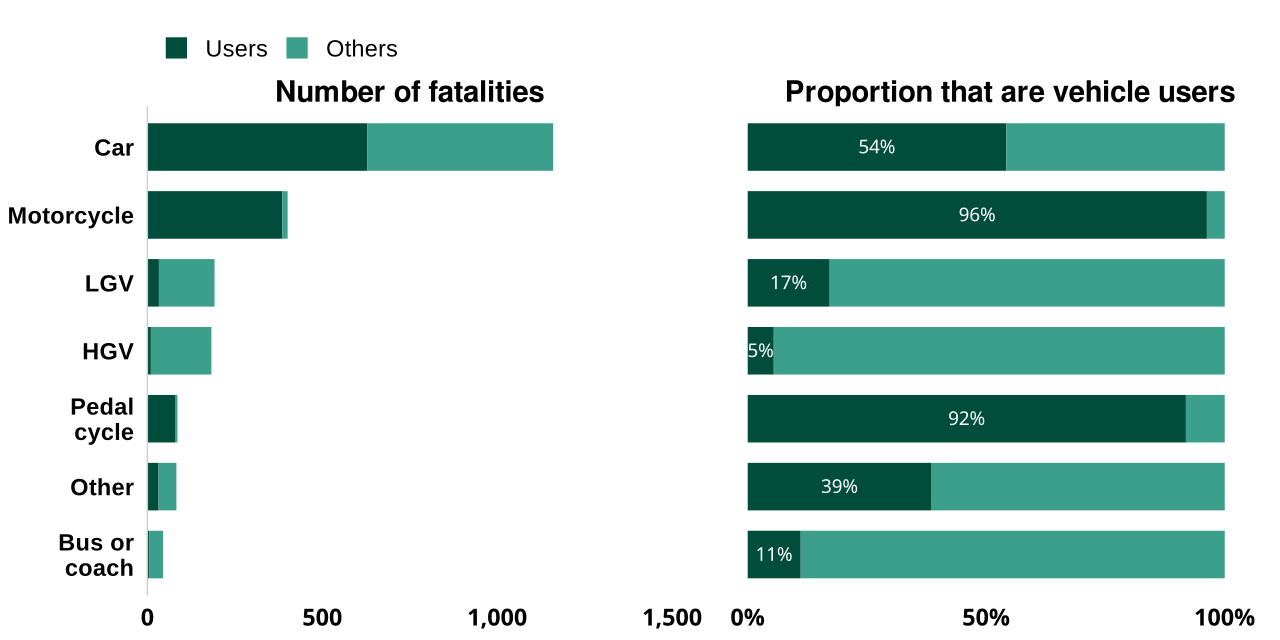
The section above presented the number of vehicles in collisions. Chart 4 shows the breakdown of fatalities in collisions by whether an occupant or user of the vehicle, or another road user (fatal collisions can involve more than one vehicle type, so that some fatalities are counted more than once). This shows:
- Around three-quarters of road deaths are in collisions which involve at least one car (75% in 2025 – 1,160 deaths involved cars out of 1,538 total road deaths).
- Of those killed in collisions involving a car, in 2025 just over half (54%) were car occupants, and the remainder other road users.
- Over 90% of those killed in collisions involving a motorcycle or pedal cycle are the motorcyclist or pedal cyclist themselves.
- Conversely, in collisions involving HGVs in 2025, more than 90% of those killed were other road users.
Chart 4: Number of fatalities in collisions involving different vehicle types, and the proportion that are occupants or users of that vehicle type, Great Britain 2025 RAS0601
4.2 Risk to other road users by vehicle type
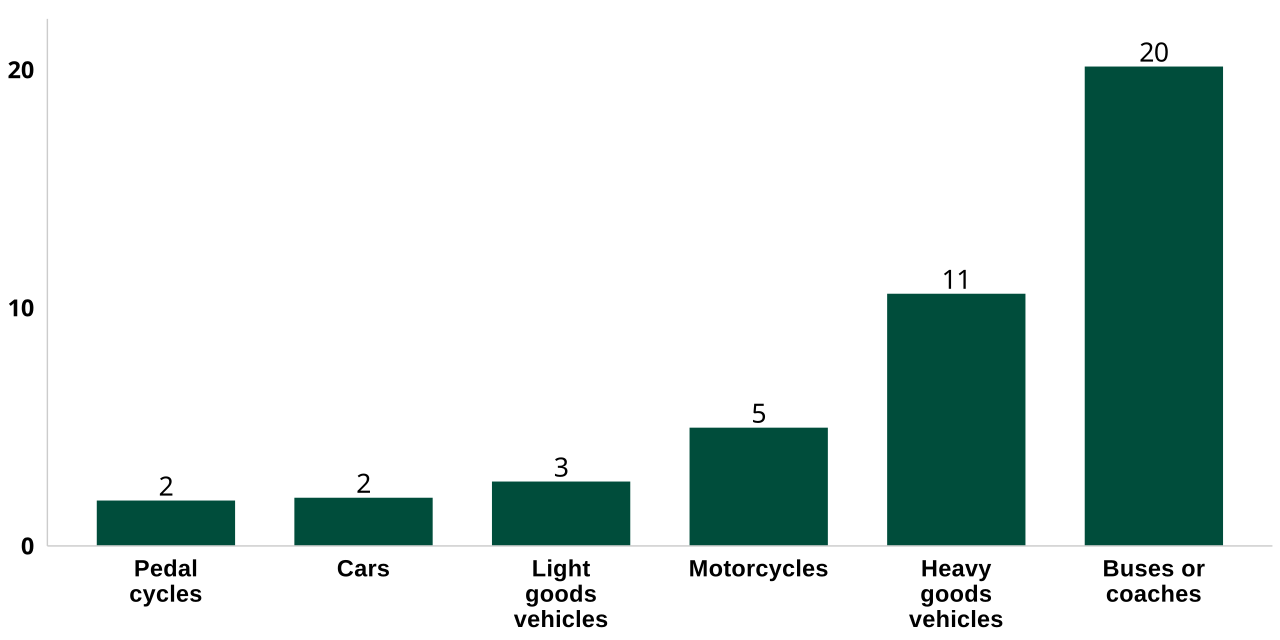
The number of fatalities in collisions involving cars (shown in the section above) largely reflects the prevalence of cars in traffic. Risk to road users by road user type is covered in a separate chapter, however the risk that different vehicle types pose to other road users (that is, casualties not travelling in the relevant vehicle) can also be considered. Chart 5 shows that:
- Per vehicle mile, buses had the highest rate of other road user fatalities, followed by HGVs and motorcyclists. These are larger vehicles, or ones which may be more prevalent in urban areas where there are a greater number of vulnerable road users.
- Pedal cyclists present lower risks to other road users in collisions on this basis.
Chart 5: Other road users killed in collisions involving each vehicle type, per billion vehicle miles, Great Britain 2025 RAS0601 For each vehicle shown in the chart, figures are the number of road users, other than users of the named vehicle, that were killed in collisions involving the named vehicle, divided by billion vehicle miles travelled by the named vehicle.
4.3 Fatalities by casualty and vehicles in collision
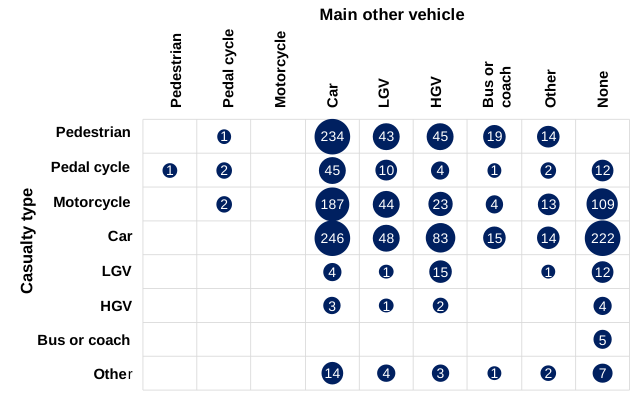
The above sections consider overall risk to other road users for each vehicle type. Chart 6 shows a further breakdown of fatalities in reported road collisions by road user type (in the rows) and the other main vehicle involved (in the columns) - this is the largest vehicle in the collision, excluding any that the casualty was travelling in or on. This shows that:
- Cars are the vehicle type most often involved in collisions where other road users were killed, followed by HGVs
- A considerable proportion of car occupant and motorcyclist deaths (35% and 28% respectively) were in collisions involving no other vehicle
- There are very few deaths in collisions involving pedestrian casualties or pedal cyclists that are not the pedestrian or pedal cyclist themselves
Chart 6: Reported road fatalities in collisions by road user type and (other) main vehicle involved in the collision, Great Britain 2025 RAS0601
4.4 Vehicles hitting pedestrians
Chart 6 above illustrates how the majority of pedestrian fatalities are in collisions with cars, and that there are very few deaths in collisions involving pedestrians or cyclists other than the pedestrians or cyclists themselves.
Table RAS0601 includes further details of vehicles which hit pedestrians:
- Most pedestrians killed or injured in reported road collisions are hit by cars - in 2025, 245 pedestrians killed were hit by cars (67% of all pedestrian fatalities), and overall there were 15,222 total pedestrian casualties hit by cars (76% of all pedestrian casualties).
- By comparison, very few pedestrians killed are hit by pedal cyclists - in 2025, 2 pedestrians killed were hit by pedal cycles (1% of all pedestrian fatalities), and overall there were 718 total pedestrian casualties hit by pedal cycles (4% of all pedestrian casualties).
- Figures for pedal cyclists hitting pedestrians are low and can fluctuate from year to year. On average over the past 10 years, 3 pedestrians killed were hit by pedal cycles (1% of all pedestrian fatalities), and overall there were 492 total pedestrian casualties hit by pedal cycles (2% of all pedestrian casualties).
5. Further information
Further data and statistics covering vehicles involved in collisions is available via:
- Work-related casualties factsheet, which uses the journey purpose variable on the STATS19 vehicle record
- Spreadsheet data tables, particularly section RAS05: vehicles involved
- Interactive data tools
6. About this data
Detailed information about the data used in this chapter, including its strengths and limitations, can be found in the guidance pages.
6.1 STATS19 data
The statistics in this publication are based on data collected through the STATS19 system, which records personal injury road collisions on public roads in Great Britain. STATS19 data are reported to the Department for Transport by police forces using a common national specification, allowing consistent analysis across time and geography. All collisions reported by the police within 30 days and that occurred on a public highway involving at least one motor vehicle, horse rider or pedal cyclist, and where at least one person was injured, are included in these statistics.
STATS19 is the primary source used to understand long-term trends in road collisions and casualties, and to monitor and evaluate road safety policies and interventions. Its standardised approach enables comparison at local, regional and national level, and provides a long-running time series underpinning road safety analysis.
There is no obligation for people to report all personal injury collisions to the police, and not all collisions are reported to the police, particularly those involving only slight injuries, meaning some types of incidents are under recorded. Therefore these figures do not represent the full range of collisions or casualties in Great Britain.
The quality and completeness of the data can also vary, especially for variables based on officer judgement at the scene. Changes to data collection systems, guidance or reporting practices over time may also affect comparability of trends. For example, recent updates to the STATS19 specification (including the introduction of new variables) may lead to discontinuities in some data series.
6.2 Injury severity reporting
The figures in this release for injured casualties are based on adjusting figures reported by the police to take account of changes in the reporting of injury severity by some police forces in recent years. These adjusted figures can reliably be used to compare trends over time across the country. More details can be found in our severity adjustments guidance.
7. Instructions for printing and saving
Depending on which browser you use and the type of device you use (such as a mobile or laptop) these instructions may vary.
Tablets and mobile devices normally have the option to “find in text” and “print or save” in their sharing or quick options menu of their browser, but this will vary by device model.
8. How to search
Select Ctrl and F on a Windows laptop or Command and F on a Mac
This will open a search box in the top right-hand corner of the page. Type the word you are looking for in the search bar and press enter.
Your browser will highlight the word, usually in yellow, wherever it appears on the page. Press enter to move to the next place it appears.
9. Contact details
Road safety statistics
Email roadacc.stats@dft.gov.uk
To hear more about DfT statistical publications as they are released, follow us on X (formerly known as Twitter) at DfTstats.