Police powers and procedures: Other PACE powers, England and Wales, year ending 31 March 2021
Updated 14 December 2021
Applies to England and Wales

© Crown copyright 2021
This publication is licensed under the terms of the Open Government Licence v3.0 except where otherwise stated. To view this licence, visit nationalarchives.gov.uk/doc/open-government-licence/version/3 or write to the Information Policy Team, The National Archives, Kew, London TW9 4DU, or email: psi@nationalarchives.gov.uk.
Where we have identified any third party copyright information you will need to obtain permission from the copyright holders concerned.
This publication is available at https://www.gov.uk/government/statistics/police-powers-and-procedures-other-pace-powers-england-and-wales-year-ending-31-march-2021/police-powers-and-procedures-other-pace-powers-england-and-wales-year-ending-31-march-2021
Frequency of release: Annual
Forthcoming releases: Home Office statistics release calendar
Home Office responsible statistician: Jodie Hargreaves
Press enquiries: pressoffice@homeoffice.gov.uk
Telephone: 0300 123 3535
Public enquiries: crimeandpolicestats@homeoffice.gov.uk
Privacy information notice: Home Office Crime and Policing Research and Annual Data Requirement (ADR) data – Privacy Information Notices
1. Introduction
1.1 Changes to the Police Powers and Procedures statistics release
The Home Office has undertaken a review of the annual ‘Police powers and procedures’ statistical bulletin and, given the volume and variety of topics covered, a decision was made to split the release into two separate statistical bulletins.
The first release, Police powers and procedures: Stop and search and arrests, England and Wales, year ending 31 March 2021, which was published on 18 November 2021, contains statistics on the use of the powers of stop and search and arrest by the police in England and Wales up to the year ending 31 March 2021.
This release is the second of the two to be published on police powers and contains statistics on detentions under the Mental Health Act 1983, detentions and intimate searches under the Police and Criminal Evidence Act 1984, and the use of pre-charge bail and released under investigation by the police in England and Wales up to the year ending 31 March 2021. Data on breath tests and fixed penalty notices (and other outcomes) for motoring offences, for the year ending 31 December 2020, are also included in this release.
1.2 Contents of this release
The section on detentions under section 136 of the Mental Health Act 1983 contains data provided by the 43 police forces in England and Wales, and British Transport Police, on a financial-year basis. It includes statistics on the:
- number of detentions under section 136 of the Mental Health Act 1983
- age-group, gender and ethnicity of persons detained
- type of place of safety used to detain individuals, and the reason for using a police station (where applicable)
- method of transportation used to transport an individual to a place of safety, and the reason for using a police vehicle (where applicable)
The breath tests section contains data from the 43 police forces in England and Wales on a calendar-year basis. It includes statistics on the number of alcohol screening breath tests carried out by police and tests that were positive or refused.
The Fixed Penalty Notices (FPNs) and other outcomes for motoring offences section contains data from the national fixed penalty processing system (PentiP), on a calendar-year basis. It includes statistics on the number of:
- endorsable and non-endorsable FPNs issued for a range of motoring offences
- FPNs issued as a result of camera-detected offences
- cases where the penalty was paid
- motoring offences that resulted in a driver retraining course, or court action
The section on other PACE powers contains data provided by the 43 police forces in England and Wales on a financial-year basis. It includes statistics on the:
- number of persons detained under a warrant for further detention
- number of intimate searches made under section 55 of PACE
Annex A provides data on pre-charge bail, released under investigation, voluntary attendance interviews and breaches of pre-charge bail, which have also been designated as Experimental Statistics.
Annex B provides data on detentions under section 135 of the Mental Health Act 1983, which have been designated as Experimental Statistics.
1.3 Improved data collection and new analysis in this release
In response to requests for more granular data from users, and in line with ‘V4:Innovation and Improvement’ of the Code of Practice (CoP) for Statistics, for the year ending March 2021, the Home Office expanded the pre-charge bail collection from aggregate-level data to incident-level data so that as well as bail duration the Home Office now receives additional information on age, gender, ethnicity, offence type and outcome for each instance of bail. The collection was also expanded to include information on released under investigation, breaches of pre-charge bail, and voluntary attendance to an interview. As this is the first year that these data have been collected, the information collected was done so on a voluntary basis. Once the data are deemed to be of good enough quality, this collection will move to a mandatory collection.
As part of the consultation process, several forces were asked about the feasibility of making such a change and the proposal to move to recording each incident of pre-charge bail was made to the Policing Data Requirement Group, who approved the change. This group is made up of stakeholders including national policing leads. This group considers the ‘need of the data against the reporting burden to forces’ for all collections; along with reviewing the quality of the data collected. Increasing the amount of available information not only adds to the insights and analysis possible with more data but also increases value and transparency for users (‘V1: Relevance to Users’ of the CoP).
Whilst 40 forces provided data on pre-charge bail, a subset of 23 police forces provided data on RUI. 18 police forces provided data on voluntary attendance to interview, and 11 police forces provided data on breaches of pre-charge bail. Some of these forces identified quality concerns with their data, including partial returns. Therefore, data in Annex A give an indicative picture only, and should be treated with caution.
Due to the provisional and incomplete nature of this dataset, the statistics on pre-charge bail, RUI and voluntary attendance have been designated as Experimental Statistics, to acknowledge that further development will take place in the future. The Home Office is working with forces to understand the issues they face with this data collection and will consider whether any changes to the data return requirement is needed.
1.4 National Statistics status
These statistics have been assessed by the UK Statistics Authority to ensure that they continue to meet the standards required to be designated as National Statistics. This means that these statistics meet the highest standards of trustworthiness, impartiality, quality and public value, and are fully compliant with the Code of Practice for Statistics.
The Home Office worked closely with the UK Statistics Authority to improve information on the quality and limitations of the various datasets, and the ways in which the Home Office engages with users of the statistics. This is documented in the user guide, which is published alongside this release.
Given the partial nature of the data and inconsistencies across forces, statistics on detentions under section 135 of the Mental Health Act and pre-charge bail are designated as Experimental Statistics. These statistics do not yet meet the overall quality standards necessary to be designated as National Statistics. The Home Office intends to improve the completeness and quality of these data in future years.
2. Detentions under section 136 of the Mental Health Act 1983
Key results
In the year ending March 2021:
There were 33,652 detentions under section 136 of the Mental Health Act 1983. This was a 1% decrease compared with the previous year (when comparing data for 40 forces who were able to provide full data in both years).
Where the details were known, 53% were detentions of males, 94% of cases were adults aged 18 or over and 85% were people from a White ethnic group.
Where the details were known, the person being detained was taken to a health-based place of safety in 76% of cases. Just under a fifth (18%) were taken to Accident and Emergency as a place of safety, and 132 people (0.4%) were taken to a police station.
2.1 Introduction
Police forces in England and Wales regularly interact with people experiencing mental ill health. Sometimes these interactions may result in the need to remove a person from where they are, and take them to a place of safety, under sections 135 and 136 of the Mental Health Act 1983. This chapter relates to detentions under section 136 only. See Annex A for information on detentions under section 135 of the Mental Health Act 1983.
Under section 136 of the Mental Health Act a police officer may remove a person from any public place, other than a private dwelling, to a place of safety if, in the officer’s judgement, that person appears to be suffering from a mental disorder and needs immediate care or control, in the interests of their safety or that of others to be assessed by an approved mental health professional and an approved s12 doctor. The maximum period for which a person can be detained at a place of safety under sections 135 or 136 is usually up to 24 hours, with the possibility of this period being extended by a further 12 hours if a person could not be assessed for clinical reasons.
Data Collected
Following concerns raised about the quality and transparency of police data in this area, at the Policing and Mental Health Summit in October 2014 the then Home Secretary announced that the Home Office would work with the police to develop a new data collection covering the volume and characteristics of detentions under the Mental Health Act 1983.
A data collection was developed which requests forces to provide information on the age, gender and ethnicity of people detained, as well as the place of safety used (including, where applicable, the reason for using police custody), and the method of transportation used (including, where applicable, the reason for using a police vehicle).
In this report, we refer to gender rather than sex of people arrested. ‘Sex’ can be considered to refer to whether someone is male or female based on their physiology, with ‘gender’ representing a social construct or sense of self that takes a wider range of forms. We are reporting the data in the format they are collected and we are working to bring these data in line with Government Statistical Service sex and gender harmonisation standards.
This section summarises the findings on detentions under section 136 from police forces in England and Wales, as well as the British Transport Police, for the year ending March 2021. Prior to year ending March 2017, data on the total number of section 136 detentions were collected and published by the National Police Chiefs’ Council (NPCC), available at Reports, reviews and responses to consultations.
Greater Manchester Police and Gloucestershire Police reported changes in recording practices in the latest year, and Dyfed-Powys were not able to supply data for the year ending March 2021. These forces have been excluded from year-on-year comparisons of the total number of detentions under section 136, however have not been excluded from statistics on gender, ethnicity, place of safety, method of transport to place of safety, or reason taken to a police station. Therefore, caution should be taken when interpreting changes between the latest year and the previous year.
2.2 Detentions under section 136 of the Mental Health Act 1983
In the year ending March 2021 there were 33,652 detentions under section 136 of the Mental Health Act 1983.
When comparing forces who were able to submit complete data in both years[footnote 1], there were 32,239 detentions under section 136 in the year ending March 2021, a fall of 393 detentions compared with the previous year (1.2%). This follows a period of increases between year ending March 2017 and year ending March 2020.
Of the cases where the gender of the person being detained was recorded (98%), 53% were male detainees.
The majority of cases (94%) involved adults aged 18 or over (excluding those cases where the age of the person being detained was not recorded).
In terms of the ethnicity of those being detained[footnote 2] (excluding those cases where the ethnicity was not recorded):
- 85% were White
- 8% were Black, African, Caribbean or Black British
- 5% were Asian or Asian British
- 1% were of Mixed or Multiple ethnic groups
- The remaining 1% of people detained were of another ethnic group
Figure 2.1 Ethnicity of those detained under section 136 of the Mental Health Act 1983, England and Wales, year ending March 2021

Source: MHA_03, Home Office
Notes:
1. Excludes those cases where the ethnicity was not known.
Method of transport to a place of safety
Some forces were unable to distinguish the method of transport used to transport a person to a place of safety. This resulted in the method of transport for 12% of cases being recorded as “not known”. Of those cases where the method of transport was recorded, an ambulance was used in 15,440 (52%) of cases. A police vehicle was used in a further 13,021 (44%) of cases. The remaining 4% were ‘None (already at a place of safety)’, ‘Other health vehicle’, or ‘Other’.
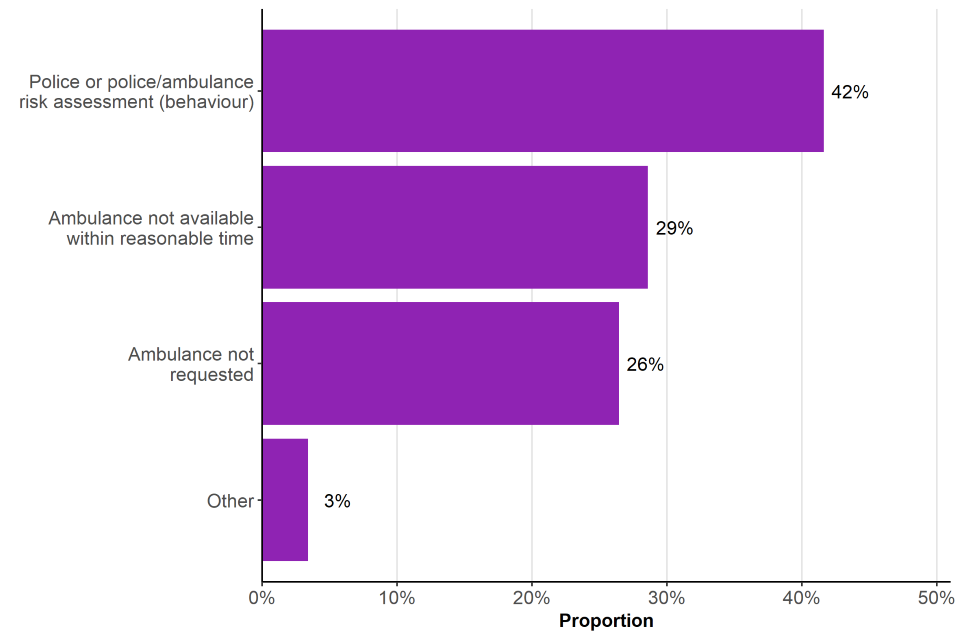
In the case where a police vehicle was used to transport the person to a place of safety, police forces are requested to give a reason why. In the 13,021 cases where a police vehicle was used, the reason why was “not known” in 2,628 cases (20%). Of those cases where the reason for using a police vehicle was recorded, 4,324 (42%) were because a risk assessment concluded the person being detained should be transported in a police vehicle due to their behaviour. This proportion had been stable in the previous 4 years at around 35%. There were also 2,971 cases (29%) where a police vehicle was used because an ambulance was not available in a reasonable amount of time (down from 38% last year), and 2,746 (26%) were because an ambulance had not been requested (a similar proportion to in the previous year). The remaining cases (3%) were for other reasons including where an ambulance was re-tasked to a higher priority call and when an ambulance crew refused to convey.
Figure 2.2 Reasons for using a police vehicle to transport a detainee to a place of safety, England and Wales, year ending March 2021
Source: MHA_04b, Home Office
Notes:
1. Excludes those cases (2,628) where the reason for using a police vehicle was not known.
2. Other includes cases where an ambulance was re-tasked to a higher priority call and when an ambulance crew refused to convey.
Place of safety
Following a detention under section 136 of the Mental Health Act, a place of safety was recorded in 93% of cases. Of the cases where the place of safety was known, almost three-quarters (76%) of detainees was taken to a health-based place of safety (HBPOS)[footnote 3], up from 73% in the previous year. Just under a fifth (18%) of people were taken to Accident and Emergency as a place of safety in the latest year, down from 21%. 132 people (0.4%) were taken to a police station, a similar proportion as in the previous year.
In those cases where the person being detained was taken to a police station (excluding those cases where the reason is not known)[footnote 4]:
- 39% were arrested for committing an offence
- 29% were because conditions in Regulations were met[footnote 5]
- 32% were for another reason
Figure 2.3 Reasons for the detainee being taken to a police station, England and Wales, year ending March 2021

Source: MHA_05b, Home Office
Notes:
1. Excludes those cases where the reason for using a police station was not known.
New provisions contained in the Policing and Crime Act 2017 and designed to improve outcomes for people in mental health crisis, came into effect on 11 December 2017. These included banning the use of police cells for under 18s in mental health crisis and ensuring that they can only be used as a place of safety for adults in genuinely exceptional circumstances. Where age and place of safety were reported, there were no under 18s taken to police custody as a place of safety in the latest year.
2.3 Other data sources
As part of its annual Mental Health Bulletin, NHS Digital (formerly the Health and Social Care Information Centre) publishes data on inpatients detained in hospitals in England under the Mental Health Act 1983. Although these numbers will include some cases where the police initially detained the individual, they will also include a large number of other cases where the police were not involved. The latest data can be found on NHS Digital.
Data on the number of occasions where a HBPOS was used can differ between the NHS Digital data and the NPCC data, due to the different data sources used.
3. Breath tests
Key results
In the year ending December 2020:
There were 252,069 breath tests carried out by police, an 18% fall compared with the previous year (when comparing data for 41 forces who were able to provide full data in both years). This fall continues the downward trend seen since the peak of 703,490 breath tests in 2009.
The overall fall in breath tests in 2020 was driven by a decrease in tests during periods of national lockdown and tiers restrictions. April 2020 saw a 49% fall in the number of breath tests performed compared to April of the previous year. March, May, June and November also saw notable falls in tests.
As in previous years, more breath tests were undertaken in December than any other month, coinciding with police drink and drug driving campaigns.
17% of breath tests were positive or refused, a similar proportion to the previous year.
3.1 Introduction
Under the Road Traffic Act 1988, police may conduct a breath test at the roadside to determine whether motorists are driving with alcohol in their body, beyond the prescribed limit.
This section includes data on the number of breath tests carried out by police in England and Wales (excluding BTP). It presents data on a calendar-year basis up to and including 2020. The data show the number of:
- breath tests carried out by police in England and Wales
- positive/refused breath tests
- breath tests conducted per 1,000 population in each police force across England and Wales
Further details relating to definitions, legislation and procedure are given in the user guide.
3.2 Trends in breath tests
The Metropolitan Police were unable to provide data on the total number of breath tests for 2020 and 2019 and are therefore not included in the national totals presented in this chapter and have also been excluded from previous years’ totals. However, they were able to supply information on the number of positive tests in both years. Sussex were unable to provide complete data for 2019 and so have also been excluded from any trend analysis to allow like-for-like comparisons.
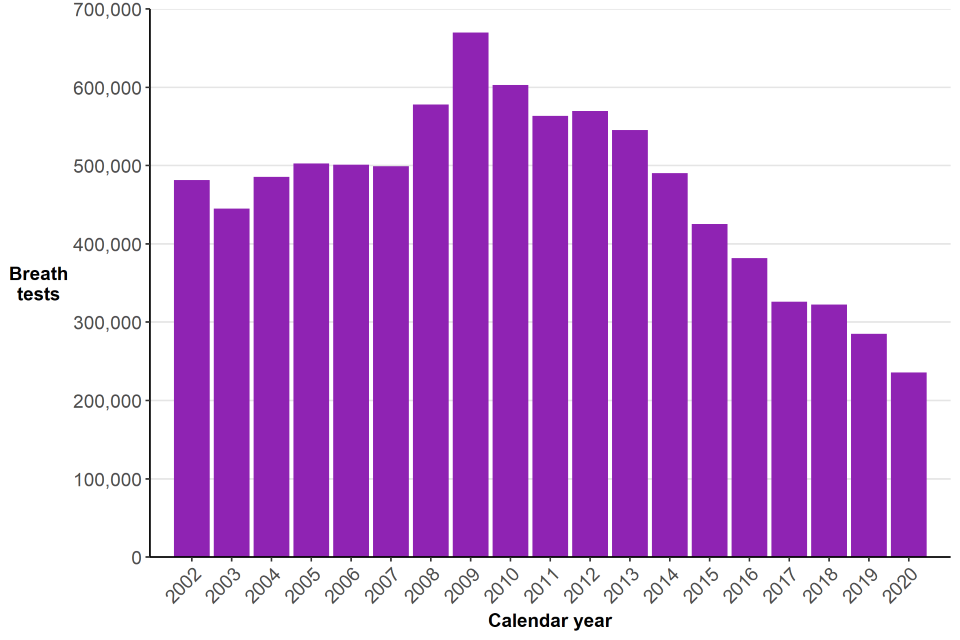
There were 252,069 breath tests undertaken in 2020 (excluding the Metropolitan Police). When comparing the 41 forces that provided full breath test data in both 2019 and 2020, there was an 18% fall compared with the previous year (from 298,522 in 2019 to 245,604 in 2020). Figure 3.1 shows how this fall continues the downward trend seen since the peak of 703,490 breath tests in 2009 (again excluding the forces who could not provide complete data in 2019 or 2020). Analysis of seasonal variation in breath tests suggests that the pandemic and lockdowns contributed to the fall in the latest year (see section 3.3).
Figure 3.1 Number of breath tests carried out by police in England and Wales, 2002 to 2020
Source: Breath test table BT.03, Home Office
Notes:
1. Excludes Metropolitan, Norfolk, Suffolk and Sussex Police, who could not supply complete data for all years
In 2020, there were 47,254 positive or refused breath tests. Based on the 42 forces who supplied complete data for 2019, there was a 14% decrease in the number of positive or refused breath tests in 2020 (from 53,720 to 46,392).
The number of positive or refused breath tests in 2020 represents 17% of the total number of breath tests, similar to the previous year. The proportion of breath tests that were positive or refused gradually fell from 19% in 2003 to 10% in 2013. From 2014 to 2020 there has been a gradual increase in the proportion of breath tests that were positive or refused, from 11% to 17%.
Figure 3.2 Proportion of positive/refused breath tests carried out by police in England and Wales, 2002 to 2020

Source: Breath test table BT.03, Home Office
Notes:
1. Excludes Metropolitan, Norfolk, Suffolk and Sussex Police, who could not supply complete data for all years
3.3 Seasonal variation
The figures in this section for the year 2020 exclude North Wales Police, who were unable to provide breath tests data in November, and the Metropolitan Police, who were unable to provide data on number of breath tests performed. Year-on-year comparisons with 2019 additionally exclude Sussex.
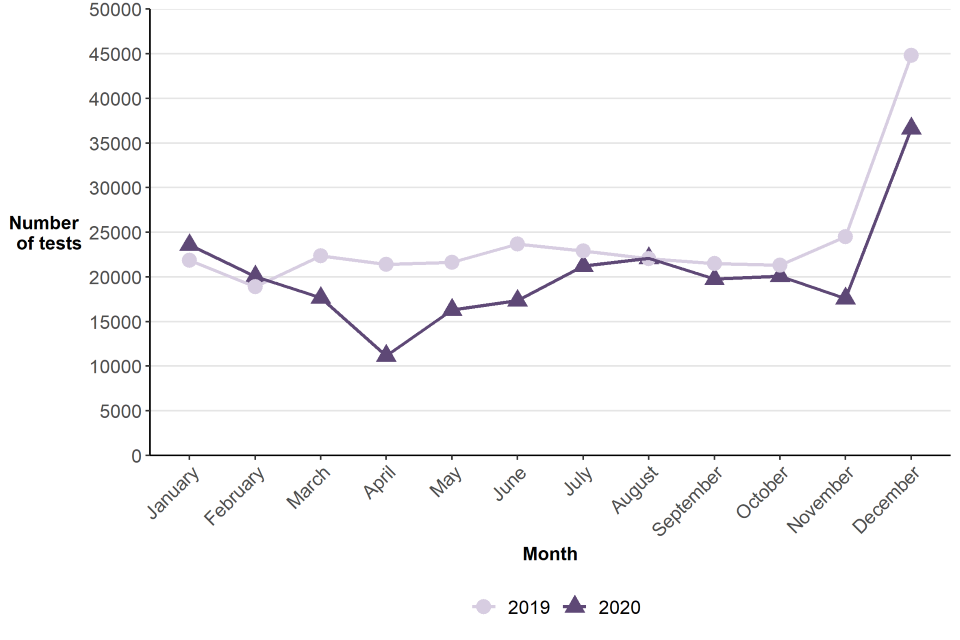
In 2020, as in previous years, more breath tests were carried out in December than any other month (36,615). This coincided with the annual national Christmas drink and drug driving campaign, although some forces also reported cancelling their Christmas drink-drive campaign last year. The number of breath tests in December was down by 18% from 2019 (when comparing forces who submitted full data for both years), however made up the same proportion of the overall number of tests (15%).
April had the lowest number of breath tests (11,155) in 2020. This was down almost half (49%) on the number of breath tests carried out in the same month in 2019. March, May, June, and November also had a more than 20% fall in the numbers of breath tests than in the previous year. The only months in 2020 which had higher numbers of breath tests performed than the same month in 2019 were January and February. Carrying out a breath test requires the officer to stand close to the driver, and police forces cited minimising close-contact with the public, fewer cars being out on the road, and closure of the night-time economy resulting in less offences as reasons for less breath tests being carried out during periods of national lockdown. Additionally, many forces reported cancelling their summer drink-drive campaign, which in previous years had led to a small peak in the number of breath tests in June.
Figure 3.3 Number of breath tests carried out by police in England and Wales, by month, 2019 and 2020
Source: Breath test table BT.04, Home Office
Notes:
1. Excludes North Wales Police, who were unable to provide breath tests data for November, and the Metropolitan Police, who were unable to provide data on the number of tests
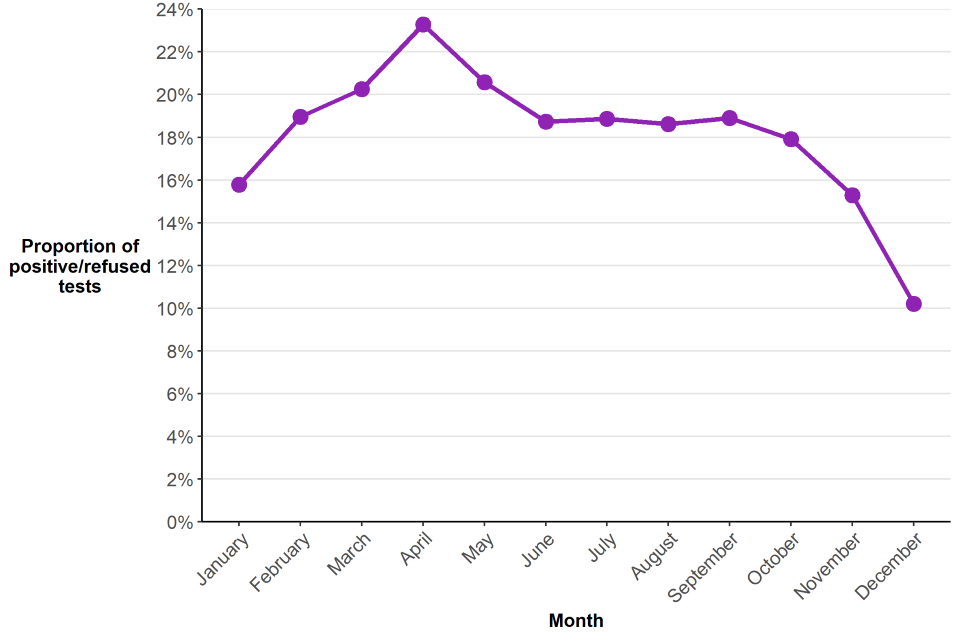
Although many more breath tests were carried out in December than in other months, December was only the fifth highest month for number of positive/refused breath tests (the highest being in the late summer months). As a result, the proportion of tests that were positive or refused was at its lowest in December at 10%, a similar proportion to 2019 (11%).
April saw the lowest number of positive/refused tests reported. However, the proportion of tests that were positive or refused was at its highest in April, at 23%, suggesting police may have been taking a more targeted approach in using breath tests during national lockdown. Some forces reported that drink drivers were more visible on the quiet roads. Additionally, forces reported that drivers may have been initially stopped in relation to lockdown movement restrictions, and then breathalysed if it was then suspected they were driving under the influence of alcohol.
Excluding April and December, the percentage of tests which were positive or refused varied between 15% and 21% in each month, comparable to in 2019.
Figure 3.4 Proportion of positive/refused breath tests carried out by police in England and Wales, by month, 2020
Source: Breath test table BT.04, Home Office
Notes:
1. Excludes the Metropolitan Police
3.4 Geographical patterns
In 2020, excluding the Metropolitan Police who were unable to supply complete data, 5 breath tests were conducted per 1,000 population across England and Wales. The rate for Wales (8 per 1,000 population) was greater than that for England (5 per 1,000 population), which has been true for recent years. As with previous years, North Wales Police had the highest rate of breath tests per population in England and Wales (12 per 1,000 population). In England, Gloucestershire Constabulary had the highest rate with 11 tests per 1,000 population, whereas Northumbria Police had the lowest rate with 2 tests per 1,000 population. The proportion of breath tests that were positive or refused ranged from 11% in Devon and Cornwall and Lincolnshire to 33% in Cambridgeshire Police Force Area.
3.5 Data quality and interpreting the figures
Results of breath alcohol screening tests can only be regarded as indicative of the level of alcohol present in a sample of breath and are not used to determine whether or not a driver was above or below the legal limit to drive. It remains the case that it is only at a police station or hospital that a specimen(s) can be obtained to determine a person’s actual alcohol concentration, using pre-calibrated evidential devices ensuring the sample has not been affected by any interfering substances or that blood or urine specimens may be taken for subsequent laboratory analysis. These subsequent evidential tests are not included in the breath test statistics.
From April 2008, new digital recording equipment started to be used by forces. The devices are able to record exact breath alcohol readings and the result of individual tests, as well as reason for test, time of day, day of week and age and gender profiles of those tested, and results are downloaded to data systems on a monthly basis and provided to the Department for Transport (DfT).
Data presented here have been sourced from annual statistical returns received from the 43 police forces in England and Wales. By 2011, a large number of police forces in England and Wales had made greater use of the digital breath test devices, in comparison with previous years. However, the manual recording systems are still used by some police forces. The figures presented here are based on the combined results of both systems. Negative breath test data supplied to the Home Office may have been under-reported based on the old system and it is likely that moving to the digital services has led to improvements in data recording practices by forces. This appears to have been reflected in the decrease in the proportion of positive or refused tests of total breath tests, since the beginning of 2008.
The user guide provides further details relating to data quality and interpreting the figures.
3.6 Other data sources
Analysis of reported roadside breath alcohol screening tests, based on data from digital breath testing devices, is published by the Department for Transport (DfT). Latest figures were included within DfT’s Reported road casualties in Great Britain: 2020 annual report
4. Fixed penalty notices and other outcomes for motoring offences
Key results
In 2020 the Metropolitan Police Service (MPS) adopted a new system for recording Fixed Penalty Notices for camera detected motoring offences. As MPS no longer exclusively use the PentiP system, the data collected from the MPS are under different categories and are not directly comparable to other forces’ data. For this reason, the main analysis in this chapter excludes the MPS. However, data provided by the MPS from their new FPN system (Dome) and from the PentiP system are reported separately in section 4.6.
In the year ending December 2020:
-
excluding the MPS, and 364,829 cancelled cases, there were 2.1 million motoring offences recorded in 2020 which resulted in a Fixed Penalty Notice or another outcome, a decrease of 12.3% compared with the previous year (excluding MPS); this can likely be attributed to the reduction in traffic volumes in 2020 due to the travel restrictions imposed during the COVID-19 pandemic
-
over four-fifths (87%) of recorded motoring offences were for speed limit offences (1.8 million) down 13% on the previous year (2,115,501) and the first decrease since 2011
-
just under half (45%) of driving offences resulted in driver retraining, while a fine was paid in a further 39% of cases and 14% of cases involved court action (excluding those subsequently cancelled), similar proportions to the previous year
4.1 Introduction
A fixed penalty notice (FPN) is a prescribed financial penalty which may be issued to a motorist as an alternative to prosecution. They can be issued for a limited range of motoring offences, such as speeding offences and using a handheld mobile phone while driving. An FPN can be endorsable (accompanied by points on a driving licence) or non-endorsable (not accompanied by points on a driving licence).
Data in this section are extracted from the PentiP system, a central database, which replaced the Vehicle Procedures and Fixed Penalty Office (VP/FPO) system in 2011. VP/FPO data were previously supplied to the Home Office by individual police forces. Further information can be found in the user guide
In 2017 the Home Office widened the scope of the collection for motoring offences to include cases where a driver retraining course, such as a speed awareness course, was attended by the individual, as well as cases where an individual faced court action. However, information on the outcome of those summoned to court is not provided and therefore data do not contain the number of individuals prosecuted for motoring offences[footnote 6]. A full time-series back to 2011 was published.
Since PentiP is an administrative dataset used by police forces, data for previous years can be amended as case details are updated. Furthermore, there is a cleansing process where some outcomes (particularly cancelled FPNs) are removed from the system after 6 months. For this reason, after publication in this bulletin, the figures represented in the accompanying data tables become fixed, and revisions are not made to data from previous years in subsequent releases.
This section contains data on the outcomes for motoring offences (as recorded on the PentiP system) for the territorial Police Force Areas (PFAs) in England and Wales on a calendar-year basis. Data are broken down by the number of motoring offences:
- that resulted in an FPN (endorsable and non-endorsable)
- where the driver attended a driver retraining course
- those which resulted in court action and
- cancelled FPNs
The data also contain information on the types of motoring offences which led to these outcomes, whether or not the offence was camera detected, and whether or not a fine was paid (where the offence resulted in an FPN).
In previous versions of this bulletin, and although separately identified and labelled within the chapter and data tables, all outcomes were referred to as ‘issued FPNs’. However, in cases where the driver accepted a driver retraining course, or faced immediate court action, an FPN will not have been issued by the police. Following engagement with stakeholders, and for clarity throughout this chapter, each outcome is now referred to separately.
Data on FPNs and other outcomes for motoring offences in England and Wales are presented in the FPN and other outcomes data tables.
In 2020 the Metropolitan Police Service (MPS) adopted a new system for recording Fixed Penalty Notices for camera detected motoring offences. As MPS no longer exclusively use the PentiP system, the data collected from the MPS are under different categories and are not directly comparable to other forces’ data. For this reason, analysis in this chapter excludes the MPS. However, data provided by the MPS from their new FPN system (Dome) and from the PentiP system are reported separately in section 4.6. The Home Office is working with the Metropolitan Police Service to obtain reliable data.
4.2 Trends in FPNs and other outcomes of motoring offences
Excluding cancelled cases[footnote 7] (364,829 cases), and the Metropolitan Police service, the PentiP system recorded 2.1 million motoring offences in 2020, which resulted in an FPN or another outcome, a decrease of 12.3% compared with the previous year, the first decline since 2016. This reduction in motoring offences is likely due to a reduction in traffic volumes caused by the COVID-19 pandemic travel restrictions and subsequent lockdowns.
Specifically, in 2020:
- 787,982 cases resulted in the driver receiving an endorsable FPN (37%)
- 84,266 cases resulted in a non-endorsable FPN (4%)
- an individual attended a driver retraining course in 946,557 cases (45%) and
- 300,027 cases resulted in court action (14%)
The number of endorsable FPNs issued has remained fairly stable in recent years with the data showing a slight decrease in 2020 to levels similar to 2014 and 2017 (down to around 800,000 in 2020). The number of non-endorsable FPNs had fallen year-on-year from 2011 to 2018, but there was an increase in 2019. In the latest year the number began to fall again from 98,321 in 2019 to 84,266 in 2020 (Figure 4.1).
Figure 4.1: Number of motoring offences resulting in an endorsable or non-endorsable FPN, England and Wales, 2011 to 2020
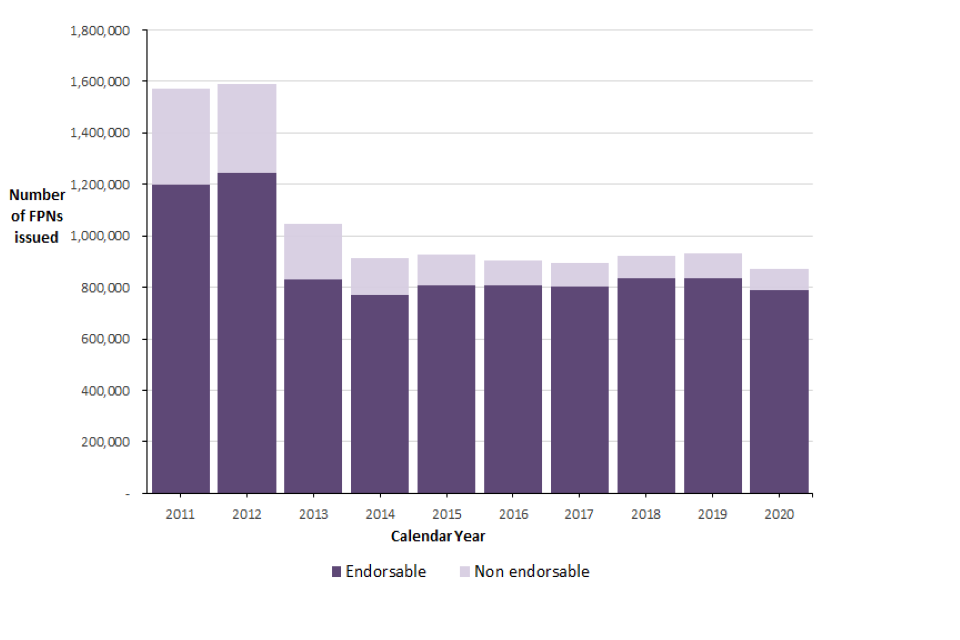
Source: Fixed penalty notices for motoring offences data tables, FPN_01, Home Office.
Notes:
1. Excludes cancelled FPNs
2. Excludes motoring offences which were dealt with via other outcomes such as cases where the individual attended a driver retraining course or faced court action
3. Excludes British Transport Police and Metropolitan Police Service
4.3 FPNs and other outcomes by offence type
Over four-fifths (87%) of the motoring offences recorded on PentiP were for speed limit offences (1,843,024), down 13% on the previous year (when there were 2,115,501 issued). This is the first decrease in the number of speed limit offences since 2011, with the highest level recorded in 2019 (Figure 4.2). This decrease can likely be attributed to fewer persons travelling due to restrictions introduced during the COVID pandemic.
Figure 4.2 Number of speed limit offences recorded on the PentiP system, England and Wales, 2011 to 2020
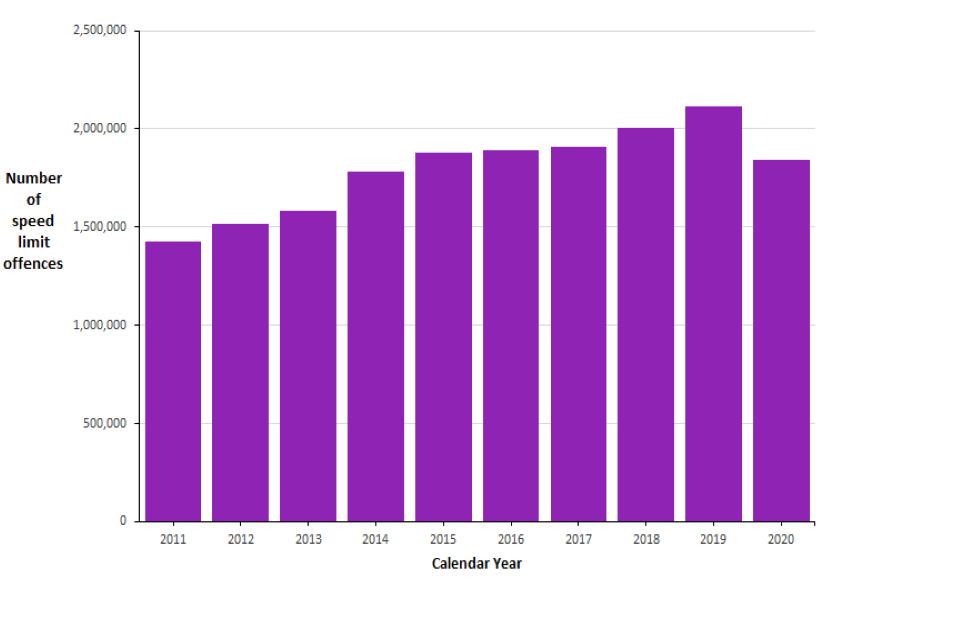
Source: Fixed penalty notices for motoring offences data tables, FPN_02, Home Office.
Notes:
1. Excludes cancelled FPNs
2. Excludes motoring offences which were dealt with via other outcomes such as cases where the individual attended a driver retraining course or faced court action
3. Excludes British Transport Police and Metropolitan Police Service
Despite the reduction in traffic volumes due to the pandemic in 2020, numerous offences showed an increase in detection. Careless driving offences (excluding the use of a handheld mobile phone while driving) saw one of the largest percentage increases, up by 20% in 2020 compared with the previous year (from 19,795 to 23,683), the third consecutive increase since 2017. Operator’s licence offences and ‘other’ offences also increased, with operator’s licence offences doubling from 12 cases to 24, and ‘other’ offences increasing 27% from 5,811 to 7,373 cases. Seat belt offences increased by 17% compared with the previous year from 34,870 FPNs issued to 40,935. However, use of a handheld mobile phone offences fell by 39% from 23,468 offences in 2019 to 14,326 in 2020, continuing the year-on-year decline since 2011. This may reflect changing police priorities and activities especially during the COVID-19 pandemic in 2020. It may also reflect a change in driver behaviour, as shown by the data collected by the Office for National Statistics on self-reported mobile use while driving. The latest statistics show that a large proportion of drivers who reported using a mobile phone whilst driving did so via Bluetooth, Voice command or a dashboard holder. These data that are published by the Department for Transport at Reported Road Casualties Great Britain Annual Report 2019.
4.4 Camera-detected offences
Offences that come under ‘neglect of traffic directions’ (for example, failure to adhere to traffic signs such as ‘right of way’) and ‘speed limit offences’ may be detected by the police, or by traffic enforcement cameras. In 2020, the PentiP system recorded 1,843,024 ‘speed limit offences’ and 51,364 ‘neglect of traffic directions’ offences, 87% and 2% of all non-cancelled FPNs respectively. The majority of ‘speed limit offences’ (96%) were detected by a camera, a similar proportion as the previous year, while just over half (52%) of ‘neglect of traffic direction’ offences were detected by a camera, falling from 60% in 2019. The COVID-19 pandemic is likely to have contributed to this large decline.
Table 4.1 Number of ‘speed limit offences’ and ‘neglect of traffic directions’ offences and proportion that were camera-detected, England and Wales, 2019 and 2020
| Offence type | Calendar year | |
|---|---|---|
| 2019 | 2020 | |
| Speed limit offences | 2,115,501 | 1,843,024 |
| of which Camera-detected (%) | 98 | 96 |
| Neglect of traffic | 66,154 | 51,364 |
| of which Camera-detected (%) | 60 | 52 |
Source: Fixed penalty notices for motoring offences data tables, FPN_04, Home Office.
Notes:
1. Includes offences were an FPN was issued or the individual attended driver retraining or court action. Excludes FPNs which were subsequently cancelled
2. Excludes British Transport Police and Metropolitan Police Service
4.5 Outcomes following motoring offences
After an individual is found to have committed a motoring offence there are a number of possible outcomes:
- attend a driver retraining course
- receive an FPN and pay a fine
- court action which may lead to prosecution
In 2020 (excluding Metropolitan Police Service) there was a decrease (19%) in the number of people attending a driver retraining course as an alternative outcome to paying a fine, the first decrease since 2017. The COVID-19 restrictions and subsequent lockdowns are likely to have reduced traffic volumes, and subsequently the number of motoring offences and driver retraining courses attended. In 2011, 14% of individuals found to have committed a motoring offence (excluding cases which were subsequently cancelled) attended a driver retraining course. This proportion showed a large increase between 2011 and 2014 to 46% and has since remained relatively stable, with 45% of individuals having attended a driver retraining course in 2020.
The use of driver retraining courses is at the discretion of the police and the use of such courses can differ by PFA. It is important to note that an individual can only attend a driver retraining course once in a 3-year period for committing the same offence. Therefore, if the individual reoffends and commits the same offence within a three-year period, having previously attended a driver retraining course, they cannot attend again and will be subject to other sanctions. In light of the COVID restrictions, virtual (online) courses were offered for driver retraining as a replacement for physical attendance. Driver retraining course providers developed alternative courses that could be delivered virtually however the time taken to develop such courses may have reduced the number of individuals that could attend driver retraining courses in 2020.
In 2020, a fine was paid in around 4 in 10 (39%) of cases (excluding those subsequently cancelled) and the remaining 14% of cases involved court action, similar proportions to the previous year. These statistics do not provide the outcome of those summoned to court. The Ministry of Justice publishes quarterly statistics on court outcomes including the number of individuals successfully prosecuted for motoring offences.
4.6 Metropolitan Police Service
In 2020 the Metropolitan Police Service (MPS) stopped processing all camera-detected Fixed Penalty Notices for motoring offences within the PentiP system. As such, the Home Office received partial 2020 data from PentiP for the MPS and, instead, the MPS provided data from their new system (Dome). Since the categories in the Dome system are not directly comparable with PentiP, this section presents the MPS data separately from the rest of England and Wales. This system change is likely to affect the total number of FPNs and the way in which outcomes are recorded (especially cancelled FPNs). Therefore, direct comparisons with previous years and other forces are not possible. These statistics represent a combination of the MPS data from their Dome system and data from the PentiP system. It is likely that the data is not a true representation of all FPNs issued by MPS and therefore should be treated with caution. The Home Office is working with the Metropolitan Police Service to obtain a full set of data for future publications.
In 2020, excluding cancelled cases[footnote 8] (89,991 cases), the PentiP and Dome systems recorded 264,485 motoring offences which resulted in an FPN or another outcome by the MPS. This was an increase of 15% compared with the previous year, continuing a year-on-year increase for the force since 2014 (Figure 4.3), however, it is difficult to make direct comparisons to previous years due to the system change. Specifically, in 2020:
- 86,062 cases resulted in a driver receiving an FPN (33%)
- an individual attended a driver retraining course in 105,983 cases (40%) and
- 71,502 cases resulted in court action (27%)
Figure 4.3 Number of cases resulting in FPNs or other outcomes1 Metropolitan Police Service, 2011 to 2020

Source: Fixed penalty notices for motoring offences data tables, FPN_03, Home Office.
Notes:
1. Includes offences were an FPN was issued or the individual attended driver retraining or court action. Excludes FPNs which were subsequently cancelled
2. Data for 2020 is not comparable to previous years as it includes data from the Metropolitan Police Service own recording system
Non camera-detected offences
In 2020 excluding cancelled FPNs (13,873 cases) there were 108,711 non camera-detected offences that resulted in an FPN or another outcome. Specifically:
- 76,494 cases resulted in the driver receiving an endorsable FPNs (70%)
- 32,217 cases resulted in a non-endorsable FPN (30%)
- an individual attended a driver retraining course in 12,404 cases (11%)
- 47,865 cases resulted in court action (44%)
Excluding cancelled cases, the most common non camera-detected motoring offence was licence, insurance and record keeping offences (29% or 31,989 cases), followed by speed limit offences (28% or 30,214 cases).
Camera-detected offences
Offences that come under ‘neglect of traffic directions’ (for example, failure to adhere to traffic signs such as ‘right of way’) and ‘speed limit offences’ may be detected by the police, or by traffic enforcement cameras. In 2020, excluding 76,118 cancelled FPNs, the MPS recorded 155,774 camera-detected offences, of which 96% were ‘speed limit offences’ (149,377 cases) and the remaining 4% were neglect of traffic directions (6,397 cases).
4,026 cases (63%) of 6,397 neglect of traffic direction offences resulted in an individual attending driver retraining, 25% in potential prosecution (1,620 cases) and 751 cases (12%) in a FPN.
Of the camera-detected speed limit offences, the majority (60%) resulted in individuals attending a driver retraining course (89,553 cases), 25% in a FPN (37,807 cases) and the remaining 22,017 cases (15%) involved potential prosecution.
4.7 Data quality
From 2011, data have been extracted from the PentiP system, a central database which replaced the Vehicle Procedures and Fixed Penalty Office (VP/FPO) system. VP/FPO data were previously supplied to the Home Office by individual police forces.
In 2017 the Home Office widened the scope of the dataset for Fixed Penalty Notices (FPNs) for motoring offences to include cases where a driver retraining course, such as a speed awareness course, was attended by the individual, as well as cases where an individual faced court action. However, information on the outcome of those summoned to court is not provided and therefore data do not contain the number of individuals prosecuted for motoring offences[footnote 9]. A full-time series back to 2011 was published.
In 2020 the Metropolitan Police Service stopped processing all Fixed Penalty Notices for motoring offences with the PentiP system. As such, data for Metropolitan Police Service for 2020 was only partial and in order to ensure consistency, they have been excluded from the main chapter. For data on Metropolitan Police Service FPNs for motoring offences see Section 4.6.
Further information can be found in the user guide.
4.8 Other data sources
Ministry of Justice publishes data in its Criminal Justice Statistics Quarterly publication on:
- penalty notices for disorder (PNDs); these follow similar principles to FPNs and can be issued for low-level summary offences, e.g. being drunk and disorderly, petty theft, and possession of cannabis prosecutions and convictions for motoring offences
The Department for Transport (DfT) publishes a number of Road Accident and Safety Statistics including data on:
- road casualties
- drink and drug driving
- self-reported mobile phone use while driving
5. Other PACE Powers
Key results
In the year ending March 2021:
There were a total of 4,994 persons detained by police in England and Wales under part IV of Police and Criminal Evidence Act for more than 24 hours and subsequently released without charge. This represented an increase of 2% compared with the previous year (based on data from 34 forces that were able to provide complete data for both years).
Of those detained and subsequently released, 89% (4,435) were held for between 24 and 36 hours, a further 458 persons were held for more than 36 hours before being released without charge, and 101 people were detained under warrant for further detention.
Based on the 39 forces who were able to supply data, there were 36 intimate searches carried out by police. Excluding forces who could not supply data for both years, this was a decrease of 33 searches on the previous year.
5.1 Introduction
The police have several other powers that are authorised under the Police and Criminal Evidence Act (PACE). This section provides information on the use of police powers of detentions and intimate searches.
5.2 Detentions
Under section 42 of PACE, police may detain a suspect before charge, usually for a maximum of 24 hours, or for up to 36 hours when an alleged offence is an indictable[footnote 10] one. From 20 January 2004, powers were introduced which enabled an officer of the rank of superintendent or above to authorise continued detention for up to 36 hours following an arrest. Additionally, police may apply to the Magistrates’ Court to authorise warrants of further detention, extending the detention period to a maximum of 96 hours without charge. Further details can be found in the user guide.
This section provides information on the number of persons detained for more than 24 hours who were subsequently released without charge. It also provides details on the number of warrants for further detention that were applied for and that led to charges. Data are requested by the Home Office from the 43 territorial police forces in England and Wales on a financial-year basis, though not all forces have been able to provide these data due to technical issues and data quality concerns.
In the year ending March 2021, there were a total of 4,994 persons detained by police in England and Wales under part IV of PACE for more than 24 hours and subsequently released without charge. This represented an increase of 2% compared with the previous year, based on data from 34 forces who were able to provide complete data for both years (from 4,744 in the year ending March 2020 to 4,827 in the year ending March 2021).
Of those detained and subsequently released without charge, 89% (4,435) were held for between 24 and 36 hours. A further 458 persons were held for more than 36 hours before being released without charge and 101 were detained under warrant for further detention (before being released without charge).
In the year ending March 2021, police in England and Wales applied to magistrates for 449 warrants of further detention. Of these applications 2 were refused, meaning warrants were granted in 99.6% of cases. When a warrant of further detention was granted, this led to a charge in 62% of cases (276 cases).
Source: Other Pace Powers data tables, D_01 to D_04, Home Office
5.3 Intimate searches
If a person who is arrested is believed to be concealing Class A drugs, or anything that could be used to cause physical injury, a suitably qualified person may carry out an intimate search under section 55 of PACE. This section includes data on the number of intimate searches carried out by police in England and Wales, as well as details of who conducted the search and why, on a financial-year basis. Further details can be found in the user guide.
As is the case with detentions over 24 hours, some forces were unable to provide these data. Based on the 39 forces who could supply data, there were 36 intimate searches carried out by police in the year ending March 2021. Excluding forces who could not supply data for both years, this was a decrease of 33 searches on the previous year.
Of the 36 intimate searches, 35 (97%) were carried out by a medical practitioner or in the presence of a suitably qualified person. One search was carried out by a police officer in the absence of a suitably qualified person.
33 intimate searches were made in an attempt to find Class A drugs (92% of the total), with the remaining 3 searches conducted to find harmful articles. This is consistent with breakdowns for recent years, where around 80% to 90% of searches were conducted to find Class A drugs. Of the searches made for drugs in the latest year, Class A drugs were found in 27% of cases, up 10 percentage points from 17% in the previous year. One harmful article was found in the 3 searches conducted to find them.
Of the 39 police forces in England and Wales who supplied data to the Home Office, 20 had carried out intimate searches in the year ending March 2021, a proportion that has remained consistent over the most recent five years. Surrey Police conducted the most intimate searches (7), followed by Norfolk Constabulary (6).
Source: Other Pace Powers data tables, IS_01 to IS_02, Home Office
5.4 Data quality
The presented statistics in this section are correct at the time of publication.
Cheshire, Derbyshire, Durham, Gloucestershire, Greater Manchester, North Wales and Thames Valley police forces were unable to provide complete detentions data for the year ending March 2021. These forces, along with those who could not provide complete data for the year ending March 2020, have been excluded from any year on year comparisons, as outlined in the footnotes accompanying the detentions tables.
Derbyshire, Durham, Gloucestershire and Thames Valley police forces were unable to provide any data on intimate searches in the year ending March 2021. Data for these 4 forces have been excluded from any year-on-year comparison. Staffordshire Police were only able to provide intimate searches data from 20 May 2020 to 31 March 2021, due to migration to a new IT system.
The user guide provides further details relating to definitions, legislation and procedures, and data quality.
Annex A Experimental Statistics - Pre-charge bail and released under investigation
Key results
Pre-charge bail:
- in the year ending March 2021, there were 142,274 individuals released on pre-charge bail (based on 40 forces); this is a 3% increase compared with the previous year based on 38 forces that were able to provide data for both years (up from of 128,331 to 131,700)
- the pattern across forces is mixed, 29 forces reported an increase in the number of individuals on pre-charge bail compared with the previous year, and 9 forces reported fewer pre-charge bails compared with last year
- just over three-quarters (77% or 104,671) of individuals were under pre-charge bail conditions for less than 3 months
- there were 205,092 offences linked to individuals on pre-charge bail in the year ending March 2021; half (50%) of these were for violence against the person, and 10% were theft offences (excluding unknown offences)
- over a quarter (28%) of individuals released on pre-charge bail were 24 years old or under, whilst those aged under 18 accounted for 9% of individuals on pre-charge bail
Released under investigation (RUI):
- based on 23 forces, in the year ending March 2021, 147,334 individuals were released under investigation
- around two-thirds (68%) of individuals were RUI for 3 months or more
- there 218,128 linked offences related to individuals on RUI, of these 27% were violence against the person offences, and 19% theft offences when unknown offences were excluded
- almost two-fifths (38%) of individuals released under investigation were 24 years old or under; those aged under 18 accounted for 14% of individuals released under investigation
A.1 Introduction
Pre-charge bail, also known as police bail, is granted by the police under the Police and Criminal Evidence Act 1984 (PACE) to individuals that have been arrested on suspicion of a criminal offence, but where there are no grounds to keep them in detention while the investigation continues. The main purposes of pre-charge bail can be summarised under three headings:
- the protection of victims and witnesses primarily linked to conditions applied to pre-charge bail such as no contact with the victim
- investigative management, allowing investigations to progress to obtain evidence
- suspect management, including reducing the risk of re-offending
Applying pre-charge bail conditions means that the police can manage a suspect effectively within the community while further investigations progress. Pre-charge bail can be made subject to conditions under the Bail Act 1976. Conditions may be necessary in order to ensure that the suspect:
- surrenders to custody at the end of the pre-charge bail period
- does not commit an offence while on pre-charge bail
- does not interfere with witnesses and
- does not otherwise obstruct the course of justice
Conditions may typically include:
- a ban on leaving the country, including a requirement to surrender a passport
- not being allowed to enter a certain area, such as the home of the alleged victim and
- not being allowed to communicate with certain people, e.g. victims, witnesses or known associates
The pre-charge bail system was reformed through the Policing and Crime Act 2017 which included the introduction of a limit on pre-charge bail to an initial period of 28 days. It is still possible for police to secure an extension beyond the initial period of 28 days where it is necessary and proportionate, for example in complex cases. One extension of up to 3 months can be authorised by a senior police officer at superintendent level or above. In exceptional circumstances, where the police need to keep an individual on bail for longer, they will have to apply to a magistrate for further bail. If an individual breaches their conditions of pre-charge bail, they can be arrested and taken to a police station. A breach of pre-charge bail conditions is not a criminal offence and carries no criminal penalty, although the behaviour which led to the breach may constitute a separate offence. If there is sufficient evidence at the time of the breach, officers may charge the individual for the original offence for which they are under investigation, or any subsequent offence, and either detain them prior to their appearance at a magistrates’ court or release them on post-charge bail.
When the Policing and Crime Act 2017 was introduced there was a perceived presumption in favour of release without bail unless bail is deemed both ‘necessary and proportionate’. This was to address concerns that individuals were being kept on pre-charge bail for long periods, sometimes with strict conditions.
When an individual under investigation is released from custody without bail this is known as released under investigation (RUI). When under RUI, an individual is not subject to any conditions, nor is there a time limit on when they must return to the police station.
A police force may ask a person of interest to voluntarily attend a police station or other location to assist police with the investigation of an offence. The purpose of these interviews is to question the individual to obtain evidence about their suspected involvement in an offence. If an individual voluntarily attends interview, they are allowed to leave unless arrested on suspicion of committing the offence.
Data collected
Data on the number of pre-charge bails by pre-charge bail length were collected on a voluntary basis for the first time in the year ending March 2018. This data collection was introduced to understand to what extent forces were using pre-charge bail following the reforms to conditions of the power as anecdotal evidence suggested that usage had declined.
In response to requests for more granular data from users, and in line with ‘V4:Innovation and Improvement’ of the Code of Practice (CoP) for Statistics, for the year ending March 2021, the Home Office expanded the pre-charge bail collection from aggregate-level data to incident-level data so that as well as pre-charge bail duration the Home Office receives information on the age, gender, ethnicity, offence type and outcome for each instance of pre-charge bail. The collection was also expanded to include information on released under investigation, breaches of pre-charge bail and voluntary attendance to an interview. As this is the first year that these data have been collected, the information collected was done so on a voluntary basis. Once the data are deemed to be of high enough quality this collection will move to a mandatory collection.
As part of the consultation process, several forces were asked about the feasibility of making such a change and the proposal to move to recording each incident of pre-charge bail was made to the Policing Data Requirement Group, who approved the change. This group is made up of stakeholders including national policing leads and considers the ‘need of the data against the reporting burden to forces’ for all collections along with reviewing the quality of the data collected. Increasing the amount of available information not only adds to the insights and analysis possible with more data but also increases value and transparency for users (‘V1: Relevance to Users’ of the CoP).
The analysis in this chapter is based on data received from 40 of the 43 police forces in England and Wales. However, whilst 40 forces provided data on pre-charge bail, a subset of 23 police forces provided data on RUI. 18 police forces provided data on voluntary attendance to interview, and 11 police forces provided data on breaches of pre-charge bail. Some of these forces identified quality concerns with their data, including partial returns. Therefore, data in this chapter give an indicative picture only, and should be treated with caution.
Due to the provisional and incomplete nature of this dataset, these statistics have been designated as Experimental Statistics, to acknowledge that further development will take place in the future. The Home Office is working with forces to understand the issues they face with this data collection and will consider whether any changes to the data return are needed.
Data quality and interpreting figures
The figures presented are correct at the time of publication and include revisions submitted by forces for the previous year. For the first time in the year ending March 2021, the Home Office has collected incident-level data on pre-charge bail, RUI, voluntary attendance to interview and breach of pre-charge bail conditions.
Furthermore, the Home Office expanded the collections to include data on the ethnicity, age and gender of the individual, the offence associated with the pre-charge bail/RUI, the duration of the release or investigation following voluntary interview, the outcome of the release or interview, and the location of the interview.
Due to the changes made to the data collection in the year ending March 2021 and the voluntary nature of this collection, the data are somewhat incomplete, and several forces have not been able to provide complete data on pre-charge bail, RUI, voluntary attendance to interview, or pre-charge bail breaches. Moreover, Bedfordshire, Devon and Cornwall, Durham, Kent, South Wales, Warwickshire, and West Mercia police forces were unable to provide the new granular data requested for the year ending March 2021 due to issues extracting the relevant data from their recording systems in the new format. Instead they have provided an aggregate count of individuals on pre-charge bail by duration and are not included in any further detailed analysis.
Greater Manchester and Lancashire Police were unable to provide any data for the year ending March 2021 due to issues extracting the data from their custody systems. Staffordshire Police were only able to provide partial pre-charge bail data for the year ending March 2021. To ensure consistent and comparable data, data from these three forces are excluded from the data tables and commentary.
Until the year ending March 2020, forces provided data based on the number of individuals on pre-charge bail. However, Essex and Hertfordshire Police were only able to provide a count of all offences associated with each individual on pre-charge bail. As such, data for Essex and Hertfordshire are not directly comparable to other forces’ data up to the year ending March 2020, or comparable to their data for year ending March 2021. These 2 forces have been removed from year-on-year comparisons to provide a consistent time series.
For further information on data quality issues see section A.5 Detail on quality issues.
A.2 Experimental Statistics - Pre-charge bail
Number of individuals on pre-charge bail
In the year ending March 2021, based on a subset of 40 police forces in England and Wales, there were 142,274 individuals released on pre-charge bail. This equated to 24% of the 603,868 arrests made during the same period by the same 40 forces.
Based on 38 forces[footnote 11] who could provide data in both years, this is an increase of 3%, up from 128,331 in the year ending March 2020 to 131,700 in the latest year. The pattern across forces is mixed, 29 forces reported an increase in the number of individuals on pre-charge bail, and 9 forces reported fewer individuals on pre-charge bail compared with last year.
Individuals on pre-charge bail by duration
An individual can be released on pre-charge bail for multiple offences at one time (for example, if an individual was arrested for possession of weapons and drug offences they may be released on pre-charge bail for both offences). In this data collection this would be recorded as 1 individual on pre-charge bail with 2 linked offences (i.e. two rows of data with the same custody reference number). Although it is possible for each offence to have a different duration, most forces have recorded the same duration for all linked offences (likely based on the most serious offence). These have therefore been treated as the same instance of pre-charge bail and in the few instances where different pre-charge bail lengths were recorded for the same individual, the longest duration has been used for the following analysis.
Excluding records where the duration was unknown (5,818) and based on a subset of 38 police forces[footnote 12] in England and Wales in the year ending March 2021 there were 136,456 instances of pre-charge bail of which:
- 48% of individuals were released for 28 days or less
- 77% of individuals were released for less than 3 months
- 23% of individuals were released for 3 months or more
Table A.1: Pre-charge bail durations, year ending March 2021
| Pre-charge bail duration | Year ending March 2021 |
|---|---|
| 0 to 7 days | 5,330 |
| 8 to 14 days | 7,595 |
| 15 to 21 days | 15,732 |
| 22 to 28 days | 37,236 |
| 29 days to 3 months | 38,778 |
| 3 to 6 months | 18,818 |
| 6 to 12 months | 8,398 |
| More than 12 months | 4,569 |
| Unknown | 5,818 |
| Total | 142,274 |
Source: Pre-charge bail table PCB.01, Home Office
Notes:
1. Due to the provisional and incomplete nature of this dataset, these statistics have been designated as Experimental Statistics.
2. Excludes Lancashire, Greater Manchester, and Staffordshire who were unable to provide data in the year ending March 2021.
3. Humberside and Nottinghamshire were unable to provide any detail on duration (5,302 of 5,818 unknown bails).
Pre-charge bail by offence type
Analysis in this section is based on all linked offences to an individual’s pre-charge bail. Due to the way in which forces record offence data and pre-charge bail data, not all forces were able to provide offence type detail for all occurrences of pre-charge bail. Excluding records where the offence type was not known (i.e. 19,256 records) the most common offence for which an individual was on pre-charge bail for was violence against the person (50%), followed by theft (10%). Based on the 30 police forces[footnote 13] that provided offence type detail, this is consistent with the arrests data for the year ending March 2021, which showed that violence against the person offences accounted for largest proportion of all arrests (41%) followed by theft (14%). Figure A.1 shows the proportion of individuals on pre-charge bail by offence type.
Figure A.1: Proportion of pre-charge bail by offence type, year ending March 2021
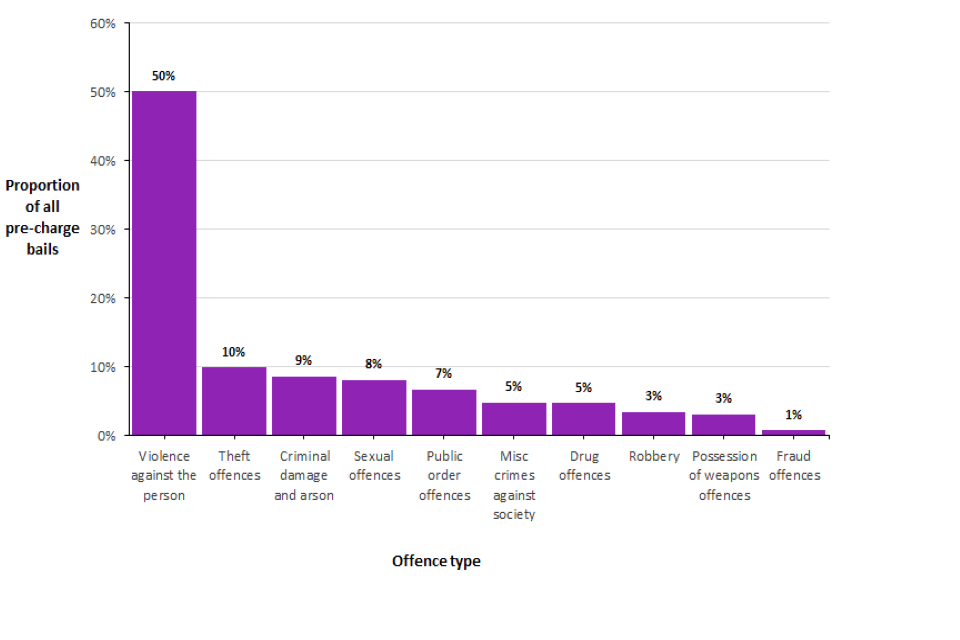
Source: Pre-charge bail table PCB.05, Home Office
Notes:
1. Due to rounding percentages may not total 100%.
2. Due to the provisional and incomplete nature of this dataset, these statistics have been designated as Experimental Statistics.
3. Based on data from 30 police forces. Excludes 322 unknown offences.
4. An individual can be released on pre-charge bail for multiple offences under one record of pre-charge bail, therefore, an individual instance of pre-charge bail may appear multiple times within the figure.
The proportions of pre-charge bails for each offence type were similar to the arrests collection, with the exception of sexual offences and drug offences. Whilst only 5% of pre-charge bails related to drug offences, they accounted for 12% of arrests. Additionally, 4% of arrests were for sexual offences, but they made up 8% of pre-charge bails. Table A.2 shows the proportion of pre-charge bails and arrests by offence type.
Table A.2: Proportion of pre-charge bails and arrests by offence type, year ending March 2021
| Offence type | Pre-charge bails | Arrests |
|---|---|---|
| Violence against the person | 50% | 41% |
| Theft offences | 10% | 14% |
| Criminal damage and arson | 9% | 7% |
| Sexual offences | 8% | 4% |
| Public order offences | 7% | 8% |
| Miscellaneous crimes against society | 5% | 7% |
| Drug offences | 5% | 12% |
| Robbery | 3% | 2% |
| Possession of weapons offences | 3% | 4% |
| Fraud offences | 1% | 1% |
| Total | 100% | 100% |
Source: Pre-charge bail table PCB.05, Arrests collection, Home Office
Notes:
1. Due to rounding percentages may not total 100%
2. Due to the provisional and incomplete nature of this dataset, these statistics have been designated as Experimental Statistics.
3. Based on data from 30 police forces.
4. An individual can be released on pre-charge bail for multiple offences under one record of pre-charge bail, therefore, an individual instance of pre-charge bail may appear multiple times within the table.
5. Excludes 322 unknown offences.
Direct comparisons between the two series should be made with caution since pre-charge bails can relate to multiple offences, whilst arrests relate to the principal offence. For example, an offender may be arrested for committing two or more crimes (e.g. shoplifting and possession of drugs) but only one arrest and offence will be recorded. Conversely, there may be one pre-charge bail record but both offences will be recorded and linked to the individual on pre-charge bail.
Pre-charge bail by gender
In this report, we refer to gender rather than sex of people on bail. ‘Sex’ can be considered to refer to whether someone is male or female based on their physiology, with ‘gender’ representing a social construct or sense of self that takes a wider range of forms.
The data collection has been set up to accommodate four options for the gender of the person on bail: female, male, other and unknown. ‘Other’ may comprise people who define themselves as non-binary or transgender. However, only 5 of the 32 police forces recorded any individual’s released on pre-charge bail as ‘other’ gender. This suggests that different recording systems used by police forces have different levels of detail to which the gender of individuals can be recorded. Additionally, it is likely that recording includes a mixture of sex and gender. We are reporting the data in the format they are collected, and we are working to bring these data in line with Government Statistical Service sex and gender harmonisation standards.
Of the 142,274 records of individuals on pre-charge bail, 116,997 included information on gender. The majority of individuals (88%) released on pre-charge bail in the year ending March 2021 (when the gender was known) were male. This is consistent with the proportion of males arrested (85%). For both males and females, the most common offence groups associated with pre-charge bail was violence against the person, followed by theft offences. Males made up the majority of individuals on pre-charge bail for all offence types. However, the proportions did vary. Pre-charge bail for fraud offences and public order offences had the highest proportion of females (16% and 14% respectively), and sexual offences the lowest (2%).
Pre-charge bail by age
Almost a third (31%) of all individuals released on pre-charge bail were aged 25 to 34, and over a quarter (28%) were 24 years old or under, when an individual’s age was known (3% of pre-charge bails had an unknown age). These proportions varied by offence group, for example, despite making up 28% of all individuals released on pre-charge bail, those aged 24 or under comprised 71% of all linked offences related to robbery (47% of which were aged under 18) and 45% of all linked drug offences and possession of weapons offences.
Pre-charge bail by ethnicity
When an individual is arrested and released on pre-charge bail, they are asked to define their ethnicity. For the purpose of this analysis, these are grouped into the following 6 categories:
- white
- black (or Black British)
- asian (or Asian British)
- mixed
- other ethnic group
- not stated
Excluding records where the ethnicity was not known (14% of all individuals released on bail), 73% of individuals on pre-charge bail were White, 11% were Black (or Black British), and 10% were Asian (or Asian British). The remaining 6% identified as mixed ethnicity (4%) or any other ethnic group (2%). The proportion of individuals released on pre-charge bail across each ethnic group was generally in line with the arrests collection. Excluding records where the age, gender or ethnicity of an individual was unknown, the largest proportion (21%) of individuals on pre-charge bail were males aged between 25 and 34 who defined their ethnicity as White.
The ethnic breakdown of individuals released on pre-charge bail varied across offence groups. For all offence groups White individuals made up the majority of pre-charge bails. However, Black (or Black British) individuals accounted for noticeably larger proportions of pre-charge bails for robbery (31%), drug offences (20%), and possession of weapons offences (19%), despite accounting for only 11% of all individuals on pre-charge bail and 11% of arrests. A similar discrepancy was seen for Mixed individuals who made up 8% of all persons on pre-charge bail for robbery offences, double the proportion of individuals from a Mixed background on pre-charge bail (4%) and arrested (4%).
Pre-charge bail by outcome
When an individual is released on pre-charge bail there can be multiple offences related to their pre-charge bail record which can each have a different assigned outcome. For example, if an individual is released on pre-charge bail for possession of weapons and drug offences they may be charged for the possession of weapons offence and receive no further action for the drug offence. Although it is possible for each offence linked to an individual to have a different outcome, the following analysis is based on the principal outcome assigned to an individual.
The following analysis is based on 29 forces[footnote 14], and excludes 14,661 records (or 12% of pre-charge bails), and should therefore be treated with caution.
These 29 police forces accounted for 75% of all individuals released on pre-charge bail in the year ending March 2021 and 74% of arrests data. Metropolitan Police accounted for the largest proportion of pre-charge bails (17%), whilst accounting for 24% of all arrests for the same 29 forces.
The most common principal outcome for an individual released on pre-charge bail was no further action (59% or 62,653 individuals who were assigned this outcome), followed by a charge (18% or 19,474 individuals) and transferred to released under investigation (15% or 16,156 individuals). Figure A.2 shows the proportion of pre-charge bails by outcome.
Figure A.2: Proportion of pre-charge bails by outcome, year ending March 2021

Source: Pre-charge bail table PCB.06, Home Office
Notes:
1. Due to rounding percentages may not total 100%
2. Due to the provisional and incomplete nature of this dataset, these statistics have been designated as Experimental Statistics.
3. Based on data from 29 police forces.
4. Excludes unknown outcomes (810)
5. ‘Other’ includes transfer to pre-charge bail (1,143), transfer to other law enforcement agency (12), and transfer to other police force (481).
Pre-charge bail breaches
Data on pre-charge bail breaches is based on a subset of 11 police forces. Several forces have expressed concerns with data quality, and the data is largely incomplete, so should be treated with caution.
Based on the limited data available, in the year ending March 2021, 1,405 individuals breached their pre-charge bail conditions, 5% of individuals released on pre-charge bail.
A.3 Experimental Statistics - Released under investigation
Number of individuals released under investigation
This is first year that the Home Office has collected data on released under investigation and was done so on a voluntary basis. Data in this section are based on a subset of police forces in England and Wales and should therefore be treated with caution. Based on 23 forces who provided information, in the year ending March 2021, 147,334 individuals were released under investigation (RUI). This equated to 35% of the 419,504 arrests made during the same period by the same 23 forces.
Individuals released under investigation by duration
An individual can be RUI for multiple offences at one time, and each offence can have a different duration of release before an outcome is assigned. For example, if an individual was RUI for shoplifting and a drug offence, in this data collection this would be recorded as 1 individual RUI with 2 linked offences (i.e. two rows of data with the same custody reference number). Although it is possible for each offence to have a different duration, most forces have recorded the same duration for all linked offences (likely based on the most serious offence). These have therefore been treated as the same instance as bail and in the few instances where different bail lengths were recorded for the same individual, the longest duration has been used for the following analysis.
Excluding the 21,656 individuals where RUI length was not known and based on a subset of 20 police forces[footnote 15] in England and Wales in the year ending March 2021:
- 12% were released under investigation for 28 days or less
- 32% were released under investigation for less than 3 months
- 68% were released under investigation for 3 months or more
Table A.3: Released under investigation durations, year ending March 2021
| RUI duration | Year ending March 2021 |
|---|---|
| 0 to 7 days | 4,075 |
| 8 to 14 days | 3,443 |
| 15 to 21 days | 3,544 |
| 22 to 28 days | 3,525 |
| 29 days to 3 months | 25,846 |
| 3 to 6 months | 32,097 |
| 6 to 12 months | 30,399 |
| More than 12 months | 22,749 |
| Unknown | 21,656 |
| Total | 147,334 |
Source: Released under investigation table RUI_01, Home Office
Notes:
1. Due to the provisional and incomplete nature of this dataset, these statistics have been designated as Experimental Statistics
2. Includes data from a subset of 23 police forces. Hertfordshire, Humberside and West Midlands could not provide data on duration of Released Under Investigation and account for 18,747 of 21,656 unknown records.
Released under investigation by offence type
Analysis in this section is based on all offences linked to an individual’s record for release under investigation.
In the year ending March 2021 there 218,128 offences linked to individuals RUI; over a quarter (27%) of these were related to violence against the person, 19% for drug offences, and 16% for theft offences, excluding unknown offences (5% of all offences related to RUI). Figure A.3 shows the proportion of individuals released under investigation by offence type.
Figure A.3: Proportion of released under investigation by offence type, year ending March 2021
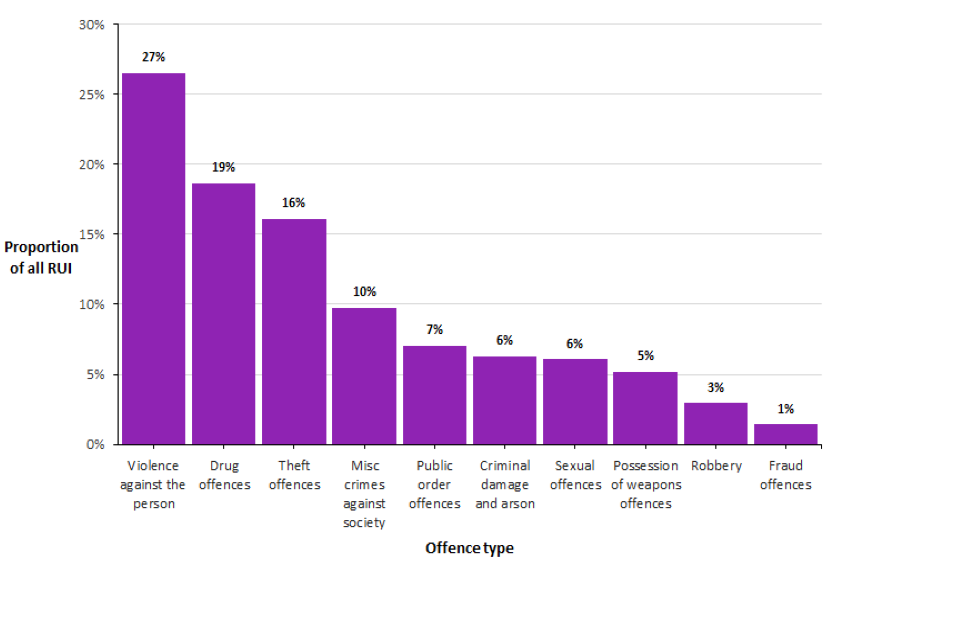
Source: Released under investigation table RUI.05, Home Office
Notes:
1. Due to rounding percentages may not total 100%
2. Due to the provisional and incomplete nature of this dataset, these statistics have been designated as Experimental Statistics.
3. Based on data from 22 police forces.
4. Excludes 10,077 unknown offences. Hertfordshire were unable to provide data on duration (6,811 of unknown offences).
5. An individual can be released under investigation for multiple offences under one record of released under investigation, therefore, an individual instance of released under investigation may appear multiple times within the figure.
6. Other includes criminal damage and arson, possession of weapons offences, fraud offences, and robbery.
The proportions across offence groups are consistent with the arrests collection with the exception of violence against the person when comparing the 22 police forces[footnote 16] that provided data on offence type. Whilst 41% of arrests were related to violence against the person, only a quarter (27%) of individuals RUI were for violence against the person offences. This may reflect the fact that RUI does not have any conditions attached to an individual’s release, and police forces may find it more appropriate to use pre-charge bail. The proportion of RUI and pre-charge bails differ across several offence groups when comparing the same 22 police forces. Violence against the person accounts for a lower proportion of RUI (27%) in comparison to pre-charge bail (51%), similar to the arrests collection. However, theft (16%) and drug offences (19%), and miscellaneous crimes against society (10%) relate to a higher proportion of RUI than pre-charge bail (9%, 5%, and 5% respectively).
Direct comparisons between the two series should be made with caution since RUI can relate to multiple offences, whilst arrests data submitted to the Home Office relate to the principal offence. For example, an offender may be arrested for committing two or more crimes (e.g. shoplifting and possession of drugs) but only one arrest and offence will be recorded in the data collection. Conversely, one RUI will be recorded but there can still be 2 offences associated with the RUI record.
Released under investigation by gender
Excluding records where an individual’s gender was unknown (0.1% of RUI), 86% of individuals on RUI were male, consistent with both the arrests and pre-charge bail collection (85% and 88% of males respectively). The most common offence related to RUI for both males (25%) and females (37%) was violence against the person. Males consistently accounted for the majority of RUI across all offence types.
However, despite accounting for 14% of all RUI, females accounted for almost a quarter (24%) of fraud offences and 19% of violence against the person offences. But they only accounted for 2% of RUI for sexual offences, consistent with the pre-charge bail collection.
Released under investigation by age
Excluding records where the age was unknown (or missing), over half (53%) of individuals RUI were aged between 18 and 34, and a further 14% were under 18 years old. Like the pre-charge bail collection, individuals aged 25 to 34 made up the largest proportion of RUI (29%) Despite accounting for 14% of all RUI, individuals under 18 years old accounted for 44% of robbery, 22% of criminal damage and arson, and 20% of possession of weapons offences.
Released under investigation by ethnicity
Excluding records where the ethnicity was not stated (13%), the majority (69%) of individuals RUI defined their ethnicity as White, 14% as Black (or Black British), and 10% as Asian (or Asian British). The remaining 7% defined their ethnicity as mixed (5%) or any other ethnicity (2%). These proportions are consistent with the arrests and pre-charge bail collection when comparing the same subset of police forces.
White individuals accounted for the majority of all individuals across all offence groups. For example, they accounted for 78% of all individuals RUI for criminal damage and arson and 77% of theft offences. Despite representing 14% of all RUI, Black (or Black British) individuals accounted for 30% of RUI related to robbery, 23% of RUI related to possession of weapons offences and 19% of RUI related to drug offences. Moreover, Asian (or Asian British) individuals make up 13% of fraud offences, and 13% miscellaneous crimes against society slightly higher than the proportion of all Asian (or Asian British) individuals RUI (10%).
Released under investigation by outcome
When an individual is RUI there can be multiple offences related to their RUI record which can each have a different assigned outcome. For example, if an individual is released on RUI for robbery and drug offences, they may be charged for the drug offence and receive no further action for the drug offence. Although it is possible for each offence linked to an individual to have a different outcome, the following analysis is based on the principal outcome assigned to an individual.
Excluding records where the individual’s outcome for RUI was not known (6,827) and based on a subset of 22 forces[footnote 17], the majority (69%) of individuals on RUI were assigned a principal outcome of no further action followed by charged (19%) when unknown. A small proportion of individuals received an out-of-court disposal (4%). The remaining 7% resulted in other outcomes. Figure A.4 shows the proportions of RUI by outcome.
Figure A.4: Proportion of released under investigation by outcome, year ending March 2021

Source: Released under investigation table RUI.06, Home Office
Notes:
1. Due to rounding percentages may not total 100%
2. Due to the provisional and incomplete nature of this dataset, these statistics have been designated as Experimental Statistics.
3. Based on data from 22 police forces. Hertfordshire could not provide data on the outcome. Excludes 3,261 unknown outcomes.
4. ‘Other’ includes transfer to other law enforcement agency (36), and transfer to other police force (1,010), transfer to pre-charge bail (3,183) and released under investigation (2,926).
A.4 Experimental Statistics - Voluntary attendance
Number of voluntary attendance interviews
In the year ending March 2021, a subset of 18 police forces[footnote 18] in England and Wales conducted 46,390 interviews following voluntary attendance. Excluding records where the interview location was not known (36%), the majority (86%) of these interviews occurred at a police station. The remaining 14% occurred at another location such as a prison or home.
Whilst some forces cited that the pandemic caused a dip in their voluntary interviews, this data is likely to be an undercount of all voluntary interviews conducted as many police forces do not have the capacity or ability to make a formal record of all interviews that occur. Furthermore, if the interview occurred outside of a police station (e.g. prison) they may not be able to record the interview on their system. Therefore, the breakdown of location of voluntary interviews should be treated with caution as it may not reflect the locations of all interviews that occur.
Voluntary attendance by offence type
In the year ending March 2021, two-fifths (40%) of voluntary interviews were related to violence against the person. The second most common offence group was drug offences (14%), followed by theft offences (11%). Figure A.5 shows the proportion of voluntary attendance of interview by offence type.
Figure A.5: Proportion of voluntary attendance to interview by offence type, year ending March 2021
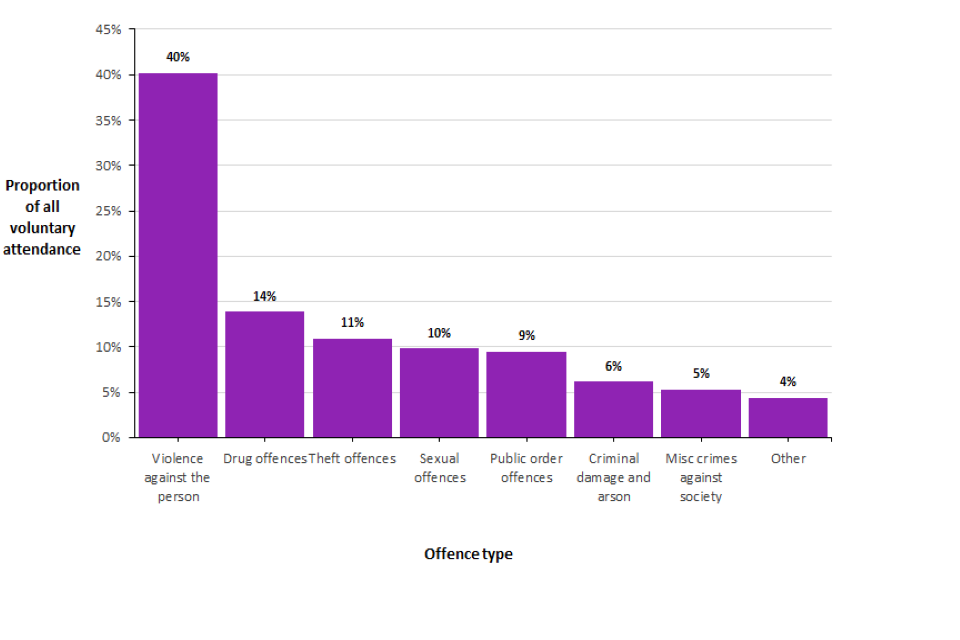
Source: Voluntary attedance table VA.05, Home Office
Notes:
1. Due to rounding percentages may not total 100%
2. Due to the provisional and incomplete nature of this dataset, these statistics have been designated as Experimental Statistics.
3. Based on data from 17 police forces. Leicestershire could not provide data on offences linked to voluntary attendance to interview.
4. Excludes 3,414 unknown offences
5. ‘Other’ includes fraud offences (567), robbery (500), and possession of weapons offences (815)
6. An individual can voluntarily attend interview for multiple offences under one record of voluntary interview, therefore, an individual instance of voluntary interview may appear multiple times within the figure.
Voluntary attendance by gender
Excluding records where the gender was unknown (12% of interviews), the majority (77%) of individuals who voluntarily attended interview were male and this pattern was seen across all offence types.
Although females accounted for only 23% of all voluntary interviews, almost a third (32%) of persons attending interview for violence against the person were female and accounted for 36% of VA interviews for fraud offences. In contrast, only 5% of individuals who attended voluntary interview for sexual offences were female, and 12% for drug offences.
Voluntary attendance by age
A quarter (26%) of individuals who voluntarily attended interview were aged between 25 and 34, and a third (33%) were 24 years old or under. However, these proportions differed across each offence type. For example, although under 18-year olds account for 15% of all voluntary interviews, they accounted for 57% of interviews for robbery, and 37% for possession of weapons offences. Moreover, those aged 18 to 24 years old also accounted for 32% of voluntary interviews for drug offences, despite accounting for 17% of all voluntary interviews.
A.5 Details of data quality issues
When compiling the return for the year ending March 2021, several forces expressed difficulty with extracting the data, and as such were unable to provide certain aspects of the return such as linked offence type or demographic details of the individual. Consequently, as the collection is voluntary, the analysis presented in this chapter and in the accompanying data tables is based on partial data from forces and should be interpreted with caution.
Duration
Some forces had difficulty extracting data on the length of release on pre-charge bail, RUI and voluntary attendance of interview. Consequently, there is inconsistency in how the duration has been calculated. Several forces were required to manually calculate the duration period by using the date the record was created and closed. This method does not always capture the actual date that pre-charge bail or RUI ended, as officers do not always systematically close the records on the actual closed date. Secondly, some forces are unable to determine when a pre-charge bail or RUI reached an outcome. Cambridgeshire constabulary were unable to distinguish between the length of time spent on pre-charge bail or RUI and the time spent with the Crown Prosecution Service (CPS). As such their pre-charge bail and RUI lengths are inflated as they include time spent with the CPS. However, the median duration does not differ from other forces so has been included in the analysis. Additionally, some forces were unable to identify instances where an individual has been converted from pre-charge bail to RUI and vice versa. This can result in inaccurate durations. For example, if an individual was placed on pre-charge bail for 10 days and then converted to RUI for 20 days the records associated with the individual will only be captured under RUI, with a length of 30 days.
Offence
The Home Office asked forces to provide data on all offences associated with an individual released on pre-charge bail, RUI, voluntary attendance to interview, or breach of pre-charge bail conditions. Given the novelty of the collection there is a variation in what police forces provided. Whilst around half of forces provided all offences associated with a record, the remaining forces were only able to provide the principal offence (i.e. the most serious offence), or the first offence associated with the individual’s record. This does not guarantee that it is the offence for which the individual was released on pre-charge bail, RUI, or voluntarily interviewed. Moreover, some forces were unable to determine the offence type linked to a breach of bail, due to the pre-charge bail breaches being recorded on a separate system to the original pre-charge bail record.
Outcome
Police forces were asked to provide the outcome of all pre-charge bail, released under investigation, and voluntary interview records. However, forces may categorise the outcomes in different ways and as such may not be comparable across forces. Moreover, several forces expressed difficulty with extracting the outcome of a pre-charge bail, released under investigation or voluntary interview record from their systems. Consequently, this data is incomplete.
Voluntary attendance
Voluntary attendance of interview data is largely incomplete. Multiple forces highlighted that they did not have a record of all interviews that occur, or key details about the interviewee (e.g. age, gender, ethnicity). They explained that they did not always have the capability to record an interview if it occurred outside of a police station, or the data was difficult to extract. Consequently, voluntary attendance of interview data is likely to be an undercount, and data on interviewees and location of interview will be incomplete.
Furthermore, some forces reported that they interview multiple separate individuals several times in connection with a single offence under one custody record. Whilst the Home Office publishes figures related to the total number of individuals who voluntarily attended interview, due to the incomplete nature of the data provided it is not possible for the Home Office to confidently determine whether all individuals listed under the same custody record are the same individuals being interviewed multiple times.
Annex B Experimental Statistics – Detentions under section 135 of the Mental Health Act 1983
B.1 Introduction
Police forces in England and Wales regularly interact with people experiencing mental ill health. Sometimes these interactions may result in the need to remove a person from where they are, and take them to a place of safety, under section 135 of the Mental Health Act 1983.
Under section 135 a magistrate may issue a warrant, on application by a mental health professional, authorising a police officer to enter specific premises in respect of a mentally disordered person, believed to be in need of care or control, and to remove that person from those premises if necessary. Incidents are only recorded by the police under section 135 if an officer enters a private premise in execution of the warrant (including by force if necessary) and/or removes the person from the premises to a place of safety in accordance with the terms of the warrant.
Either or both of these powers must be executed by an officer for it to constitute a section 135 detention for the purposes of this data collection. Therefore, incidents where an officer attends a private premise in response to ad hoc requests for assistance or other reasons but does not execute either part of a section 135 warrant, are not recorded in this data set.
Data analysis on detentions under section 135 of the Act is based on data received from 37 police forces for year ending March 2021. Some of these forces have raised quality concerns with their data. Therefore, data in this chapter give an indicative picture only, and should be treated with caution.
Due to the provisional and incomplete nature of this dataset, these statistics have been designated as Experimental Statistics, to acknowledge that further development will take place in the future. The Home Office is working with forces to understand the issues they face with this data collection and will consider whether any changes to the data return requirement are needed.
In this report, we refer to gender rather than sex of people arrested. ‘Sex’ can be considered to refer to whether someone is male or female based on their physiology, with ‘gender’ representing a social construct or sense of self that takes a wider range of forms. We are reporting the data in the format they are collected and we are working to bring these data in line with Government Statistical Service sex and gender harmonisation standards.
B.2 Key findings
In the year ending March 2021, there were around 2,689 detentions under section 135 of the Mental Health Act, an increase of 14% from last year when analysing forces that had submitted data in both years. Use of section 135 detentions has increased in recent years, and is up 60% since the year ending March 2017.
Of the cases where the gender of the person being detained was recorded (99%), 58% were male detainees.
The vast majority (99%) of cases were detentions of adults aged 18 or over (excluding those cases where the age of the person being detained was not recorded).
In terms of the ethnicity of those being detained (excluding those cases where the ethnicity was not recorded):
- 61% were White
- 27% were Black, African, Caribbean or Black British
- 9% were Asian or Asian British
- 0.4% were Mixed or Multiple ethnic groups
- the remaining 3% of people detained were of another ethnic group
The proportion of detentions of people from Black, Asian and other minority ethnic backgrounds may reflect the large proportion of detentions accounted for by the Metropolitan Police (50%) which is a much more ethnically diverse police force area compared with all other forces in England and Wales[footnote 19]. Excluding the Metropolitan Police, people from a Black, African, Caribbean or Black British backgrounds account for 8% of detentions, and those from Asian or Asian British backgrounds accounted for 5%. Additionally, some forces have used officer-defined ethnicity when recording an individual’s ethnicity instead of the self-defined ethnicity categories listed above, which may have resulted in detentions of people of mixed ethnicity being reported under different categories.
Table B.1 Section 135 detentions, by Police Force Area and gender, year ending March 2021
| England and Wales | Numbers | ||||
|---|---|---|---|---|---|
| Gender | |||||
| PFA code | Police Force Area | Male | Female | Not known | Total |
| E23000013 | Cleveland | - | - | - | - |
| E23000008 | Durham | 16 | 7 | 2 | 25 |
| E23000007 | Northumbria | 31 | 24 | - | 55 |
| E12000001 | North East Region | 47 | 31 | 2 | 80 |
| E23000006 | Cheshire | .. | .. | .. | .. |
| E23000002 | Cumbria | 39 | 22 | - | 61 |
| E23000005 | Greater Manchester | 30 | 34 | 1 | 65 |
| E23000003 | Lancashire | 52 | 36 | - | 88 |
| E23000004 | Merseyside | .. | .. | .. | .. |
| E12000002 | North West Region | 121 | 92 | 1 | 214 |
| E23000012 | Humberside | - | 6 | - | 6 |
| E23000009 | North Yorkshire | - | - | - | - |
| E23000011 | South Yorkshire | 66 | 23 | 3 | 92 |
| E23000010 | West Yorkshire | 16 | 21 | 1 | 38 |
| E12000003 | Yorkshire and the Humber Region | 82 | 50 | 4 | 136 |
| E23000018 | Derbyshire | 3 | 1 | - | 4 |
| E23000021 | Leicestershire | 61 | 26 | - | 87 |
| E23000020 | Lincolnshire | 13 | 14 | - | 27 |
| E23000022 | Northamptonshire | 3 | 6 | - | 9 |
| E23000019 | Nottinghamshire | - | - | - | - |
| E12000004 | East Midlands Region | 80 | 47 | - | 127 |
| E23000015 | Staffordshire | 23 | 16 | - | 39 |
| E23000017 | Warwickshire | 1 | 1 | - | 2 |
| E23000016 | West Mercia | 18 | 18 | - | 36 |
| E23000014 | West Midlands | 10 | 6 | - | 16 |
| E12000005 | West Midlands Region | 52 | 41 | - | 93 |
| E23000026 | Bedfordshire | 5 | 5 | - | 10 |
| E23000023 | Cambridgeshire | 5 | 5 | - | 10 |
| E23000028 | Essex | 110 | 64 | - | 174 |
| E23000027 | Hertfordshire | - | - | - | - |
| E23000024 | Norfolk | 67 | 24 | - | 91 |
| E23000025 | Suffolk | 17 | 19 | - | 36 |
| E12000006 | East of England Region | 204 | 117 | - | 321 |
| E23000034 | London, City of | - | - | - | - |
| E23000001 | Metropolitan Police | 740 | 589 | 4 | 1,333 |
| E12000007 | London Region | 740 | 589 | 4 | 1,333 |
| E23000030 | Hampshire | .. | .. | .. | .. |
| E23000032 | Kent | 15 | 16 | - | 31 |
| E23000031 | Surrey | 58 | 48 | - | 106 |
| E23000033 | Sussex | .. | .. | .. | .. |
| E23000029 | Thames Valley | 60 | 49 | 2 | 111 |
| E12000008 | South East Region | 133 | 113 | 2 | 248 |
| E23000036 | Avon and Somerset | 11 | 6 | - | 17 |
| E23000035 | Devon and Cornwall | .. | .. | .. | .. |
| E23000039 | Dorset | 6 | 1 | - | 7 |
| E23000037 | Gloucestershire | 1 | - | - | 1 |
| E23000038 | Wiltshire | 30 | 16 | - | 46 |
| E12000009 | South West Region | 48 | 23 | - | 71 |
| E92000001 | ENGLAND | 1,507 | 1,103 | 13 | 2,623 |
| W15000004 | Dyfed-Powys | .. | .. | .. | .. |
| W15000002 | Gwent | 12 | 5 | - | 17 |
| W15000001 | North Wales | - | - | 8 | 8 |
| W15000003 | South Wales | 23 | 18 | - | 41 |
| W92000004 | WALES | 35 | 23 | 8 | 66 |
| British Transport Police | - | - | - | - | |
| K04000001 | ENGLAND AND WALES | 1,542 | 1,126 | 21 | 2,689 |
Source: Home Office
Notes:
’ - ‘ = Nil
’ .. ‘ = Not available
- Due to the provisional and incomplete nature of this dataset, these statistics have been designated as Experimental Statistics.
-
In year ending March 2021 Dyfed Powys were unable to provide data, and Greater Manchester and Gloucestershire stated that new processes had led to changes in recording of detentions under section 136 of the Mental Health Act. Therefore, to ensure comparability across these years, these forces have been excluded from year-on-year comparisons. ↩
-
Due to the nature of mental health detentions, some forces record officer-defined ethnicity under different categories to those listed. As a result, the ‘Mixed’ ethnicity category may be under-recorded. ↩
-
Due to recording practices, Greater Manchester Police and Humberside Police were unable to distinguish between ‘Health Based Place of Safety (HBPOS)’ and ‘A&E used as POS’, and have reported them both under Health Based Place of Safety ↩
-
Comparisons have not been made with previous years due to low numbers and changes in recording practices of some forces. ↩
-
The conditions in the regulations that need to be met for police custody to be used as a place of safety are: 1. The person is over 18. 2. The behaviour of the adult poses an imminent risk of serious injury or death to that person or others. 3. Because of the risk posed, no place of safety other than a police station can reasonably be expected to detain the adult. 4. So far as is reasonably practicable, a healthcare professional is present and available to the detainee throughout the period in which they are detained at the police station. Further guidance is available here: Guidance for the implementation of changes to police powers and places of safety provisions in the mental health act 1983. ↩
-
Ministry of Justice publishes data in its Criminal Justice Statistics Quarterly publication on prosecutions and convictions for motoring offences. ↩
-
Examples of cancelled FPNs include cases where the police were unable to identify the driver of the vehicle, or when the vehicle belonged to the emergency services. ↩
-
Examples of cancelled FPNs include cases where the police were unable to identify the driver of the vehicle, or when the vehicle belonged to the emergency services. ↩
-
Ministry of Justice publishes data in its Criminal Justice Statistics Quarterly publication on prosecutions and convictions for motoring offences ↩
-
These offences are the most serious breaches of criminal law and must be tried at the Crown Court. ↩
-
Excludes Lancashire, Greater Manchester and Staffordshire who did not provide complete data in the year ending March 2021. Also excludes Essex and Hertfordshire who did not provide a count of individuals on bail in the year ending March 2020. ↩
-
Excludes Lancashire, Greater Manchester and Staffordshire police who did not provide data for the year ending March 2021. Humberside and Nottinghamshire were unable to provide data on duration. ↩
-
7 forces were unable to provide the Home Office with data in the new format. Lancashire and Greater Manchester were unable to provide data to the Home Office for year ending March 2021. Staffordshire were excluded as they were unable to provide the Home Office with a complete data for the year ending March 2021. Dyfed-Powys, Hertfordshire and South Yorkshire were unable to provide data on the offence type of pre-charge bail records. ↩
-
7 forces did not provide data in the new format, and Dyfed-Powys, Gwent, Hertfordshire and South Yorkshire were unable to provide details on the outcome of their pre-charge bail records due to issues with their data recording system. Staffordshire were only able to provide partial data. GMP and Lancashire were unable to provide any data for the latest year. ↩
-
Excludes 20 police forces that could not provide data on released under investigation, and Hertfordshire, Humberside, and West Midlands police who could not provide duration data. ↩
-
Excludes 20 forces that did not provide data on released under investigation and excludes Hertfordshire who could not provide duration data. ↩
-
Excludes 20 forces that did not provide data on released under investigation and excludes Hertfordshire could not provide data on outcome. ↩
-
25 police forces could not provide data on voluntary attendance to interview. ↩
-
Regional ethnic diversity - GOV.UK Ethnicity facts and figures (ethnicity-facts-figures.service.gov.uk). ↩