Income-related benefits: estimates of take-up background information and methodology
Updated 26 January 2024
Applies to England, Scotland and Wales

© Crown copyright 2024
This publication is licensed under the terms of the Open Government Licence v3.0 except where otherwise stated. To view this licence, visit nationalarchives.gov.uk/doc/open-government-licence/version/3 or write to the Information Policy Team, The National Archives, Kew, London TW9 4DU, or email: psi@nationalarchives.gov.uk.
Where we have identified any third party copyright information you will need to obtain permission from the copyright holders concerned.
This publication is available at https://www.gov.uk/government/statistics/income-related-benefits-estimates-of-take-up-financial-year-ending-2022/background-information-and-methodology-for-financial-year-ending-2022
1. Introduction
This background report accompanies the main income-related benefits: estimates of take-up report for financial year ending (FYE) 2022.
The purpose of this report is to provide further contextual information to aid understanding of the statistics presented in the main report and data tables. It outlines points to note as well as strengths and limitations of the information presented in each section of the main report, alternative data sources, as well as changes this year.
A detailed description of the income-related benefits: estimates of take-up methodology, data processing and quality assurance are presented within the relevant sections in this report. These descriptions are intended to help users in the use and interpretation of the FYE 2022 data.
This document, the statistics release and data tables, along with previous releases, can be found on the collections page.
A. Status of the Statistics
Official statistics
These statistics are official statistics. They comply with the standards of trustworthiness, quality, and value in the Code of Practice for Statistics.
Our statistical practice is regulated by the Office for Statistics Regulation (OSR). OSR sets the standards of trustworthiness, quality, and value in the Code of Practice for Statistics that all producers of official statistics should adhere to.
You are welcome to contact us directly with any comments about how we meet these standards. Alternatively, you can contact OSR by emailing regulation@statistics.gov.uk or via the OSR website.
Key applications, in this release and previous releases, include:
- improved background information and methodology
- new release strategy
- move to HTML and a more accessible release
- improved chart presentation
- recognition of the effect on our estimates, caused by changes to source data
- suspension of and re-instatement of the publication
The effect of Get Your State Pension (GYSP) on these statistics
The source for State Pension administrative data used in these modelled estimates has encountered issues with obtaining GYSP data. For a small group of younger pensioners, we do not have linked admin-based data to use and are relying on self-reported survey data. This has increased the uncertainty in our modelling for younger entitled non-recipients (ENRs) for FYE 2022.
Reinstatement of the financial year ending (FYE) 2022 estimates
The income-related benefits: estimates of take-up Official Statistics have been re-instated for FYE 2022. This is due to the improved quality of data collected by the Family Resources Survey (FRS) for FYE 2022.
Suspension of the financial year ending (FYE) 2021 estimates
The income-related benefits: estimates of take-up Official Statistics were suspended for FYE 2021. Estimates were not published due to data issues following the coronavirus (COVID-19) pandemic.
Effects of the coronavirus (COVID-19) pandemic on these statistics
As with FYE 2021, collection of the FYE 2022 Family Resources Survey (FRS) data was affected by the coronavirus (COVID-19) pandemic. Although government restrictions introduced in response to the pandemic were significantly eased over the course of FYE 2022, the change in survey mode from established face-to-face interviews to telephone interviews in response to the pandemic persisted for the duration of FYE 2022. This affected both the size and composition of the achieved sample.
Please see the FRS background information and methodology for the specific adjustments that have been made in light of the coronavirus (COVID-19) pandemic effects on the sample for FYE 2022.
Also see the Households Below Average Income (HBAI) technical report which explains the effects of the coronavirus (COVID-19) pandemic in more detail. This should be considered alongside the interpretation of these statistics.
B. Background
Relevance
These statistics date back to FYE 2010.
They are designed to give an estimate of the take-up of benefits within the entitled pensioner population. They aim to provide an indication of whether, and to what extent, Pension Credit (PC) and Housing Benefit (HB) are taken up by the entitled pensioner population.
A comprehensive set of data tables complementing the results presented are available alongside the publication.
These tables are referenced throughout the published report.
These statistics can be used for:
- increasing awareness / take-up of benefits: The take-up estimates, and further analysis tables can help increase awareness of benefits and target areas with low take-up
- measuring the effect of take-up initiatives
- policy development
- methodological and statistical comparisons to help assure other methods
- answering ministerial briefings, ad-hoc enquiries, Freedom of Information (FOI) requests, and Parliamentary Questions (PQs) published on the UK Parliament website
These statistics can be used by both internal and external users. Department for Work and Pensions (DWP), uses these statistics for policy analysis, decision making, and answering queries. Our external users include stakeholders such as devolved administrations, press, journalists, researchers, academics, voluntary organisations, and charities. These groups use the statistics for research purposes and awareness.
Accessibility
We have further reviewed our publication tables and supporting guidance to ensure accessibility to users. For compliance with The Public Sector Bodies (Websites and Mobile Applications) Accessibility Regulations 2018, some formatting in the ODS tables, such as merged cells, has been avoided. For more information, please see the accessibility statement specific to DWP’s statistical releases.
Clarity
Take-up statistics contain contact details for further information on the statistics, guidance on using the statistics, data sources, limitations, and other necessary relevant information to enable users of the data to interpret and apply the statistics correctly.
Timeliness and Punctuality
Take-up statistics are modelled estimates based on Family Resources Survey (FRS) data. Modelling work to produce the entitlement dataset can only start once the final FRS dataset is published. In this case FRS FYE 2022 was published in March 2023. Given the complex methodology, and reintroduction of the statistics, extensive quality assurance is required before the statistics can be published.
We announced in July 2023 the reintroduction of the statistics with a publication in September or October 2023. We published as announced on 26 October 2023, and have announced a publication window of either September or October 2024, for FYE 2023 data.
Confidentiality, security, and transparency
Personal identifiers on the data provided from administrative systems are encrypted to prevent identification of individuals within the data.
Data is held securely with access given only to analysts who have completed internal data access and security training and have a business need to access the data.
C. Context of the statistics
The benefits covered in the publication are:
- Pension Credit (PC)
- Housing Benefit (HB) for pensioners
Pension Credit (PC)
Overview
Pension Credit (PC) is an income-related benefit that was introduced on 6 October 2003 and replaced the Minimum Income Guarantee (MIG).
There are 2 parts to PC:
- Guarantee Credit (GC)
- Savings Credit (SC)
Claimants may qualify for either or both parts of PC.
Guarantee Credit (GC) tops up the claimant’s income to a guaranteed level (a higher guaranteed level applies for couples). The level may increase if the claimant is a carer, severely disabled, responsible for a child or young person, or has certain housing costs.
To qualify:
- the claimant must live in Great Britain (GB)
- the claimant (and their partner from 15 May 2019) must have reached PC qualifying age. Therefore, from FYE 2020 onwards both parties in a couple must be State Pension age (SPa) or above to be entitled to claim PC (unless the couple are in receipt of HB (for pensioners) where only one party in a couple needs to be above SPa)
Savings Credit (SC) is extra money given by the government to people who have made provision for their retirement above the SC threshold (such as savings or a second pension).
Most people who reached SPa on or after 6 April 2016 will not be eligible for SC.
But some people may continue to get SC if they are both:
- in a couple and one of them reached SPa before 6 April 2016
- received SC up to 6 April 2016
If a claimant who is a member of a couple in the circumstances above stops being allowed to claim SC for any reason, they will not be able to claim it again.
As of 6 May 2020, DWP introduced an online claim option to support existing methods of applying for PC by telephone or post.
Please see GOV.UK for more information on current PC entitlement rules.
Benefit Rates
The Standard Minimum Guarantee (SMG) is the minimum level of income that is guaranteed through GC. This is uprated each year by at least the level of the increase in earnings.
The Savings Credit Threshold (SCT) determines the level of income at which someone becomes eligible for SC, while the SC Maximum (SC max) is the maximum amount of SC that can be awarded. In recent years, the rate of the increase of the SCT has had the effect of reducing the SC max.
The following rates are taken from: Benefit and pension rates 2021 to 2022.
| Singles | FYE 2022 rates per week |
|---|---|
| Standard Minimum Guarantee | £177.10 |
| Savings Credit Threshold | £153.70 |
| Savings Credit Maximum | £14.04 |
| Couples | FYE 2022 rates per week |
|---|---|
| Standard Minimum Guarantee | £270.30 |
| Savings Credit Threshold | £244.12 |
| Savings Credit Maximum | £15.71 |
The qualifying age
Between April 2016 and November 2018, the PC qualifying age for males and females rose to 65 in line with the increase in SPa for females. The PC qualifying age increased in line with further increases in SPa for both males and females, from 65 to 66 between December 2018 and October 2020. For FYE 2022 the SPa for both males and females is 66. Thereafter, it will continue to increase in line with further increases in SPa for both males and females, so will rise to 67 by 2028. More information can be found in the following table:
| Date | Qualifying Age for females | Qualifying Age for males |
|---|---|---|
| April 2009 | 60 years | 65 years |
| April 2010 | 60 years | 65 years |
| April 2011 | Between 60 years 5 months and 60 years 7 months | 65 years |
| April 2012 | Between 60 years 11 months and 61 years 1 month | 65 years |
| April 2013 | Between 61 years 5 months and 61 years 7 months | 65 years |
| April 2014 | Between 61 years 11 months and 62 years 1 month | 65 years |
| April 2015 | Between 62 years 5 months and 62 years 7 months | 65 years |
| April 2016 | Between 62 years 11 months and 63 years 3months | 65 years |
| April 2017 | Between 63 years 8 months and 64 years | 65 years |
| April 2018 | Between 64 years 5 months and 64 years 9 months | 65 years |
| April 2019 | 65 years | 65 years |
| April 2020 | 65 years | 65 years |
| April 2021 | 66 years | 66 years |
| April 2022 | 66 years | 66 years |
Changes to Pension Credit (PC) rules
Capital disregards are amounts that the claimant has, but that are not taken into account when considering entitlement or calculating any assumed yield income. From November 2009, the level of the capital disregard increased to £10,000 (up from £6,000). Previously, only those who lived permanently in a care home had a £10,000 capital disregard.
Mixed age couples
From 15 May 2019, mixed age couples were no longer able to choose whether they claimed Universal Credit (UC) or PC or pension age HB. Both parties of a couple will have to reach the PC qualifying age before they can be entitled to either PC or pension age HB or both.
From 15 May 2019, if a claimant who receives HB or PC’s circumstances change, or they take a break from claiming, they may have to claim UC instead. Some changes that affect claims include:
- a change of address to a different local council area
- going abroad for more than 4 weeks
- a change in the amount of capital a claimant has
- stopping claiming a benefit that helps a claimant qualify for PC or HB
- separating from a partner and then getting back together
Pensioner TV licences
From 1 August 2020, anyone who was aged 75 years or over and received PC was entitled to a free TV licence.
Up-rating
In April 2021:
- inflation-linked benefits and Tax Credits rose by 0.5% in line with the Consumer Prices Index (CPI)
- the Basic and New State Pension increased by 2.5% in line with the ‘triple lock’. The ‘triple lock’ ensures that the basic State Pension and new State Pension increase every year by whichever is the highest of the following: earnings, prices as measured by the CPI, or 2.5%. In FYE 2022, both the Basic and New State Pension increased by 2.5%. The Basic State Pension increased from £134.25 per week to £137.60 per week, a cash increase of £3.35 per week. The New State Pension increased from £175.20 per week to £179.60 per week, a cash increase of £4.40 per week
- the Standard Minimum Guarantee (SMG) in PC increased by 1.9%. For those who were single, the SMG in PC increased from £173.75 per week to £177.10 per week, a cash increase of £3.35 per week. For couples, this increased from £265.20 per week to £270.30 per week, a cash increase of £5.10 per week
Interaction with other income-related benefits
Until November 2018, males aged between SPa for females and 65 were able to claim one of PC, Employment and Support Allowance (ESA income-related (IR)), Jobseeker’s Allowance (income-based (IB)) or, in certain areas, Universal Credit (UC). From November 2018 males could only claim PC when PC qualifying age for males was reached. This choice also existed for mixed age couples until May 2019 where one member was aged above the PC qualifying age, and the other was aged below.
For the purposes of estimating take-up, we modelled those males aged over the PC qualifying age, but under 65, would have claimed PC rather than ESA (IR). This can be explained as follows. It is assumed that a working-age person can only claim a working-age benefit, such as ESA (IR). Males aged over the PC qualifying age but under 65 have a choice over what they can claim – PC or a working-age benefit. Most males would opt for PC because the amount of benefit received would normally be greater than their working-age benefits. Additionally, with PC there are no conditionality requirements (the working-age benefits need a justification as to why the claimant is not working). Similarly, mixed age couples were assumed to claim PC. From FYE 2020 onwards mixed age couples can only claim UC.
PC could be paid in conjunction with HB.
Housing Benefit (HB)
Overview
Housing Benefit (HB) helps tenants who are on a low income to pay their rent. HB is administered by local authorities who decide whether a claimant is eligible for HB, and how much they qualify for. Tenants can apply for HB irrespective of whether they are in work, or out-of-work. It may be paid alongside other income-related benefits, non-income-related benefits, or on its own. Since December 2018, due to the rollout of UC, new claims for HB can only be made in certain circumstances.
Subject to having an eligible rent liability, the vast majority of those on the Guarantee Credit (GC) part of PC, Income Support (IS), or ESA (IR) are automatically eligible for maximum HB.
Claimants not in receipt of one of the benefits listed above may have their HB reduced if they have capital or income more than certain thresholds. If their capital or income is too high, they may not qualify for HB at all.
The amount awarded can also vary based on the numbers, age, and disabilities of members of the household. For many claimants in the private rented sector, the level of their eligible rent is also limited by the Local Housing Allowance (LHA) rates which apply to where they live. The size and composition of the claimant’s household determines the size of the accommodation which they might need. In turn, the specific LHA rate is used to assess entitlement to HB.
There are some exceptions. Those that do not qualify for HB include:
- those who live in the home of a close relative
- any full-time students - unless they are disabled or have children
- asylum seekers or those sponsored to be in the United Kingdom (UK)
As of December 2018, new claims for HB can only be made if:
- a claimant (and their partner from 15 May 2019) has reached SPa. Therefore, from FYE 2020 onwards both parties in a couple must be SPa or above before being entitled to claim HB (unless the couple are in receipt of PC where only one party in a couple needs to be above SPa).
- a claimant lives in supported, sheltered or temporary housing
Please see GOV.UK for more information on current HB entitlement rules.
Benefit rates
There is no set rate of HB that a claimant will receive, but the thresholds used for the means-tested side of the HB assessment are aligned to rates of other benefits. Claimants in the private rented sector are usually restricted to the LHA rate for their family size and postcode.
Changes to Housing Benefit (HB) rules
Since 2010 there have been several changes to the structure of Housing Benefit (HB).
Local Housing Allowance (LHA) changes
Phased in from April 2011:
- LHA rates are calculated based on the 30th percentile of rents in the area. Previously, they were based on the 50th percentile (or median of rents)
- claimants are no longer entitled to keep any excess between their rent and the LHA rate (previously, this was up to £15 a week)
- LHA rates are capped to overall maximum weekly levels (affecting the most expensive areas such as inner London)
- claimants can no longer get the 5-bedroom rate
Phased in from January 2012:
- the age threshold for the shared accommodation rate (SAR) (previously under 25) was extended to include single people aged under 35
LHA rates were frozen for four years from April 2016. In April 2020 they were raised to the 30th percentile rent levels but were subsequently frozen in cash terms.
For more information on LHA and LHA reforms, please see: Local Housing Allowance (LHA): help with rent for private tenants - House of Commons Library (parliament.uk)
Introduction of the National Living Wage
Phased in from April 2016, the National Living Wage was introduced, and HB family premium began to be phased out. This tended to reduce HB entitlement and move people, with very small entitlements under the FYE 2016 system, off benefit altogether.
Removal of the Spare Room Subsidy
The removal of the spare room subsidy was introduced nationally on 1 April 2013. It applies the size criteria test that pre-existed in the LHA to determine the number of bedrooms needed by working-age HB claimants living in the social rented sector. Where claimants are found to be under-occupying, their eligible rent is reduced by 14% if they have one extra bedroom and by 25% if they have 2 or more. Pensioners are exempt from the policy, with easements for certain groups (for example claimants with overnight carers).
Interaction with other income-related benefits
HB can be paid alongside PC. HB is calculated on the basis of an ‘applicable amount’ intended to cover basic weekly living expenses. The amount of benefit is calculated by comparing a person’s income with their applicable amount which is intended to cover day-to-day living expenses, taking account of the size and make-up of the household. If the net income is equal to or is less than the applicable amount or they are in receipt of an income-related benefit, they will receive 100% of the rent for which benefit can be paid less any non-dependent deductions. This would be subject to any deductions for non-dependents who live with them and help with rent would not exceed the LHA rate which applies to their household. If the net income is more than the applicable amount, they will receive reduced HB. For each pound of extra income over the applicable amount, after disregards, 65 pence will be deducted.
Universal Credit (UC)
Effect on take-up Statistics
There is a specific challenge in creating a Universal Credit (UC) take-up measure and interpreting and communicating its results within the scope of the Code of Practice for Statistics. We are unable to estimate UC take-up rates at present. We are monitoring the situation and will make changes in the future as needed. From December 2018 there can be no new claims for any of the working-age legacy benefits. Therefore, from FYE 2020 onwards this publication focusses on take-up for pensioners only.
Universal Credit (UC) Official Statistics
The Universal Credit (UC) Official statistics provide the primary source of information about people and households on UC.
Read statistics on UC.
Read the latest UC statistics release.
Accessibility
We have further reviewed our publication tables and supporting guidance to ensure accessibility to users. For compliance with The Public Sector Bodies (Websites and Mobile Applications) Accessibility Regulations 2018, some formatting in the ODS tables, such as merged cells, has been avoided. For more information, please see the accessibility statement specific to DWP’s statistical releases.
Clarity
Take-up statistics contain contact details for further information on the statistics, guidance on using the statistics, data sources, limitations, and other necessary relevant information to enable users of the data to interpret and apply the statistics correctly.
Confidentiality, security, and transparency
Personal identifiers on the data provided from administrative systems are encrypted to prevent identification of individuals within the data.
Data is held securely with access given only to analysts who have completed internal data access and security training and have a business need to access the data.
D. Source of the statistics
Figures in this analysis are based on DWP administrative data, Local Authority administrative data, and data from the Family Resources Survey (FRS). The survey data from the FRS is modelled using a static micro simulation model known as the Policy Simulation Model (PSM). A more detailed explanation can be found in the data compilation & methodology section below.
E. Strengths of the statistics
Receipts are based on quality administrative data sources which are published as National Statistics – with adjustments for the specific purpose of reporting take-up rates.
The Family Resources Survey (FRS) is a large household survey with a range of variables on characteristics etc. to inform eligibility modelling.
The data linking approach has continued to develop resulting in more cases in scope for linking and increasing match rates. A change from consent to a new legal basis, in FYE 2017, means we can try and link all FRS cases now, compared to approximately 60% of FRS cases previously. In FYE 2010 we were able to link 81% of the 60% of FRS cases, however, in FYE 2022 we were able to link to 97% of 100% of FRS cases.
The methodology introduced for the FYE 2014 analysis (and retrospectively applied to FYE 2010 and FYE 2013) makes more use of existing administrative data alongside data from the FRS and Policy Simulation Model (PSM) to estimate take-up. The methodology introduced for the FYE 2018 analysis (and retrospectively applied to FYE 2017) provides an improved approach to estimating eligibility of caseload and expenditure take-up. From FYE 2020 onwards we can link to UC, Disability Living Allowance (DLA) (mobility component), Personal Independence Payment (PIP), Tax Credits, Carers Allowance and Child Benefit as well as benefits that we have been linking to in previous years.
The FRS is linked with DWP administrative data and where a match is made for a record, its reported amount of receipt for a benefit on the FRS is overwritten with the amount in receipt as recorded on the administrative data. This helps address some of the benefit undercount on the FRS.
Although they are based on DWP administrative data, the numbers in receipt and expenditure are not identical to official DWP statistics. This is because they are averaged across the whole year and other adjustments are made to enable consistency with the other non-administrative sources used, such as the FRS (see the data compilation & methodology section for a full discussion).
Although all estimates are subject to some analytical assumptions, the methodology minimises these. As a result, the changes to the methodology have allowed for more accurate estimates to be produced.
Further information on the data linking approach can be found in the data compilation & methodology section.
F. Limitations of the statistics
Previous published statistics up to and including FYE 2020 were not affected by the coronavirus (COVID-19) pandemic. However, fieldwork operations for the FYE 2021 Family Resources Survey (FRS) were changed in response to the coronavirus (COVID-19) pandemic and the introduction of national lockdown restrictions. The established face-to-face interviewing approach employed on the FRS was suspended and replaced with telephone interviewing from April 2020 for the whole of FYE 2021. This change affected both the size and composition of the achieved sample. Where a usual year typically saw a sample size of around 20,000 households, the sample size for FYE 2021 was around 10,000. Due to data issues following the coronavirus (COVID-19) pandemic affecting the methodology to produce these statistics the Income-related benefits: estimates of take-up Official Statistics were not produced for FYE 2021.
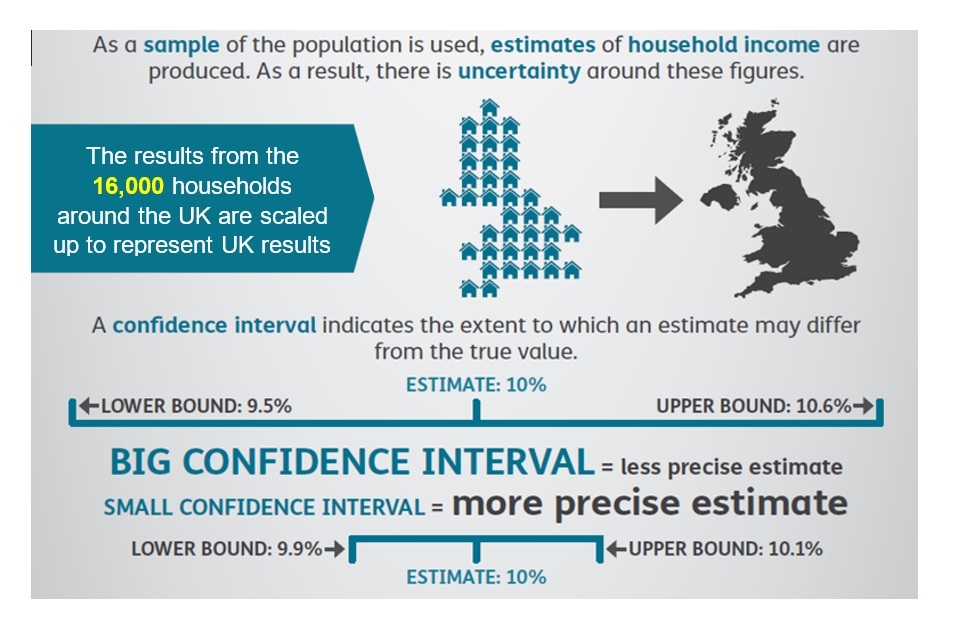
Fieldwork operations for the FRS continued to take account of government guidance relating to the coronavirus (COVID-19) pandemic and the restrictions placed on visiting others’ homes for FYE 2022. The telephone interview approach continued throughout FYE 2022. The fieldwork approach was more stable in FYE 2022 than in FYE 2021, but conditions remained challenging. This affected both the size and composition of the achieved sample, with around 16,000 households for FYE 2022. The smaller sample size for FYE 2022 leads to greater uncertainty in our estimates than in previous years.
The grossing regime in FYE 2022 was adapted to control for the differential level of response seen through the year. We accounted for this change by introducing a biannual grossing control for GB so there were equal numbers of private households from each half of the survey year in the weighted sample. However there remained some unobservable residual bias that cannot be corrected by grossing.
Further information on the fieldwork and methodology for the FRS FYE 2022 can be found in the FRS background, information and methodology.
The source for State Pension administrative data used in these modelled estimates has encountered issues with obtaining Get Your State Pension (GYSP) data. For a small group of younger pensioners, we do not have linked admin-based data to use and are relying on self-reported survey data. This has increased the uncertainty in our modelling for younger entitled non-recipients (ENRs) for FYE 2022.
There is general uncertainty in our estimates, especially in those of entitled non-recipients (ENRs) of benefits, given the complexity of estimation. The FRS, used in the estimation of ENRs, is not designed specifically to measure entitlement criteria to the same extent as an application for a specific benefit. It is a multi-purpose household survey.
The estimates of ENRs are also based on PSM data, which is modelled FRS data, and are therefore subject to sampling variation and other forms of error associated with a sample survey. These include reporting errors, under-reporting, systematic bias, and random sampling error. For more details, please see the FRS background information and methodology.
Due to restrictions in modelling and available data, certain populations are excluded from our analysis. As such the results do not include:
- those living in non-private households
- estimates for Northern Ireland (Only figures for GB are reported) due to the differences in benefit systems
Take-up statistics are not available at a lower level of geography than GB. This is because the survey sample sizes for ENRs are too small to calculate take-up rates in smaller geographical areas. Similarly, HB (for pensioners) take-up statistics are only available as totals. This is also because the survey sample sizes for entitled non-recipients are too small to be able to calculate take-up rates for sub-groups.
With the abolition of SC for new pensioners from April 2016, and the reducing number of SC only cases in the eligible population, we are no longer able to estimate SC breakdowns with a sufficient level of confidence. Therefore, from FYE 2022 onwards, SC breakdowns are not included in the data tables. Historic SC breakdowns can be found in previous releases.
Trying to explain the reasons for non-take-up is difficult and we do not have the data in our modelling to do this. But to put the results into context, it is useful to outline some of the broad factors that have been found to have an effect. Take-up may be affected by factors such as the size or other attractiveness of the benefit, lack of awareness of the benefit or application procedure, lack of awareness of their entitlement, the perceived stigma of receiving a benefit, or other factors (Eurofound, 2015, Access to benefits in times of crisis - Eurofound (europa.eu)). See the full report: Access to social benefits: Reducing non-take-up - Eurofound (europa.eu).
G. Coherence and comparability
HMRC published estimates of the take-up of Tax Credits. The FYE 2018 publication of Tax Credit take-up rates was the last in the series of publications due to UC-related data issues from FYE 2019 onwards.
Given the adjustments and coverage of the take-up methodology, receipt and expenditure estimates here will not be the same as the Official Statistics published by DWP. DWP publishes a wide range of official statistics on receipt of benefits and benefit expenditure.
The benefit expenditure and caseload tables are available: Benefit expenditure and caseload tables.
Stat-Xplore is a DWP tool that provides users with access to data. Users can download and analyse statistics on a range of different benefits, programmes, and other information collected and stored by the department. Stat-Xplore can be accessed here: Stat-Xplore.
H. Concepts and definitions
Take-up refers to the receipt of benefits that a benefit unit is entitled to. Such a benefit unit is referred to as an entitled recipient (ER). There are also families who are entitled to benefits, but not in receipt of them. Such a family is referred to as an entitled non-recipient (ENR).
Take-up is estimated in two ways – by caseload and by expenditure:
- caseload take-up compares the number of benefit recipients, averaged over the year, with the estimated number that would be receiving if everyone took up their entitlement for the full period of their entitlement
- expenditure take-up compares the total amount of benefit received, over a year, with the estimated total amount that would be received if everyone took up their entitlement for the full period of their entitlement
The ONS has published a guide for users of official statistics on earnings and income. This guide compares the main sources of data available and outlines which sources will best meet user needs.
Other useful information on income and earnings:
- Explaining income and earnings
- GSS income and earnings statistics interactive database (civilservice.gov.uk)
- Income and earnings coherence workplan for 2022 – Government Analysis Function (civilservice.gov.uk)
- Admin-based income statistics, England, and Wales - Office for National Statistics (ons.gov.uk)
More definitions can be found in the glossary in section D
I. Revisions to the statistics
Planned
The take-up estimates use a complex methodology that uses numerous data sources. Each year the team checks all the contributing codes and processes for any potential improvements that could be made to improve the accuracy of the take-up estimates produced.
Linking permission mechanism
The Family Resources Survey (FRS) tested a new approach to obtaining agreement to link respondents’ data to administrative data from January 2017 to April 2017. The new approach replaces an explicit Yes and No question in the FRS questionnaire with an up-front statement that DWP will link respondents’ information to administrative records held by the department. A randomised control trial ran from January 2017 to April 2017, with the FRS sample split 50:50 between those receiving the new enhanced fair processing statement and the existing explicit data linking question. The trial was a success, and the new method was implemented from May 2017 onwards. This change means that the number of cases available for data linking has increased since FYE 2018. The take-up methodology already uses linked survey-administrative data to improve the quality of the estimates by replacing survey responses, which are subject to reporting error, with accurate administrative data on benefit receipt. Therefore, this methodological change means that more administrative data can be used in the production of the estimates, improving their accuracy. An increased amount of linked data completes our understanding of the number of entitled non-recipients (ENRs) for a benefit where benefit under-reporting has occurred in the FRS. This influences the mean and median amounts unclaimed. The actual effect on the take-up estimates will depend on the observed data for each survey year.
All FRS personal data processing, including linking respondents to their administrative records, is undertaken on the basis that it is necessary for a “function of a government department”. This is allowed by section 8 of the Data Protection Act, and Article 6(1)(e) Public Task of the UK General Data Protection Regulation (UK GDPR).
The data linking approach has continued to develop and in FYE 2022 we were able to link 97% of FRS cases used in the take-up estimates compared to 94% in the FYE 2020 publication. Further information on the data linking approach can be found in the Methodology section of this report below.
Methodological refinements applied from FYE 2017 onwards
There were four methodological changes applied from FYE 2017 onwards. Comparisons to earlier years should be treated with caution.
The changes are:
- improvement to the modelling of State Pension receipt, by making use of more information from respondents, this prevents any assumption of no State Pension being made by the model
- PC calculations now consider mixed age couples (where one member is aged above PC qualifying age, and the other is aged below PC qualifying age) working-age benefits (IS, ESA, and JSA), this involves removing the calculated IS, ESA, and JSA amount from PC (until FYE 2020)
- additional savings information is now considered in capital calculations
- Support for Mortgage Interest (SMI) entitlement is removed from estimated IS and PC entitlement amounts, SMI used to be paid within PC, SMI is now paid out separately as a loan and SMI has therefore been removed from PC calculations
These changes provide an improved approach to estimating eligibility of caseload and expenditure take-up which:
- reduce the estimated number of entitled non-recipients (ENRs)
- reduce the estimated unclaimed amount
For example, for FYE 2018, it is estimated that these changes affect the estimated PC take-up rate by approximately 2 percentage points (increase) for caseload and 4 percentage points (increase) for expenditure. Changes to HB are more minimal (increase is less than 1 percentage point) for both caseload and expenditure. The exact scale of the effect could vary between years.
Data linking to additional benefits
From FYE 2020 onwards we can link to UC, Disability Living Allowance (DLA) (mobility component), Personal Independence Payment (PIP), Tax Credits, Carers Allowance and Child Benefit as well as benefits that we have been linking to in previous years.
Suspension of the FYE 2021 statistics
The income-related benefits: estimates of take-up Official Statistics were suspended for FYE 2021. Estimates were not published due to data issues following the coronavirus (COVID-19) pandemic.
In the FYE 2022 report we make direct comparisons against FYE 2020 and advise users to do the same. Our charts have been adapted to indicate the gap in the time series.
Removal of pipeline variables from the Family Resources Survey (FRS)
In previous years, it was assumed that if a benefit unit reports they are awaiting an outcome of a claim, and the Policy Simulation Model (PSM) models them as entitled, it is likely that they would have gone on to receive the benefit and were categorised as entitled recipients. From FYE 2022, the FRS no longer collects information on those awaiting an outcome of a claim due to the small number of respondents. Therefore, the take-up estimates for FYE 2022 no longer include those awaiting an outcome of a claim. This has no effect on the overall results.
Pension Credit (PC) receipts data is now based on a single data source
The Quarterly Statistical Enquiry (QSE) dataset was previously used to adjust the receipts data for PC to exclude any non-private households. The Work and Pensions Longitudinal Study (WPLS) now includes variables that allow for this exclusion to be done exclusively on the WPLS dataset, and so the QSE dataset is no longer used for the receipts data from FYE 2022 onwards. This change has a minimal impact on the receipts data and allows for a more accurate approach to calculate receipts data.
Removal of Savings Credit (SC) breakdowns
With the abolition of SC for new pensioners from April 2016, and the reducing number of SC only cases in the eligible population, we are no longer able to estimate SC breakdowns with a sufficient level of confidence. Therefore, from FYE 2022 onwards, SC breakdowns will not be included in the data tables. Historic SC breakdowns can be found in previous releases.
Historic Errors
A few small errors have been identified in the historical data tables. They have been corrected in this release and the FYE 2020 release. Therefore, previous data tables should not be used.
The department’s policy statement describes how DWP will handle revisions.
J. Quality Management
Quality Assurance (QA) during development
The take-up estimates are based on several data sources, all of which have their own processes in place to ensure their quality. When producing the take-up estimates, all content has been independently quality assured by different members of the team to ensure the methodology is fit for purpose. All commentary in the publication is reviewed by the team and analysts from the relevant policy areas to ensure the information presented is accurate and meets user needs.
Routine Quality Assurance (QA)
Every SAS program:
- has its log checked to ensure no errors or warning messages are flagged when ran
- where updates to code are required before running, this is highlighted within the program with examples of how this should have been updated
- checks that code has been updated correctly, form part of the quality assurance of each section of the overall take-up process
Independent assessors
Quality Assurance (QA) is conducted by:
- members of the Surveys Branch team
- a specifically defined QA group, consisting of people within the Surveys team, and specific analysts from within DWP, who are experts on the benefits being measured within the final publication
K. Feedback
We welcome feedback
If you have any comments or questions, please contact: Joanne Burrage
Email: irb.takeup@dwp.gov.uk
L. Acknowledgements
Publication Lead: Joanne Burrage
Take-up Team: Aliyah Simjee, Sophie Rae, John Bilverstone, Violet Salway, Owusu Appiah
2. Statistical Processing
A. Introduction
To produce the take-up estimates, information can be taken from DWP administrative data sources to present the average number of those in receipt of the benefit along with the average amount claimed. However, because administrative benefit entitlement datasets do not exist, survey-based estimates of the population and unclaimed amounts of those who are entitled but not receiving are needed. These survey-based estimates come from the adjusted Policy Simulation Model (PSM) entitlement dataset.
The adjusted PSM entitlement dataset is created by firstly improving data quality using linked administrative data of the Family Resources Survey (FRS) matched cases. This involves data linking from FRS data to DWP administrative data records and then overwriting the modelled amounts in the adjusted PSM entitlement datasets, with the data linked amounts. 95% confidence intervals are also calculated for the average number of ENRs during the year and the average amounts unclaimed. The take-up estimates are then calculated by taking the number of people in receipt of benefits from the administrative data and dividing this by the total eligible population (that is the total number of people in receipt from the administration data plus the number of ENRs from the adjusted PSM).
The methodology used, aims to provide the best estimate based on the evidence available, using the FRS. At the same time, there are limitations with the methodology as there are known data issues in the FRS. More information can be found in the FRS background information and methodology.
This report presents the methodology which is strongly focused on using what evidence is available from administrative sources and the FRS, to produce the take-up estimates.
Flow chart of how take-up estimates are calculated

B. Source data
Overview
The take-up estimates are derived using information taken directly from several data sources. A small number of evidence-based adjustments are introduced where necessary.
The Work and Pensions Longitudinal Study (WPLS) is the data source for estimating receipt of Pension Credit (PC).
The Single Housing Benefit Extract (SHBE) is the data source used for Housing Benefit (HB) receipt.
ENR estimates are for private households only. In the production of the adjusted PSM entitlement dataset, benefit units are linked to their administrative records on the WPLS for estimating ENRs of PC, and SHBE for HB, to use actual amounts paid rather than modelled entitlement amounts.
Work and Pensions Longitudinal Study (WPLS)
The WPLS links DWP benefit and programme data on claimants with their employment records from HMRC.
The WPLS is used to produce receipt estimates for PC as it provides 100% DWP administrative records for all those receiving the benefits. The datasets are available quarterly.
The WPLS is also used to remove benefit units that are in non-private households in the receipt estimates for PC. This removal ensures the estimate of the average numbers receiving each benefit is consistent with the estimate of the average number of ENRs, which are for private households only.
Read more about the WPLS.
Family Resources Survey (FRS)
The FRS is an annual survey, collecting information on around 20,000 private households in the UK, although only GB information is used within this analysis. The primary function is to collect information on household income received from all sources, including wages and salaries, state benefits, payable Tax Credits, private (occupational and personal) pension schemes, and investments. The information allows analysis at an individual level, benefit unit level and household level. The survey is sponsored by the DWP.
As well as being the main data source for the PSM, information is taken directly from the FRS to identify reported receipt of the income-related benefits, where data linking was not possible.
Read more about the FRS annual survey.
Policy Simulation Model (PSM)
The DWP’s PSM is a static micro-simulation model of the UK tax and benefit system. It takes reported information from the FRS on benefit units and then simulates (or models) what the benefit unit might be entitled to based on the tax and benefit rules in the FRS year. The model estimates what a similar benefit unit, with those same characteristics, might be entitled to, for future financial years, accounting for the tax and benefit rules in that future year. The PSM is used extensively by DWP analysts for policy evaluation and costing of policy options.
The PSM is used in the derivation of the ENR estimates, as it provides a modelled entitlement dataset, for the survey year for the income-related benefits presented in this report. Some important adjustments are made to the entitlement dataset to provide more precise estimates of ENRs and their average weekly amounts unclaimed.
C. Data compilation & methodology
Estimating receipt
Overview
Receipt estimates of PC are taken from their data source and adjusted to represent private households only. Since HB is predominantly only available to private households, HB receipt is taken directly from the data source. Estimates of average amounts claimed are not adjusted as private households account for around 95% of all households receiving PC. It is assumed that the average amounts claimed remain representative of private households.
Pension Credit (PC)
The WPLS is used to estimate the average number of those receiving PC and average amounts claimed for the financial year, using data taken at the end of each quarter. Estimates are produced for the type of PC claimed (whether GC and/or SC) and by family type.
The WPLS is also used to remove benefit units that are in non-private households in the receipt estimates for PC. This removal ensures the estimate of the average numbers receiving each benefit is consistent with the estimate of the average number of ENRs, which are for private households only.
As the take-up receipt estimates for PC focus on private households only, these are lower than published DWP estimates, which include all households.
Housing Benefit (HB)
SHBE datasets from each month of the financial year, are combined and a 12-month average is estimated for the number of those receiving HB and average amounts of HB claimed. HB is predominantly only available to people living in private households.
For HB, the take-up receipt estimates for FYE 2013 onwards are similar to published DWP estimates. However, for FYE 2010, the take-up receipt estimates are slightly lower. For FYE 2010, bespoke SHBE datasets were produced for months April 2009 to November 2009, to capture the necessary information for breakdowns by family type, tenure type and employment status. These bespoke datasets were combined with the December 2009 to March 2010 datasets, and a 12-month average number of those receiving HB and average amounts of HB claimed, were estimated.
Data linking
The approach to data linking used in the production of the take-up statistics has evolved over time. For more information on the methods used in previous years, see the Income-related benefits: estimates of take up FYE 2020 Background, information and methodology.
To use administrative data to determine an FRS respondent’s true benefit status, we need their National Insurance number (NINO), which is the unique identifier that DWP uses to record a person’s information. The FRS does not directly record NINOs, so we must match the Personally Identifiable Information (PII) that is recorded on the FRS, to information held on the department’s Customer Information System (CIS).
We take a deterministic approach to matching FRS and CIS records. We use names, postcodes, and dates of birth (DOB), plus initials, postcode district, and DOB elements, to create 371 different potential matching combinations. We call these “match-keys”.
For each match-key we scan CIS records to find the number of records that are unique and divide that number by the total number of records, creating a “uniqueness” percentage.
The next stage is to find CIS matches for FRS respondents and extract their NINOs. We start by classing all FRS respondents as “unmatched”. We then search CIS for all records that match under the match-key with the high uniqueness percentage. We move down the match-keys by uniqueness, checking remaining unmatched respondents for matches under the next most unique key combination. At each stage, a match is only made if there is a single choice on CIS. We keep iterating through the match-keys until we either exhaust every match-key, hit a pre-set uniqueness threshold, or run out of FRS respondents. Every respondent with a uniqueness greater than or equal to 90% is initially classed as “matched”. We then check each match with a uniqueness greater than or equal to 90% and less than 99%, plus a selection of cases above 99%, for false positives. (A false positive match is where two records are linked together, but in reality they are not the same). False positives are then removed, and the matched NINOs are used to match to administrative data.
For FYE 2022 we matched 97% of respondents to their NINOs.
Estimating Entitled Non-Recipients (ENRs)
Overview
The DWP administrative data sources do not record information on those entitled to a benefit but not receiving it (ENRs). Therefore, a combination of an adjusted entitlement dataset from the DWP’s PSM, which includes some linking to WPLS, SHBE, RAPID, and UCFS administrative data, and reported receipt data from the FRS, are used to produce the average number of ENRs and average amounts unclaimed.
To produce the ENR estimates, some bespoke adjustments are made to the PSM entitlement dataset.
FRS matched cases are families where it was possible from the data provided to accurately match to administrative data.
For benefit units that were not able to be data linked, modelled PSM entitlement for the benefit is used.
Each benefit unit is categorised into one of the following groups:
- entitled non-recipients (ENRs)
- entitled recipients (ERs)
- non-entitled, non-recipients (NENRs)
From this, the average numbers of ENRs, and the average amounts unclaimed are estimated, along with 95% confidence intervals to reflect uncertainty. These estimates are combined with the receipt estimates to produce the lower bound, central, and upper bound take-up estimates.
It should be noted that, if existing, any ‘non-entitled recipients’ are assumed to be entitled to the benefits they get.
The PSM entitlement dataset
For each financial year, the PSM produces a UK-based entitlement dataset. Characteristics are taken from the FRS, and the PSM models entitlement to each of the income-related benefits by applying the tax and benefit system rules to each benefit unit. The dataset retains reported FRS characteristics such as family type, age, marital status, tenure type and employment status, but the modelled entitlement amount of income-related benefit is used, and this may differ from the reported FRS amount.
Where a benefit unit has one member above SPa and one member below (a mixed age couple), the PSM models entitlement to UC only. This is due to a policy change meaning that mixed age couples can only make new claims for UC from FYE 2020. If the mixed age couple is in receipt of PC then they are modelled as getting PC.
Adjusting the PSM entitlement dataset
The bespoke adjustments made to the PSM entitlement dataset are:
a) Data linking to DWP administrative receipt records for FRS matched cases
There is a known issue of under-reporting benefit receipt in the FRS. Therefore, to improve the accuracy of identifying the number of ENRs estimated in the PSM entitlement dataset, data linking allows recorded benefit amounts in DWP administrative data to replace reported FRS receipt or modelled PSM entitlement in the PSM entitlement dataset.
b) Inclusion of FRS reported Tax Credit repayment and reported receipt
The final adjustment made to the PSM entitlement dataset is to include some more information from the FRS:
- where there is reported repayment of overpaid Tax Credits, this information will be used to correct for these benefit units being modelled as entitled non recipients by the PSM
- where there is reported receipt of benefit, this information will be used along with PSM modelled entitlement to correct for benefit units modelled to be entitled but not receiving
c) Grossing-up to Great Britain (GB) control totals
Grossing-up is the term usually given to the process of applying factors to sample data so that they yield estimates for the overall population. The simplest grossing system would be a single factor, for example the number of households in the population divided by the number in the achieved sample of a survey. However, surveys are normally grossed by a more complex set of grossing factors that attempt to correct for differential non-response at the same time as they scale up sample estimates.
The bespoke grossing control variables, in addition to population grossing control variables, along with their breakdowns and data sources used to gross up the PSM entitlement dataset to the GB population are:
| Grossing Control Variable | Breakdowns Used | Data Source |
|---|---|---|
| Household numbers | Country and region | Housing statistics – Office for National Statistics (ONS) |
| Housing tenure (household level) | None – GB level only | Housing statistics – DLUHC, Welsh Government and National Records of Scotland |
| Council Tax bands (household level) | None – GB level only | Council Tax statistics – Valuation Office and Scottish Government |
| Employment (individual level) | Age and gender | Employment caseloads – Office for Budget Responsibility (OBR) using Labour Force Survey data |
| Caseloads for non-income related benefits (individual or benefit unit level) | Age and gender | Administrative data for Attendance Allowance (AA), Disability Living Allowance (DLA) and Personal Independence Payment (PIP), IB and SDA and Contributory ESA – DWP |
There are issues unique to using the PSM as a model to estimate entitlement that go beyond standard sample to grossing caveats. It is not possible to gross to entitlement figures because it is not known what these are. Therefore, we use a model to estimate them. It is known that benefit recipients are typically under-represented in the FRS. It is possible that ENRs are over or under-represented by large amounts and grossing cannot correct for this. This is an unknown, but the implicit assumption is that after grossing, ENRs are accurately represented.
Grossing to a total for chosen variables can also distort sub-population variables that are not grossed. It is possible that ENR totals are subject to this kind of distortion.
d) Exclusion of Northern Ireland benefit units
The take-up estimates are only provided for GB. Therefore, the UK-based PSM entitlement dataset is adjusted to remove any Northern Ireland benefit units, so that the average number of ENRs and average amounts unclaimed are on the same basis as the receipt estimates.
e) Removal of NMW and NLW adjustment
The PSM includes an adjustment for the NMW or NLW. This adjustment was not included in the PSM entitlement datasets used for the take-up statistics. No adjustment is made to the earnings data reported in the FRS.
Estimating ENRs
FRS matched cases who are shown to be receiving benefit according to the data linking to administrative data are automatically allocated to the ER group. FRS matched cases who are not receiving benefit according to the data linking to administrative data are classed as either ENRs or NENRs depending on whether they are modelled as entitled according to the PSM.
For benefit units that are unmatched, modelled PSM entitlement to the benefit is compared to FRS reported receipt of the benefit to determine whether they are an ER, ENR or NENR.
Finally, the average numbers of ENRs and the average amounts unclaimed are estimated by specific types and breakdowns for each income-related benefit. Due to small sample sizes for certain characteristics, further detailed breakdowns are not possible.
Uncertainty in the receipt and ENR Estimates
The receipt and ENR estimates are fully reliant on the accuracy of the data used and any subsequent adjustments, evidence-based assumptions, and modelling. Any errors in the data or these processes will affect uncertainty around the estimates.
Uncertainty in the receipt estimates is assumed to be marginal due to the processes in place to produce accurate DWP administrative data for publication as statistics.
For the ENR estimates, the level of uncertainty is higher as they are reliant on reported information from FRS sample data and the subsequent modelling of entitlement in the PSM. Therefore, the estimates are affected by known areas of uncertainty surrounding survey results and using a model to estimate ENRs. While processes are in place to limit this uncertainty, such as the data cleaning of FRS responses to produce the published FRS dataset and continuous development of the PSM methodology, confidence intervals are used to present the uncertainty in the final take-up estimates. Note that confidence intervals only estimate the sampling error, the difference between the sample and population values, and do not include other forms of uncertainty.
Accuracy & Reliability
a) Use of administrative data
It is assumed that DWP administrative data are an accurate record of benefit receipt. We accept all benefit recipients as being entitled with any ‘non-entitled recipients’ ignored for the purpose of this publication. However, the data are subject to error at all stages of the process of data collection: from recipients giving inaccurate information, to input error, to data cleaning and analysis.
b) Use of survey data
The size of the FRS sample and the way in which the sample is selected are carefully designed to ensure that it is representative of the UK, whilst bearing in mind practical considerations like time and cost constraints.
Survey results are always estimates, not precise figures. This means that they are subject to a level of uncertainty which can affect how changes, especially over the short term, should be interpreted.
The FRS is subject to the nuances of using a survey, including:
- the sampling error: Two different random samples from one population are unlikely to give the same survey results, which are likely to differ again from the results if the whole population was surveyed – this level of sampling error varies to a greater or lesser extent depending on the level of breakdowns at which results are presented
- the non-response error: The FRS response rate in FYE 2022 was 26% – to correct for differential non-response, estimates are weighted using population totals
- the survey coverage: The FRS covers private households in the UK, therefore, individuals in nursing or retirement homes, for example, will not be included - this means that figures relating to the most elderly individuals may not be representative of the UK population, as many of those at this age will have moved into homes where they can receive more frequent help
- the survey design: The FRS uses a clustered sample design to produce strong estimates at regional level - the FRS is therefore not suitable for analysis below this level
- the sample size: The FRS has a relatively large sample size for a household survey. From April 2011, the target achieved GB sample size for the FRS was reduced by 5,000 households, resulting in an overall achieved sample size for the UK of around 20,000 households for FYE 2012 onwards. However, due to coronavirus (COVID-19) pandemic, the sample size for the FRS in FYE 2021 was around 10,000 households, and subsequently estimates of take-up could not be produced for that financial year. For FYE 2022 the sample size increased to around 16,000 which has allowed for production of these estimates. However, this is still a smaller sample size than typical FRS years. Further details on the FRS sample can be found in the FRS background information and methodology.
c) Under-reporting receipt and benefit confusion in the FRS
There is a known issue of benefit under-reporting in the FRS. Sometimes the FRS respondents confuse which benefit they are receiving. For example, there is often confusion over State Pension and PC payments. A benefit unit may not realise they are receiving PC and report the overall payment they receive as SP. Therefore, there is an over-reporting of the SP amount paid and under-reporting of the PC amount paid. Processes are in place for the FRS interviewer to check these responses against other questions if there is a discrepancy. Further data-cleaning is conducted once the survey is filled in to check whether responses from the benefit unit taken across the questionnaire are consistent. However, even with these processes in place, there remains scope for uncertainty and remaining under-reporting of benefit receipt.
As a result, it is possible that the PSM categorises a benefit unit into the wrong group. In the example above, the benefit unit could be modelled as an ENR, despite receiving PC as they did not report receipt or give an amount in the FRS interview. In other situations, the benefit unit might not report important information which is used to identify which group they should be allocated to, such as receiving Attendance Allowance for the estimation of PC and HB entitlement.
To reduce under-reporting and benefit confusion, data linking allows recorded benefit amounts in DWP administrative data to replace reported FRS receipt or modelled PSM receipt in the PSM entitlement dataset. This was possible for 97% of FRS respondents in FYE 2022.
d) Unmatched cases
Where a benefit unit might have been modelled as an ENR using self-reported survey data but data linking indicated that they were receiving a payment, the benefit unit would be categorised as an ER and as a result the average numbers of ENRs would reduce. However, where benefit units are unmatched cases, it is possible for it to remain an ENR but still receive the benefit in reality.
The scale of this issue has reduced over time as we have been able increase the proportion of cases matched. Now this issue affects a small number of cases due to the high match rate.
e) Imperfect modelling of entitlement
Imperfect modelling of the tax and benefit system rules in the PSM could result in:
- over-statement of entitlement – this is where the benefit unit is incorrectly modelled to be entitled and or the modelled amount is too high
- under-statement of entitlement – this is where the benefit is incorrectly modelled to not be entitled and or the modelled amount is too low
If there is a linked amount in the administrative data then entitlement becomes the linked amount, not the modelled amount.
Processes are in place to regularly review and develop the modelling to ensure the PSM accurately represents the tax and benefit system rules for each year. However, as it is heavily reliant on reported information in the FRS, the PSM inherits the areas of uncertainty of the FRS.
f) Inaccurate grossing-up to the GB population
The PSM grossing method uses several control variables to ensure that various characteristics of the benefit units are considered in deriving the grossing factors. But it is another potential source of uncertainty as it does assume that many of the characteristics of the ENR sample are representative of all GB benefit units.
Confidence intervals for the ENR Estimates
Overview
As the ENR estimates are heavily reliant on the FRS sample, the level of uncertainty can be estimated by exploring how that estimate would change if many survey samples were drawn for the same time period instead of just one. From this, a range around the estimate can be defined, known as a confidence interval. This indicates how likely it is that the real value that the survey is trying to measure lies within that range. Confidence intervals are typically set up to be 95% certain that the true value lies within the range. This is known as a 95% confidence interval.
Estimates for the entire UK population are calculated using a sample of 16,000 households which are then scaled up. This leads to uncertainty in the figures. Confidence intervals are then used to show how much the estimate may differ from the true value. Bigger confidence intervals show less precise estimates and smaller confidence intervals show more precise estimates.
Info-graphic summarising the purpose of confidence intervals
Method
The ‘variance estimation based on sample design’ method was used to produce confidence intervals for the take-up estimates as:
- the sampling frame of the FRS is taken into consideration in this method
- it is appropriate when calculating the prevalence of a characteristic in a population, such as those entitled and not receiving
The ENR estimates are derived from the adjusted PSM entitlement dataset rather than the published FRS dataset. However, this should not affect the sampling error, as this occurs at the stage of the sampling, and therefore any modelling of FRS sample benefit units in the PSM should not affect the confidence intervals. The average numbers of ENRs, and the average amounts unclaimed are estimated, along with 95% confidence intervals to reflect uncertainty. These estimates are combined with the receipt estimates to produce the lower bound, central, and upper bound take-up estimates.
Estimating take-up rates
Overview
The take-up rates are based on the following definition:
- (In Receipt) ÷ (In Receipt + Entitled Not in Receipt)
Where the take-up rate is defined as the proportion receiving the benefit of all those entitled (that is those receiving the benefit they are entitled to and those who are entitled but not receiving the benefit).
A central estimate take-up rate is calculated using the central estimate of those entitled and not in receipt. The lower and upper take-up rate bounds are calculated using the upper and lower bound estimates of those entitled and not in receipt.
Caseload formulae
The formulae for lower bound, central estimate and upper bound are as follows.
| Caseload formula | |
|---|---|
| Lower Bound | Average number of benefit units receiving benefit ÷ (Average number of benefit units receiving benefit + Upper average number of ENR benefit units) |
| Central Estimate | Average number of benefit units receiving benefit ÷ (Average number of benefit units receiving benefit + Central average number of ENR benefit units) |
| Upper Bound | Average number of benefit units receiving benefit ÷ (Average number of benefit units receiving benefit + Lower average number of ENR benefit units) |
Expenditure formulae
For the expenditure formulae, the average weekly amounts claimed (received) and unclaimed (not received) are converted to yearly amounts.
The expenditure take-up formulae are as follows.
| Expenditure formula | |
|---|---|
| Lower Bound | Total amount of benefit received ÷ (Total amount of benefit received + Upper total amount of benefit not received) |
| Central Estimate | Total amount of benefit received ÷ (Total amount of benefit received + Central total amount of benefit not received) |
| Upper Bound | Total amount of benefit received ÷ (Total amount of benefit received + Lower total amount of benefit not received) |
The formulae for the total amount of benefit received and not received are as follows.
| Total amount of benefit received formula | Total amount of benefit not received formula | |
|---|---|---|
| Lower Bound | Average number of benefit units receiving benefit × Average amount of benefit received × Week to Year Factor | Upper total = Upper average number of benefit units ENRs × Upper average amount not received × Week to Year Factor |
| Central Estimate | Average number of benefit units receiving benefit × Average amount of benefit received × Week to Year Factor | Central total = Central average number of benefit unit ENRs × Central average amount not received × Week to Year Factor |
| Upper Bound | Average number of benefit units receiving benefit × Average amount of benefit received × Week to Year Factor | Lower total = Lower average number of benefit units + ENRs × Lower average amount not received × Week to Year Factor |
D. Glossary
This glossary gives a brief explanation for each of the key terms used in the Take-up Publication. Further details on these definitions, are available on request from the DWP Take-Up Team at: irb.takeup@dwp.gov.uk
Read the income and earnings glossary produced by the ONS.
Average
See Mean.
Benefit
Financial support from the government. Most of these benefits are administered by DWP. The major exceptions are Housing Benefit and Council Tax Reduction, which are administered by local authorities.
Benefit unit
A single adult or married or cohabiting couple, and any dependent children. Examples of Benefit units:
- pensioner couple: Benefit units where both partners are over SPa
- single male pensioner: Benefit units headed by a single male adult over SPa
- single female pensioner: Benefit units headed by a single female adult over SPa.
- couple with children: Benefit units containing two adults, headed by a non-pensioner, with dependent children
- couple without children: Benefit units containing two adults, headed by a non-pensioner, with no dependent children
- single with children: Benefit units containing a single adult (male or female), headed by a non-pensioner, with dependent children
- single without children: Benefit units containing a single adult (male or female), headed by a non-pensioner, with no dependent children
Confidence interval
A measure of sampling error. A confidence interval is a range around an estimate which states how likely it is that the real value that the survey is trying to measure lies within that range. A wider confidence interval indicates a greater uncertainty around the estimate. Generally, a smaller sample size will lead to estimates that have a wider confidence interval than estimates from larger sample sizes. This is because a smaller sample is less likely to reflect the characteristics of the total population and therefore there will be more uncertainty around the estimate derived from the sample. Note that a confidence interval ignores any systematic errors that may be present in the survey and analysis processes.
Claimant
A person making a claim for a benefit.
Entitled
A family is said to be entitled to receive a benefit if they satisfy the qualifying conditions for that benefit.
Entitlement
Entitlement is the amount an entitled family is estimated to be paid in benefit, according to the linked amount or modelling.
Entitled non-recipient (ENR)
A family that is modelled to be entitled to a benefit but is not receiving it is said to be an ENR.
Entitled recipient (ER)
A family that is modelled to be entitled to a benefit and is receiving it is said to be an ER.
Non-entitled non-recipient (NENR)
A family that is modelled to be not entitled to a benefit and is not receiving it is said to be an NENR.
Family
See Benefit unit.
Family Resources Survey (FRS)
The FRS is one of the largest cross-sectional household surveys in the country. Prior to FYE 2003 the survey covered GB; from FYE 2003 the survey was extended to cover the UK. From April 2011, the target achieved UK sample size for the FRS was reduced by 5,000 households from 25,000 to 20,000 households a year. The FRS sample size and composition was affected by the coronavirus (COVID-19) pandemic in FYE 2021 and FYE 2022. In FYE 2021 the sample size was around 10,000 households and subsequently take-up statistics could not be produced. For FYE 2022, the sample size rose to around 16,000.
Household
One person living alone or a group of people (not necessarily related) living at the same address who share cooking facilities and share a living room or sitting room or dining area. A household consists of one or more benefit units.
Income-related benefit
Benefits where a potential claimant’s income is considered when deciding whether they are entitled to the benefit.
Jobseeker’s Allowance
A working-age benefit that is paid to help people while they look for work.
Local Housing Allowance
Used to calculate Housing Benefit for tenants in the private rented sector.
Mean
The mean weekly amount claimed or unclaimed, is the average, found by adding up the amount for each benefit unit in a population and dividing the result by the total number of benefit units.
Means-tested benefits
See Income-related benefit
Median
The median weekly unclaimed amount is the value that divides the population of entitled non-recipients, when ranked by their modelled entitlements, into two equal-sized groups. In other words, the median is the exact middle point where half the entitled non-recipients have larger unclaimed amounts and half have smaller unclaimed amounts.
Minimum Income Guarantee
A system of social welfare provision that guarantees that all citizens or families have an income sufficient to live on, provided they meet certain conditions.
Mixed age couple
A couple where one member is above SPa and the other is below.
National Living Wage
The minimum wage for workers aged 25 and over.
National Minimum Wage
The minimum wage for workers ages 16 to 24.
Non-dependant deductions
A reduction in Housing Benefit when an adult friend or family member lives with the claimant.
Non-means tested benefits
Benefits where a potential claimant’s income is not considered when deciding whether they are entitled to the benefit.
Percentile
A measure indicating the value below which a given percentage of observations in a group of observations falls.
Private Rented Sector
Properties being rented which are owned by a landlord.
Sampling error
The uncertainty in the estimates which arises from taking a random sample of the household population. The likely size of this error for a particular statistic can be identified and expressed as a confidence interval.
Social Rented Sector
Properties being rented which are owned by the local council or a housing association (not-for-profit organisations that own, let, and manage rented housing).
Spare Room Subsidy
A reduction in Housing Benefit when the recipient lives in a property in the social rented sector that is deemed to have at least one spare bedroom.
State Pension
State Pension is a payment made to qualifying individuals who have reached SPa. A new single-tier State Pension launched on 6 April 2016 for people who reach SPa on or after April 2016, to replace the previous system. This consolidated the basic State Pension and Additional State Pension into one single amount. People who reached SPa before 6 April 2016 continue to receive the basic State Pension and Additional State Pension if eligible. Read more information on the State Pension.
State Pension age (SPa)
SPa is the earliest age you can start receiving your State Pension. For FYE 2022 data, individuals are defined to be of SPa based on their date of birth and the date of interview. Since 6 April 2010, the SPa has been gradually increasing. The FRS data contained in this report were collected throughout the FYE 2022, during which the SPa for pensioners remained at 66 years, the same as FYE 2021. Proposed increases to the SPa are expected to be phased in between 2026 and 2028, bringing the SPa up to 67 years.
A breakdown of the increases can be seen in the SPa timetables and details of planned changes to SPa have been published. Read further guidance on calculating State Pension eligibility age.
Statistical significance
This is a technical concept that says whether a reported change is likely to have arisen only by chance due to variations in the sampling.
Support for Mortgage Interest
A loan to provide help on paying interest on mortgages or interest on other loans for home purchase, repair, and improvements. To qualify for a Support for Mortgage Interest loan one of the following benefits must be received:
- Income Support (IS)
- Income-based Jobseeker’s Allowance (JSA)
- Income-related Employment and Support Allowance (ESA)
- Universal Credit (UC)
- Pension Credit (PC)
Tax Credits
Working Tax Credits (WTC) and Child Tax Credits (CTC) are paid by HMRC. By the end of 2024, Tax Credits will be replaced by Universal Credit (UC). Read more information on Tax Credits.
Tenant
A person who rents a property in the social rented sector or private rented sector.
Triple lock
The basic State Pension and the new State Pension increases every year by whichever is the highest of the following:
- earnings – the average percentage growth in wages (in GB)
- prices – the percentage growth in prices in the UK as measured by the Consumer Prices Index (CPI)
- 2.5%
In FYE 2022, the increase was 2.5%.
Working-age benefit
A benefit paid to a working-age person.
Working-age person
A person aged between 16 years and SPa.
Universal Credit (UC)
A working-age benefit for those in or out of work. This benefit is replacing the following six benefits:
- Housing Benefit (HB)
- Child Tax Credit (CTC)
- Income Support (IS)
- Working Tax Credit (WTC)
- Income-based Jobseeker’s Allowance (IB JSA)
- Income-related Employment and Support Allowance (IR ESA)
Note, our statistical practice is regulated by the Office for Statistics Regulation (OSR).