Income Dynamics: background information and methodology
Updated 26 August 2021

© Crown copyright 2021
This publication is licensed under the terms of the Open Government Licence v3.0 except where otherwise stated. To view this licence, visit nationalarchives.gov.uk/doc/open-government-licence/version/3 or write to the Information Policy Team, The National Archives, Kew, London TW9 4DU, or email: psi@nationalarchives.gov.uk.
Where we have identified any third party copyright information you will need to obtain permission from the copyright holders concerned.
This publication is available at https://www.gov.uk/government/statistics/income-dynamics-2010-to-2019/income-dynamics-background-information-and-methodology
Income Dynamics (ID) presents information on changes in income over time. It presents findings on persistent low income. Individuals are in persistent low income if they are in relative low income for at least three out of four consecutive annual interviews. Analysis of entries into and exits from low income is also included, as well as individual movements within the overall income distribution over time.
1. Introduction
Context
Income Dynamics (ID) contains analysis of income movements and the persistence of low income for various population groups. Reporting on the percentage of children in the United Kingdom who live in households whose income has been less than 60% of median equivalised net household income, in at least three of the last four survey periods, is required under section 4 of the Welfare Reform and Work Act 2016, and, regarding Scotland, the Child Poverty (Scotland) Act 2017. Definitions for relevant key terms in these Acts are consistent with those given in the Glossary of this document. Data for reporting against the other three measures are available in the Households Below Average Income (HBAI) publication.
The Department for Work and Pensions’ (DWP) responsibilities include understanding and dealing with the causes of poverty rather than its symptoms, encouraging people to work and making work pay, encouraging disabled people and those with ill health to work and be independent, and providing a decent income for people of pension age and promoting saving for retirement. The extent of progress towards these responsibilities will affect these statistics.
Key strengths and purpose of the statistics
This is the fifth publication of this statistical series, complementing the HBAI series. While HBAI remains the best source of cross-sectional low income statistics, ID provides a longitudinal perspective on low income statistics. It fills a key gap that emerges if low income statistics are only considered on a cross-sectional basis.
By looking at low income longitudinally, we can look at durations of low income for different groups and what characteristics are associated with longer spells of low income. Longitudinal analysis also allows us to track how many individuals – and which individuals - enter and exit low income, and to calculate entry and exit rates. New analysis has been developed for this fifth release which explores the events associated with low income entry and exit.
Potential users include:
- policy and analytical teams within the DWP
- the Devolved Administrations and other government departments
- local authorities
- Parliament
- Academics
- journalists
- and the voluntary sector
Status of these statistics and changes for this publication
ID was initially released as Experimental Statistics. ID was labelled Official Statistics for the ID 2010 to 2018 publication published in March 2020.
A number of changes have been made for this 2010 to 2019 publication:
- existing analysis on low income entry and exit rates before housing costs (BHC) has been extended to also include after housing costs rates
- as noted above, ID 2010 to 2019 also includes new analysis on the events associated with low income entry and exit
- a change has been made to the age variable used in this analysis, and also to the way in which pensioner status is derived
- a change has been made to the classification of Gypsy or Irish Travellers resident in Northern Ireland, in line with Government Statistical Service standards
More information on these changes can be found in Section 3
Revision of the statistics
ID uses data produced by the longitudinal survey, Understanding Society (USoc), run by the University of Essex. Since the first ID release, DWP have worked with the University of Essex to improve the quality of the derivation of incomes, and therefore these statistics have been subject to revisions beyond those that occur routinely in longitudinal data analysis. In particular, the derivation of housing costs was improved to bring the after housing cost (AHC) analysis into line with HBAI e.g. only mortgage interest payments (not capital repayments) are included when deriving owner-occupier housing costs. This change was implemented for ID from 2010 to 2017, published in March 2019.
Figures presented in this publication are subject to future revisions because changes are made by the data providers. New information can be collected from respondents which affects their data in earlier years. Please refer to the USoc user guide for more information.
We will continue to work with the University of Essex to improve data quality where possible.
2. Source of the statistics
As noted above, these statistics are derived from the Understanding Society (USoc) survey. USoc is an initiative funded by the Economic and Social Research Council and various Government Departments, with scientific leadership by the Institute for Social and Economic Research, University of Essex, and survey delivery by NatCen Social Research and Kantar Public. The research data are distributed by the UK Data Service.
We have used the following dataset which was released in November 2020:
- University of Essex, Institute for Social and Economic Research. (2020). Understanding Society: Waves 1-10, 2009-2019 and Harmonised BHPS: Waves 1-18, 1991-2009: Special Licence Access. [data collection]. 12th Edition. UK Data Service. SN: 6931, http://doi.org/10.5255/UKDA-SN-6931-11
We have also referred to the Understanding Society Main Survey User Guide (Waves 1-10) in conducting this analysis.
We would like to thank Dr Paul Fisher at the University of Essex for his advice and assistance, particularly with regard to developing the analysis new for the 2010 to 2019 release on events associated with low income entry and exit.
DWP bears sole responsibility for the analysis or interpretation presented here.
Population
USoc covers the United Kingdom. Individuals in households recruited at the first round of data collection are visited each year to collect information on changes to their household and individual circumstances. USoc interviews were initially typically carried out face-to-face in respondents’ homes. Mixed mode data collection introduced in Wave 8 (2016 to 2017) has resulted in increasing numbers of interviews being completed online.
Household members aged 16 or older are interviewed and the same individuals are re-interviewed in successive years to see how things have changed. Individuals become eligible for a full interview once they reach the age of 16.
The USoc sample
The USoc main sample is made of 4 subsamples:
| Subsample | Explanation |
|---|---|
| General Population Sample (GPS) | This is the largest part of the survey. The England, Scotland and Wales sample in this data release is based upon an initial sample of 47,520 addresses. In Northern Ireland, 2,395 addresses were selected in a single stage from the list of domestic addresses. |
| Ethnic Minority Boost Sample (EMBS) | The EMBS was designed to provide at least 1,000 adults from each of five groups: Indian, Pakistani, Bangladeshi, Caribbean, and African based on sampling postal sectors with relatively high proportions of relevant ethnic minority groups, based upon 2001 Census data and more recent Annual Population Survey data. |
| British Household Panel Survey (BHPS) cases. | The sample issued for wave 2 (2010 to 2011) consisted of all members from the BHPS sample who were still active at Wave 18 of the BHPS and who had not refused consent to be included as part of the USoc sample. It should be noted that the BHPS sample contains different subsamples, including the original sample (first selected in 1991), boost samples in Scotland and Wales (first selected in 1999), and a Northern Ireland sample (selected in 2001). |
| Immigrant and Ethnic Minority Boost (IEMB) | This sample was introduced at Wave 6, and is not included in this analysis. It includes people who were born outside the United Kingdom (“immigrants”) and members of five ethnic minority groups: Indian, Pakistani, Bangladeshi, Caribbean, and African. |
Survey periods
USoc fieldwork is conducted over a two-calendar-year period, with each individual being interviewed on a yearly basis. Note that the periods of waves overlap, and that individual respondents are interviewed around the same time each year on an annual basis.
For the purposes of this publication, persistent low income analysis is analysed on the basis of ‘rolling’ four-survey period datasets.
For example, the period 2010 to 2014 uses individuals present in all of the following four waves, 2010 to 2011, 2011 to 2012, 2012 to 2013 and 2013 to 2014, together with all children born to original sample members (see below for definition) before their 2010 to 2011 interview. We do not publish the dataset used to produce ID statistics. Please contact us if you require further information about how we process and analyse USoc data.
USoc survey waves and samples
| Survey Wave | Calendar Year | Sample Used |
|---|---|---|
| Wave 1 | 2009 to 2010 | GPS and EMBS |
| Wave 2 | 2010 to 2011 | BHPS, GPS and EMBS |
| Wave 3 | 2011 to 2012 | BHPS, GPS and EMBS |
| Wave 4 | 2012 to 2013 | BHPS, GPS and EMBS |
| Wave 5 | 2013 to 2014 | BHPS, GPS and EMBS |
| Wave 6 | 2014 to 2015 | BHPS, GPS, EMBS and IEMB |
| Wave 7 | 2015 to 2016 | BHPS, GPS, EMBS and IEMB |
| Wave 8 | 2016 to 2017 | BHPS, GPS, EMBS and IEMB |
| Wave 9 | 2017 to 2018 | BHPS, GPS, EMBS and IEMB |
| Wave 10 | 2018 to 2019 | BHPS, GPS, EMBS and IEMB |
Wave 1 ran in 2009 and 2010 and used the GPS and EMBS sample.
Wave 2 (2010 and 2011), Wave 3 (2011 and 2012), Wave 4 (2012 and 2013) and Wave 5 (2013 and 2014) all used the BHPS, GPS and EMBS sample.
Wave 6 (2014 and 2015) used the BHPS, GPS, EMBS samples and also the IEMB sample, which was introduced in that wave. Wave 7 (2015 and 2016), Wave 8 (2016 and 2017), Wave 9 (2017 and 2018) and Wave 10 (2018 and 2019) all used the same samples as Wave 6.
Sample status and following rules
There are 3 possible sample statuses:
1. Original Sample Members (OSMs)
All members of USoc GPS households enumerated at Wave 1 - including absent household members and those living in institutions who would otherwise be resident - are Original Sample Members (OSMs). All ethnic minority members of an enumerated household eligible for inclusion in the EMBS are OSMs. Any child born to an OSM mother after Wave 1 and observed to be co-resident with the mother at the survey wave following the child’s birth is an OSM. In the former BHPS sample, OSMs are those who were enumerated at the first wave of the sample from which they come (Wave 1 for the original sample, Wave 9 for the Scotland and Wales boost samples, Wave 11 for Northern Ireland) or who were subsequently born to an OSM mother or father (or both). Following the incorporation into USoc from Wave 2 onward, for those in the former BHPS sample, as for all other USoc samples, only children born to an OSM mother will themselves become an OSM.
OSMs, of all ages, are followed for interview and remain eligible as long as they are resident within the UK. They remain potentially eligible sample members for the life of the survey. The case may arise where the only OSM in the household is a child. Other household members are then Temporary Sample Members (see below) so long as they are co-resident with the child, and therefore eligible for interview, even if the child is not yet old enough to be eligible for interview. If the OSM child moves house, they are followed to their new address and those living with the OSM child are eligible for interview. If the OSM child moves into an institution, where normally just the OSM/PSM would be interviewed and not co-residents, a split-off household is created containing only the OSM child and the household enumeration grid completed. The child OSM is an eligible sample member, even if they are not eligible for interview because of their age.
2. Temporary Sample Members (TSMs)
Any members of an enumerated household eligible for inclusion in the EMBS at Wave 1 who are not from a qualifying ethnic minority are Temporary Sample Members (TSMs) at Wave 1. This was the only category of TSM at Wave 1. In all parts of the sample, any new person found to be co-resident in an OSM or PSM household after Wave 1 is a TSM. This would include any child born to an OSM father after Wave 1 but not an OSM mother and observed to be co-resident with the father (or any other OSM) at the survey wave following the child’s birth. TSMs remain eligible for interview as long as co-resident in an OSM/PSM household. TSMs who are not co-resident in an OSM/PSM household are not followed and become ineligible for interview. TSMs are identified as re-joiners if they are subsequently found in an OSM/PSM household and then become eligible for interview.
3. Permanent Sample Members (PSMs)
Any TSM father of an OSM child born after Wave 1 and observed to be co-resident with the child at the survey wave following the child’s birth is a PSM. PSMs remain potentially eligible for interview for the life of the survey.
Only OSMs have positive longitudinal weights, and they form the basis of the analysis included here. Account is also taken of the inevitable changes of address or location that some interviewees experience; as noted above the survey follows OSMs if they move to a new household. This is to ensure that the household or family history is not lost, and that there is no significant fall off in interview numbers.
For further information on the survey, see the USoc homepage, especially the Main Survey User Guide (Waves 1-10).
Sample sizes and attrition
As with most longitudinal surveys, attrition reduces the USoc sample size over time. See Table M.1 below which shows how many individuals are available for analysis in each wave. These are original sample member cases with positive longitudinal weights except where noted.
Table M.1: single-year cases available for analysis
| Wave | GPS + EMBS cases | BHPS cases | All cases |
|---|---|---|---|
| 2009-2010 (not used - see limitations section) | 76,209 | Not included | 76,209 |
| 2010-2011 (cross-sectional weights) | 60,914 | 15,493 | 76,407 |
| 2011-2012 | 48,878 | 11,549 | 60,427 |
| 2012-2013 | 43,108 | 10,378 | 53,486 |
| 2013-2014 | 39,117 | 9,494 | 48,611 |
| 2014-2015 | 34,180 | 8,512 | 42,692 |
| 2015-2016 | 30,701 | 7,740 | 38,441 |
| 2016-2017 | 28,063 | 7,171 | 35,234 |
| 2017-2018 | 25,457 | 6,718 | 32,175 |
| 2018-2019 | 23,564 | 6,275 | 29,839 |
Source: Understanding society 2010 to 2019
Persistent low income analysis in ID is based on individuals with positive longitudinal weights in the final wave being considered, meaning they are OSMs, and include individuals who were previously BHPS sample members. Any individuals who are not in the survey for all four relevant waves are excluded.
Table M.2: Four-wave cases available for analysis
| Wave | All cases | New-born children present for fewer than four waves | Cases available for analysis |
|---|---|---|---|
| 2010-2011 to 2013-2014 | 48,611 | 1,537 | 47,074 |
| 2011-2012 to 2014-2015 | 42,692 | 1,190 | 41,502 |
| 2012-2013 to 2015-2016 | 38,441 | 966 | 37,475 |
| 2013-2014 to 2016-2017 | 35,234 | 775 | 34,459 |
| 2014-2015 to 2017-2018 | 32,175 | 661 | 31,514 |
| 2015-2016 to 2018-2019 | 29,839 | 537 | 29,302 |
Source: Understanding Society 2010 to 2019
Missing information
As well as attrition reducing the sample size, some of the variables used in analysis for ID have missing values. We exclude individuals with missing data from relevant analysis, but include individuals whenever we can. For instance, we might know that an adult has an illness or disability but do not have information on whether it is limiting (see below). In such a case, the individual will be included in the illness or disability category, but will not be included in the further analysis looking at whether the illness or disability is limiting.
Table M.3 below shows the extent of missing data for the longitudinal analysis of incomes for individuals in each four-wave sample. The most common reason for not having income information is having individual responses but no household questionnaire. As shown in Table M.3, the percentage of individuals for whom this is the case has risen since the start of the survey, with a noticeable increase in the period 2014 to 2015 and 2017 to 2018. A change in fieldwork procedures, and in particular the introduction of mixed mode data collection (online reporting) from Wave 8 (2016 to 2017), led to an increase in households not completing household questionnaires. For further information, see the Understanding Society Main Survey User Guide (Waves 1-10).
Other reasons for missing income data include missing equivalisation factors and missing interview dates (which means we are unable to deflate incomes). Improvements to the imputation of housing costs means that the number of cases with missing AHC incomes is the same as those with missing BHC incomes. As noted above, this change was brought about for the ID 2010 to 2017 publication, released in March 2019.
Table M.3: Cases used for income analysis
| Wave | Missing equivalised BHC income | Missing equivalised AHC income |
|---|---|---|
| 2010-2011 to 2013-2014 | 29 cases (<1%) out of 47,074 | 29 cases (<1%) out of 47,074 |
| 2011-2012 to 2014-2015 | 779 cases (2%) out of 41,502 | 779 cases (2%) out of 41,502 |
| 2012-2013 to 2015-2016 | 969 cases (3%) out of 37,475 | 969 cases (3%) out of 37,475 |
| 2013-2014 to 2016-2017 | 1,440 cases (4%) out of 34,459 | 1,440 cases (4%) out of 34,459 |
| 2014-2015 to 2017-2018 | 2,169 cases (7%) out of 31,514 | 2,169 cases (7%) out of 31,514 |
| 2015-2016 to 2018-2019 | 2,143 cases (7%) out of 29,302 | 2,143 cases (7%) out of 29,302 |
Source: Understanding Society 2010 to 2019
Table M.4 in the 2010 to 2019 ID methodology tables shows the extent that information is missing for classificatory variables. In many cases less than 1% of cases have missing values. For highest qualification, only those completing an individual questionnaire are included, so non-responding individuals in partially responding households will have missing values for this variable. For highest qualification, there is also a known issue in feeding forward information collected on the BHPS (i.e. pre-populating the question with what the respondent said previously) or asking individuals turning 16 about their qualifications.
Prior to Wave 7 (2015 to 2016), whether a long-standing illness or disability was limiting was not asked of proxy respondents (i.e. where someone else answers interview questions on behalf of another individual). In Wave 7, this information was asked about in proxy interviews, resulting in a decrease in the amount of missing data for this variable in the four-wave period starting in 2015 to 2016. See USoc survey documentation for further details.
In ID 2010 to 2018 we noted that in the four-wave period (between 2014 to 2015 and 2017 to 2018), there was an increase in the proportion of missing values for the ID derived variable which identifies whether an individual was up to date with their bills. This measure is derived from three USoc variables, one of which (‘problems paying council tax’) saw an increase in the amount of missing data in Wave 6 (2014 to 2015). In Wave 7 (2015 to 2016), the amount of missing data for this variable decreased. As a result, in our most recent four-wave period (between 2015 to 2016 and 2018 to 2019), the amount of missing data for the ID derived variable has also decreased back to levels observed during previous four-wave periods. The increase in Wave 6 may have been linked to an increase in the proportion of individuals not completing a household questionnaire (as documented above), although Wave 6 preceded the introduction of mixed mode data collection. It may also have been related to an increase in item non-response. See ‘Understanding Society and its income data’ for further discussion regarding this.
Weighting
Weights have been applied which take the combined GPS, EMBS and BHPS samples, adjusting for unequal selection probabilities, differential non-response, and potential sampling error. This adjusts for the higher sampling fraction in the Devolved Administrations and for different probabilities of selection in the EMBS, as well as for response rate differences between subgroups of the sample. USoc produces weighting factors rather than grossing factors, so we do not produce estimates of numbers of individuals in low income. Instead we focus on percentages of the population.
3. Measures used ID analysis
ID includes analysis based on low income as well as analysis on movements within the overall income distribution. This section sets out how income measures are calculated in ID.
How is income measured
The income measure used in ID is total weekly net (disposable) equivalised household income. This comprises total income from all sources after tax, national insurance and other deductions in the latest period before the interview. It comprises income from all household members, including dependants.
Income includes the following:
| Term | Definition |
|---|---|
| Labour income | Includes usual pay and self-employment earnings. This also includes income from second jobs. |
| Miscellaneous income | Includes educational grants, payments from family members and any other regular payment. |
| Private benefit income | Includes trade union/friendly society payments, maintenance or alimony and sickness or accident insurance. |
| Investment income | Includes private pensions/annuities, rents received, income from savings and investments. |
| Pension income | Includes occupational pensions income |
| State support | Include tax credits and all state benefits, including State Pension. |
Income is net of the following items:
- income tax payments
- National Insurance contributions
- Pension contributions
- council tax (note domestic rates in Northern Ireland are not deducted)
Income After Housing Costs (AHC) is derived by deducting housing costs from the above income measure.
Housing costs
Housing costs in ID include the following:
- rent (gross of housing benefit)
- water rates, community water charges and council water charges
- mortgage interest payments (net of tax relief)
- ground rent and service charges
In the case of renters, these housing costs will include service and water charges because this is how the information is requested on the USoc questionnaire. For owner-occupiers, these amounts will not be included.
The main difference between HBAI and ID in terms of housing costs data is that, for owner-occupiers, HBAI includes structural insurance payments, whereas ID does not: no information is collected on structural insurance payments in USoc.
For Northern Ireland households, water provision is funded from taxation and there are no direct water charges. Therefore, it is already taken into account in the Before Housing Costs measure.
Missing income information is imputed in the USoc dataset. See Main Survey User Guide (Waves 1-10) and ‘Understanding Society and its income data’ for more detail on the procedures used.
Incomes are adjusted for inflation so they are in real terms corresponding to the middle January of the latest USoc wave (for 2015 to 2019 analysis, January 2019 is used). Like HBAI, ID uses a bespoke variant of the Consumer Price Index (CPI) to adjust for inflation to look at how incomes are changing over time in real terms. After the HBAI Financial Year Ending (FYE) 2018 publication, the Office for National Statistics (ONS) made some very minor revisions to this index. Because the effect of these revisions on low income measures was negligible, no revisions were made to the deflators used by HBAI in their series, and ID followed the same approach. See the following ONS update for more details.
Equivalisation
An adjustment called ‘equivalisation’ is made to income to make it comparable across households of different size and composition. ID uses net disposable weekly household income, after adjusting for the household size and composition, as an assessment for material living standards - the level of consumption of goods and services that people could attain given the net income of the household in which they live. In order to allow comparisons of the living standards of different types of households, income is adjusted to take into account variations in the size and composition of the households in a process known as equivalisation. ID assumes that all individuals in the household benefit equally from the combined income of the household. Thus, all members of any one household will appear at the same point in the income distribution.
How household income is equivalised
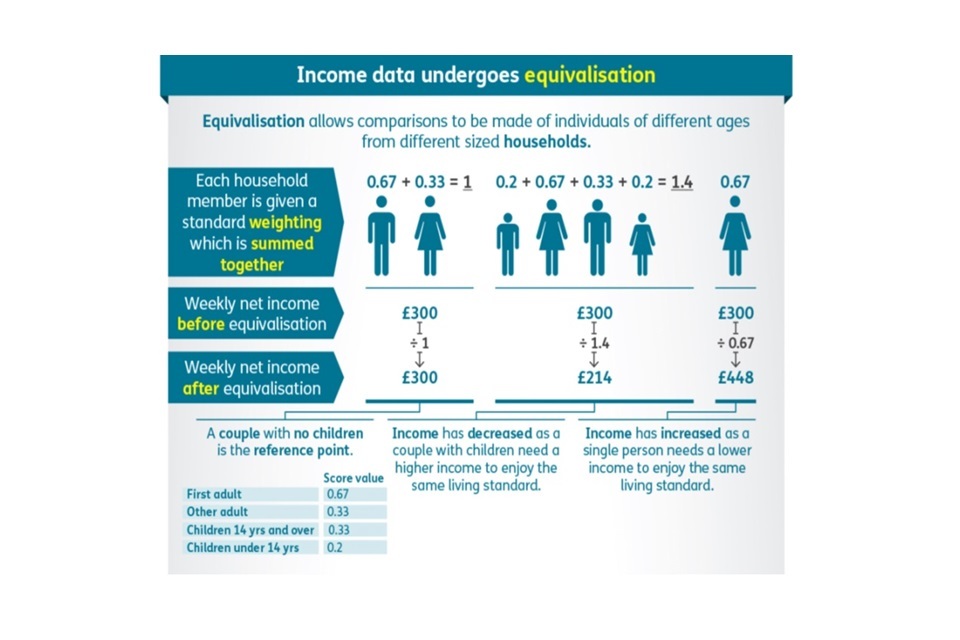
Equivalence scales conventionally take an adult couple without children as the reference point, with an equivalence value of one. The process then increases relatively the income of single person households (since their incomes are divided by a value of less than one) and reduces relatively the incomes of households with three or more persons, which have an equivalence value of greater than one.
The main equivalence scales used in ID are the modified OECD scales, which take the values shown in Table M.5 below. These are in line with those used in HBAI and in EU low income statistics. The equivalent values used by the McClements equivalence scales are also shown for comparison alongside modified OECD values. The McClements scales were used for the main estimates in the predecessor Low Income Dynamics publication with results based on the modified OECD equivalence scales published in an Appendix. In the modified OECD and McClements versions two separate scales are used, one for income BHC and one for income AHC.
Table M.5: Comparison of modified OECD and McClements equivalence scales
| Equivalence scales | ||||
|---|---|---|---|---|
| Modified OECD to equivalise BHC results rescaled to couple without children=1 [1] | OECD ‘companion’ Scale to equivalise AHC results | McClements BHC | McClements AHC | |
| First Adult | 0.67 | 0.58 | 0.61 | 0.55 |
| Spouse | 0.33 | 0.42 | 0.39 | 0.45 |
| Other Second Adult [2] | 0.33 | 0.42 | 0.46 | 0.45 |
| Third Adult | 0.33 | 0.42 | 0.42 | 0.45 |
| Subsequent Adults | 0.33 | 0.42 | 0.36 | 0.40 |
| Children aged under 14yrs [3] | 0.20 | 0.20 | 0.20 | 0.20 |
| Children aged 14yrs and over [3] | 0.33 | 0.42 | 0.32 | 0.34 |
Notes:
[1] Presented here to two decimal places.
[2] For the McClements scale, the weight for ‘Other second adult’ is used in place of the weight for ‘Spouse’ when two adults living in a household are sharing accommodation, but are not living as a couple. ‘Third adult’ and ‘Subsequent adult’ weights are used for the remaining adults in the household as appropriate. In contrast to the McClements scales, apart from for the first adult, the OECD scales do not differentiate for subsequent adults.
[3] The McClements scale varies by age within these groups; appropriate average values are shown in the table.
The construction of household equivalence values from these scales is quite straightforward. Consider a single person, a couple with no children, and a couple with two children aged twelve and ten, all having unadjusted weekly household incomes of £300 (BHC). The process of equivalisation, as conducted in ID, gives an equivalised income of £448 to the single person, £300 to the couple with no children, but only £214 to the couple with children.
How the low-income threshold is calculated
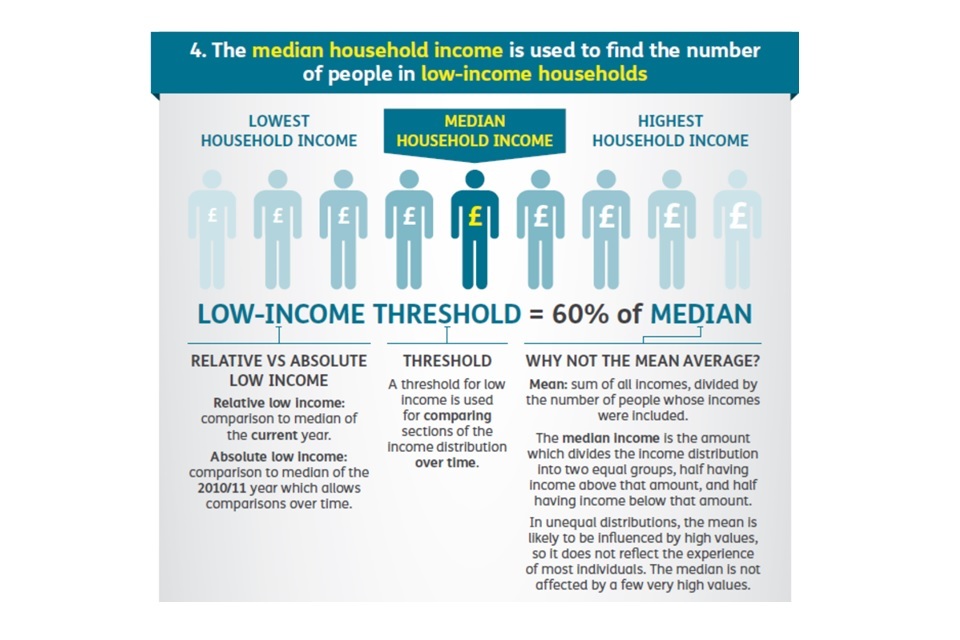
Relative low income sets the threshold as a proportion of the median income. The amount therefore changes each year as median income moves. It is used to measure the number and proportion of individuals who have incomes at a certain level below the median.
Changes in the rates of relative low income can be driven by changes in single year relative low income estimates or by individuals spending a longer or shorter time in relative low income.
The percentage of individuals in relative low income will increase if:
- the average income stays the same, or rises, and individuals with the lowest incomes see their income fall, or rise less, than average income; or
- the average income falls and individuals with the lowest incomes see their income fall more than the average income
The percentage of individuals in relative low income will decrease if:
- the average income stays the same, or rises, and individuals with the lowest incomes see their income rise more than average income; or
- the average income falls and individuals with the lowest incomes see their income rise, or fall less, than average income, or see no change in their income
Measuring Income Before and After Housing Costs
Before Housing Costs (BHC) measures allow an assessment of the relative standard of living of those individuals who were actually benefiting from a better quality of housing by paying more for better accommodation. On this basis, income growth over time incorporates improvements in living standards where higher costs reflected improvements in the quality of housing.
After Housing Costs (AHC) measures allow an assessment of living standards of individuals whose housing costs are high relative to the quality of their accommodation. Income growth over time may also overstate improvements in living standards for low income groups, as a rise in Housing Benefit to offset higher rents (for a given quality of accommodation) would be counted as an income rise.
For completeness, ID presents analyses on both a BHC and AHC basis. This is principally to take into account variations in housing costs that themselves do not correspond to comparable variations in the quality of housing.
Households and benefit units
ID presents information on an individual’s household income by various household and benefit unit (family) characteristics. There are important differences between households and benefit units.
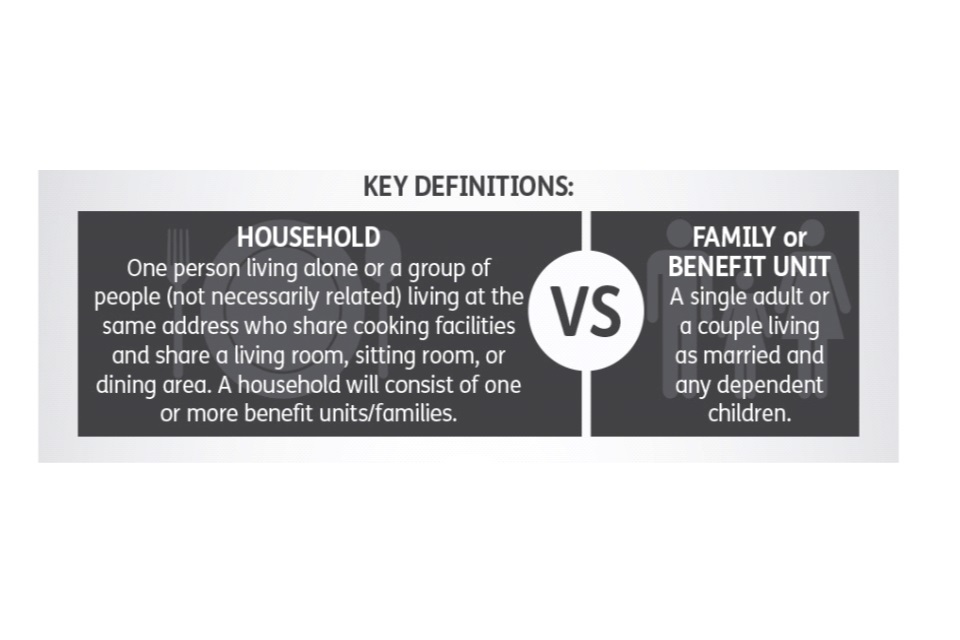
A household is one person living alone or a group of people (not necessarily related) who either share living accommodation OR share one meal a day and who have the address as their only or main residence. A household will consist of one or more benefit units, which are single adults or a married or cohabiting couple and any dependent children. For example, a group of students with a shared living room would be counted as a single household even if they did not eat together, but a group of bed-sits at the same address would not be counted as a single household because they do not share living space or eat together.
A husband and wife living with their young children and an elderly parent would be one household but two benefit units. The husband, wife and children would constitute one benefit unit and the elderly parent would constitute another. It should be noted that the term ‘benefit unit’ is used as a description of groups of individuals regardless of whether they are in receipt of any benefits or tax credits. A household will consist of one or more benefit units, which in turn will consist of one or more individuals (adults and children).
Income measurements used in ID
Relative low income
There are a range of ways in which low income can be defined. ID uses a measure of relative low income. Relative low income measurements identify which individuals have income which falls below a certain threshold based upon the range of incomes in the population. In ID, we concentrate on individuals with household incomes below 60% of median income. Information on those with household incomes below 70% of the median income is available in the detailed tables published alongside this release.
Persistent low income
An individual is classified as being in persistent low income if they live in a household in relative low income for at least three of their last four consecutive interviews. It is therefore possible that some of those classed as being in persistent low income were not in relative low income at the time of their most recent interview. However, they will have experienced low income in each of the previous three years and, as a result, their long-term living standards are not anticipated to be different to other individuals in persistent low income who were in low income in the most recent interview.
This issue is relevant because the income distribution is particularly dense around the 60% and 70% of median income thresholds. In addition, some short periods of recorded high income may be due to measurement error and not reflect any real improvement in living standards.
Low income entry and exit
The methodology used here is the same as in the predecessor Low Income Dynamics publication. This analysis looks at individuals moving into and out of relative low income across a two-wave period, and uses a measure of equivalised household income consistent with that used elsewhere in ID.
When analysing transitions into and out of low income, the threshold used is the standard 60% of median income. Analysis of transitions between one wave and the next only includes what are defined as ‘clear’ transitions. For example, for an exit or entry to occur, household incomes must change such that they cross the threshold and are at least 10% higher or lower than 60% median income in the following wave. This requirement is put in place because all survey estimates - including household incomes and measures based on them such as the low income threshold - are subject to sampling and measurement error.
The exit or entry rate for individuals is calculated as, using exit rates as an example, the number of individuals in low income in one wave who exited low income in the following wave, expressed as a percentage of all those who were in low income. Roughly equal numbers of individuals move into as move out of low income across each two-wave period. Rates of entry are, however, much lower than rates of exit, because entry rates are expressed as a percentage of those who were not in low income in the first of the two waves under consideration. Exit rates are expressed as a percentage of those who were in low income in the first of the two waves under consideration (a much smaller number than those not in low income).
The unit of analysis is the individual. However, as individuals live in households and we assume that all members of the household benefit equally from the household’s income, they will be affected by changes at the household level. This could come about either through changes in income levels, or by changes in the household composition which affects incomes through the equivalisation process.
For the publication tables containing detailed breakdowns we have presented the rates as an average over three, two-wave periods as this will, to some extent, remove volatility that can be associated with smaller sample sizes, and help to create a more robust and stable series. This contrasts with the presentation given in Low Income Dynamics which was a pooled estimate from the transitions between all adjacent two-year periods.
As noted in Section 1, analysis on low income entry and exit has been extended for ID 2010 to 2019 to include AHC estimates.
Events associated with low income entry and exit
New analysis has been included in this year’s ID publication on the events associated with low income entry and exit. This analysis is based on the sample of individuals who enter and exit low income across a two-wave period, as described above. It aims to help us understand how certain events are linked to these low income entries and exits by considering changes to income sources (including earned and non-earned income), changes in employment, and demographic changes. For AHC analysis only, we also look at changes in tenure and housing costs.
The approach we have used is largely based upon an established methodology which has been used on the British Household Panel Survey (BHPS) previously (for example, Jenkins S.P and Rigg J.A with the assistance of Devicienti, F. (2001) ‘The dynamics of poverty in Britain’, DWP Research Report No. 157); and also in Low Income Dynamics, the predecessor of ID, based on the BHPS.
The following events are considered. Income components are the same as those set out in full at the start of this Section.
| Event | Definition |
|---|---|
| Earnings | A change in monthly household earnings of at least 20% and a minimum of £10. No change in the number of workers in the household. |
| Benefit income | A change in monthly household benefit income of at least 20% and a minimum of £10. No change in household size. |
| Investment income | A change in monthly household income from investment of at least 20% and a minimum of £10. No change in household size. |
| Occupational pension income | A change in monthly household occupational pension income of at least 20% and a minimum of £10. No change in household size. |
| Other income | A change in monthly household miscellaneous income of at least 20% and a minimum of £10. No change in household size. |
| Number of workers | A change in the number of workers in a household. This is considered both for where there is an accompanying household size change and where there is no change in household size. |
| Number of full-time workers | A change in the number of full-time workers in a household. This is considered both for where there is an accompanying household size change and where there is no change in household size. |
| Household type | A change in household type. |
| Lone parent household | A change in lone parent status – either becoming a lone parent (low income entries) or changing from being a lone parent (low income exits). |
| Couple to single person household | A change from living in a couple household to a single person household – no children in either case. |
| Single to couple household | A change from living in a single person household to a couple household – no children in either case. |
| Number of children | A change in the number of children – an increase for low income entry or a decrease for low income exit. |
| Tenure | AHC only, a change in tenure across the four tenure types (outright ownership; buying with a mortgage; social renting or private renting). |
| Housing costs | AHC only, an increase (low income entries) or decrease (low income exits) in monthly housing costs of at least 20% and a minimum of £10. |
For a change in monthly income or housing costs to be considered an event, it must have changed by at least 20% and a minimum of £10. This requirement aims to ensure that only meaningful changes in income components are included. To be included in analysis of low income exits, income components must have increased, and to be included in the analysis of low income entries, income components must have decreased.
Certain employment and demographic changes are controlled for when examining income and housing costs events. This is to try and remove the effect of major changes that are likely to have a bearing on the event being considered. For example, changes in household earnings are only included if the number of workers stays the same. For all other income events, the number of people in the household must not change.
For each event, we present three statistics in our ID publication tables , across all two-wave periods since 2010 to 2011:
A prevalence statistic – this tells us how common an event is among the population at risk of either entering or exiting low income. When considering the relationship between a fall in earnings and low income entry, for example, the prevalence statistic tells us what percentage of those who were not in low income in the first wave experienced a fall in earnings between the two waves. Table 9.1n tells us that over the most recent two-wave period, this was 9%.
A statistic expressing the rate of entry or exit if an individual experienced this event – Table 9.1n tells us that 22% of those who were not in low income in 2017 to 2018 and who experienced a decrease in earnings, entered low income in 2018 to 2019.
A statistic indicating how common an event was among all low income entries or exits – Table 9.1n shows that 31% of all those who entered low income experienced a fall in earnings. Because those in low income are a smaller group than those who are not, and are, by definition, closer to the low income threshold, they have a greater chance of exiting low income if they experience a particular event than those not in low income have of entering low income if they experience the same event. This explains why exit rates tend to be higher than entry rates.
While we have aimed to rule out major confounding events, this analysis does not rule out all factors which may have a bearing upon low income entry or exit, and should not be interpreted as implying causality.
We would welcome any feedback on this new analysis.
Variables used for sub-group analysis
When longitudinal analysis is carried out on particular sub-groups, we allocate individuals to sub-groups according to their status in the first wave being considered, and use weights in the final wave being considered. This means that their status in any intervening waves may change, and have a bearing upon what is being measured in the final wave, but will not be taken into account.
For example, if looking at persistent low income over a four-wave period, consider a single working-age adult living alone who was working in the first interview of the period being considered and not in relative low income, but then was not working for the next three interviews and was in relative low income for each of those waves. This individual would be identified as in persistent low income, but would also be classified as in a family where all adults are working despite not having worked for the past three waves.
Variables used to classify age and pensioner status
For this ID 2010 to 2019 publication, we have changed the USoc age variable we use from ‘dvage’ to ‘age_dv’. Prior to this year, we had used ‘dvage’ in some derived variables. However, we noted that we were also using age-related derived variables produced by USoc which were based on the age variable ‘age_dv’. This difference in approach was resulting in some minor discrepancies in our analysis. Upon seeking advice from the University of Essex and carrying out tests to assess the impact of making this change, we decided to implement ‘age_dv’ throughout our code. USoc check the variable ‘age_dv’ for consistency, and make imputations when errors are found in order to increase its accuracy. More information about the differences between the two age variables is available in the ‘Questions about variables’ section of the USoc FAQ page. By making this change we have improved the consistency of our analysis and slightly reduced the number of missing cases.
In line with the above change, we have changed the way in which we identify whether someone is a pensioner. We now use the USoc variable ‘pensioner_dv’ to identify if an individual is of State Pension age (SPa). Previously we derived this using the variable ‘dvage’. ‘Pensioner_dv’ is derived using a respondent’s full date of birth (via ‘age_dv’). This increases precision in determining SPa. Our previous variable only allowed us birth month and birth year.
State Support
The Government pays money to individuals in order to support them financially under various circumstances. An individual is in receipt of state support if they receive one or more benefits, or are being paid Tax Credits. Most of these benefits are administered by DWP, with the exception of Housing Benefit and Council Tax Reduction which are administered by local authorities, and Child Benefit and Tax Credits which are administered by HM Revenue and Customs. Since 2013, Universal Credit has been replacing income-based Jobseekers’ Allowance, income-related Employment and Support Allowance, Income Support, Working Tax Credit, Child Tax Credit and Housing Benefits. National roll-out of Universal Credit for all new relevant claims completed in December 2018. However, existing claimants with legacy benefits who have not have a change in circumstances have remained on their legacy benefits. For more information regarding the way in which information on state support is gathered and processed, please see the USoc Wave 10 questionnaire and ‘Understanding Society and its income data’.
Note: this information was previously presented as Table M.6 but due to accessibility in HTML we have changed it to the above paragraph.
Ethnicity
USoc includes detailed ethnicity classifications which are combined into the following publication splits:
White:
- British/English/Scottish/Welsh/Northern Irish
- Irish
- Gypsy or Irish Traveller resident in England, Scotland or Wales
- Any other White background
Mixed:
- White and Black Caribbean
- White and Black African
- White and Asian
- Any other mixed background
Asian:
- Asian/Asian British: Indian
- Asian/Asian British: Pakistani
- Asian/Asian British: Bangladeshi
- Asian/Asian British: Chinese
- Asian/Asian British: Any other Asian background
Black:
- Black/Black British: Caribbean
- Black/Black British: African
- Black/Black British: Any other Black Background
Other:
- Other Ethnic Group: Arab
- Other Ethnic Group: Gypsy or Irish Traveller resident in Northern Ireland
- Other Ethnic Group: Any other ethnic group
Source: Understanding Society Wave 10 questionnaire.
To ensure ID statistics are harmonised with GSS standards the ethnicity breakdown has been changed for ID 2010 to 2019 so that Gypsy or Irish Travellers resident in Northern Ireland are now included in the Other ethnic group rather than the White ethnic group. Gypsy or Irish Travellers resident in England, Scotland or Wales are still included in the White ethnic group.
Note: The above information was previously published as Table M.7.
Long-standing illness or disability definition
USoc includes two questions to determine whether someone has a long-standing illness or disability:
“Do you have any long-standing physical or mental impairment, illness or disability? By ‘long-standing’ I mean anything that has troubled you over a period of at least 12 months or that is likely to trouble you over a period of at least 12 months.”
If respondents have a long-standing illness or disability, a follow-up question asks:
“Does this / do these health problem(s) or disability(ies) mean that you have substantial difficulties with any of the following areas of your life?”
Twelve areas are listed:
- mobility (moving around at home and walking)
- lifting, carrying or moving objects
- manual dexterity (using your hands to carry out everyday tasks)
- continence (bladder and bowel control)
- hearing (apart from using a standard hearing aid)
- sight (apart from wearing standard glasses)
- communication or speech problems
- memory or ability to concentrate, learn or understand
- recognising when you are in physical danger
- your physical co-ordination (for example, balance)
- difficulties with own personal care (for example, getting dressed, taking a bath or shower)
- other health problem or disability
If a respondent answers that they have substantial difficulties with any of these areas, they are said to have a limiting long-standing illness or disability. If they identify none of these, then the long-standing illness or disability is said to be non-limiting. As noted above under Section 2, the way in which this information is gathered changed in USoc Wave 7. See USoc survey documentation for further details.
4. Limitations of the statistics
A number of issues with these statistics have been addressed in previous years. There remain other limitations associated with these results, which are summarised below. Where possible, we will continue to make improvements over time.
Wave 1 (2009 to 2010) income information
There are known issues with the income information in the first USoc wave covering 2009 to 2010. See Dr Paul Fisher’s paper Does repeated measurement improve income data quality? (ISER Working Paper Series, 2016-11) for details of why income data on the first wave of USoc are not comparable with subsequent waves and are likely to be of lower quality. We have therefore excluded the first wave from any analysis presented in this publication.
Survey Data
The figures in ID come from USoc, a longitudinal survey. In 2018 to 2019, the survey gathered information on over 29,000 individuals. In addition to capturing detailed information on incomes, USoc gathers rich contextual information on household and individual circumstances, such as employment, education level and disability.
Surveys gather information from a sample rather than from the whole population. The sample is designed carefully to allow for this, and to be as accurate as possible given practical limitations, such as time and cost constraints. Results from sample surveys are always estimates, not precise figures. This means that they are subject to a margin of error which can affect how changes in the numbers should be interpreted, especially in the short-term. Year-on-year movements should be treated with caution.
In addition to sampling errors, consideration should also be given to non-sampling errors. Non-sampling errors arise from the introduction of some systematic errors in the sample compared to the population it is supposed to represent. As well as response bias, errors include inappropriate definition of the population, misleading questions, data input errors or data handling problems – in fact any factor that might lead to the survey results systematically misrepresenting the population. There is no simple control or measurement for such non-sampling errors, although the risk can be minimised through careful application of the appropriate survey techniques from the questionnaire and sample design stages through to analysis of results.
ID is based on data from a longitudinal household survey and so subject to the nuances of using a survey, including:
| Term | Definition |
|---|---|
| Attrition | Some respondents will inevitably drop out between interviews. To minimise attrition, the USoc team maintains a database of information on respondents so they can send communications to respondents. The database builds on contact information collected during the survey interviews, and is updated throughout the year. A between-wave-mailing is also used to help maintain contact with participants and update addresses. The mailing has a report of research findings, an address confirmation slip and materials to encourage registration with the participant website. |
| Sampling error | Results from surveys are estimates and not precise figures. In general terms the smaller the sample size, the larger the uncertainty. |
| Non-response error | As with any survey, analysis based on USoc is at risk from a systematic bias due to non-response. This is when households that had been selected for interview do not respond to the survey. Individuals within households may also be non-responders even if the rest of the household does respond. In an attempt to correct for these biases, the results are weighted to adjust for non-response, taking account of previous responses. |
| Item non-response | Item non-response occurs where a respondent has given a full interview, but has refused or given a ‘don’t know’ answer to a particular question, which consequently leads to a missing value for that item. ISER have used imputation for some variables in USoc to correct for this item non-response, whereby a valid value is imputed in to replace the missing value, with the aim of reducing potential bias caused by the missing values. Imputation is used to derive overall incomes where there is missing data. |
| Survey coverage | USoc covers private households in the United Kingdom (although it does collect information from households about their children if a child has moved into an institution). Individuals in nursing or retirement homes, for example, will therefore not be included. This means that figures relating to the most elderly individuals may not be representative of the United Kingdom population, as many of those at this age will have moved into homes where they can receive more frequent help. |
| Sample size | Although USoc has a large sample size for a household survey, small sample sizes for some more detailed analyses may mean results are more volatile. |
| Measurement error | Other social surveys underestimate incomes from certain sources when compared with administrative data. Like these surveys, it is likely that USoc also does not fully capture all income streams. However, the longitudinal nature of the survey means that this may improve over time with the use of dependent interviewing (where respondents can be reminded of previous responses) and panel conditioning (where familiarity with the questionnaire means that respondents respond more accurately to later waves of the survey). See Dr Paul Fisher’s paper Does repeated measurement improve income data quality? (ISER Working Paper Series, 2016-11) for further details. |
Reporting Uncertainty
As noted above, survey results are always estimates, not precise figures and so subject to a level of uncertainty. Two different random samples from one population, for example the UK, are unlikely to give exactly the same survey results, which are likely to differ again from the results that would be obtained if the whole population was surveyed. We are unable to calculate sampling uncertainties for these statistics.
Rounding and suppression
Figures are rounded to the nearest percentage point independently and as a result, differences may not sum exactly due to rounding. Any proportions based on a sample population of 100 or less are suppressed.
Survey-based income data
The following issues need to be considered when using any survey-based income information:
| Term | Definition |
|---|---|
| Lowest incomes | Comparisons of household income and expenditure suggest that those households reporting the lowest incomes may not have the lowest living standards. |
| Benefit receipt | Relative to administrative records, surveys tend to under-report benefit receipt. |
| Self-employed | All analyses in the ID publication include the self-employed. A proportion of this group are believed to report incomes that do not reflect their living standards and there are also recognised difficulties in obtaining timely and accurate income information from this group. This may lead to an understatement of total income for some groups for whom this is a major income component, although this is likely to be more important for those at the top of the income distribution. |
| High incomes | Unlike in the HBAI series, no adjustment is made to correct for a likely undercount of ‘very rich’ households in survey data. However, this should not affect low income statistics based on median incomes. |
| Gender analysis | ID analysis assumes that both partners in a couple benefit equally from the household’s income, and will therefore appear at the same position in the income distribution. Research has suggested that, particularly in low income households, the assumption with regard to income sharing is not always valid as men sometimes benefit at the expense of women from shared household income. This means that it is possible that results broken down by gender could understate differences between the two groups. |
| Students | All analyses in ID includes students. Information for students should be treated with some caution because they are often dependent on irregular flows of income. |
| Elderly | The effect of the exclusion of the elderly who live in residential homes is likely to be small overall except for results specific to those aged 80 and above. |
| Ethnicity analysis | Smaller ethnic minority groups exhibit year-on-year variation which limits comparisons over time. USoc includes an ethnic minority boost which means it has larger sample sizes for non-white ethnic groups than if such a boost was not present. |
| Disability analysis | No adjustment is made to disposable household income to take into account any additional costs that may be incurred due to the illness or disability in question. This means that using income as a proxy for living standards for these groups may be somewhat upwardly biased. |
| Regional analysis | Although the USoc sample is large enough to allow some analysis to be performed at a regional level, it should be noted that no adjustment has been made for regional cost of living differences. It is therefore assumed that there is no difference in the cost of living between regions, although the After Housing Costs measure will partly take into account differences in housing costs. |
5. Comparisons between the statistics
ID is a successor series to DWP’s Low Income Dynamics (LID) publication, the final issue of which was published in September 2010. LID was based on the British Household Panel Survey (BHPS), and included analysis of events linked to low income entry and exit similar to the new ID analysis. There are methodological differences between the two approaches and data sources which mean that direct comparisons are not possible.
A related publication is the Office for National Statistics’ publication on Persistent Poverty in the UK and EU. This is based on the European Union Statistics on Income and Living Conditions (EU-SILC) and, as well as drawing on a different data source, uses slightly different definitions, counting persistent low income i.e. individuals who are in low income households for at least three of the last four years, including the latest year. This definitional difference means EU persistent low income statistics for the UK tend to be a little lower than those presented in ID. For details of SILC calculations see EU statistics on income and living conditions (EU-SILC) methodology - monetary poverty, while “The relationship between EU indicators of persistent and current poverty” by Stephen P. Jenkins and Philippe Van Kerm contains a commentary on the EU-SILC persistent low income methodology. Persistent low income data sourced from EU-SILC for other countries is available via the eurostat website.
Comparison with EU persistent low income statistics
In addition to the definitional differences, EU persistent low income figures will differ for a number of reasons:
- Time period: The figures are presented on different timescales, the ID figures are presented over two financial years, while the EU comparable figures are presented for the calendar year
- Population groups: The European low income statistics are presented in different age groups than the ID figures
- Children: EU figures relate to those under 18. ID defines a dependent child as one aged under 16 or aged 16‑18 and in school or non‑advanced further education, not married and living with parent
- Pensioners: EU figures relate to the 65+ population – ID figures cover those above State Pension age at the point of their USoc interview
- After Housing Costs measures: European low income estimates are usually presented on a Before Housing Costs basis only
For income derivation the definition of income in the European figures differs from the USoc derivation:
- The European definition of income includes the value of non-cash employee income from company cars as employee income, which will raise the average income of people in work
- In year deflation: ID estimates make an in year adjustment to individuals’ incomes to ensure that respondents income collected across the financial year are comparable. This adjustment is not applied to the European figures
- Income tax and national insurance: The European income tax and national insurance figures are calculated using a model of taxation, whilst ID estimates are mostly calculated on the amount of tax and national insurance reported as being paid
Other relevant statistics
The ID publication and tables are released alongside a number of other publications focused on income and low income statistics across Government.
In February 2015, the United Kingdom Statistics Authority (UKSA) published a report on the outcome of a monitoring review into the Coherence and Accessibility of Official Statistics on Income and Earnings. A progress report was published in January 2016 and updated in December 2018.
This review considered the way in which official statistics about income and earnings across Government were presented and included summary details of the official statistics within the Review’s scope; discussion of the conceptual issues faced by users and advice needed when attempting to analyse official statistics; and made recommendations around potential solutions to concerns identified and for the longer term development of income and earnings statistics.
The statistics highlighted below represent a number of statistical releases which might be considered alongside results from ID in order to give a more complete picture. This is not intended to be an exhaustive list and should be considered alongside details from the UKSA review highlighted, as well as recent ONS guidance on sources of data on earnings and income and useful information on income and earnings statistics produced by the ONS.
Households Below Average Income
The Households Below Average Income (HBAI) series presents information on living standards in the UK based on household income measures for the FYE 2020. Estimates are provided for average incomes, and for the number and percentage of people living in low income households. Tables M.8 and M.9 in the ID methodology tables compare single year income statistics derived from USoc with HBAI figures, and show a good level of coherence. HBAI remains the best source of cross-sectional low income statistics. HBAI data are also available on the Stat-Xplore online tool.
Family Resources Survey
The Family Resources Survey (FRS) is a continuous household survey. It publishes a range of annual statistics on household circumstances, including income, disability, tenure and pension participation.
Pensioner’s Incomes Series
The Pensioner’s Incomes Series provides a more detailed analysis of pensioners’ incomes, based on data collected by the FRS.
Poverty and Income Inequality in Scotland
This report includes figures on persistent poverty for children in Scotland. These statistics are based on ID, and are produced for the Scottish Government by the DWP.
Household Below Average Income Report for Northern Ireland
This report uses data collected by the FRS to produce statistics on income and living standards for Northern Ireland.
EU Comparisons
A description of how levels of low income in the UK compare with other EU countries is available via the eurostat website.
OECD International Comparisons
The OECD provides international comparisons on trends and levels in Gini coefficients before and after taxes and transfers, average household disposable incomes, relative poverty rates and poverty gaps, before and after taxes and transfers.
The effect of taxes and benefits on household income
These ONS statistics provide a detailed breakdown of household income, including estimates of both direct and indirect taxes, cash benefits and in-kind benefits provided by the state by decile groups ranked by equivalised disposable income.
Commentary on average household income for the financial year ending 2020 is available via a separate bulletin. Income inequality for the financial year ending 2020 is available here.
Personal Incomes statistics
HMRC Personal Incomes statistics include data on UK taxpayers, their incomes and the income tax they are liable for, based on the annual Survey of Personal Incomes.
Wealth in Great Britain
The Wealth & Assets Survey (WAS) is a key source of information on how households in Great Britain are managing economically. WAS is a large scale longitudinal survey with six rounds currently published. The survey focuses on household assets and debts, borrowing and saving, and plans for retirement. This publication presents headline results from WAS incorporating results from the survey’s sixth round (2016 to 2018).
Personal and economic well-being in Great Britain
Based on the ONS’s Opinions and Lifestyle Survey (OPN) which has run weekly during the course of the coronavirus pandemic, as well as the Survey on Living Conditions (SLC), this publication reports on how the pandemic has affected people’s employment, income, savings and debt, as well as their well-being.
Improving Lives: Helping Workless Families indicators and evidence base
Improving Lives is a compendium of nine indicators which tracks progress in tackling the disadvantages that affect families’ and children’s outcomes. It includes measures of worklessness and problem debt.
Estimates of income and low income levels for small areas
We do not publish data below the level of region, due to sample sizes. However, there are some related data sources that present information at smaller geographies:
Children in Low Income Families: Local Area Statistics
These statistics were first published in March 2020. They provide estimates of the number and proportion of children living in relative and absolute (before housing costs) low income by local area across Great Britain. They are a joint release by the DWP and HMRC which replaced Official Statistics previously published separately by DWP (Children in out-of-work benefit households) and HMRC (Children in low-income families local measure).
Income estimates for small areas, England and Wales: Financial Year Ending 2018
ONS produce model-based estimates of income at Middle layer Super Output Area (MSOA) level. The 2017 to 2018 publication is available.
6. Status of the statistics
Official statistics
ID was first published in 2017 as experimental statistics. A decision was taken, in line with official guidance published by the UK Statistics Authority, to remove the experimental label from these statistics in 2019, and ID is now official statistics. The Code of Practice for Statistics sets out the standards to which producers of official statistics should commit.
Quality Statement
We have worked closely with the University of Essex to review their income derivations. We also review our persistent low income results with EU-SILC results, as well as comparing single year income distribution and low income statistics with HBAI. While we would expect differences between these sources because of different survey vehicles, timings and definitions, as can be seen in the relevant tables, there is a good level of consistency between different data sources. See Table M.8 and M.9 in the ID methodology tables for comparisons between HBAI and ID income distribution and relative low income statistics, and also Persistent Poverty in the UK and EU: 2017.
Feedback
We would welcome any feedback on these statistics and would also be interested in knowing how you make use of these data to inform your work and any changes or additions you would like us to consider to improve its usefulness.
Feedback is always welcome. Please contact us via email:
teamincome.dynamics@dwp.gov.uk
Useful links
See our collections page for all material on ID including the detailed tables.
7. Glossary
Adult
All individuals who are aged 16 and over, unless defined as a dependent child (see Child). All individuals aged 16 or over in the household are interviewed as part of USoc.
Benefit units or Family
A single adult or a married or cohabiting couple and any dependent children.
Child
An individual is defined as a (dependent) child for the purposes of this analysis if they are aged under 16 or aged 16 to 18 and in school or non-advanced further education, not married, and living with a parent. If an individual, aged 16 to 18 and in full-time education, did not receive an interview (to determine their educational status), they were assumed to be a dependent child. It does not include any children who have a spouse, partner or child living in the household.
Contemporary median income
The average income for the period covered by the survey. Household incomes are adjusted for inflation so they are in real terms corresponding to the middle January of the latest USoc wave.
Long-standing illness or disability
USoc uses two questions to establish whether someone has a long-standing illness or disability:
“Do you have any long-standing physical or mental impairment, illness or disability? By ‘long-standing’ I mean anything that has troubled you over a period of at least 12 months or that is likely to trouble you over a period of at least 12 months.”
If respondents have a long-standing illness or disability, a follow-up question establishes whether that illness or disability is limiting:
“Does this / do these health problem(s) or disability(ies) mean that you have substantial difficulties with any of the following areas of your life?”
Twelve areas are listed (full details are in Section 3). If an individual identifies none of these, then the long-standing illness or disability is said to be non-limiting.
Economic status of the family
Families are allocated to the first applicable category:
- All adults working – Benefit units where all adults regard themselves as working
- Some adults working – Benefit units with two adults where only one is working
- Workless – Benefit units where no one is working
Individuals who have retired are counted as workless. Therefore, analysis of economic status based on ‘all individuals’ will include retired people in the ‘workless’ total.
Entry and Exit rates
The standard threshold, 60% of median income Before Housing Costs (BHC) is used when analysing transitions into and out of low income.
For an entry into low income to occur, the individual must be in a household whose income is at least 10% below the low income threshold, while in the previous wave they were in a household whose income was above the relative low income threshold.
For an exit from low income to occur, the individual must be in a household whose income is at least 10% above the low income threshold in a wave, while in the previous wave they were in a household whose income was below the relative low income threshold.
Equivalisation
Income measures used in ID take into account variations in the size and composition of the households in which people live. This process is called equivalisation. Equivalisation reflects the fact that a family of several people needs a higher income than a single individual in order for them to enjoy a comparable standard of living.
Ethnicity
Ethnicity information is combined into five groups for the purposes of analysis:
- White – made up of White: British/English/Scottish/Welsh/Northern Irish; White: Irish; White: Gypsy or Irish Traveller who are resident in England, Scotland or Wales; and White: any other White background
- Mixed – made up of Mixed: White and Black Caribbean; Mixed: White and Black African; Mixed: White and Asian; and Mixed: Any other mixed background
- Asian – made up of Asian/Asian British: Indian; Asian/Asian British: Pakistani; Asian/Asian British: Bangladeshi; Asian/Asian British: Chinese; and Asian/Asian British: Any other Asian background
- Black – made up of Black/Black British: Caribbean; Black/Black British: African; and Black/Black British: Any other Black background
- Other – made up of Other Ethnic Group: Arab; Other Ethnic Group: Gypsy or Irish Traveller resident in Northern Ireland; and Other Ethnic Group: Any other ethnic group
Families/family unit
The terms ‘families’ and ‘family units’ are used interchangeably with benefit units. See Benefit unit definition.
Family type
For some analyses, individuals are classified into family type. Individuals are classified according to the status of the benefit unit in which they live. All individuals in a benefit unit (adults and children) will therefore be given the same classification. The classifications are defined below and individuals are allocated to the first applicable category.
- Pensioner couple – a couple where one or more of the adults are State Pension age or over
- Single male pensioner – single male adult of State Pension age or over
- Single female pensioner – single female adult of State Pension age or over
- Mixed-age couple – one of the couple are above State Pension age and one below
- Couple with children – a non-pensioner couple with dependent children
- Single with children – a non-pensioner single adult with dependent children
- Couple without children – a non-pensioner couple with no dependent children
- Single male without children – a non-pensioner single adult male with no dependent children
- Single female without children – a non-pensioner single adult female with no dependent children
Gender
In any analysis of gender, it must be remembered that ID attempts to measure the living standards of an individual as determined by household income. This assumes that both partners in a couple benefit equally from the household’s income, and will therefore appear at the same position in the income distribution. Any difference in figures can only be driven by gender differences for single adults, which will themselves be diluted by the figures for couples. The lower-level gender disaggregation in the family type classification is therefore likely to be more informative.
Research has suggested that, particularly in low income households, the above assumption with regard to income sharing is not always valid as men sometimes benefit at the expense of women from shared household income. This means that it is possible that ID results broken down by gender could understate differences between the two groups.
Head of household
The head of household, also known as the household reference person, is defined as the owner or renter of the accommodation in which the household lives. If there are multiple owners or renters, the default is the eldest of them is the Household reference person. The Household reference person may change as the household composition changes.
Household
One person living alone or a group of people (not necessarily related) who either share living accommodation or share one meal a day and who have the address as their only or main residence is defined as a household. A child is classed as living in a household if their household is defined as above. A household will consist of one or more benefit units.
Housing costs
Housing costs are rent or mortgage interest payments, plus service and water charges. Consistent with HBAI, for mortgage-holders only the mortgage interest payments are included as housing costs i.e. capital repayment amounts are excluded.
Income
The Before Housing Costs (BHC) income measure used in ID is weekly net (disposable) equivalised household income. This comprises total income from all sources of all household members including dependants.
Income is adjusted for household size and composition by means of equivalence scales. Incomes are adjusted for inflation so they are in real terms corresponding to the middle January of the latest USoc wave (January 2019 in this case).
Income on ID includes:
- Labour income – usual pay and self-employment earnings. Includes income from second jobs
- Miscellaneous income – educational grants, payments from family members and any other regular payment
- Private benefit income – includes trade union/friendly society payments, maintenance or alimony and sickness or accident insurance
- Investment income – private pensions/annuities, rents received, income from savings and investments
- Pension income – occupational pensions income
- State support – tax credits and all state benefits including State Pension
Income is net of the following items:
- income tax payments
- National Insurance contributions
- council tax
Income After Housing Costs (AHC) is derived by deducting housing costs from the above BHC income measure.
Income distribution
The spread of incomes across the population.
Low income
Low income is defined using thresholds derived from percentages of median income for the whole population. Individuals are said to be in relative low income if they live in a household with an equivalised income below a percentage of median income BHC or AHC. Relative low income statistics fall if income growth at the lower end of the income distribution is greater than overall income growth.
Mean
Mean equivalised household income of individuals is found by adding up equivalised household incomes for each individual in a population and dividing the result by the number of people.
Median
Median household income divides the population, when ranked by equivalised household income, into two equal-sized groups. Contemporary median income refers to the median income in the survey period being considered.
Pensioner
Pensioners are defined as all those adults above State Pension age (SPa).
For women born on or before 5th April 1950, SPa is 60. For men born on or before this date, SPa is 65. From 6th April 2010, the SPa for women born on or after 6th April 1950 increased gradually between April 2010 and November 2018 to be the same as the SPa for men. The SPa for men remained at 65.
From December 2018, the SPa for both men and women began to increase, and will reach 66 in October 2020. Further increases to bring the SPa to 67 are proposed to be phased in between 2026 and 2028. Read details about these changes.
Pensioner couples and Mixed-age couples
In the ID pensioner tables, the pensioner couple category includes individuals above SPa in couples where the other partner is below SPa. Similarly, the mixed-age couple category in the Working-age adult tables covers adults below SPa in couples where the other partner is above SPa.
Persistent low income
Individuals are described as being in persistent low income if they live in a household in relative low income (below 60% or 70% of median income) in at least three out of four consecutive annual interviews. One possible measure of persistence of low incomes would be to consider only those individuals whose household income was low in each year of the period in question. However, this would exclude people who experienced slightly higher income for very short periods, but whose long-term living standards were not actually very different from those captured in low income in each year.
This issue is relevant because the income distribution is particularly dense around the 60% and 70% of median income thresholds. In addition, some short periods of recorded high income may be due to measurement error and not reflect any real improvement in living standards.
Qualifications
Highest qualification is derived as follows:
- Degree level and above – University Higher Degree (for example, MSc, PhD); First degree level qualification including foundation degrees, graduate membership of a professional institute, PGCE
- Higher education diploma – Diploma in higher education; Teaching qualification (excluding PGCE); Nursing or other medical qualification not yet mentioned
- A-level etc – A Level; Welsh Baccalaureate; International Baccalaureate; AS Level; Higher Grade/Advanced Higher (Scotland); Certificate of sixth year studies
- GCSE etc – GCSE/O Level; Standard/Ordinary (O) Grade / Lower (Scotland)
- Other qualifications – CSE; Other school (including school leaving exam certificate or matriculation)
- No qualifications
Quintile values
Income values which divide the whole population, when ranked by household income, into five equal-sized groups. This helps to compare different groups of the population.
Quintile groups
Five equal-sized groups - the lowest quintile describes individuals with incomes in the bottom 20% of the income distribution. Quintile is often used as a standard shorthand term for quintile group.
Region and country
Regional classifications are based on the standard statistical geography of the former Government Office Regions: nine in England, and a single region for each of Scotland, Wales and Northern Ireland. These regions are built up of complete counties or unitary authorities. Tables also include statistics for England as a whole. For the definitive Office for National Statistics geography classifications and codes see the ONS Open Geography portal.
Although the USoc sample is large enough to allow some analysis to be performed at a regional level, it should be noted that no adjustment has been made for regional cost of living differences, as the necessary data are not available. In the analysis here it is therefore assumed that there is no difference in the cost of living between regions, although the AHC measure will partly take into account differences in housing costs.
Sampling error
The uncertainty in the estimates which arises from taking a random sample of the household population.
State support
The Government pays money to individuals in order to support them financially under various circumstances. An individual is in receipt of state support if they receive one or more benefits, or are being paid Tax Credits. Most of these benefits are administered by DWP, with the exception of Housing Benefit and Council Tax Reduction which are administered by local authorities, and Child Benefit and Tax Credits which are administered by HM Revenue and Customs. For more information regarding the way in which information on state support is gathered via USoc, please see the Wave 10 questionnaire.
Tenure
A four-way split is presented:
- Owned outright
- Owned with mortgage
- Social rented – local authority rent or housing association rent
- Private rented – rented from employer, rented privately or other renting
Homes which are part-owned and part-rented are classified as being rented. A small proportion of cases have a tenure classification of ‘other’. These are included in sample sizes but not shown separately in tables.
Working-age adult
Individuals below State Pension age (SPa) who are over 16, not in further education and not classed as a dependent child.
8. Contact information and feedback
DWP would like to hear your views on our statistical publications. If you use any of our statistics publications, we would be interested in hearing what you use them for and how well they meet your requirements.
Press enquiries should be directed to the:
DWP Press Office
Telephone: 0203 267 5144.
Enquiries about these statistics should be directed by email to: teamincome.dynamics@dwp.gov.uk
Lead Analyst: Helen Smith