Impact of drug and alcohol treatment on reoffending: report
Published 9 July 2026
Applies to England

© Crown copyright 2026
This publication is licensed under the terms of the Open Government Licence v3.0 except where otherwise stated. To view this licence, visit nationalarchives.gov.uk/doc/open-government-licence/version/3 or write to the Information Policy Team, The National Archives, Kew, London TW9 4DU, or email: psi@nationalarchives.gov.uk.
Where we have identified any third party copyright information you will need to obtain permission from the copyright holders concerned.
This publication is available at https://www.gov.uk/government/statistics/impact-of-drug-and-alcohol-treatment-on-reoffending/impact-of-drug-and-alcohol-treatment-on-reoffending-report
Summary
The Department of Health and Social Care (DHSC) linked drug and alcohol treatment data from the National Drug Treatment Monitoring System (NDTMS) to offending data from the Police National Computer (PNC), managed by the Ministry of Justice (MOJ).
We used this linked data to analyse the offending rate of people in the year before starting treatment and the reoffending rate in the year after starting treatment.
The main findings were as follows.
About two-thirds (67%) of the people in community-based drug and alcohol treatment in NDTMS had an exact match to a record on the PNC database. This compares with 9.4 million working-age individuals with a nominal record on the PNC in August 2024, equivalent to almost 1 in 4 of the working-age population.
People in treatment for opioids and crack were most likely to have offended in the year before treatment (20.7%), while those treated for alcohol only were least likely (11.1%).
People in treatment for opioids and crack had the highest average number of offences per offender (4.9). People in treatment for alcohol only had the lowest average number of offences per offender (2.4).
People who successfully completed or remained in treatment were less likely to reoffend in the year after starting treatment than people who did not complete treatment.
People in treatment for opioids and/or crack were more likely to have reoffended in the year after starting treatment, compared with people in treatment for other substances.
Introduction
Drug and alcohol dependence is associated with offending. International evidence consistently shows higher rates of offending among people with drug or alcohol dependence than in the general population. Dame Carol Black’s 2021 Review of drugs: phase two report showed that a group of around 300,000 people who used heroin and crack committed nearly half of all acquisitive crime and homicides.
This project builds on The effect of drug and alcohol treatment on reoffending. That report linked PNC data with NDTMS data to investigate how criminal behaviour changed in the 2 years following the start of treatment. It also showed that for people starting treatment:
- 35% had at least one recorded caution or conviction in the 2 years before starting treatment
- there was a 44% reduction in offending and a 33% reduction in the number of offences after the start of treatment
Data sets
NDTMS
NDTMS collects data from services providing structured drug and alcohol treatment in every local authority in England. You can find definitions of structured treatment in NDTMS community adult business definitions.
The data includes information on the demographics and personal circumstances of people receiving treatment, as well as details of the interventions and their outcomes.
In this report, people in treatment were divided into 6 substance groups:
- opioids and crack - people who have problems with opioids, mainly heroin and crack, and may also have problems with other substances
- opioids (not crack) - people who have problems with opioids, mainly heroin, but not crack, and may also have problems with other substances
- crack (not opioids) - people who have problems with crack but not opioids, and may also have problems with other substances
- alcohol and non-opioids (not crack) - people who have problems with both alcohol and non-opioid drugs, excluding crack
- alcohol only - people who have problems with alcohol but do not have problems with any other substances
- non-opioids only (not crack) - people who have problems with non-opioids, excluding crack, but do not have problems with any other substances
PNC
The PNC is an administrative data system used by the police to monitor:
- recordable offences
- the offenders convicted or cautioned for them
- outcomes received by offenders
The system is live and subject to change, for example after appeals.
Recordable offences are defined as offences that can attract a custodial sentence plus some additional offences defined in legislation. Some non-recordable offences are also included on the PNC, particularly when they accompany recordable offences in the same case.
This report analysed people who started community-based drug and alcohol treatment between April 2013 and March 2023. For people who were linked with the PNC, caution and conviction data was available from 2000 to 2024. The data was available from 2000 to identify prolific offenders. We excluded not guilty, pending and non-conviction records.
More details about how we prepared the PNC data can be found in the accompanying methodology document.
Aim of this report
The aim of this report is to provide up-to-date evidence on criminal behaviour changes in the one-year period after starting treatment. The objectives of this work were to:
- link the PNC with NDTMS community treatment data set
- quantify offending rates in the year before starting treatment
- quantify reoffending rates in the year after starting treatment
- estimate the associations between the characteristics of people accessing treatment and the odds of reoffending in the year after leaving treatment
- estimate the prevalence of prolific offenders within the treatment population
Main findings
There were 1,140,999 people in the NDTMS community treatment data set who started treatment between April 2013 and March 2023. Of these, 561,408 were accurately matched to offenders in the PNC data, covering offences that occurred between 2000 and 2024.
The results give an overview of the offending characteristics of people in treatment, including prevalence, offending rates and reoffending. We only analysed offences that occurred in the year before starting treatment, or the year after starting treatment.
Terminology
The following terms are used in this report.
Treatment journey: a continuous period of structured treatment for substance misuse, tracking an individual from their initial contact and triage to their recovery or exit from the system. This includes where a person is new to treatment or has returned to treatment after more than 21 days.
Person in treatment: a person starting a new treatment journey, between April 2013 and March 2023. People starting multiple new journeys in different years will be counted multiple times, whereas people retained in a single treatment journey over many years will only be counted once in the financial year the journey started in.
Offender: a person who committed one or more offences in the year before starting treatment.
Offences: the number of offences a person committed in the year before starting treatment.
Reoffender: a person who committed one or more offences in the year after starting treatment, having previously committed one or more offences in the year before starting treatment.
Reoffences: the number of offences committed within the year after starting treatment, if the person committed one or more offences in the year before starting treatment.
People offending in one year before treatment
In the data set used for this analysis, we only analysed new treatment journeys. For each person, only the first treatment journey of each financial year was analysed. This means the profile of the treatment journeys analysed does not reflect the profile of all people in treatment.
Substance groups
Figure 1: all treatment journeys analysed compared with treatment journeys of people who had committed an offence in the year before starting treatment, by substance group
| Treatment journeys | Alcohol only | Alcohol and non-opioids | Non-opioids only | Crack (not opioids) | Opioids and crack | Opioids (not crack) | Total |
|---|---|---|---|---|---|---|---|
| Offenders’ treatment journeys | 28.5% | 17.7% | 16.6% | 3.7% | 20.1% | 13.5% | 100% |
| All treatment journeys analysed | 38.6% | 15.7% | 15.1% | 3.0% | 14.6% | 13.0% | 100% |
The chart shows community-based drug and alcohol treatment journeys that started between April 2013 and March 2023, for all people in treatment as well as those who were offenders.
In the treatment journeys analysed, the most common substance group was alcohol only with 38.6% of journeys. Crack (not opioids) was the least common group with 3.0% of treatment journeys.
The proportion of each substance group is different for treatment journeys of offenders, compared with all journeys.
A fifth (20.1%) of offenders’ treatment journeys were for opioids and crack, whereas this substance group only represented 14.6% of all treatment journeys. The largest substance group was alcohol only, but represented 28.5% of the offenders’ treatment journeys, compared with 38.6% of all journeys.
Offending over time
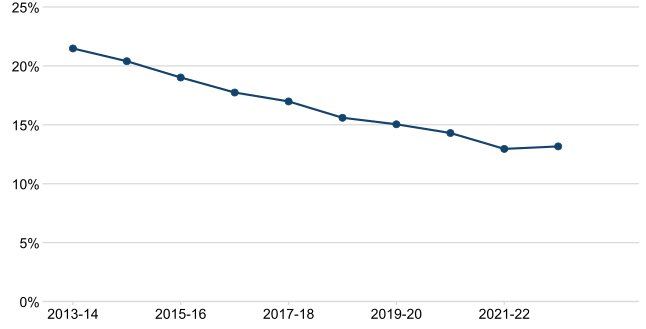
Figure 2a: percentage of people in treatment who committed at least one offence in the year before starting treatment, by financial year
| Treatment start year | Proportion that were offenders |
|---|---|
| 2013 to 2014 | 21.5% |
| 2014 to 2015 | 20.4% |
| 2015 to 2016 | 19.0% |
| 2016 to 2017 | 17.7% |
| 2017 to 2018 | 17.0% |
| 2018 to 2019 | 15.6% |
| 2019 to 2020 | 15.0% |
| 2020 to 2021 | 14.3% |
| 2021 to 2022 | 13.0% |
| 2022 to 2023 | 13.2% |
The proportion of people in treatment who were offenders decreases year on year, from 21.5% in 2013 to 2014 to 13.0% in 2021 to 2022. This was followed by a slight increase to 13.2% in 2022 to 2023.
This long-term decrease in offending could be down to a variety of factors, including the effect of COVID-19 on offending, changes in police practice and court delays. Other data sources available, such as the Crime Survey for England and Wales (CSEW) and police force data, do not show a consistent decrease in offending. This would indicate that this decrease is specific to this group or related to our data source (proven offences from the PNC).
Due to the limitations of the data sharing agreement with the PNC, analysing the entire population was not possible, only analysis of people in treatment. For more information, see the section ‘Changes in offending over time’.
This means that there will be less confidence in looking at longer-term offending rates for people and trends over time. Also, we should be cautious about any conclusions drawn from reductions in specific types of offences.
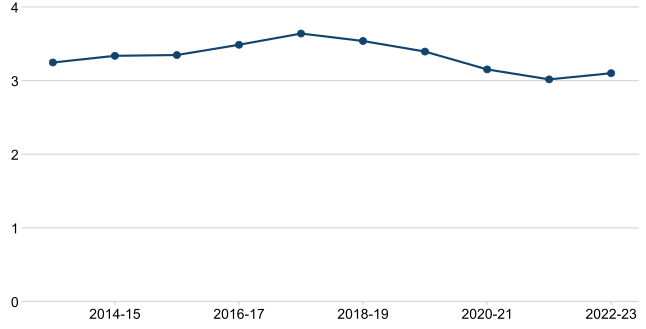
Figure 2b: average number of offences per offender in the year before starting treatment, by financial year
| Treatment start year | Number of offences committed per offender |
|---|---|
| 2013 to 2014 | 3.3 |
| 2014 to 2015 | 3.3 |
| 2015 to 2016 | 3.4 |
| 2016 to 2017 | 3.5 |
| 2017 to 2018 | 3.6 |
| 2018 to 2019 | 3.5 |
| 2019 to 2020 | 3.4 |
| 2020 to 2021 | 3.2 |
| 2021 to 2022 | 3.0 |
| 2022 to 2023 | 3.1 |
Across all the treatment years we analysed, offenders were committing on average 3.3 offences in the year before starting treatment. The highest number of offences was in 2017 to 2018, when there were 3.6 offences per offender, and the lowest was in 2022 to 2023 when there were 3.0 offences per offender.
Figure 3a: percentage of people in treatment who committed at least one offence in the year before starting treatment, by substance group
| Substance group | Percentage who were offenders |
|---|---|
| Alcohol only | 11.1% |
| Alcohol and non-opioids | 16.9% |
| Non-opioids only | 16.5% |
| Crack (not opioids) | 18.5% |
| Opioids and crack | 20.7% |
| Opioids (not crack) | 15.6% |
Among people in treatment, those treated for opioids and crack were most likely to have offended in the year before treatment (20.7%), while those treated for alcohol only were least likely (11.1%).
Figure 3b: average number of offences per offender in the year before starting treatment, by substance group
| Substance group | Average number of offences |
|---|---|
| Alcohol only | 2.4 |
| Alcohol and non-opioids | 2.8 |
| Non-opioids only | 2.8 |
| Crack (not opioids) | 3.5 |
| Opioids and crack | 4.9 |
| Opioids (not crack) | 4.3 |
Offenders in treatment for opioids and crack committed the highest average number of offences (4.9). Offenders in treatment for alcohol only committed the lowest average number of offences (2.4).
Sex
A higher proportion of men in treatment were offenders (17.4%), compared with women (10.1%).
Figure 4a: percentage of people in treatment who committed at least one offence in the year before starting treatment, by sex and substance group
| Substance group | Men | Women |
|---|---|---|
| Alcohol only | 13.3% | 7.7% |
| Alcohol and non-opioids | 19.7% | 10.3% |
| Non-opioids only | 19.8% | 7.6% |
| Crack (not opioids) | 20.1% | 14.4% |
| Opioids and crack | 21.1% | 19.4% |
| Opioids (not crack) | 16.8% | 12.1% |
Across all substance groups, men were more likely than women to offend in the year before starting treatment. The size of this difference varied by substance group, ranging from 1.7 percentage points among people in treatment for opioids and crack, to 12.2 percentage points among people treated for non-opioids only.
Figure 4b: average number of offences per offender in the year before starting treatment, by sex
| Substance group | Men | Women |
|---|---|---|
| Alcohol only | 2.5 | 2.1 |
| Alcohol and non-opioids | 2.9 | 2.6 |
| Non-opioids only | 2.9 | 2.4 |
| Crack (not opioids) | 3.6 | 3.3 |
| Opioids and crack | 4.9 | 4.9 |
| Opioids (not crack) | 4.4 | 4.2 |
Male offenders committed more offences on average (3.4) than female offenders (3.2). Apart from offenders in treatment for opioids and crack, men committed more offences on average than women in treatment for all other substance groups, although the difference between men and women is small in all groups.
Further demographic breakdowns are available in the data tables.
Offence categories
We grouped offences into 15 high-level categories for national statistics and performance monitoring. You can find a full list of offence categories in annex B, as well as the offences grouped into these categories.
Between 2013 and 2023 there were 5 offence groups which represented 80.5% of all offences by offenders in treatment. These groups were:
- drug offences, such as the unlawful importation or exportation of controlled substances, the production or supply (or intent to supply) of drugs and possession of controlled drugs
- summary motoring offences, such as the theft of a motor vehicle, vehicle registration or tax offences and driving under the influence of drink or drugs
- summary non-motoring offences, including a wide range of crimes, some of which are common assault, public drunkenness, criminal damage and benefit fraud
- theft offences, including aggravated burglary in a dwelling, vehicle-related theft causing injury or damage, theft from a person and theft from a shop
- breach offences, including any instance where an order or licensing condition has been breached, such as drug treatment order, curfew order or supervision order
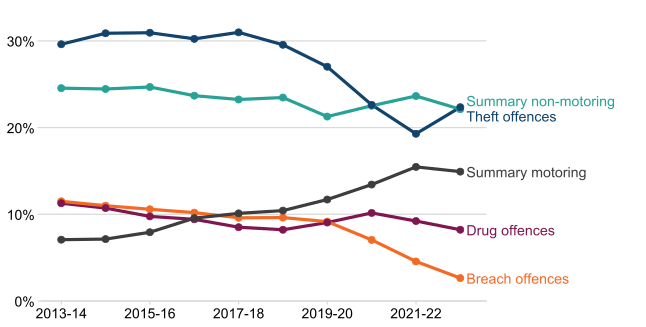
Figure 5: top 5 offence categories as a proportion of total offences committed in the year before starting treatment, by year of treatment start
| Row labels | Breach offences | Drug offences | Summary motoring | Summary non-motoring | Theft offences |
|---|---|---|---|---|---|
| 2013 to 2014 | 11.5% | 11.3% | 7.1% | 24.6% | 29.6% |
| 2014 to 2015 | 11.0% | 10.7% | 7.1% | 24.5% | 30.9% |
| 2015 to 2016 | 10.6% | 9.8% | 7.9% | 24.7% | 30.9% |
| 2016 to 2017 | 10.2% | 9.4% | 9.6% | 23.7% | 30.2% |
| 2017 to 2018 | 9.6% | 8.5% | 10.1% | 23.2% | 31.0% |
| 2018 to 2019 | 9.6% | 8.2% | 10.4% | 23.5% | 29.6% |
| 2019 to 2020 | 9.2% | 9.0% | 11.7% | 21.3% | 27.0% |
| 2020 to 2021 | 7.0% | 10.2% | 13.4% | 22.5% | 22.6% |
| 2021 to 2022 | 4.6% | 9.2% | 15.5% | 23.6% | 19.3% |
| 2022 to 2023 | 2.6% | 8.2% | 14.9% | 22.1% | 22.4% |
Figure 5 shows the top 5 offence categories between April 2013 and March 2023.
Between 2013 to 2014 and 2018 to 2019, theft offences consistently accounted for around 30% of all offences. During COVID-19, there were more summary non-motoring offences than theft offences, but in 2022 to 2023 theft offences were the main offence group.
The underlying data for this graph is available to download in the supplementary tables, which accompany this release.
Figure 6: percentage of offenders by substance group and offence group for the top 5 most common offence groups
| Substance group | Alcohol only | Alcohol and non-opioids | Non-opioids only | Crack (not opioids) | Opioids and crack | Opioids (not crack) | Total |
|---|---|---|---|---|---|---|---|
| Theft offences | 6.4% | 6.4% | 7.3% | 3.6% | 49.2% | 27.0% | 100% |
| Summary non-motoring | 34.0% | 22.7% | 13.4% | 3.9% | 15.7% | 10.3% | 100% |
| Summary motoring | 39.9% | 17.6% | 16.1% | 4.0% | 12.9% | 9.6% | 100% |
| Drug offences | 4.6% | 19.0% | 34.6% | 4.2% | 22.7% | 14.9% | 100% |
| Breach offences | 16.1% | 11.2% | 10.1% | 3.5% | 36.6% | 22.5% | 100% |
| Other offences | 23.4% | 17.0% | 15.0% | 4.1% | 25.3% | 15.2% | 100% |
Of the people in treatment who had committed a theft offence in the year before starting treatment, 49.2% were in treatment for opioids and crack and 27.0% were in treatment for opioids (not crack).
Of the people in treatment who had committed a drugs offence in the year before starting treatment, 34.6% were in treatment for non-opioids and 22.7% were in treatment for opioids and crack.
People in treatment for alcohol only committed 3.9% of the summary non-motoring offences in our analysis.
You can find a full list of substances recorded and their groups in annex A.
Prolific offenders
Prolific offenders were identified by the number of previous offences a person had committed, according to their age at the time of starting treatment. MOJ’s Characteristics of prolific offenders statistics states that anyone identified as a prolific offender before turning 21 should retain this status throughout adulthood, even if they commit no further offences.
When starting drug and alcohol treatment, people were classed as prolific offenders if they had:
- 4 or more offences aged 17 and under
- 8 or more offences aged 18 to 20
- 16 or more offences aged 21 and over
Since the available data tracked offences from January 2000 to December 2024, it did not allow tracking someone’s full offence history before this period. This means that the method we used is likely to have underestimated the true number of prolific offenders.
Prolific offenders make up around 44% of all treatment journeys of people who offended in the year before starting treatment. Prolific offenders also accounted for around 65% of all offences committed in the year before starting treatment. This has been a stable rate across a period of 11 years.
Figure 7: percentage of offenders in the year before treatment that are prolific offenders by substance group
| Substance group | Prolific offenders |
|---|---|
| Alcohol only | 22.2% |
| Alcohol and non-opioids | 36.1% |
| Non-opioids only | 34.4% |
| Crack (not opioids) | 48.7% |
| Opioids and crack | 72.2% |
| Opioids (not crack) | 66.6% |
The substance group with the highest proportion of prolific offenders is the opioids and crack groups (72.2%). The alcohol only group had the lowest proportion of prolific offenders (22.2%).
People reoffending in year after starting treatment
For this section, we only analysed people who were in treatment who offended the year before starting treatment and then reoffended in the year after starting treatment. The results do not include people who did not offend before starting treatment but then went on to offend after starting treatment.
Substance group
Figure 8: percentage of offenders in treatment who reoffended in the year after starting treatment, by substance group
| Substance group | Percentage who reoffended |
|---|---|
| Alcohol only | 27.7% |
| Alcohol and non-opioids | 38.5% |
| Non-opioids only | 36.9% |
| Crack (not opioids) | 47.7% |
| Opioids and crack | 60.0% |
| Opioids (not crack) | 53.8% |
A larger proportion of people in treatment for opioids and crack (60%), and opioids (not crack) (53.8%), reoffended within a year of starting treatment, compared with all other substance groups. People in treatment for alcohol only had the lowest rate of reoffending (27.7%).
Age group
Figure 9: percentage of people in treatment who reoffended in the year after starting treatment, by age group
| Age group | Percentage who reoffended |
|---|---|
| 18 and under | 46.0% |
| 19 to 29 | 44.9% |
| 30 to 39 | 45.7% |
| 40 to 49 | 38.2% |
| 50 to 59 | 28.2% |
| 60 and over | 18.9% |
People aged 39 years and under who offended in the year before starting treatment had a higher proportion who reoffended in the year after starting treatment, compared with people aged 40 years and over. People aged 18 years and under had the highest proportion who reoffended (46.0%), compared with people aged 60 years and over, of which 18.9% reoffended.
Sex
For all offenders’ treatment journeys, a larger proportion of men (43.5%) reoffended in the year after starting treatment compared with women (36.0%).
Figure 10: percentage of people in treatment who reoffended in the year after starting treatment, by sex
| Substance group | Men | Women |
|---|---|---|
| Alcohol only | 30.0% | 21.5% |
| Alcohol and non-opioids | 40.2% | 30.4% |
| Non-opioids only | 38.6% | 25.3% |
| Crack (not opioids) | 49.4% | 41.7% |
| Opioids and crack | 60.5% | 58.6% |
| Opioids (not crack) | 54.9% | 49.6% |
Across all substance groups, a larger proportion of men reoffended compared with women, although the difference between the sexes varied across substance groups.
For people in treatment for opioids (not crack), 60.5% of men reoffended, compared with 58.6% of women, a difference of 1.9 percentage points. For people in treatment for non-opioids only, 38.6% of men reoffended compared with 25.3% of women (a difference of 13.3 percentage points).
Treatment outcome
A lower proportion of people who completed treatment went on to reoffend (29.1%) compared with those who did not complete treatment (44.6%).
People who did not complete treatment includes those who died, dropped out or had inconsistent treatment end dates. Of the people discharged but not completing treatment, 3% were discharged because they had died.
People going to prison might have committed offences over a year ago, been recalled to prison or are in prison awaiting trial. This report does not include information about treatment in prison, but a large proportion of people who leave community treatment to enter prison will have a managed transfer of their treatment to treatment in prison.
Figure 11: percentage of people in treatment who reoffended in the year after starting treatment, by treatment outcome
| Substance group | Prison | Not completed treatment | Still in treatment | Successful completion |
|---|---|---|---|---|
| Alcohol only | 75.6% | 31.8% | 17.7% | 21.4% |
| Alcohol and non-opioids | 75.3% | 40.6% | 23.5% | 33.3% |
| Non-opioids only | 69.8% | 40.0% | 19.0% | 32.5% |
| Crack (not opioids) | 80.4% | 49.5% | 25.0% | 34.8% |
| Opioids and crack | 82.9% | 58.1% | 34.9% | 40.5% |
| Opioids (not crack) | 81.3% | 51.3% | 30.7% | 35.3% |
For all substance groups, people who remained in treatment were the least likely to reoffend, followed by those who successfully completed treatment. For people in treatment for non-opioids only, the proportion who reoffended was more than double for those who did not complete treatment, compared with those still in treatment.
For people who leave community treatment to enter prison, the offence leading to incarceration may be the offence counted as the reoffence, or a breach of a community or suspended sentence due to the reoffence.
Employment status
A lower proportion of people in employment at the start of treatment (28.4%) reoffended compared with people who were not in employment (45.2%).
Figure 12: percentage of people in treatment who reoffended in the year after starting treatment, by employment status
| Substance group | In employment at the start of treatment | Not in employment at the start of treatment |
|---|---|---|
| Alcohol only | 20.1% | 30.7% |
| Alcohol and non-opioids | 32.9% | 40.5% |
| Non-opioids only | 31.0% | 39.1% |
| Crack (not opioids) | 40.6% | 48.8% |
| Opioids and crack | 49.1% | 60.6% |
| Opioids (not crack) | 33.7% | 55.7% |
For all treatment groups, people in employment at the start of treatment were less likely to reoffend than those who were not.
For people in treatment for opioids (not crack), those in employment at the start of treatment reoffended less than those who were not employed (33.7% compared with 55.7%).
Homelessness status
A higher proportion of people who were homeless at the start of treatment (52.3%) reoffended compared with people who were not homeless (38.3%).
Figure 13: percentage of people in treatment who reoffended in the year after starting treatment, by homelessness status
| Substance group | Homeless at the start of treatment | Not indicated homeless at the start of treatment |
|---|---|---|
| Alcohol only | 38.2% | 25.7% |
| Alcohol and non-opioids | 43.7% | 37.4% |
| Non-opioids only | 41.4% | 36.3% |
| Crack (not opioids) | 51.2% | 46.1% |
| Opioids and crack | 60.7% | 59.4% |
| Opioids (not crack) | 58.1% | 51.1% |
People in treatment for alcohol only had the largest difference in reoffending based on homelessness status. Those who were homeless at the start of alcohol only treatment were more likely to reoffend than those who were not homeless (38.2% compared with 25.7%).
Figure 14: percentage of people in treatment who reoffended in the year after starting treatment, by number of previous treatment journeys
| Substance group | No previous treatment journeys | 1 previous treatment journey | 2 to 4 previous treatment journeys | 5 or more previous treatment journeys |
|---|---|---|---|---|
| Alcohol only | 23.6% | 29.2% | 33.7% | 41.3% |
| Alcohol and non-opioids | 35.7% | 41.0% | 43.3% | 47.7% |
| Non-opioids only | 34.1% | 41.1% | 45.8% | 55.4% |
| Crack (not opioids) | 43.3% | 46.6% | 52.0% | 59.2% |
| Opioids and crack | 52.8% | 54.3% | 58.9% | 67.8% |
| Opioids (not crack) | 41.6% | 47.3% | 54.4% | 66.7% |
Across all substance groups, the more separate treatment journeys that a person had, the higher the proportion of reoffending. This is more likely to be related to their complex needs leading to them dropping out of treatment and having to keep returning, rather than more treatment leading to more reoffending.
Statistical analysis results
Introduction
We created a separate data set for this analysis to account for the multiple times a person might start treatment each year, and to help correctly estimate associations between the characteristics of offenders.
It includes all treatment journeys in the NDTMS community treatment data set and counts of offences occurring one year before and after each treatment journey start. Since people can have multiple treatment journeys, the same offence could appear in more than one record. For some people, an offence could appear as happening after the start of one treatment journey but before another.
We used logistic regression models to estimate the associations between people’s characteristics and their offending. This approach correctly adjusts for people having multiple treatment journeys over the period we analysed.
We used these models to assess the extent to which individual-level characteristics are associated with:
- offending in the year before starting treatment
- reoffending in the year after starting treatment
The regression models produce adjusted odds ratios (OR). A higher OR in logistic regression indicates a stronger positive association between a predictor and an outcome, suggesting the outcome is more likely to occur. For example, people in treatment for opioids and crack are chosen as the reference group (OR = 1) and the OR compares the odds of reoffending in a treatment group relative to a reference group.
Here, OR below 1 indicates a lower odds of reoffending compared with the reference group. If people in treatment for alcohol and non-opioids had an OR of 0.81, this means they had 19% lower odds of reoffending than people in opioids and crack treatment, after controlling for other factors in the model.
OR above 1 would indicate a higher odds of reoffending. If people in treatment for crack (not opioids) had an OR of 1.10, this means they had 10% higher odds of reoffending compared with people in opioids and crack treatment, after controlling for other factors in the model.
You can find all variables used in the regression models and their corresponding OR values can be found in the supplementary data tables.
Factors associated with offending in the year before treatment
This analysis included all people who started a new treatment journey between April 2013 and March 2023. From the results of the regression, we found several statistically significant factors as predictors of offending in the year before treatment. Statistically significant means there is 95% confidence that the true odds differ from the reference group.
People aged 18 and under had highest odds of offending of all age groups and the odds of offending decreased as age increased (OR = 0.39 and lower).
Women had lowers odds of offending than men (OR = 0.5).
People in treatment for crack (not opioids) or alcohol and non-opioids had higher odds of offending than those in treatment for opioids and crack (alcohol and non-opioids: OR = 1.1, crack not opioids: OR = 1.1), while people in treatment for opioids (not crack) had lower odds of offending (OR = 0.7).
People who were homeless at the start of treatment had higher odds of offending (OR = 1.5) compared to people who were not. People in employment or education when they entered treatment had lower odds of offending (OR = 0.6 and 0.3 respectively) compared to people who were not.
Using the index of multiple deprivation (IMD) quintiles, people living in the most deprived areas had higher odds of offending compared with people in the less deprived areas (quintile 3: OR = 0.9, quintile 4: OR = 0.9, quintile 5: OR = 0.8).
Factors associated with reoffending
This analysis considered all people in treatment who had offended in the year before treatment. We analysed factors relating to treatment, socioeconomic status and criminal justice history to find associations with reoffending. We included extra factors for the regression to look at reoffending, such as what type of offences were committed before starting treatment and treatment outcomes. We found several characteristics to be associated with reoffending, as follows.
Compared with people aged 18 or under, older age groups had lower odds of reoffending, with the odds decreasing as age increased (OR = 0.51 and lower).
Women had lower odds of reoffending than men (OR = 0.7).
Compared with people in treatment for opioids and crack people in treatment for other substance groups, had lower odds of reoffending:
- alcohol and non‑opioids (OR = 0.7)
- alcohol only (OR = 0.6)
- non‑opioids only (OR = 0.7)
- opioids (not crack) (OR = 0.8).
People who were homeless at the start of treatment had higher odds (OR = 1.3) of reoffending than people who were not homeless.
People who were discharged to prison (OR = 6.2) or did not complete treatment (OR = 1.7) had higher odds of reoffending than people who had successfully completed treatment. People who were still in treatment had lower odds of reoffending (OR = 0.8).
People in employment (OR = 0.8) or education (OR = 0.8) at the start of treatment had lower odds of reoffending than people who were not.
Theft offences (OR = 2.5), breach offences (OR = 1.8) and summary non-motoring offences (OR = 1.8) were associated with increased odds of reoffending, compared with people who had not committed these offence types in the year before treatment. Offence groups linked to lower odds of reoffending include cautions (OR = 0.7) and summary motoring offences (OR = 0.9).
Changes in offending over time
This report does not analyse the absolute number of offences which were committed and the difference in these offences before and after treatment. This section explains the difficulties in using the linked PNC data to track absolute number of offences and trends over time.
Trends in recorded offending among people in treatment
Figure 15: total number of offences recorded in the linked NDTMS and PNC data, by offence year
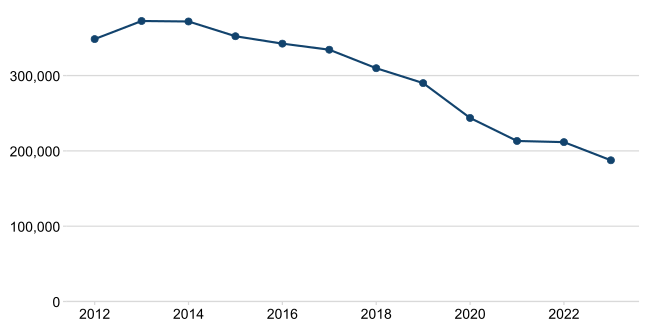
Figure 15 shows that in the linked PNC and NDTMS data, the total number of offences recorded each year reduced from 379,387 to 187,513 between 2013 and 2023. This reduction was consistent across most offence types.
However, this downward trend in recorded offences with ‘guilty’ outcomes does not necessarily reflect actual offences committed. Multiple factors over this period are likely to have influenced crime recording, such as case processing and sentencing times. As a result, changes we saw in the linked data set cannot be interpreted as either a wider reduction or a treatment-related reduction in offending over time.
Figure 16: number of indictable and summary offences receiving cautions or sentencing by year
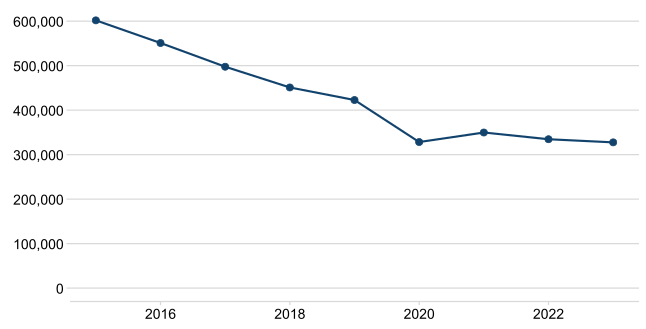
Figure 16 shows the number of indictable and summary offences receiving cautions or sentencing from the Ministry of Justice’s First time entrants and offender histories statistics, which use PNC as the data source. The figure shows that, apart from a slight increase between 2020 and 2021, the number of offences reduced each year between 2015 and 2023. This is a similar decrease to that seen in the linked NDTMS and PNC data.
A summary offence is a less serious criminal offence that can only be heard in a magistrates’ court. These cases are decided by magistrates or a district judge without a jury, and the maximum sentence is usually 6 months imprisonment for a single offence. Examples include common assault, being drunk and disorderly, minor criminal damage and minor motoring offences.
An indictable offence is a serious criminal offence that can only be tried in a Crown Court before a judge and jury. These offences generally carry more severe penalties, often including imprisonment. Examples include murder, manslaughter, rape, robbery and causing grievous bodily harm with intent.
Other data sources do not report the same scale of decrease in offending, though this depends on crime type. These include the Crime Survey for England and Wales (CSEW) and police recorded crime (PRC) statistics.
The Office for National Statistics publishes Crime in England and Wales, which uses both the CSEW and PRC data to show trends and explains the differences between the 2 sources. The latest report Crime in England and Wales: year ending December 2025 states that crime against individuals and households has generally decreased over the last 10 years with some notable exceptions, such as fraud.
Delays in the criminal justice system and implications for PNC data
The variation of the delays in the criminal justice system over time provide critical context for interpreting PNC offence data. Offences are recorded on the PNC only when an outcome, such as a caution or conviction, has occurred. Offences committed in recent years may not yet appear in the data if the result of the sentence is still pending. This creates a growing lag between offences and recording, which should be considered when analysing trends or attempting to look at changes in offending over time.
The average time from crime committed to sentencing in the linked data increased gradually from 2014 to 2023, from 0.6 years to 1 year. Magistrates court and Crown Court data also show that there was a lag between time of offence committed to the time the case has been completed in court, which can be seen in the MOJ report Criminal court statistics quarterly: April to June 2025.
Implications for modelling offending outcomes
There has been a significant and sustained decline in PNC recorded offences over the past decade, delays in court proceedings and changes in recording practices. This meant that the data set could not reliably support modelling of crimes reduced by treatment as originally intended. As a result, we refocused our analysis to explore reoffending patterns more broadly.
Conclusion
This report looked at a one-year cohort of people in treatment, with a larger cohort as well as using more up-to-date information. The increased cohort size and length of time covered means we can have more confidence in the statistics taken from this analysis.
The analysis showed that:
- people in treatment for opioids and/or crack cocaine were more likely to have committed theft offences or breach offences
- people in treatment for non-opioids were more likely to have committed drug offences
- people in treatment for alcohol were more likely to have committed summary offences
The analysis found that men were more likely to offend and reoffend than women. However, there were significant variations with this difference across the substance groups.
People who successfully complete treatment, or remain in treatment, were less likely to reoffend than people who do not complete treatment.
People in employment had a reduced level of reoffending, particularly people in treatment for opioids or alcohol.
Not being homeless reduced the proportion of people reoffending.
Sex, deprivation and age had an effect on the odds of reoffending. People aged 18 and under, men and people in high deprivation areas had higher adjusted ORs as well as being in treatment for opioids and crack.
Strengths and limitations
Strengths
This report is based on the largest ever national data linkage between NDTMS and PNC. It links caution and conviction data between 2000 and 2024 to treatment records from 2013 to 2023. It represents a unique data asset within the UK government. It enables DHSC and MOJ to better understand trends and objective criminal justice outcomes monitoring for people accessing drug and alcohol treatment.
Using national administrative data sets in this way has allowed us to identify factors associated with higher or lower rates of reoffending in the drug and alcohol treatment population. This leads to a better understanding of variation in population outcomes. It is a cheaper and less resource intensive method for evaluating real-world data and represents more effective and better value of public spending, supporting stronger accountability and transparency.
Limitations
Despite the above strengths, we need to acknowledge several limitations.
NDTMS only collects a small set of identifiers, such as initials rather than full names, and there was no common identifier between the 2 data sets. This meant we needed to remove a total of 300,970 records (26% of the available 1,140,999 records) from the analysis because of uncertainty about which records from NDTMS aligned with which records from PNC.
This may result in biased trends or estimates in changing behaviour, and means there is an undercount in the number of offences and offenders. Future work, in the absence of a common identifier, should explore other linkage methods like a probabilistic linkage. This was not possible in this project due to technical and information governance limitations.
The detail of the data linkage is set out in the methodology document. Due to NDTMS consent requirements, the PNC data was shared with DHSC for the matching. MOJ did not receive any identifiable NDTMS data. The analysis data set was pseudonymised and all identifiers deleted, which meant that we could not do any further identification or linkages based on this data set. This also meant we could not compare this group’s offending with that of other offenders who were not in treatment. The findings only represent people who have been in treatment, not those who needed treatment but had not yet engaged with it.
The increased delays in processing criminal proceedings may have affected the extent to which the drug and alcohol treatment population has a recorded caution or conviction. The reduced pre-treatment offending rate, as well as the improved decreases in offending after the start of treatment, may have been overly influenced by external factors. So, the offending rates we report here may be an undercount of actual offending. This effect may be more pronounced for some offence types than others.
For people with more than one treatment journey within a year, an offence will appear as happening after the start of one treatment journey but before another. This means there will be an overcount of offences.
The PNC records only represent offences that have been resolved at court and sentenced. This means crimes that are not reported or solved and charged will not be included on the PNC, so the PNC is expected to be an undercount of actual crimes committed.
We only looked at offences for people who have offended in the year before starting treatment. This means the total number of offences by people in treatment is likely to be undercounted. It does not take account of people whose only offence was in the year after starting treatment but not before, or those who offended more than one year before starting treatment.
We chose a one-year offending measure so that later years with a full follow up period could be included, and to align with similar MOJ reporting. Further analysis could explore people:
- with longer gaps in offending behaviour
- who seem to start offending after treatment
As there was no control group, we must be cautious about any suggestion of a reduction in offending by treatment.