Epidemiological analysis of C. difficile infections
Published 24 September 2026
Applies to England

© Crown copyright 2026
This publication is licensed under the terms of the Open Government Licence v3.0 except where otherwise stated. To view this licence, visit nationalarchives.gov.uk/doc/open-government-licence/version/3 or write to the Information Policy Team, The National Archives, Kew, London TW9 4DU, or email: psi@nationalarchives.gov.uk.
Where we have identified any third party copyright information you will need to obtain permission from the copyright holders concerned.
This publication is available at https://www.gov.uk/government/statistics/gram-negative-mrsa-and-mssa-bacteraemia-and-c-difficile-infections-annual-epidemiological-commentary-2025-to-2026/epidemiological-analysis-of-c-difficile-infections
Further information for C. difficile infections (CDI) is reported here.
Further detail for Gram-negative, MRSA and MSSA bacteraemia is available at Epidemiological analysis of Gram-negative, MRSA, and MSSA bacteraemia.
The Glossary, data sources, and further information for the annual epidemiological commentary up to and including financial year 2025 to 2026 is also available separately.
Total reports
A total of 17,114 cases of CDI were reported by NHS acute trusts in England in financial year (FY) 2025 to 2026, with CDI surveillance collecting data only for those aged 2 years and over. This represented a rate of 29.8 cases per 100,000 population (Figure 48 and Table S1 in the accompanying data).
Figure 48. Trends in the rate of CDI, England, by FY April 2007 to March 2026
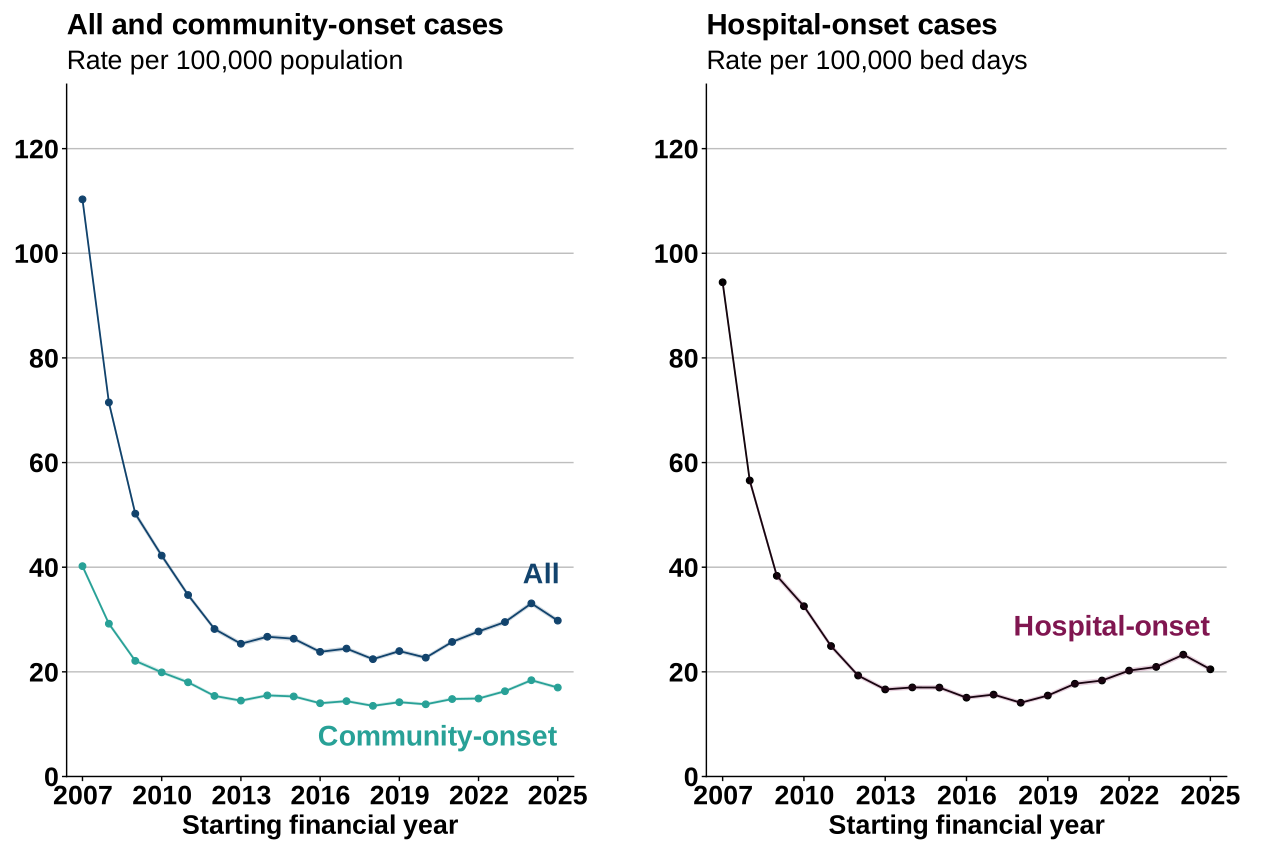
Note 1: shaded bands indicate 95% confidence intervals (CIs).
At the start of surveillance in FY 2007 to 2008, CDI cases were at their highest at 110.3 cases per 100,000 population. This was followed by declining rates for the next 6 years and a plateau from FY 2013 to 2014 to FY 2020 to 2021. Subsequently, the incidence rate increased year-on-year since FY 2020 to 2021 but remained substantially lower than at the start of surveillance. Of note was the 45.7% increase in incidence rate from FY 2020 to 2021 to FY 2024 to 2025. By contrast, FY 2025 to 2026 marks the first year since then where there has been a decrease in rate, with a 10.0% decline compared with the previous year.
In FY 2025 to 2026, there were 7,360 hospital-onset (HO) cases, constituting 43.0% of cases. This represented a rate of 20.5 cases per 100,000 bed-days. Similar to the overall trends in CDI, the HO rate was at its highest at the start of surveillance and then there was a rapid decline. The HO rate then plateaued from FY 2013 to 2014 to FY 2020 to 2021, though since then there were subsequent increases until FY 2024 to 2025. In FY 2025 to 2026, a 12.0% decrease was observed from the previous financial year (Figure 49).
There were 9,754 community-onset (CO) cases, with a rate of 17.0 per 100,000 population. CO cases made up 57.0% of CDI cases. The CO rate followed a similar trend to the overall and HO rates, including a decline in FY 2025 to 2026 compared with the previous financial year (a decrease of 7.7%).
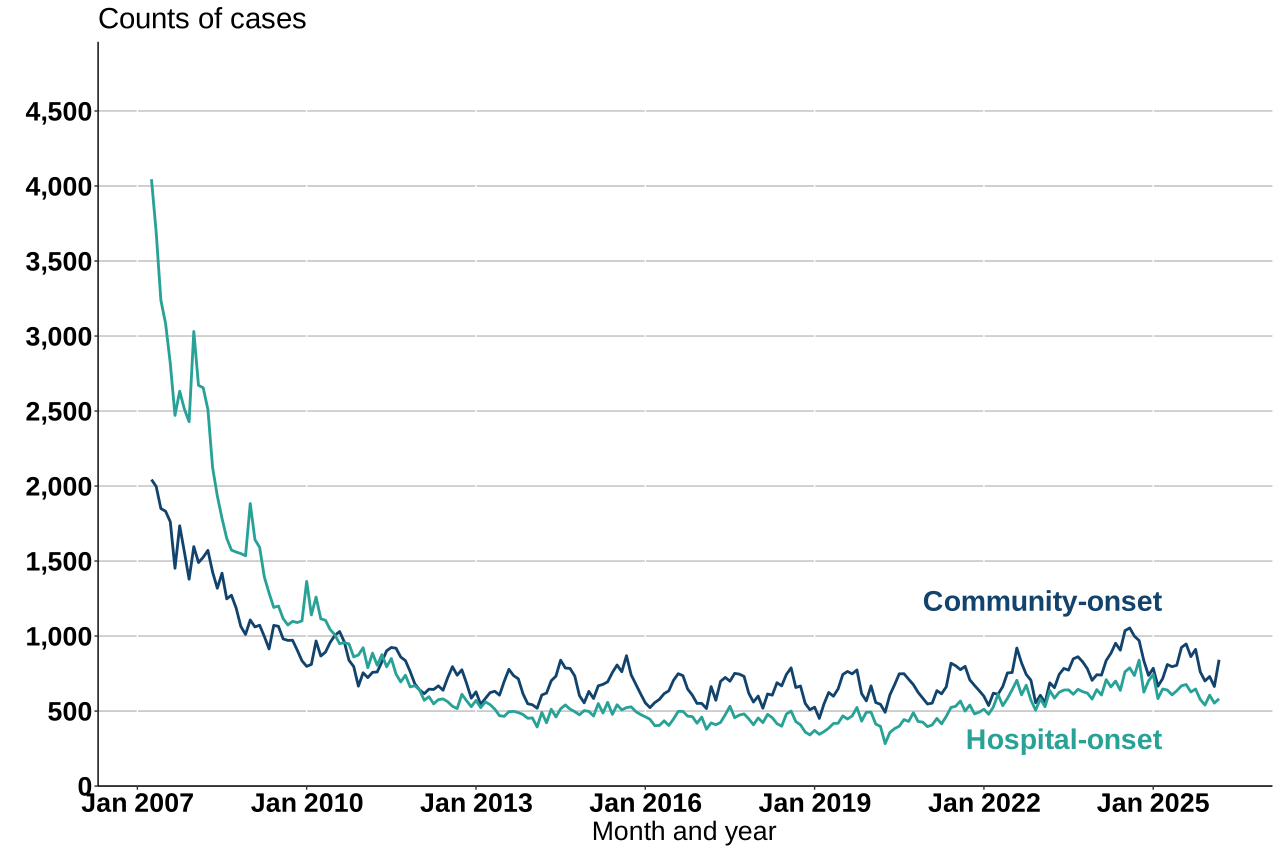
Figure 49. Monthly counts of CDI by onset of infection, England, by FY April 2007 to March 2026
Seasonal trends
There is no clear seasonal trend in HO CDI. In contrast, community-onset (CO) cases typically show a peak in the second quarter of the FY (July to September), with this quarter accounting for nearly one third (28.0%) of cases for FY 2025 to 2026 (Figure 49 and Table S7 in the accompanying data).
Prior trust exposure
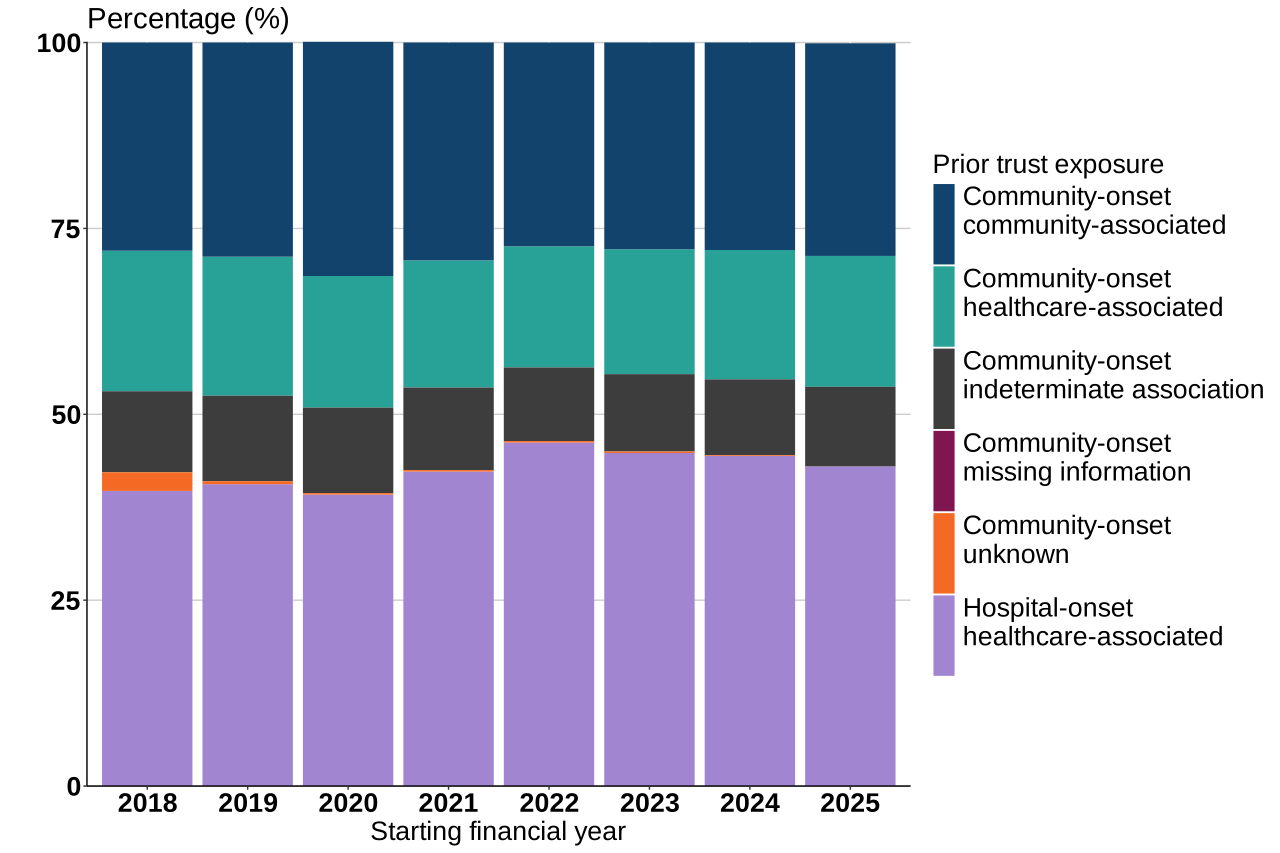
There were 7,360 hospital-onset healthcare-associated (HOHA) cases which was a rate of 20.5 cases per 100,000 bed-days. Compared with the last financial year, this was a slight decrease of 12.0%. Comparisons between years are only made from FY 2020 to 2021, after prior trust exposure fields became mandatory to report (Figure 50 and Table S9 in the accompanying data).
There were 3,019 community-onset healthcare-associated (COHA) cases which was a rate of 7.6 cases per 100,000 bed-days and day-admissions, a decrease of 7.7% since the previous financial year.
There were 4,899 community-onset community-associated (COCA) cases which was a rate of 8.5 cases per 100,000 population, a decline of 7.6% compared with the previous financial year.
There were 1,832 community-onset indeterminate association (COIA) cases, or a rate of 3.2 cases per 100,000 population. This was a decrease of 5.1% compared with the previous year.
Since FY 2018 to 2019 (the first full financial year after prior trust exposure reporting became mandatory for C. difficile) the distribution of cases by prior trust distribution has remained stable. In FY 2025 to 2026, 43.0% of cases were HOHA, 28.6% COCA, 17.6% COHA, and 10.7% COIA.
Figure 50. Proportion of prior trust exposure CDI cases, England, by FY April 2018 to March 2026
Age and sex distribution
In FY 2025 to 2026, the age and sex distribution was broadly similar to FY 2007 to 2008, with those aged 65 years and over making up the largest proportion of cases. The highest proportion of male cases were aged 75 to 84 years, followed by those aged 65 to 74 years. The highest proportion of female cases were aged 75 to 84 years, followed by those aged 85 years and over. However, for female cases, there was a decline in the percentage of cases aged 85 years and over compared with FY 2007 to 2008, from 20.5% to 13.6%.
The proportion of cases for those aged 2 to 14 years increased from 0.3% to 1.1%, and the proportion of cases for those aged 15 to 44 years increased from 2.8% to 6.5% (Figure 51 and Table S2 in the accompanying data).
Figure 51. Age and sex distribution of CDI by percentage, England, by FY April 2007 to March 2026
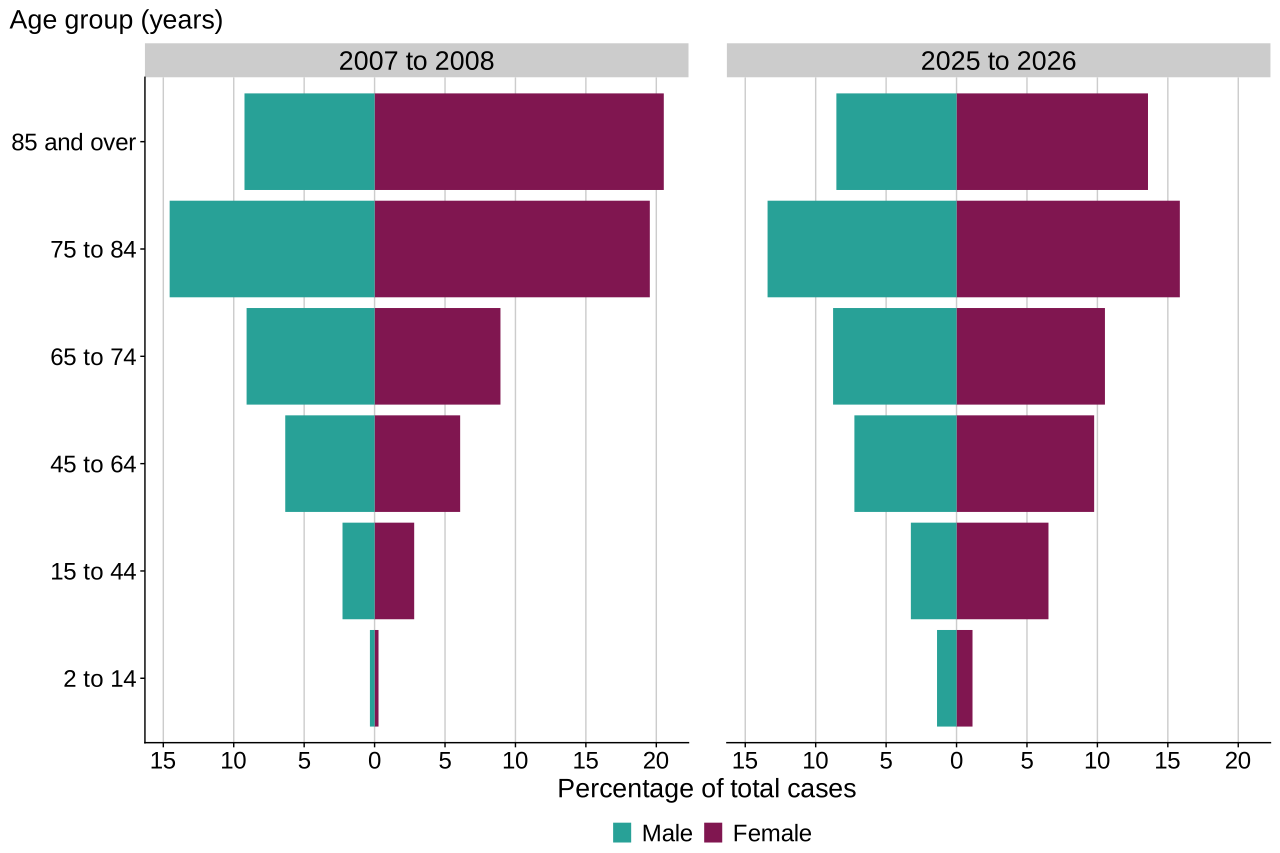
The distribution of cases in males in different age groups has remained more consistent when comparing FY 2007 to 2008 with FY 2025 to 2026. However, the most recent data shows an increase from 0.3% to 1.4% in those aged 2 to 14 years, and a slight decline among those aged 75 to 84 years, from 14.5% to 13.4%.
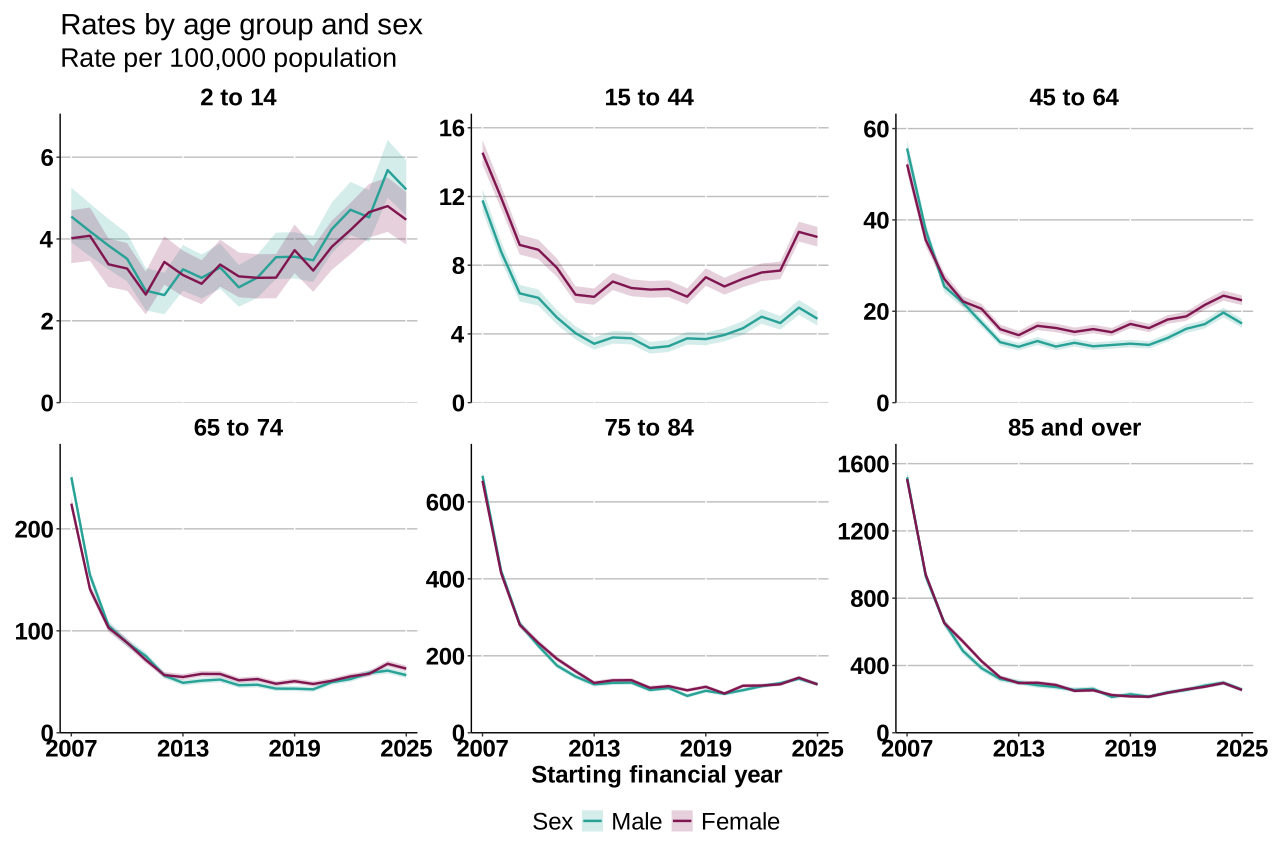
The incidence rates of CDI have reduced across most age groups for both male and female cases between FY 2007 to 2008 and FY 2025 to 2026. In FY 2007 to 2008, the highest rate of CDI was 1,519.3 and 1,508.3 cases per 100,000 population in male and female cases, respectively, in those 85 years and older. In FY 2025 to 2026, this age group still had the highest rate regardless of patient sex. However, the rate has dropped substantially to 256.3 (83.1% decline) and 254.4 cases per 100,000 population (83.1% decline), for male and female cases, respectively (Figure 52).
Figure 52. Trends in age group and sex rates of CDI cases, England, by FY April 2007 to March 2026
Note 1: shaded bands indicate 95% CIs.
Note 2: scales vary across graphs.
While the largest reductions have been observed among older age groups (aged 45 years and over), the exception is with those aged 2 to 14 years. In this age group, a slight increase in the CDI incidence rate has been observed in both male and female cases (from 4.5 to 5.2 cases per 100,000 population for male cases and 4.0 to 4.5 cases for female cases).
However, in FY 2025 to 2026, there was a slight decrease in both CDI cases and incidence rates compared with the previous FY 2024 to 2025. Cases decreased from 2701 to 2326 among females, and from 1690 to 1460 among males. Corresponding rates also decreased in FY 2025 to 2026, from 296.0 to 254.4 in females and 297.3 to 256.3 in males. These rates are still higher than those seen in FY 2020 to 2021.
Trends by ethnicity
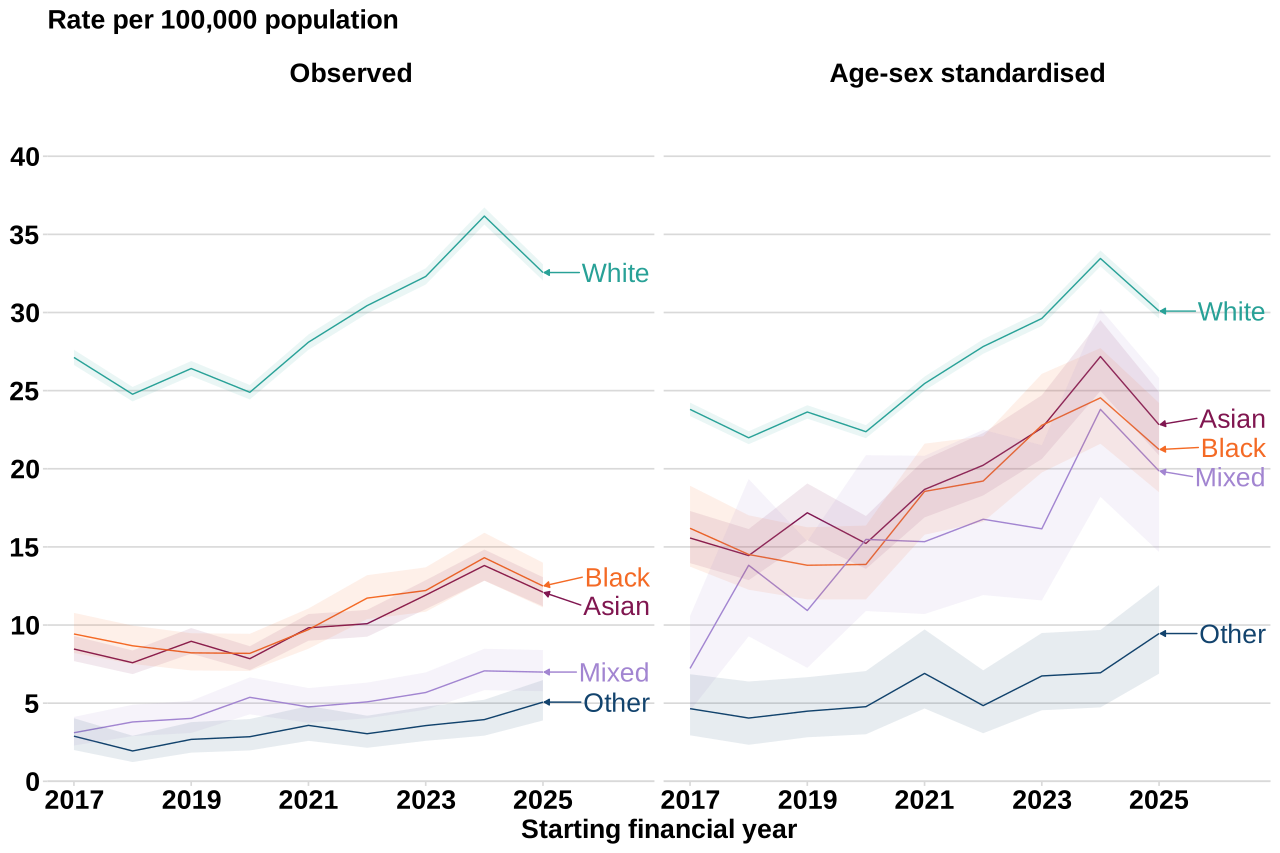
In FY 2025 to 2026, the observed incidence rate of CDI was highest in the White ethnic group (32.6 cases per 100,000 population, which equated to 15,178 cases overall). This was followed by Black (12.5 cases per 100,000 population, or 301 cases overall) and Asian ethnic groups (12.1 cases per 100,000 population, or 663 cases overall). The incidence rate was lowest in the Mixed (7.0 cases per 100,000 population or 114 cases overall) and Other ethnic groups (5.1 cases per 100,000 population, or 63 cases overall). After adjusting for age and sex, the White ethnic group remained highest at 30.1 cases per 100,000 population (Figure 53).
Figure 53. CDI rate by ethnicity, England, by FY April 2017 to March 2026
Note 1: shaded bands indicate 95% CIs.
Trends by deprivation
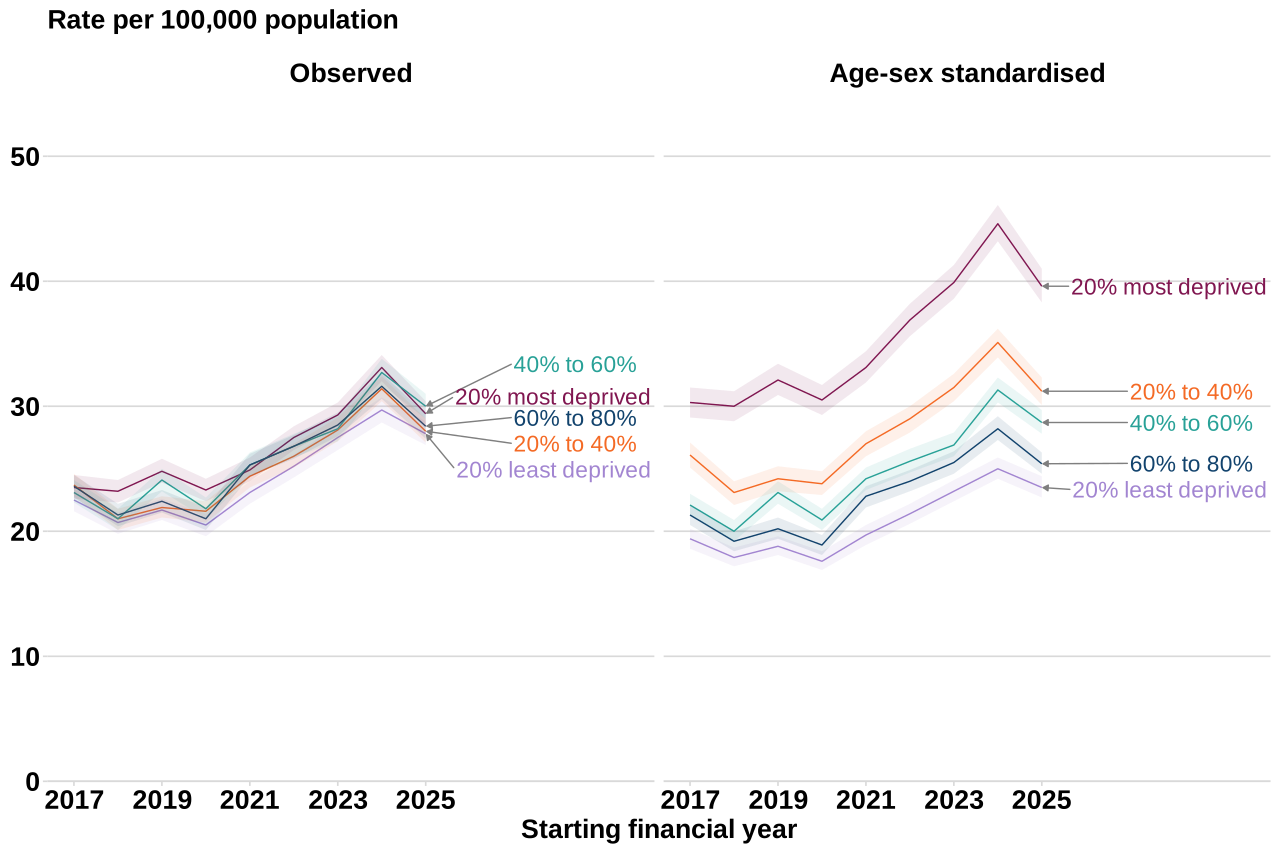
In FY 2025 to 2026, incidence varied little by deprivation, ranging from 29.4 cases per 100,000 among people living in the 20% most deprived areas compared with 27.8 cases per 100,000 people living in the 20% least deprived areas.
Age-sex standardised incidence rates showed greater variation by deprivation, ranging from 39.6 cases per 100,000 population in the 20% most deprived areas to 23.5 cases per 100,000 population in the 20% least deprived areas.
A sustained decrease in incidence rate occurred in the past year across all index of multiple deprivation (IMD) quintiles (Figure 54 and Table S13 in the accompanying data).
Figure 54. CDI rate by deprivation, England, by FY April 2017 to March 2026
Note 1: shaded bands indicate 95% CIs.
Geographic distribution
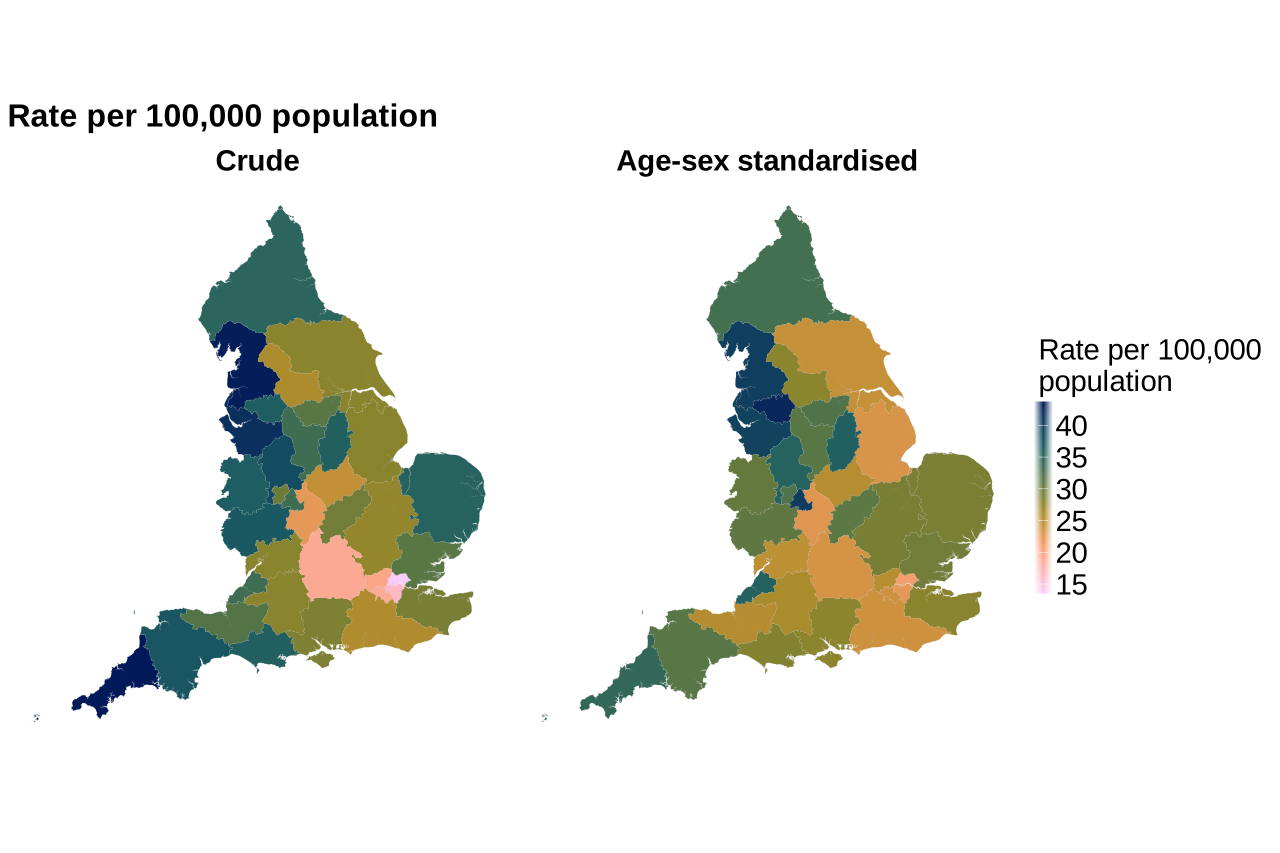
Crude and age-sex standardised rates of CDI are presented across integrated care boards (ICBs) for FY 2025 to 2026. Rates (cases per 100,000 population) were highest in Greater Manchester ICB (42.5), Birmingham and Solihull ICB (40.7), Lancashire and South Cumbria ICB (40.5), and Cheshire and Merseyside ICB (39.9). Rates were lowest in North East London ICB (20.9), South East London ICB (22.1), and Coventry and Warwickshire ICB (22.6) (Figure 55 and Table S6 in the accompanying data).
Figure 55. Geographic distribution of CDI rate, by ICB, England, by FY April 2025 to March 2026
Mortality
Of the 17,114 CDI cases reported in FY 2025 to 2026, mortality information was available for 99.6% (17,053) of cases (Table S9 in the accompanying data). There were 1,984 deaths within 30 days of a CDI, resulting in a case fatality rate (CFR) of 11.6%, the lowest since surveillance began. This was a decrease from 12.7% in FY 2024 to 2025. The mortality rate also decreased from 4.2 to 3.5 deaths per 100,000 population between FY 2024 to 2025 and FY 2025 to 2026 (Figure 56).
Figure 56. Case-fatality rate and mortality rate of CDI, England, by FY April 2007 to March 2026
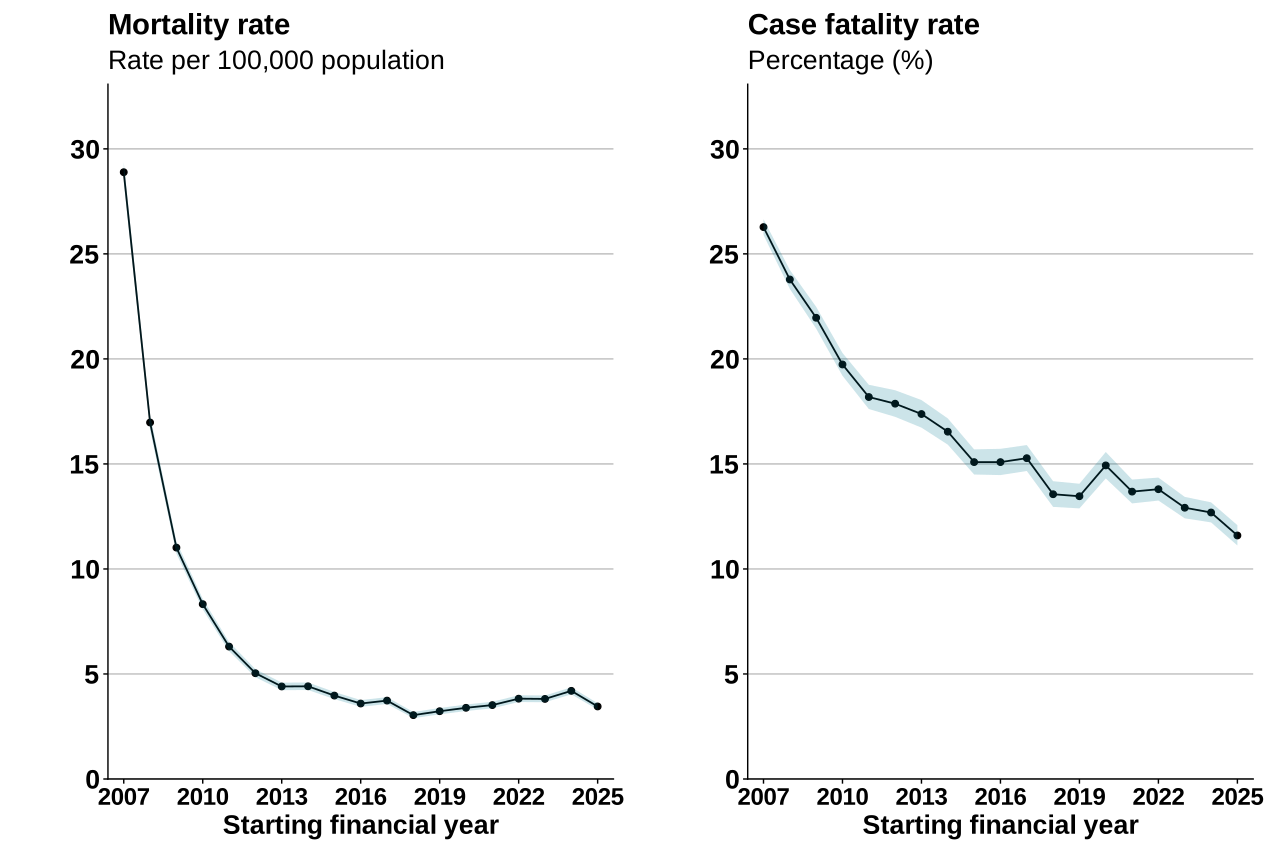
Note 1: shaded bands indicate 95% CIs.
Note 2: scales vary across graphs.
Variation by onset
The mortality rate of CO cases decreased from 1.5 to 1.2 deaths per 100,000 population (836 to 709) between FY 2024 to 2025 and FY 2025 to 2026 (Table S11 in the accompanying data). HO cases also showed a similar decrease with the mortality rate decreasing from 4.3 to 3.6 deaths per 100,000 bed-days (1,571 to 1,276 deaths) between FY 2024 to 2025 and FY 2025 to 2026.
The CFR of HO cases decreased from 18.6% to 17.3% between FY 2024 to 2025 and FY 2025 to 2026, while the CFR of CO cases decreased from 7.9% to 7.3%.
Variation by age and sex
The highest mortality rate in males was in those aged 85 years and over (56.2 deaths per 100,000 population), followed by those aged 75 to 84 years (19.1 deaths per 100,000 population). The corresponding CFRs were 21.9% and 15.1%, respectively (Table S10 in the accompanying data).
The mortality rate and CFR in males aged 85 years and over decreased compared with the previous financial year (74.1 deaths per 100,000 population mortality rate and 24.9% CFR). The mortality and CFR in males aged 75 to 84 years also decreased compared with the previous financial year (25.3 deaths per 100,000 population mortality rate and 18.0% CFR).
Mortality rates were also higher in females in older age groups in FY 2025 to 2026, at 44.3 deaths per 100,000 population among those aged 85 years and over, and 14.9 deaths per 100,000 population among those aged 75 to 84 years. The corresponding CFRs were 17.4% and 11.9%, respectively. Compared with the previous year, mortality rates and CFRs decreased among females in these age groups.
Variation by region
CFRs in FY 2025 to 2026 were highest in the Midlands (12.7%) followed by the North East and Yorkshire (12.5%) and the North West (12.1%). The CFR remained lowest in London at 8.9% and the South West (10.5%) (Table S12 in the accompanying data).
Laboratory stool specimens
On a quarterly basis, NHS acute trusts are mandated to report the total number of stool specimens examined overall, alongside the total number of stool specimens examined for the diagnosis of CDI. The overall rate of stool specimens examined was initially 30.0 per 1,000 population in FY 2010 to 2011. Following a decline during the COVID-19 pandemic, the rate has increased to 34.6 per 1,000 population in FY 2025 to 2026; this is a small decline of 3.0% from the previous year (35.6 per 1,000 population) but is still higher than at the start of surveillance. The decline in the rate of stool specimens examined this year is currently under investigation, as the reduction in the number of trusts reporting during this period may have contributed to the observed decrease (Figure 57 and Table S16 in the accompanying data).
Figure 57. Trends in the rate of overall stool specimens examined and in stool specimens examined for CDI diagnosis, England, by FY April 2010 to March 2026
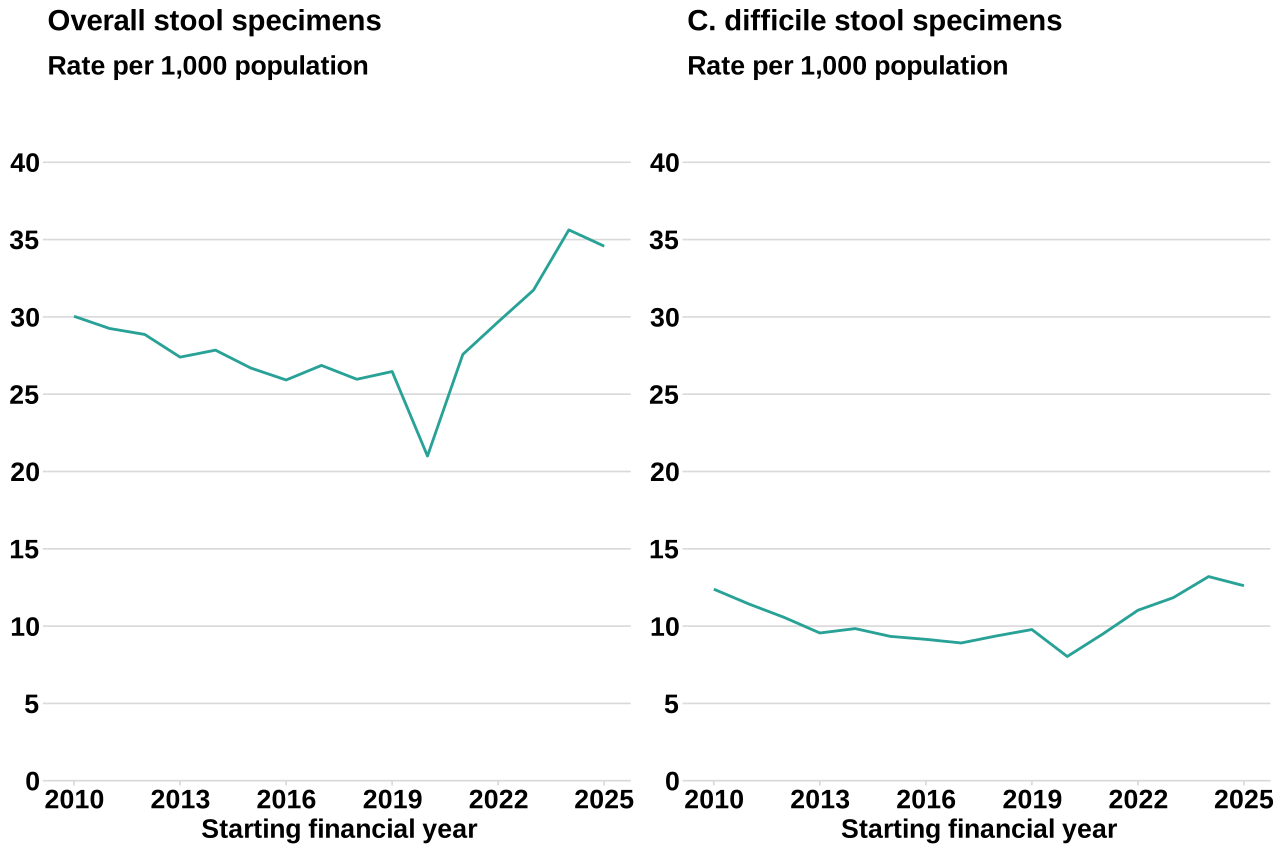
Note 3: trends in stool specimens examined may be influenced by variation in reporting completeness or delayed reporting. For the latest quarter of 2025 to 2026, January to March 2026, 78% (105 out of 134) of NHS acute trusts had reported data at the time of extraction. For the previous 3 quarters of 2025 to 2026, reporting ranged from 90% to 94% of NHS acute trusts.
Between FY 2010 to 2011 and FY 2020 to 2021, the rate of stool specimens examined for CDI diagnosis observed a decreasing trend from 12.4 per 1,000 population to 8.0. Subsequently, the rate has increased to 12.6 per 1,000 population in FY 2025 to 2026. FY 2025 to 2026 has shown a decrease of 4.5% from the previous year (13.2 per 1,000 population), but is still higher than at the start of surveillance.
The positivity of stool specimens examined for CDI diagnosis was defined as the number of CDI cases divided by the total number of stool specimens examined for CDI diagnosis. The positivity of stool specimens examined for CDI has shown minor fluctuations since the start of surveillance, with a higher proportion of positive tests in the first 2 years of surveillance, followed by a slight decline. For FY 2025 to 2026, the proportion of positive CDI tests was 2.3%, slightly lower than the previous FY (2.5%). While the rate of stool specimens examined has increased concurrently with the increase in CDI incidence rates since 2017, this does not appear to have impacted positivity. Positivity has remained relatively stable between 2.3 and 2.8% during this period (Figure 58 and Table S15 in the accompanying data).
Figure 58. Trends in positivity of stool specimens examined for CDI diagnosis, England, by FY April 2010 to March 2026
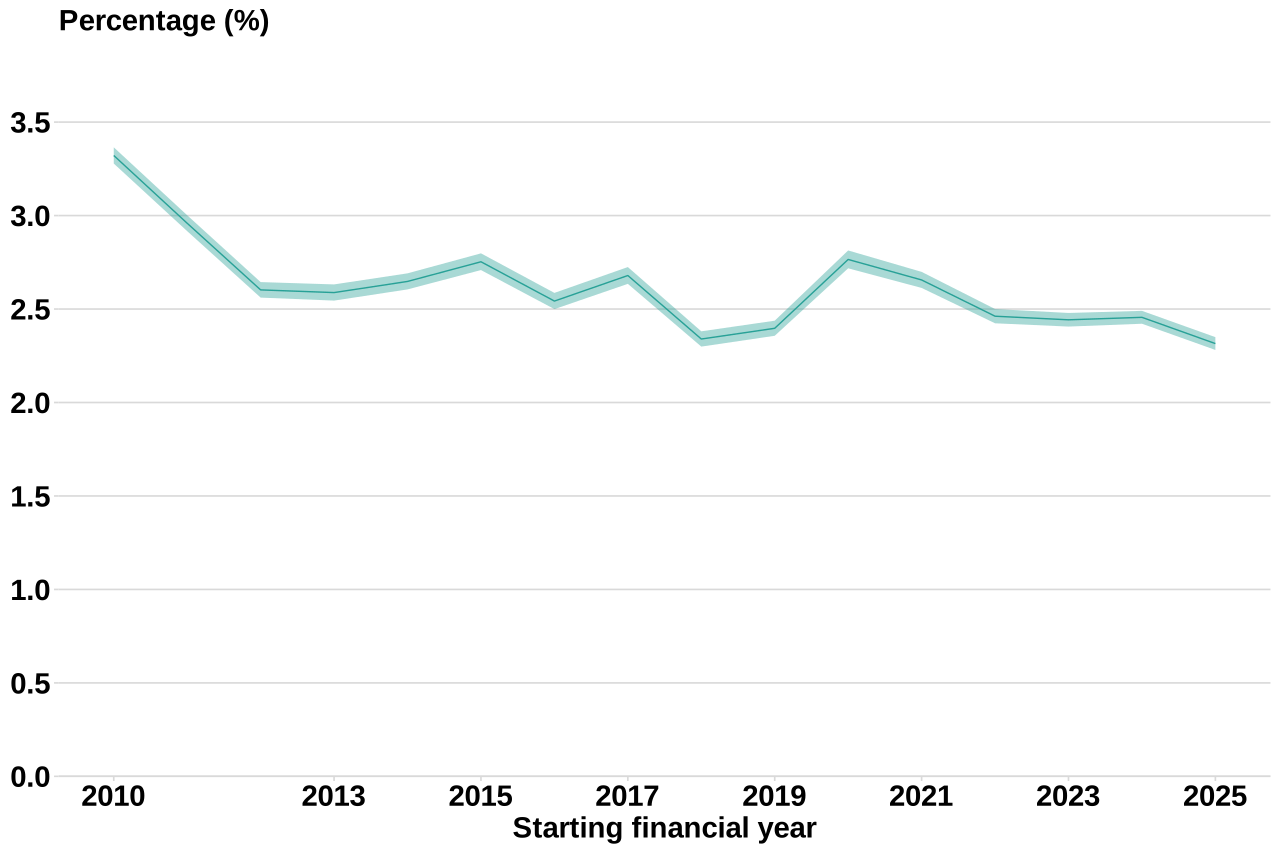
Note 1: shaded bands indicate 95% CIs.
Note 3: trends in stool specimens examined may be influenced by variation in reporting completeness or delayed reporting. For the latest quarter of 2025 to 2026, January to March 2026, 78% (105 out of 134) of NHS acute trusts had reported data at the time of extraction. For the previous 3 quarters of 2025 to 2026, reporting ranged from 90% to 94% of NHS acute trusts.
Clostridioides difficile ribotyping network (CDRN)
Since CDRN surveillance began in FY 2008 to 2009, the ribotype distribution has spanned 791 unique ribotypes. In FY 2025 to 2026, the top 5 most common ribotypes were 002 (11.8%), 015 (11.5%), 014 (10.3%), 005 (8.6%) and 020 (6.7%), accounting for nearly half (48.9%) of all CDI cases.
The distribution of historically dominant ribotypes has changed over the 17 years of surveillance. Ribotypes 027 and 026, which were the 2 most common ribotypes in FY 2008 to 2009, at 37.1% and 12.1%, fell to 0.3% and 1.4%, respectively, in FY 2025 to 2026. However, in the last decade, the proportions of the most frequently encountered ribotypes have remained relatively stable, and the rise in CDI incidence since FY 2020 to 2021 is not explainable by a clonal rise of a single ribotype. The range of ribotypes has also broadened over time (Figure 59 and Table S18 in the accompanying data).
Figure 59. Percentage distribution of top 5 ribotypes in FY 2025 to 2026 from CDI cases that linked to a CDRN sample, England, by FY April 2008 to March 2026
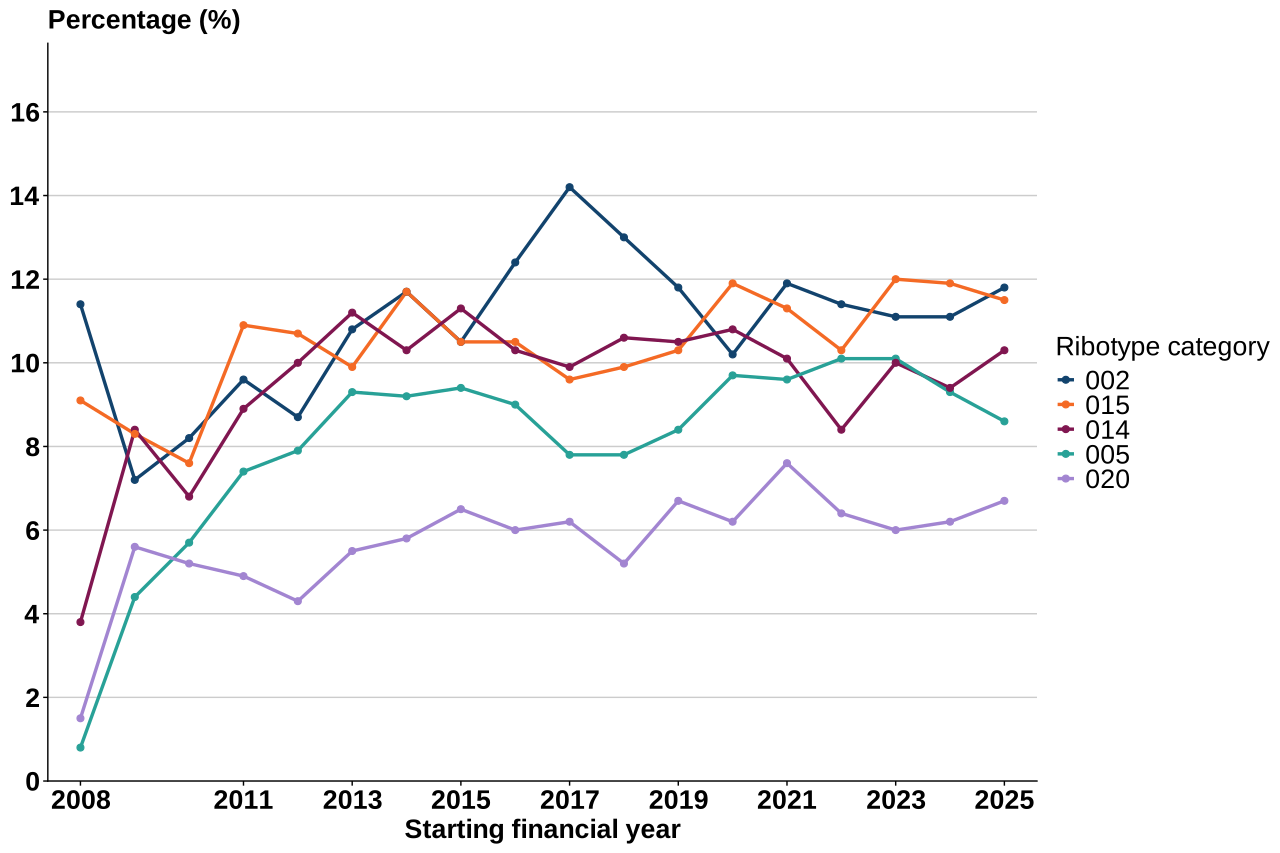
Note 4: to focus on the recent epidemiology of dominant ribotypes, only distinct ribotypes that were among the top 5 most common in FY 2025 to 2026 (002, 015, 014, 005 and 020) are included. Other ribotypes can be studied in Table S18 of the accompanying data, where all 11 ribotypes that have been the top 5 most prevalent in any year since FY 2008 to 2009 are included.
Note 5: these proportions are ‘ribotype-specific’, meaning that for each ribotype it is the proportion of cases infected with that ribotype. If cases are infected with multiple ribotypes, each ribotype will contribute to the numerator of its own ribotype-specific proportions. Therefore, the sum of ribotype-specific proportions will not equal 100%. Recovery of more than one ribotype from a CDI case is rare (approximately 1%), although unless multiple colony picks are individually ribotyped, this rate may be an underestimate.
Note 6: caution is advised when interpreting data in FY 2008 to 2009 due to small numbers of linked cases with a valid ribotype (n = 132).
Figure 60 shows the total number of CDRN samples referred for ribotyping and those CDRN samples that linked to the reported mandatory surveillance CDI cases by financial year from FY 2008 to 2009 to FY 2025 to 2026. Most linked samples tested during the surveillance period returned a single ribotype result (88.3%), with 1.0% returning 2 ribotypes, and 10.8% returning none (“not available”). In FY 2025 to 2026, among cases which linked to CDRN samples, 434 cases (7.0%) did not have any available ribotype result (“not available”), due to reasons including a culture-negative result or logistical issue with the sample (Figure 60 and Table S17 in the accompanying data).
Figure 60. Trends in CDRN samples referred and all linked cases or those with a valid ribotype, England, by FY April 2008 to March 2026
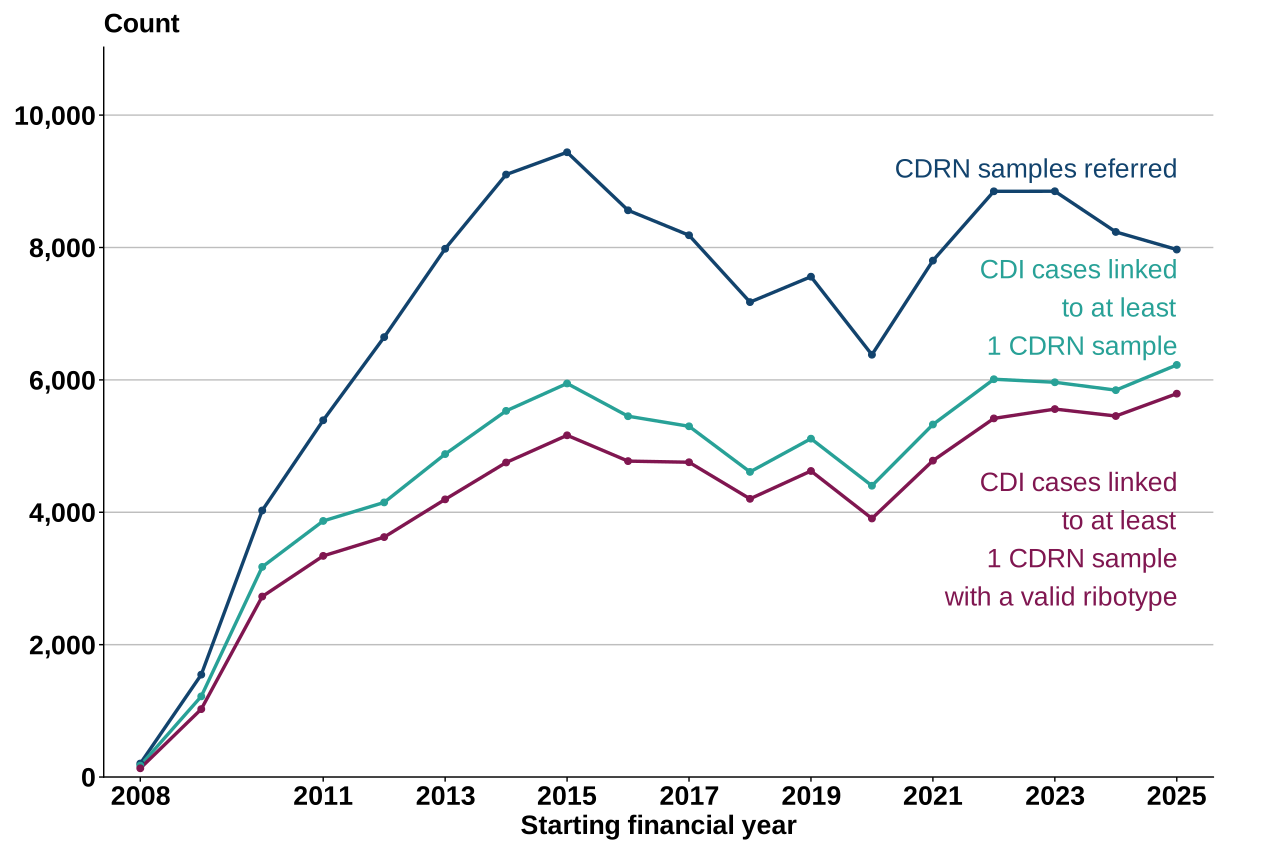
The number of samples referred to the CDRN dropped by 3.2% from 8,235 to 7,969 samples in FY 2025 to 2026 compared with the previous year. This, like the 3.0% decline in the rate of stool specimens examined, was a smaller amount proportionally compared with the 10.0% fall in CDI rates from the previous year.
The percentage of CDI cases that linked to CDRN samples increased to 36.4% in FY 2025 to 2026 from 30.8% in the previous year. For those CDI cases that could be linked to a CDI sample (n = 6,226), 93.0% had a valid ribotype result (n = 5,792). Similar to last year, this result is an all-time high since records began in FY 2008 to 2009.
CDI overview of trends
This year (FY 2025 to 2026) has marked the first annual decline in CDI incidence since FY 2020 to 2021, with reductions observed for overall, community-onset (CO), and hospital-onset (HO) rates. Prior to this, CDI rates had increased steadily year-on-year since FY 2020 to 2021. Further analysis and discussion of the increase can be found in the CDI technical report.
Historically, rates fell rapidly between FY 2007 to 2008 and FY 2013 to 2014, until FY 2021 to 2022 there were relatively stable rates of all reported cases. These sharp declines in CDI rates were in part due to initiatives introduced by the NHS and the Department of Health and Social Care (DHSC) in 2007 which included the use of personal protective equipment, cohort nursing and environmental decontamination. Previously, CDI was also primarily an issue within the hospital setting, with 63.6% of cases in FY 2007 to 2008 defined as hospital-onset (HO). Many CDI control measures were targeted at the hospital setting, and as a result the sharp decline in rates disproportionately affected HO infections. CO cases now constitute the greatest proportion of total CDI cases for FY 2025 to 2026 (57.0%).
Rates of CDI are highest among older age groups, and the highest proportion of CDI cases are aged 75 to 84 years for both males and females. However, the proportion of CDI cases aged over 75 years has decreased for males and females, while the proportion aged between 2 to 14 years and 15 to 44 years has increased. There is little difference in the rates of CDI between males and females, although in general incidence in females was higher.
Historically, northern regions of England saw higher rates of CDI compared with southern regions. In FY 2025 to 2026, the North West remains an area of high incidence. More deprived regions in England observed higher rates of CDI. By ethnicity, the White ethnic group continued to experience the highest rates of CDI over the surveillance period.
In FY 2025 to 2026, the case fatality rate (CFR) was 11.6%, which continued the overall decreasing trend in CFR since the start of surveillance. The mortality rate was 3.5 deaths per 100,000 population, a decrease since the previous financial year and a reversal of the previous increases in mortality rate witnessed since FY 2018 to 2019.
The rate of stool specimens examined for CDI diagnosis was 12.6 per 1,000 population, which marked a decrease since the previous financial year, but remains higher than that observed at the start of surveillance.
Finally, despite the changes in CDI incidence over the period, UKHSA data has shown no significant changes in C. difficile ribotypes in the last 7 years.
New and future work
All investigations named below are being conducted by, or in affiliation with, UKHSA colleagues. There is also a wide variety of research being conducted by other academic institutes and bodies, and within the devolved nations.
There is a detailed investigation underway on the increase in CDI from FY 2021 to 2022 to FY 2024 to 2025, investigating the role of comorbidities, AMR and prescribing trends on CDI prevalence, as well as the subsequent decline in CDI observed. In addition, a project with University of Oxford Health Protection Research Unit (HPRU) in Healthcare Associated Infections and Antimicrobial Resistance is exploring how sampling rates for CDI and E. coli influence reported infection rates, aiming to model the ‘ideal’ testing rate based on case-mix in acute NHS trusts.