Epidemiological analysis of Gram-negative, MRSA and MSSA bacteraemia
Published 24 September 2026
Applies to England

© Crown copyright 2026
This publication is licensed under the terms of the Open Government Licence v3.0 except where otherwise stated. To view this licence, visit nationalarchives.gov.uk/doc/open-government-licence/version/3 or write to the Information Policy Team, The National Archives, Kew, London TW9 4DU, or email: psi@nationalarchives.gov.uk.
Where we have identified any third party copyright information you will need to obtain permission from the copyright holders concerned.
This publication is available at https://www.gov.uk/government/statistics/gram-negative-mrsa-and-mssa-bacteraemia-and-c-difficile-infections-annual-epidemiological-commentary-2025-to-2026/epidemiological-analysis-of-gram-negative-mrsa-and-mssa-bacteraemia
Further information on Gram-negative, meticillin-resistant Staphylococcus aureus (MRSA) and meticillin-sensitive Staphylococcus aureus (MSSA) bacteraemia is reported here.
Additional information for C. difficile infections is found at Epidemiological analysis of C. difficile infections.
The Glossary, data sources, and further information for the annual epidemiological commentary up to and including financial year 2025 to 2026 is also available separately.
Epidemiological analysis of Gram-negative organisms: Escherichia coli bacteraemia
Total reports
A total of 44,879 Escherichia coli (E. coli) bacteraemia cases were reported by NHS acute trusts in England in financial year (FY) 2025 to 2026. This corresponded to an incidence rate of 76.6 cases per 100,000 population, a 2.6% increase from FY 2024 to 2025. E. coli rates have increased consistently from FY 2012 to 2013, except for the decline seen during the COVID-19 pandemic period (FY 2020 to 2021 to FY 2022 to 2023). Since the start of surveillance in FY 2012 to 2013, the incidence rate has increased by 26.8% (Figure 1 and Table S1 in the accompanying data).
Figure 1. Trends in the rate of E. coli bacteraemia, England, by FY April 2012 to March 2026
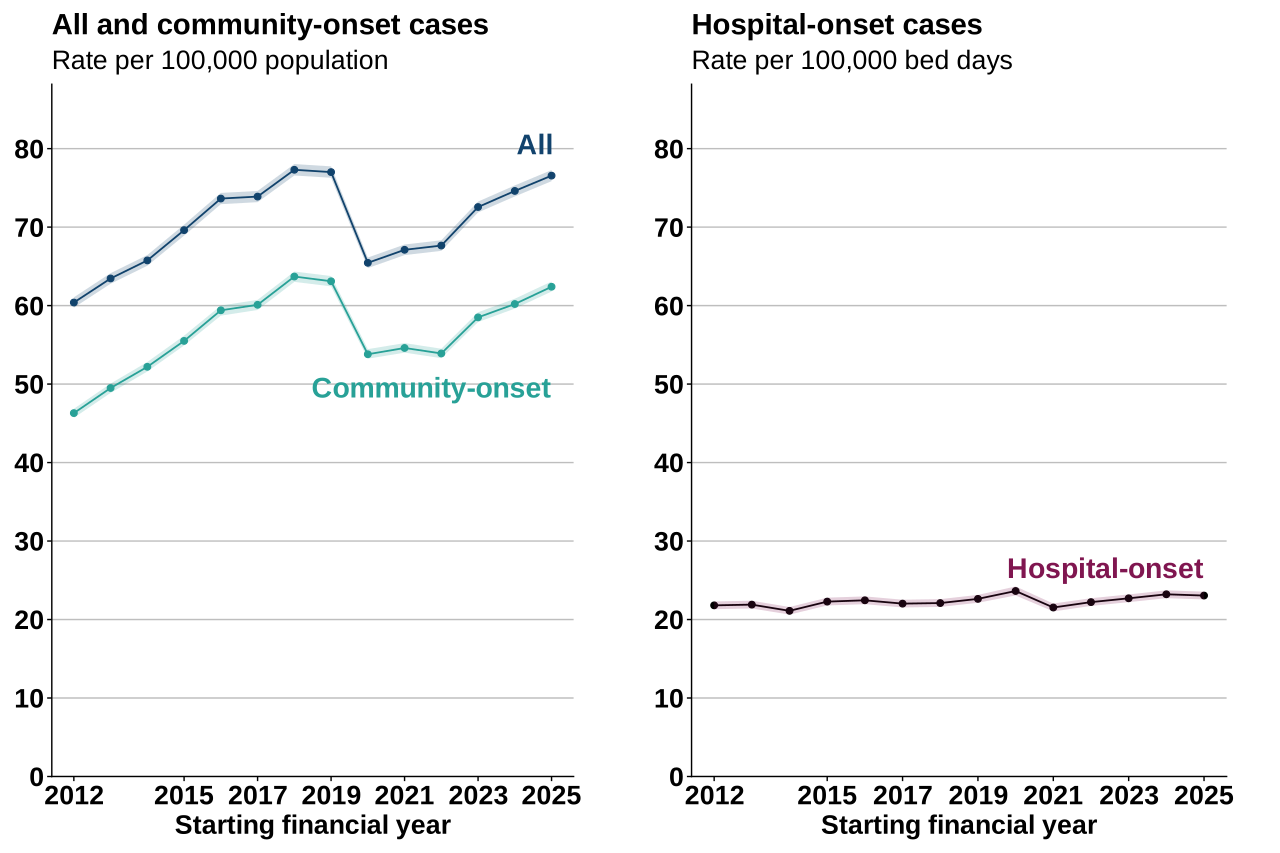
Note 1: shaded bands indicate 95% confidence intervals (CIs)
Hospital-onset (HO) cases accounted for 18.5% of cases in FY 2025 to 2026 (ranging from 17.6% to 23.4% across the surveillance period). The rate of HO E. coli bacteraemia has shown some variability, with minor increases and decreases from FY 2018 to 2019 onwards, with a rate of 23.1 cases per 100,000 bed-days in FY 2025 to 2026.
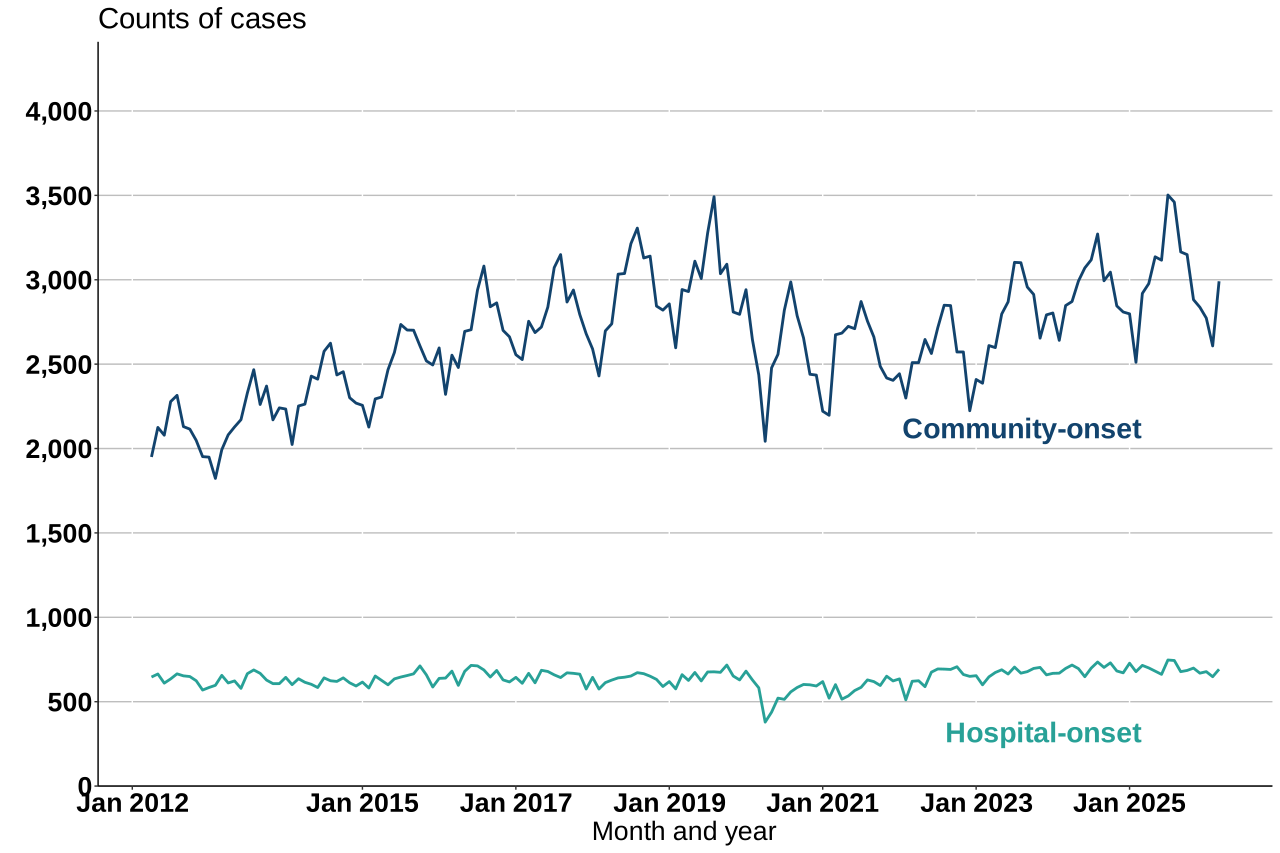
Community-onset (CO) cases accounted for 81.5% of cases in FY 2025 to 2026 (ranging from 76.6% to 83.3% across the surveillance period). Aside from a decline during the COVID-19 pandemic period, the rate of CO E. coli bacteraemia has increased year-on-year since the start of surveillance. This was an increase from 46.3 to 62.4 cases per 100,000 population between FY 2012 to 2013 and FY 2025 to 2026, a 3.6% increase compared with the previous year. This increase was also reflected in case counts, with 36,596 CO cases reported in FY 2025 to 2026, from 35,243 in the previous year (Figure 2).
Figure 2. Monthly counts of E. coli bacteraemia by onset of infection, England, by FY April 2012 to March 2026
Seasonal trends in E. coli bacteraemia
Seasonality was assessed as the number of cases each quarter as a percentage of total cases for the FY. This analysis was performed separately for HO and CO cases. In general, CO E. coli cases peak in summer (July to September) and decline in winter, a trend that has not changed since April 2012 (Figure 2 and Table S7 in the accompanying data).
Prior trust exposure
In FY 2025 to 2026, there were 8,283 cases of hospital-onset healthcare-associated (HOHA) E. coli bacteraemia, corresponding to an incidence rate of 23.1 cases per 100,000 bed-days and showing little change from the previous year (23.2) (Table S8 in the accompanying data).
The incidence rate of community-onset healthcare-associated (COHA) E. coli bacteraemia was 16.6 cases per 100,000 bed-days and day admissions, a 6.1% increase from the previous year (15.6).
The incidence rate of community-onset community-associated (COCA) E. coli bacteraemia was 51.1 cases per 100,000 population in FY 2025 to 2026, an increase of 3.4% compared with the previous year (49.5).
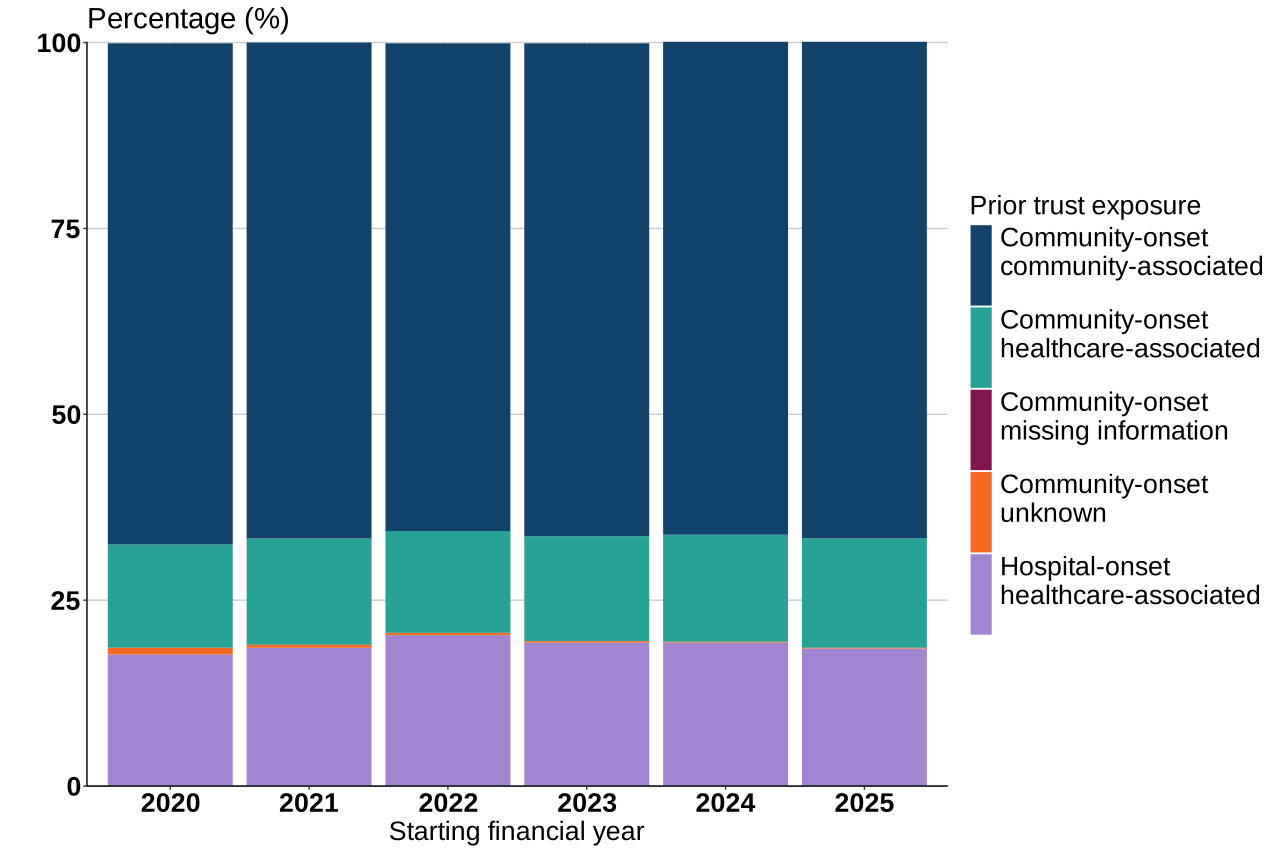
Since FY 2020 to 2021, the first full FY after prior trust exposure reporting became mandatory for E. coli, the distribution of cases by prior trust exposure has remained stable. In FY 2025 to 2026, 66.8% of cases were COCA, 14.7% COHA and 18.5% HOHA (Figure 3).
Figure 3. Proportion of prior trust exposure of E. coli bacteraemia cases, England, by FY April 2020 to March 2026
Age and sex distribution
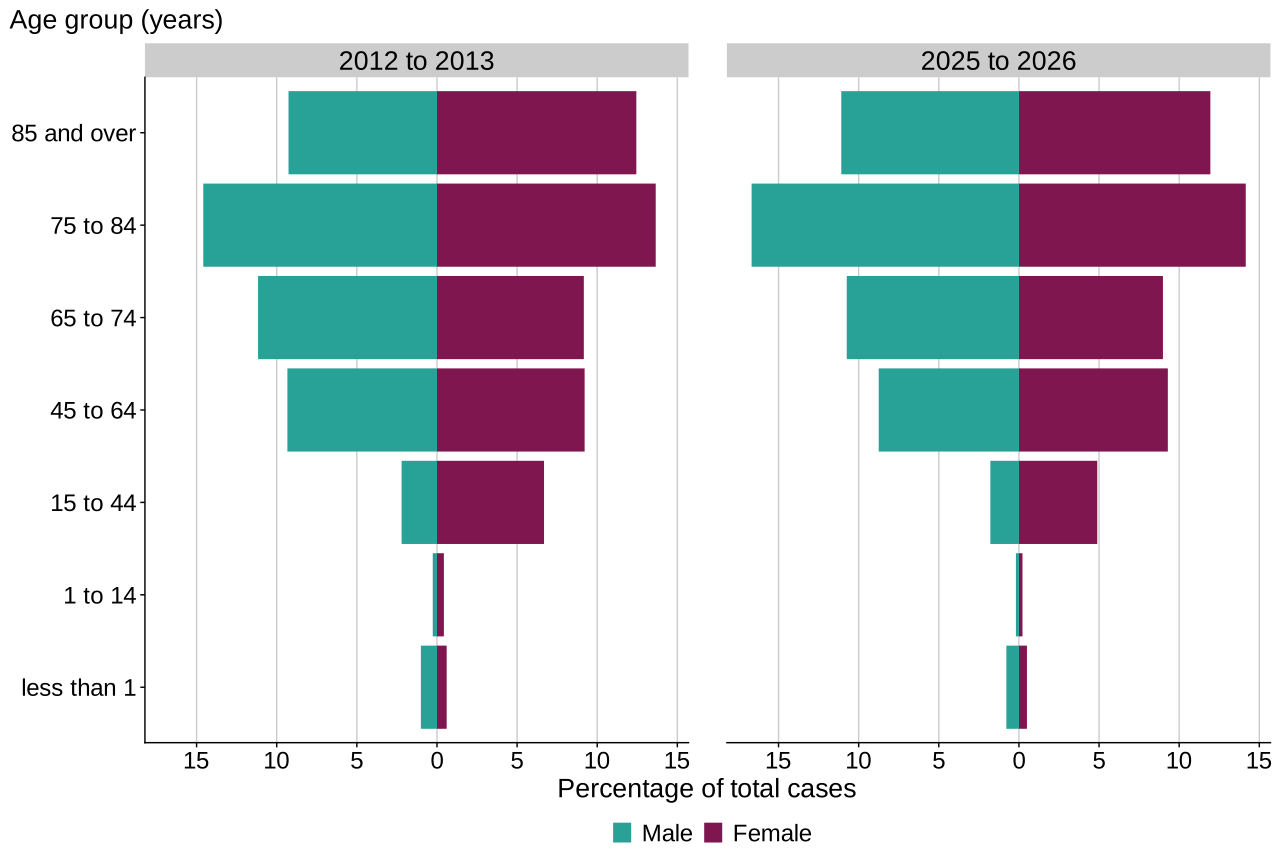
Broadly, the age and sex distribution of E. coli cases was similar in FY 2025 to 2026 compared with the start of surveillance. The greatest burden of infection remains in adults aged 45 years and over. Within this demographic, male and female cases aged 75 to 84 years have the highest proportion of cases, comprising 16.7% and 14.2% of total cases (FY 2025 to 2026) respectively. Among those aged 15 to 44 years, the number of cases was approximately 3 times higher in female than in male cases (Figure 4 and Table S2 in the accompanying data).
Figure 4. Age and sex distribution of E. coli bacteraemia by percentage of cases, England, by FY April 2012 to March 2026
The E. coli bacteraemia incidence rate increased in most age groups for both male and female cases between FY 2012 to 2013 and FY 2025 to 2026. Over the past 5 years, increasing rates have been seen particularly in those over 45 years, for both male and female cases (Figure 5).
Figure 5. Trends in age group and sex rates of E. coli bacteraemia, England, by FY April 2012 to March 2026
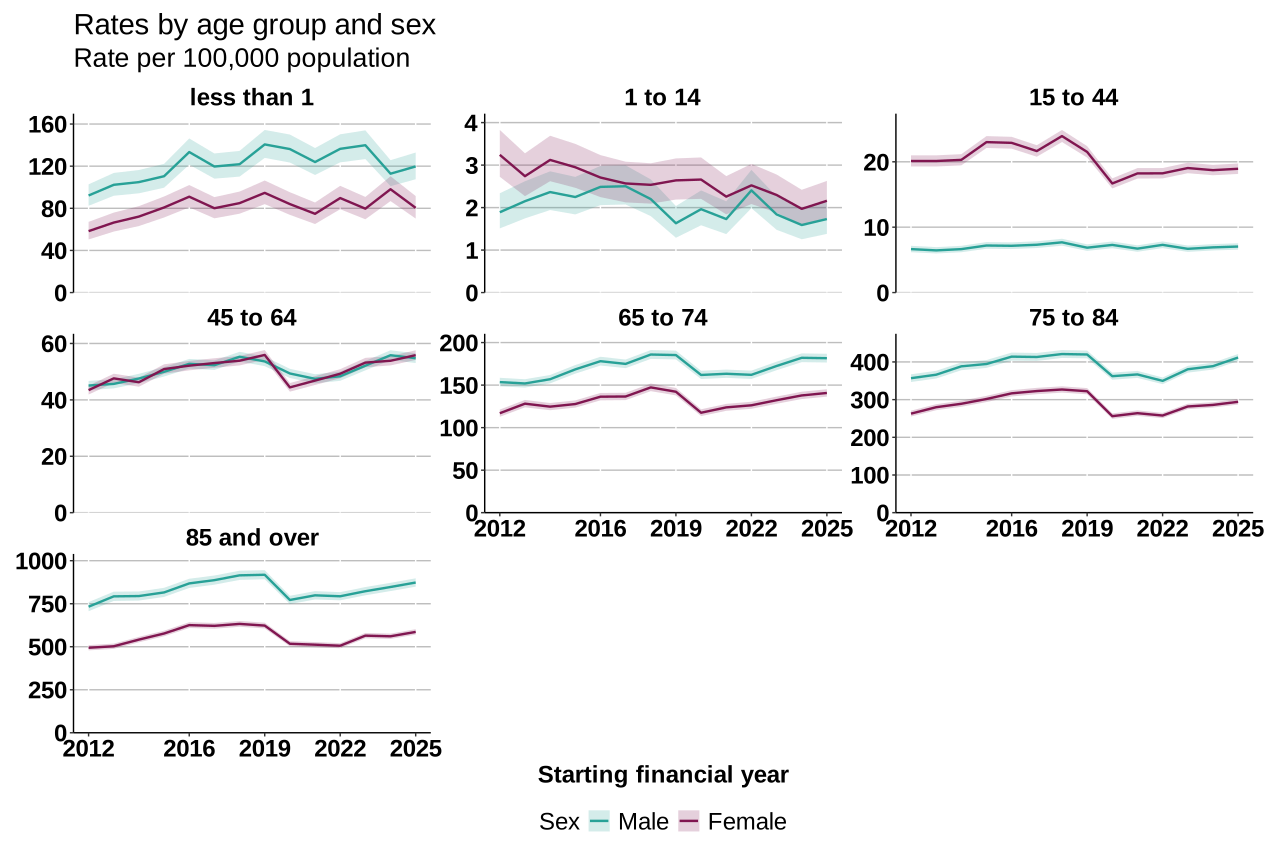
Note 1: shaded bands indicate 95% CIs.
Note 2: scales vary across graphs.
In FY 2025 to 2026, the rate of E. coli bacteraemia was highest in individuals aged 85 years and over, which was seen in both male (873.2 per 100,000 population) and female (586.3 per 100,000 population) cases. In individuals aged 65 years and over, male cases experienced higher rates of E. coli bacteraemia, and the differences in rates between male and female cases increased with increasing age.
Trends by ethnicity
In FY 2025 to 2026, the incidence rate of E. coli bacteraemia was highest in the White ethnic group (79.0 cases per 100,000 population), followed by the Asian and Black ethnic groups (54.6 and 52.9 cases per 100,000 population respectively). It was lowest in the Other and Mixed ethnic groups (19.9 and 20.2 cases per 100,000 population, respectively) (Figure 6 and Table S14 in the accompanying data).
Figure 6. E. coli bacteraemia rate by ethnicity, England, by FY April 2017 to March 2026
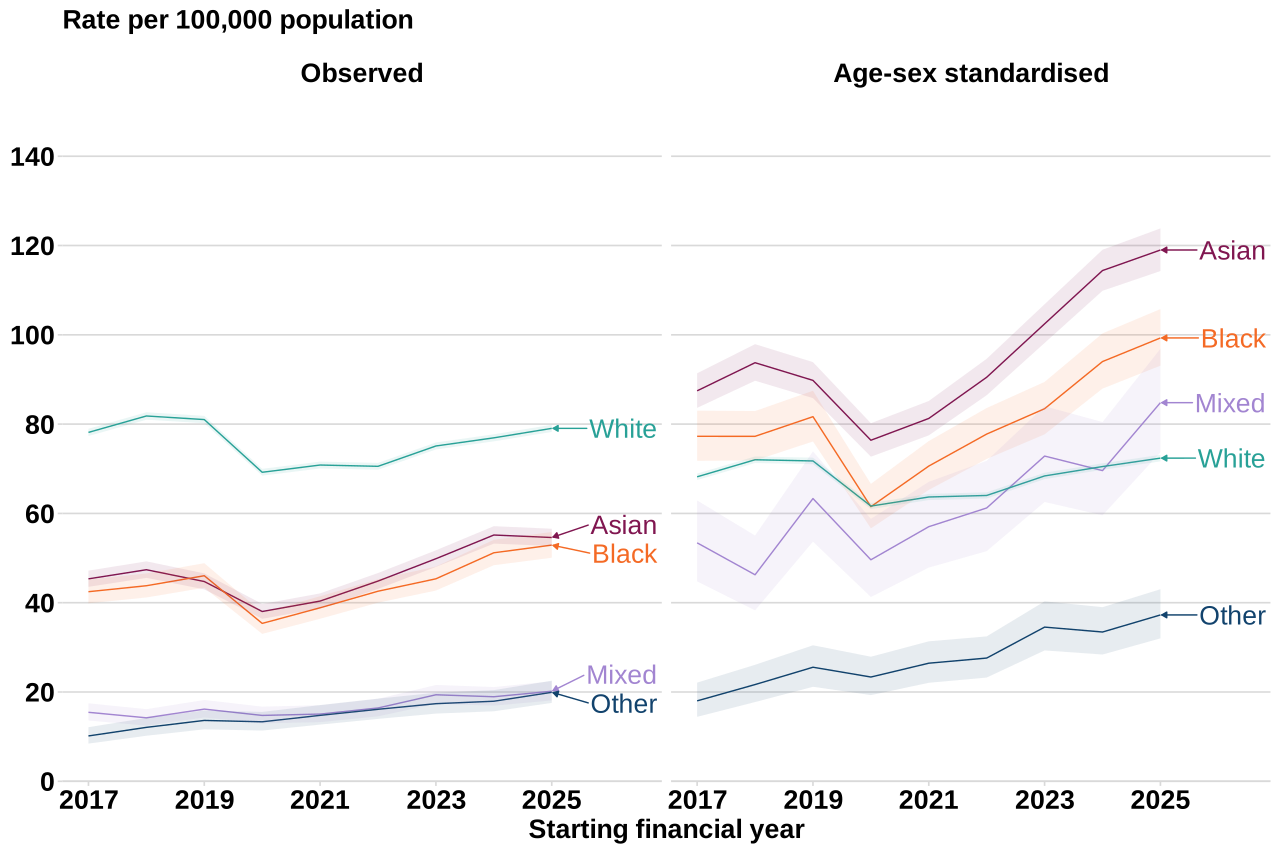
Note 1: shaded bands indicate 95% CIs.
The Asian and Black ethnic groups had the highest age-sex-standardised rates (119.0 and 99.3 cases per 100,000 population, respectively) in FY 2025 to 2026, while the White ethnic group had the lowest (72.4 cases per 100,000 population). This trend follows previous years, but notably since FY 2020 to 2021, the rates in the Asian, Black and Mixed ethnic groups (increases of 55.8%, 61.5%, and 71.0%, respectively) increased to a greater extent compared with the White ethnic group (increase of 17.5%).
Trends by deprivation
In FY 2025 to 2026, there was little variation in incidence by deprivation. Overall, 75.4 cases occurred per 100,000 people living in the 20% most deprived areas and 68.2 per 100,000 in the 20% least deprived areas (Figure 7 and Table S13 in the accompanying data).
Figure 7. E. coli bacteraemia rate by deprivation, England, by FY April 2017 to March 2026
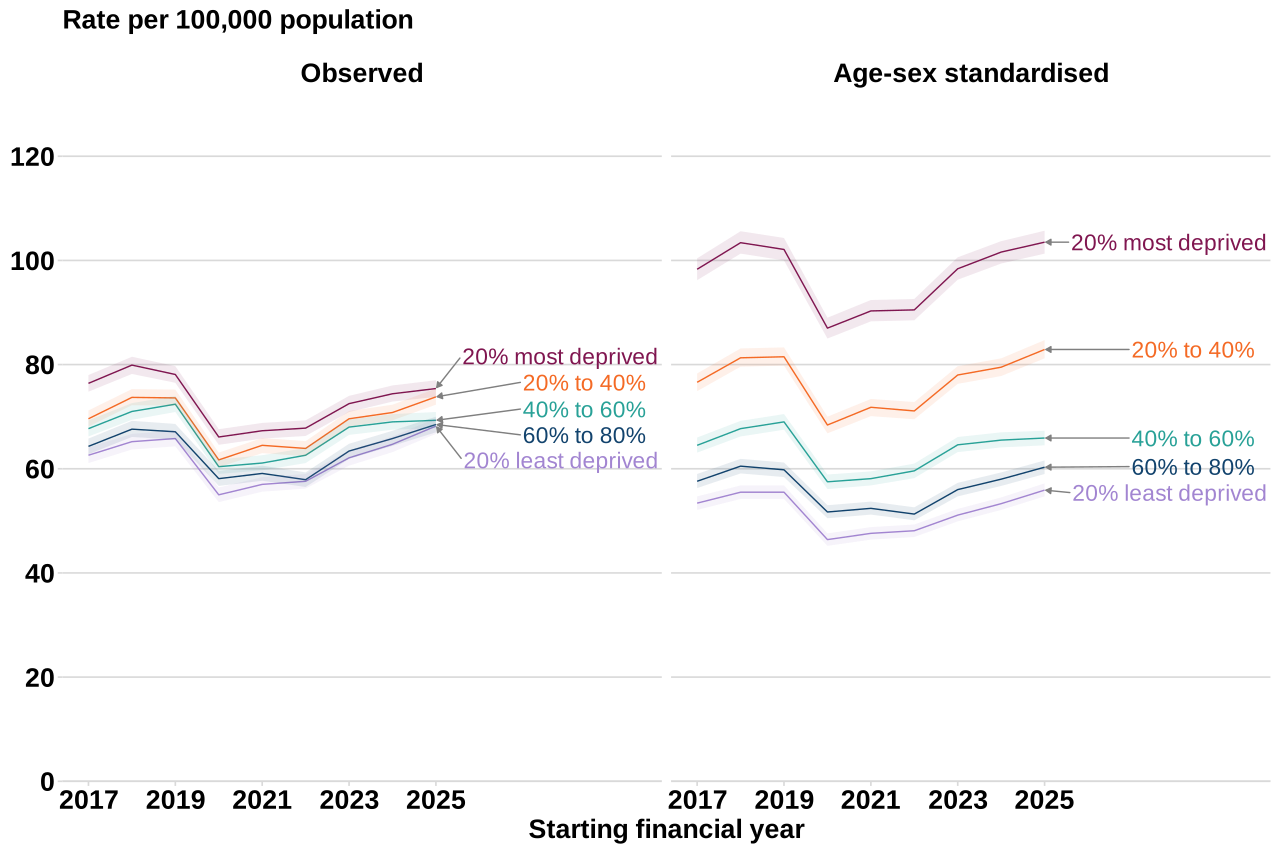
Note 1: shaded bands indicate 95% CIs.
There was much greater variation by deprivation in the age-sex-standardised incidence rates of E. coli bacteraemia than the observed incidence rates. For the age-sex-standardised rates, 103.5 cases occurred per 100,000 people living in the 20% most deprived areas, almost double the rate in the 20% least deprived areas (55.9 per 100,000). All index of multiple deprivation (IMD) quintiles have seen increases in age-sex-standardised rates of E. coli bacteraemia in the last year. There has been a consistent ordering of age-sex-standardised E. coli bacteraemia rates by increasing deprivation since FY 2017 to 2018.
Primary focus of E. coli bacteraemia
The provision of data on the most likely primary focus of E. coli bacteraemia is voluntary. The percentage of cases where this information has been provided has declined over time from 85.5% (n = 27,610) in FY 2012 to 2013 to 48.1% (n = 21,608) in FY 2025 to 2026. Also, the percentage of records for which the primary focus was reported as unknown has decreased from 20.2% in FY 2012 to 2013 to 14.0% in FY 2025 to 2026 (Table S4 in the accompanying data).
Of cases with a reported primary focus of infection, the urinary tract has consistently been the most frequent primary focus for E. coli bacteraemia cases since the start of surveillance. In FY 2025 to 2026, 48.6% (n = 10,497) of cases reported a most likely primary focus of urinary tract, similar (48.9% of cases) to FY 2012 to 2013.
Hepatobiliary as a primary focus has slightly increased between FY 2012 to 2013 and FY 2025 to 2026, from 13.6% to 16.0%. All other reported primary focus percentages have remained relatively unchanged between FY 2012 to 2013 and FY 2025 to 2026, apart from an increase from 3.8% to 6.1% for respiratory tract.
In FY 2025 to 2026, as in previous years of surveillance, the primary focus of E. coli bacteraemia also varied according to time-to-onset (duration between hospital admission and date of a positive specimen). Urinary tract as the primary focus was the most reported of all the time-to-onset groups. The percentage of cases where urinary tract was the primary focus varied by time-to-onset, with this focus responsible for 51.8%, 34.3% or 39.7% for cases fewer than 2 days versus 2 to 6 days and 7 days or greater, respectively (Table S5 in the accompanying data).
Geographic distribution
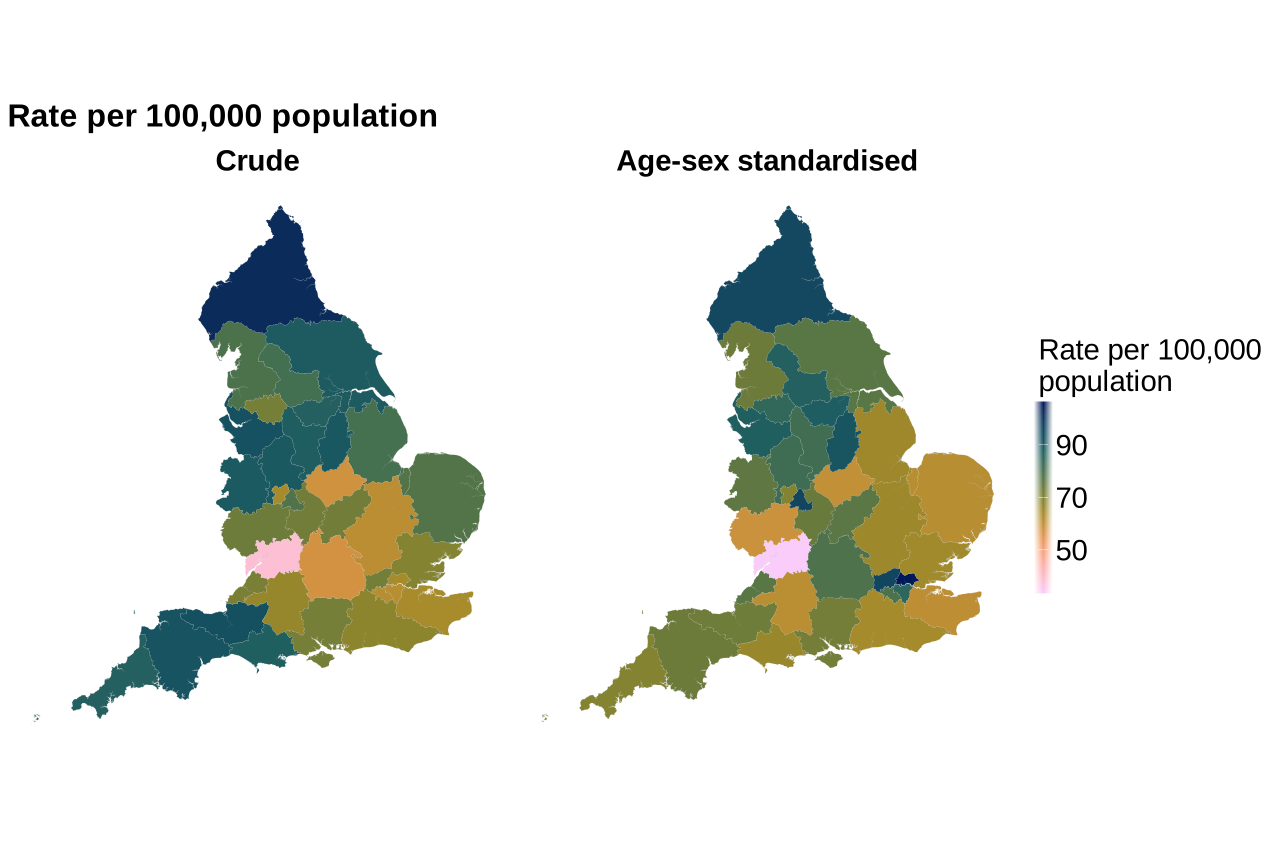
There was considerable geographical variation in crude and age-sex-standardised rates across integrated care boards (ICBs) in FY 2025 to 2026. Age-sex-standardised rates (cases per 100,000 population) were highest in the London, northern and Midlands regions, specifically North East London ICB (106.3), Birmingham and Solihull ICB (96.6), West and North London ICB (96.0), and North East and North Cumbria ICB (95.4) (Table S6 in the accompanying data). The lowest age-sex-standardised incidence rates were seen in Gloucestershire ICB (33.5), Herefordshire and Worcestershire ICB (59.1), Leicester, Leicestershire and Rutland ICB (60.2), and Kent and Medway ICB (61.2) (Figure 8).
Figure 8. Geographic distribution of E. coli bacteraemia rate, by ICB, England, by FY April 2025 to March 2026
Mortality
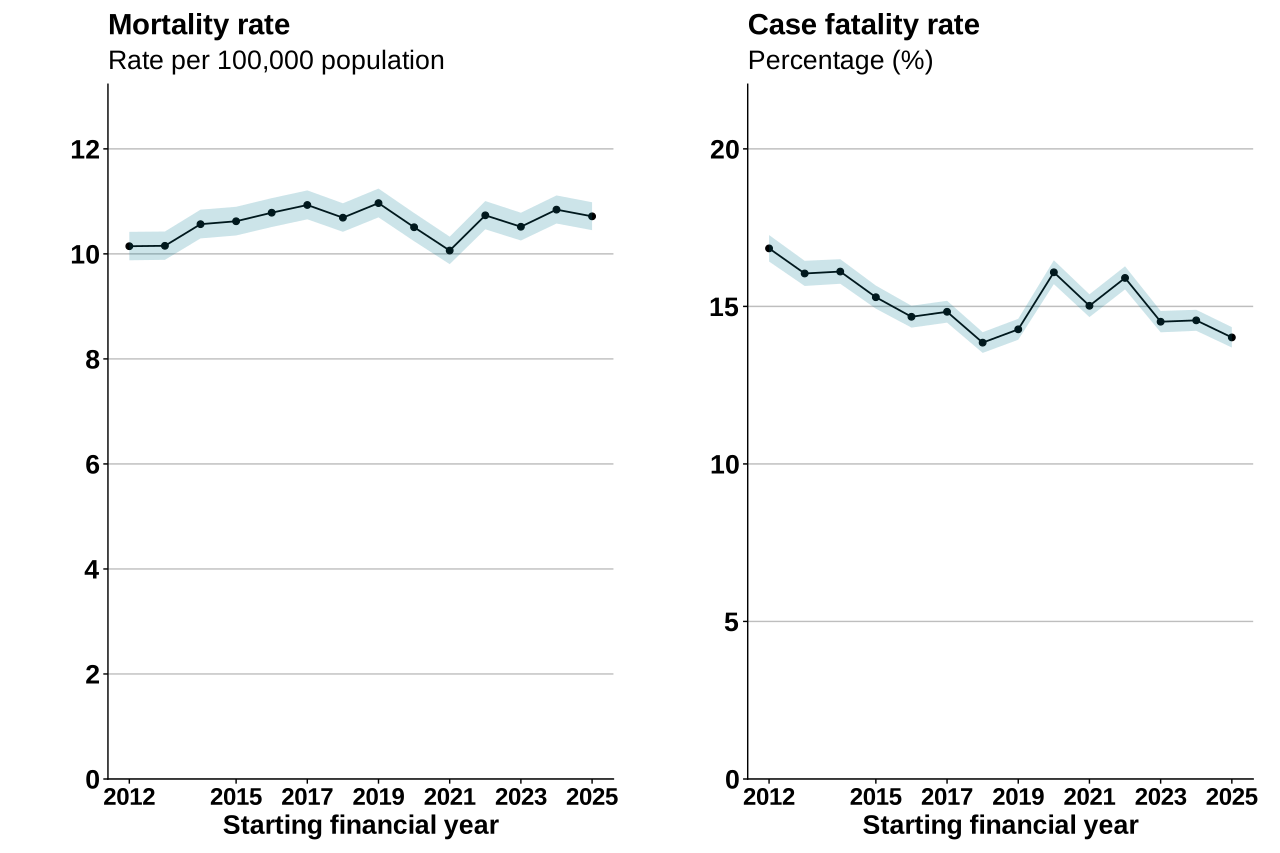
In FY 2025 to 2026, 44,879 E. coli bacteraemia cases were reported in England. Information on mortality was available for 99.2% (44,531) of these cases (Table S9 in the accompanying data). There were 6,281 deaths within 30 days of an E. coli bacteraemia case, a mortality rate of 10.7 deaths per 100,000 population and a case-fatality rate (CFR) of 14.0%, declining from 10.1 deaths per 100,000 and 16.4%, respectively, compared to the start of surveillance. Over the past 5 years, the CFR trend has fluctuated, rising during the COVID-19 pandemic and then observing a slight decline over the last 2 years. The mortality rate decreased minimally compared with the previous year, from 10.8 to 10.7 deaths per 100,000 population (Figure 9).
Figure 9. CFR and mortality rate of E. coli bacteraemia, England, by FY April 2012 to March 2026
Note 1: shaded bands indicate 95% CIs.
Note 2: scales vary across graphs.
Variation by onset of bacteraemia
Following a decline in FY 2021 to 2022, the mortality rate in CO bacteraemia has increased to 7.7 deaths per 100,000 population in FY 2025 to 2026 (Table S11 in the accompanying data). The HO mortality rate has stayed the same at 4.9 deaths per 100,000 population during the same period, with a slight decrease from the previous FY (5.1 deaths per 100,000 population).
The CFRs for both HO and CO E. coli bacteraemia saw modest declines between FY 2012 to 2013 and FY 2025 to 2026, with the HO CFR decreasing from 23.6% to 21.1%, and the CO CFR decreasing from 14.8 to 12.4%. The HO CFR remained 1.6 to 1.7 times higher than the CO CFR throughout the period.
Variation by age and sex
In FY 2025 to 2026, among male cases, the highest mortality rates were seen in those aged 85 years and over (194.7 deaths per 100,000 population) and aged 75 to 84 years (64.0 deaths per 100,000 population) (Table S10 in the accompanying data). This equated to CFRs of 22.3% and 15.6%, respectively. This was a slight decrease in the CFR compared with the previous FY, for those aged 85 years and over (23.3%) and those aged 75 to 84 years (16.5%). The mortality rate for both age groups increased by 4.2% and 5.7%, from the previous year, respectively.
The highest mortality rates in female cases were similar to males in FY 2025 to 2026. This was seen in those aged 85 years and over at 109.6 deaths per 100,000 population, followed by those aged 75 to 84 years, at 41.7 deaths per 100,000 population. This equated to CFRs of 18.7% and 14.2%, respectively. Numbers of deaths are small in some of the younger groups so differences should be interpreted with caution.
Variation by region
CFRs in FY 2025 to 2026 were broadly similar across the country, being highest in the Midlands region (15.1%) followed by the North East and Yorkshire (Table S12 in the accompanying data). The CFR remained lowest in London (12.4%) and the South West (12.9%).
Epidemiological analysis of Gram-negative organisms: Klebsiella spp. bacteraemia
Total reports
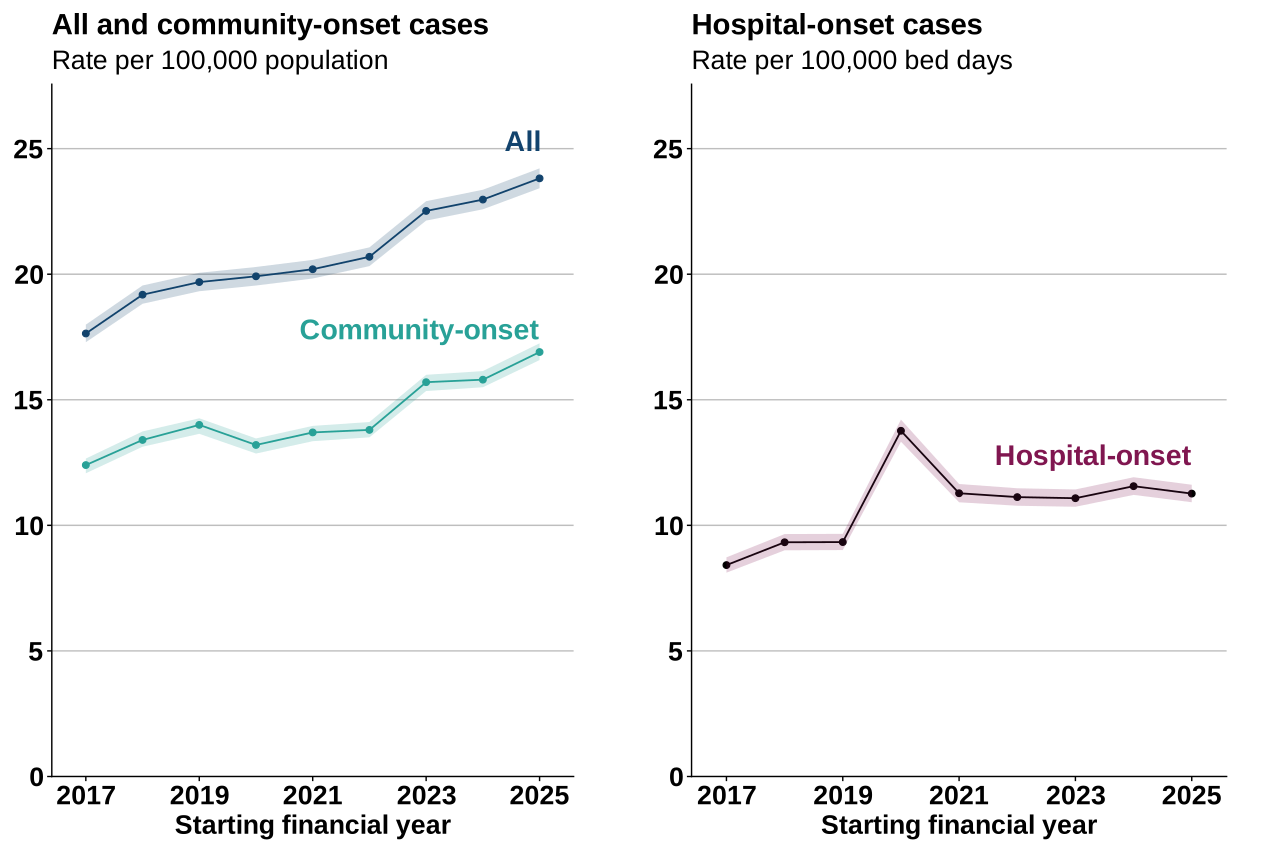
A total of 13,961 cases of Klebsiella spp. bacteraemia was reported by NHS acute trusts in England in FY 2025 to 2026, continuing the steady annual increase in the number of cases. The incidence rate of Klebsiella spp. bacteraemia cases has increased from 17.6 cases per 100,000 population at the start of surveillance (FY 2017 to 2018) to 23.8 cases per 100,000 population in FY 2025 to 2026. This marked a 3.7% increase compared with FY 2024 to 2025 (23.0 cases per 100,000 population) (Figure 10 and Table S1 in the accompanying data).
Figure 10. Trends in the rate of Klebsiella spp. bacteraemia, England, by FY April 2017 to March 2026
Note 1: shaded bands indicate 95% CIs.
The rate of CO Klebsiella spp. bacteraemia has increased from 12.4 cases per 100,000 population in FY 2017 to 2018 to 16.9 cases per 100,000 population in FY 2025 to 2026. This was a 6.9% increase since the previous year (15.8 cases per 100,000 population).
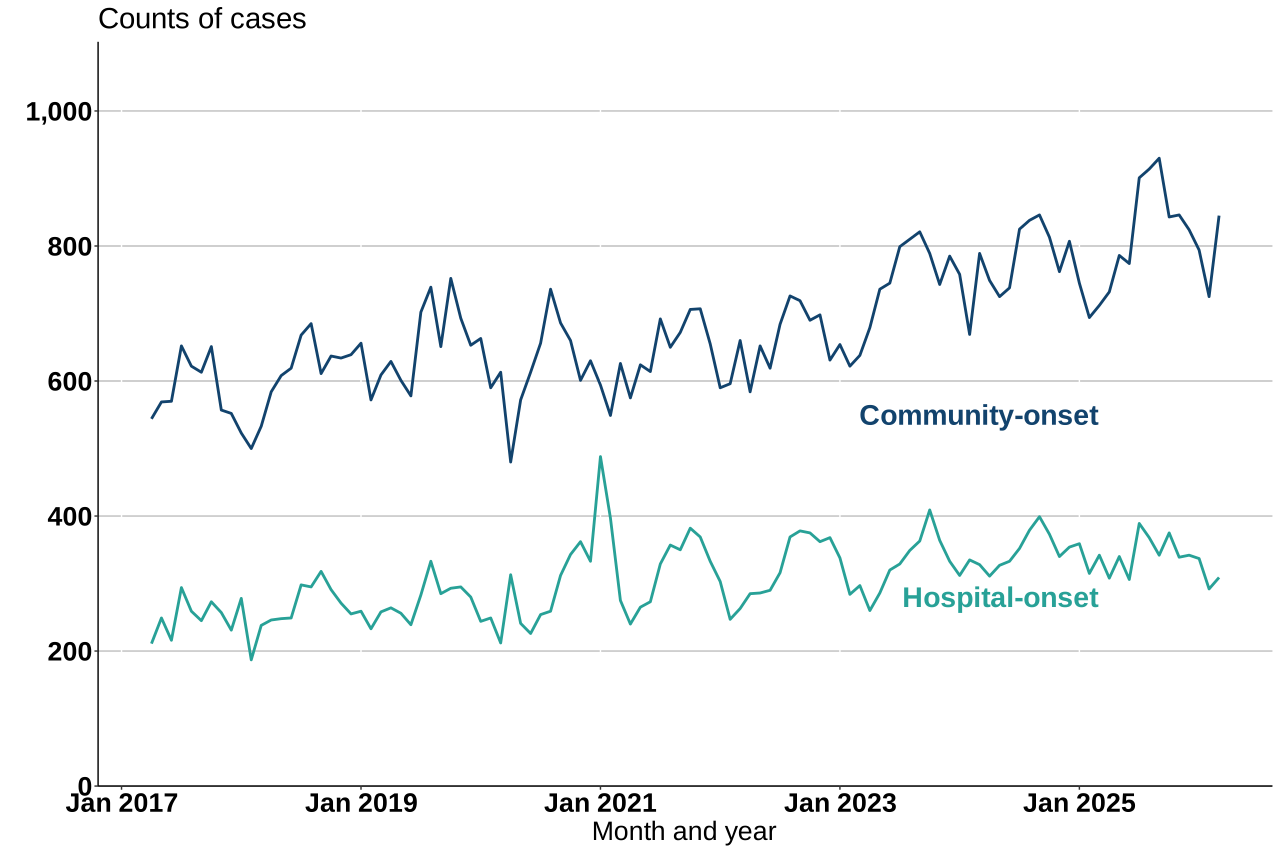
The rate of HO Klebsiella spp. bacteraemia has increased from 8.4 cases per 100,000 bed-days in FY 2017 to 2018 to 11.3 cases per 100,000 bed-days in FY 2025 to 2026. This increase was also reflected in episode counts, which rose to 4,047 cases in FY 2025 to 2026. In the past 5 years of surveillance, the HO rate has remained fairly stable. In comparison with the previous year, there has been a slight decrease of 2.6% in the HO rate (11.6 in FY 2024 to 2025). Overall, 29.0% of cases (4,047) were HO and 71.0% (9,914) CO (Figure 11).
Figure 11. Monthly counts of Klebsiella spp. bacteraemia by onset of infection, England, by FY April 2017 to March 2026
Seasonal trends
The seasonal trends in HO and CO cases in FY 2025 to 2026 were similar to those seen in other years, except during the COVID-19 pandemic. Across HO, CO and all cases, the percentage of yearly infections was generally higher during the July to September quarter (Figure 11 and Table S7 in the accompanying data).
Distribution of Klebsiella species
In FY 2025 to 2026, Klebsiella pneumoniae (75.3%) was the most frequently reported species, followed by Klebsiella oxytoca (14.5%) (Table S1 in the accompanying data). This distribution was similar regardless of onset of infection.
Prior trust exposure
Since FY 2020 to 2021, the incidence rate of HOHA Klebsiella sp. bacteraemia was 11.3 cases per 100,000 bed-days, a slight decrease of 2.6% from the previous year (11.6) (Table S8 in the accompanying data).
The incidence rate of COHA Klebsiella spp. bacteraemia was 5.2 cases per 100,000 bed-days and day admissions in FY 2025 to 2026, an increase of 5.2% from the previous year (5.0).
The incidence rate of COCA Klebsiella spp. bacteraemia was 13.4 cases per 100,000 population in FY 2025 to 2026, which was an increase of 7.8% from the previous year.
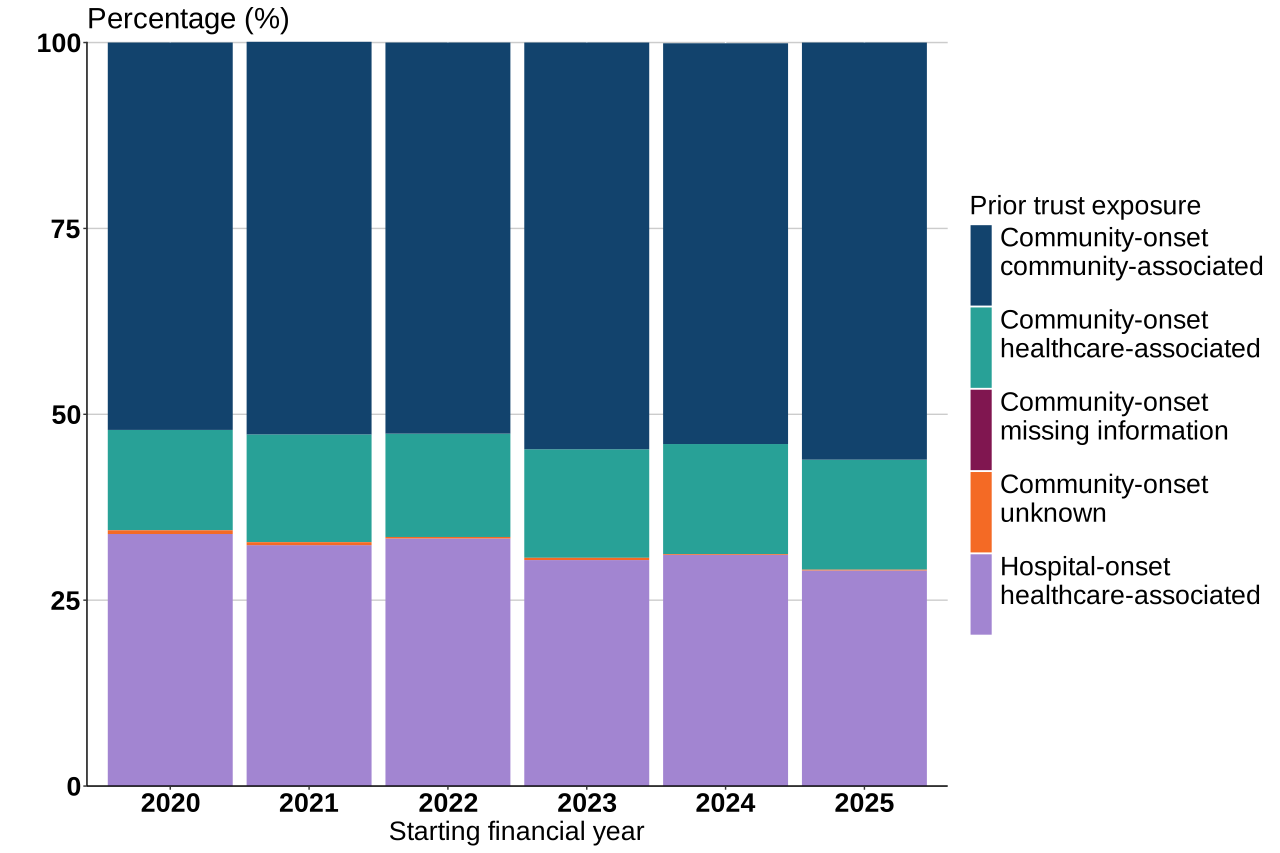
Since FY 2020 to 2021, the first full FY after prior trust exposure reporting became mandatory for Klebsiella spp., the distribution of cases by prior trust exposure has seen small changes. The proportion of COCA cases increased from 52.1% to 56.1%, COHA cases increased from 13.5% to 14.8%, and HOHA cases decreased from 33.9% to 29.0% of total cases (Figure 12).
Figure 12. Proportion of prior trust exposure of Klebsiella spp. cases, England, by FY April 2020 to March 2026
Age and sex distribution
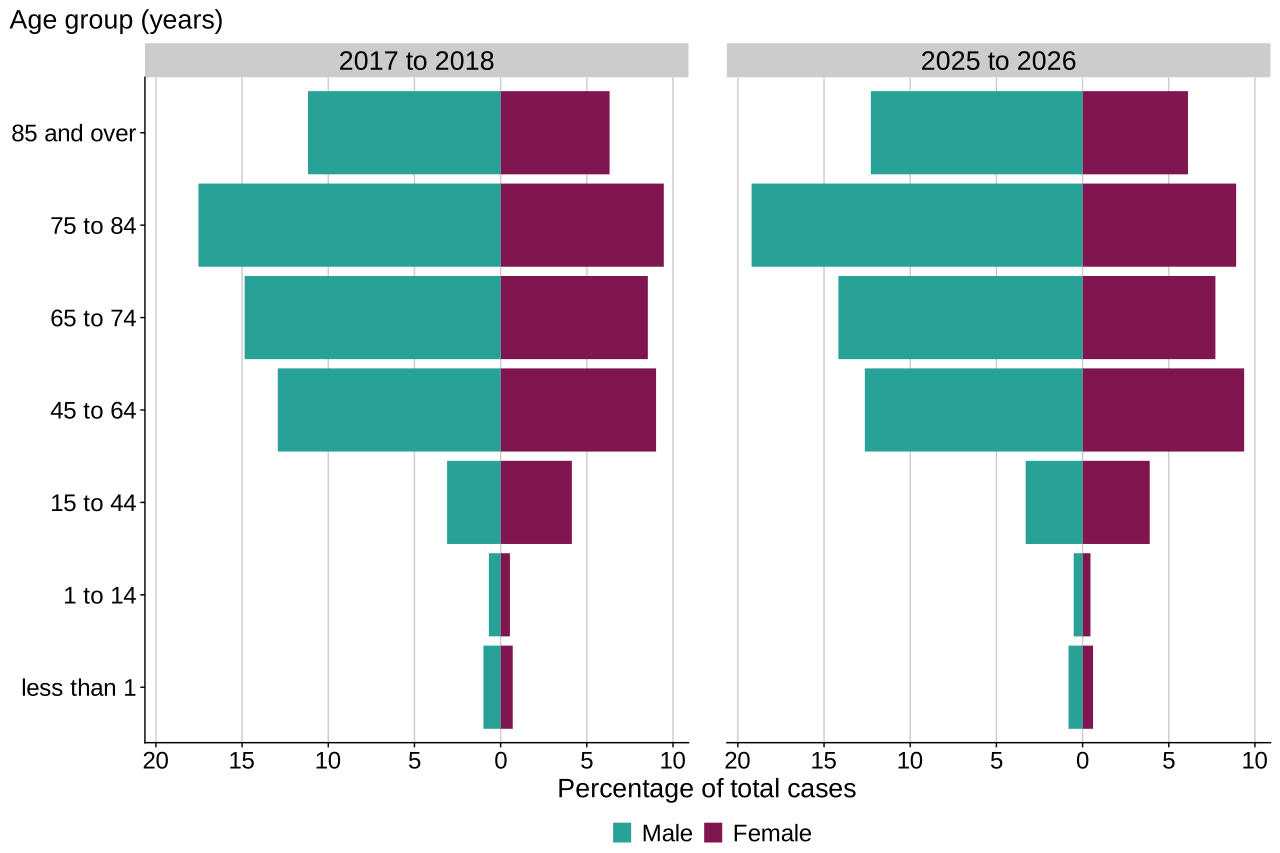
Broadly, the age and sex distribution of Klebsiella spp. bacteraemia cases in FY 2017 to 2018 compared with FY 2025 to 2026 remains similar, with most of the burden of infection being among male cases. In FY 2025 to 2026, the case burden remained highest in male cases aged 45 years and over, predominantly among those aged 75 to 84 years (19.2% of total cases). A similar trend was seen in older female cases aged 45 to 64 years (9.4% of total cases) and aged 75 to 84 years (8.9% of total cases), but to a much lesser extent. This is consistent with what has been seen in FY 2017 to 2018 (Figure 13).
Figure 13. Age and sex distribution of Klebsiella spp. bacteraemia by percentage of cases, England, by FY April 2017 to March 2026
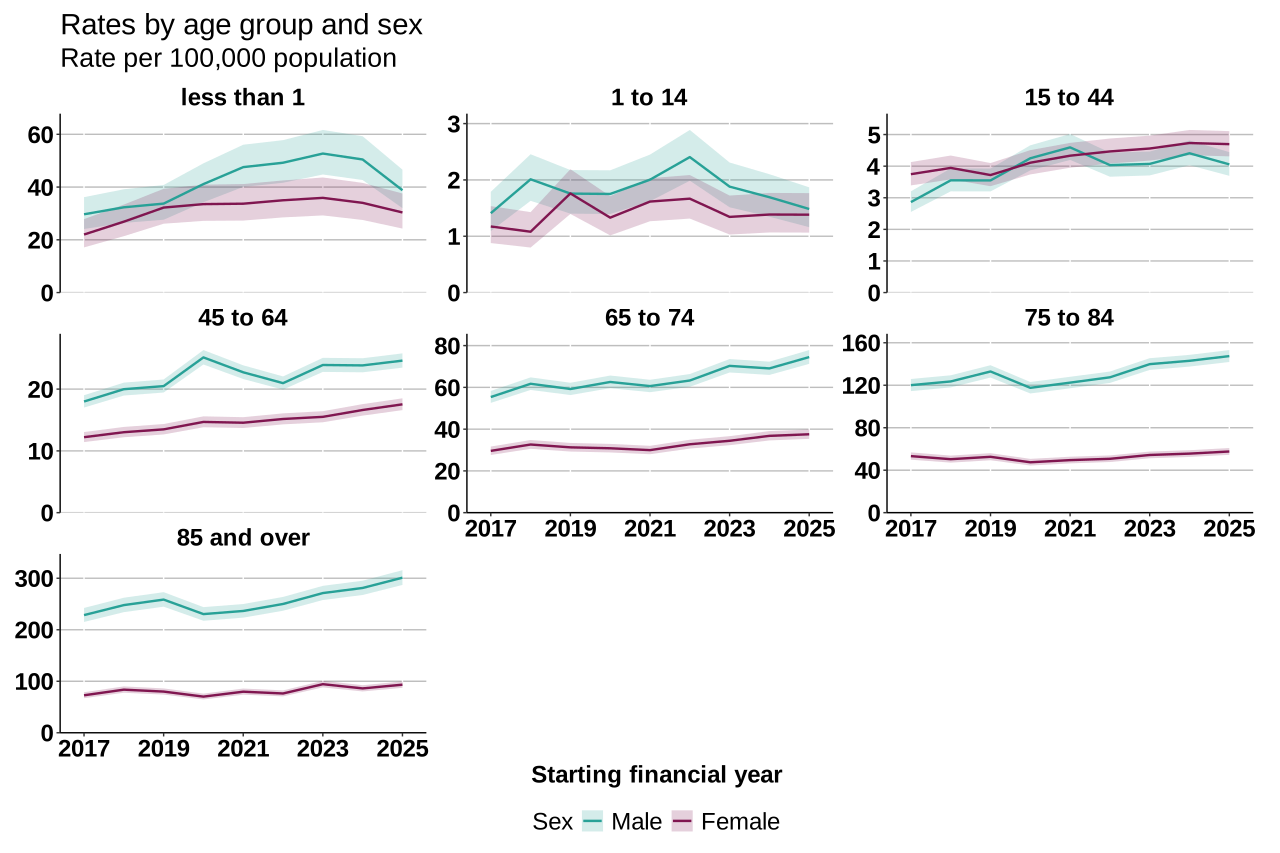
Overall, the incidence rate of Klebsiella spp. bacteraemia has increased in all age groups, for both male and female cases, between FY 2017 to 2018 and FY 2025 to 2026. For both male and female cases, the highest rates were among individuals aged 85 years and over at 301.1 and 93.4 cases per 100,000 population respectively, which in terms of the number of cases was 1,715 male cases and 854 female cases overall (Figure 14).
These increases over time were notable in male cases aged 75 years and over, and to a lesser extent, female cases aged 75 years and over. In FY 2025 to 2026, the rate increased from 143.0 to 147.5 cases per 100,000 population in male cases aged 75 to 84 years, and from 281.1 to 301.1 cases per 100,000 population in the 85 years and over group. The rate in female cases aged 85 years and over increased from 86.1 to 93.4 cases per 100,000 population compared with the previous year.
The incidence rate in those aged under 1 year saw declines, from 50.5 cases per 100,000 population to 38.8 in male cases, and from 34.0 to 30.4 in female cases, compared with the previous FY 2024 to 2025. The numbers remain low for those aged under 14 years, and long-term trends should be interpreted with caution.
Figure 14. Trends in age group and sex rates of Klebsiella spp. bacteraemia, England, by FY April 2017 to March 2026
Note 1: shaded bands indicate 95% CIs.
Note 2: scales vary across graphs.
Trends by ethnicity
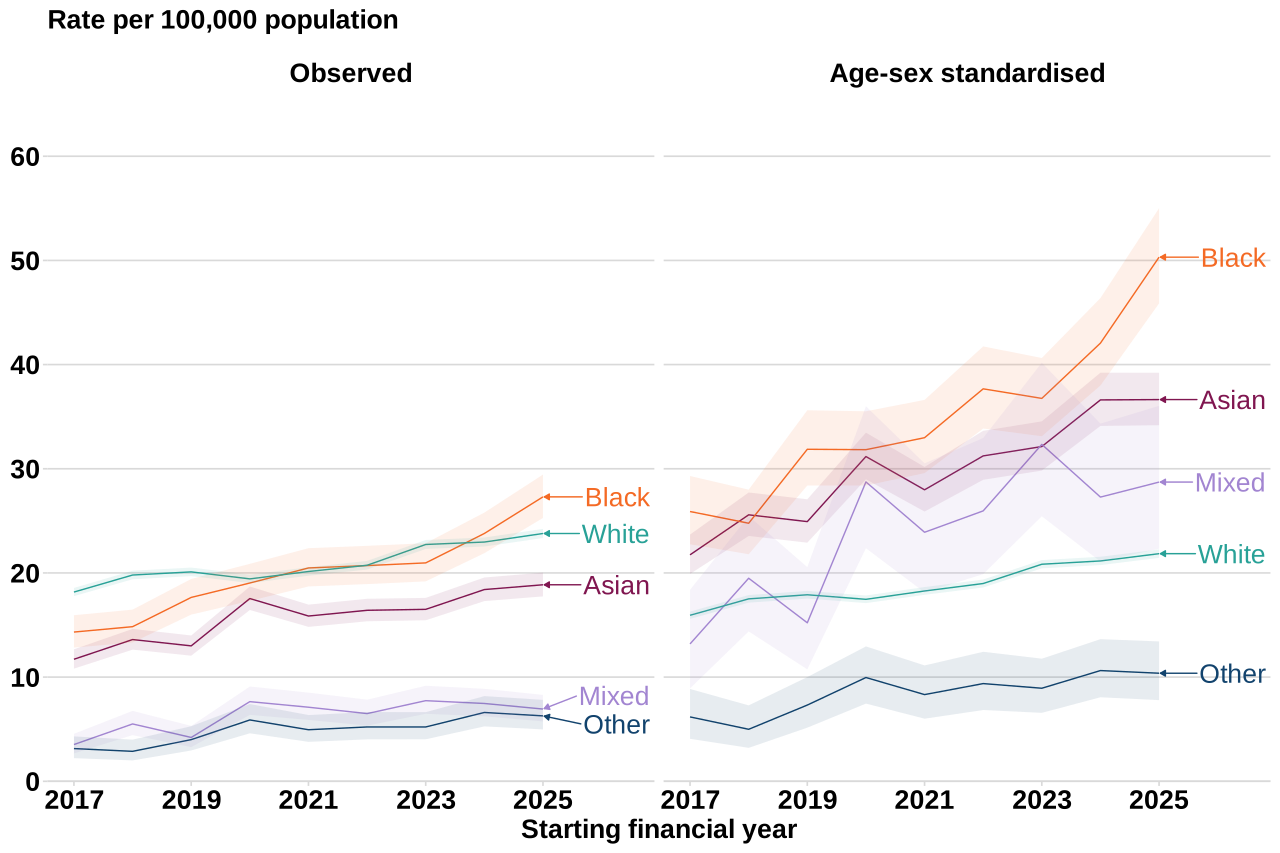
In FY 2025 to 2026, the observed incidence rate of Klebsiella spp. bacteraemia was highest in the Black and White ethnic groups (27.3 and 23.8 cases per 100,000 population, respectively), and lowest in the Mixed and Other ethnic groups (6.9 and 6.3 cases per 100,000 population, respectively) (Figure 15).
Figure 15. Klebsiella spp. bacteraemia rate by ethnicity, England, by FY April 2017 to March 2026
Note 1: shaded bands indicate 95% CIs.
However, age-sex-standardised incidence rates were substantially higher in those of Black ethnicity (50.3 per 100,000 population), followed by Asian ethnicity (36.6 per 100,000 population), and the incidence rate for the White ethnic group was among the lowest (21.8 per 100,000 population). Over the past year the rate rose markedly in the Black ethnic group, whereas other ethnic groups saw slight changes.
Trends by deprivation
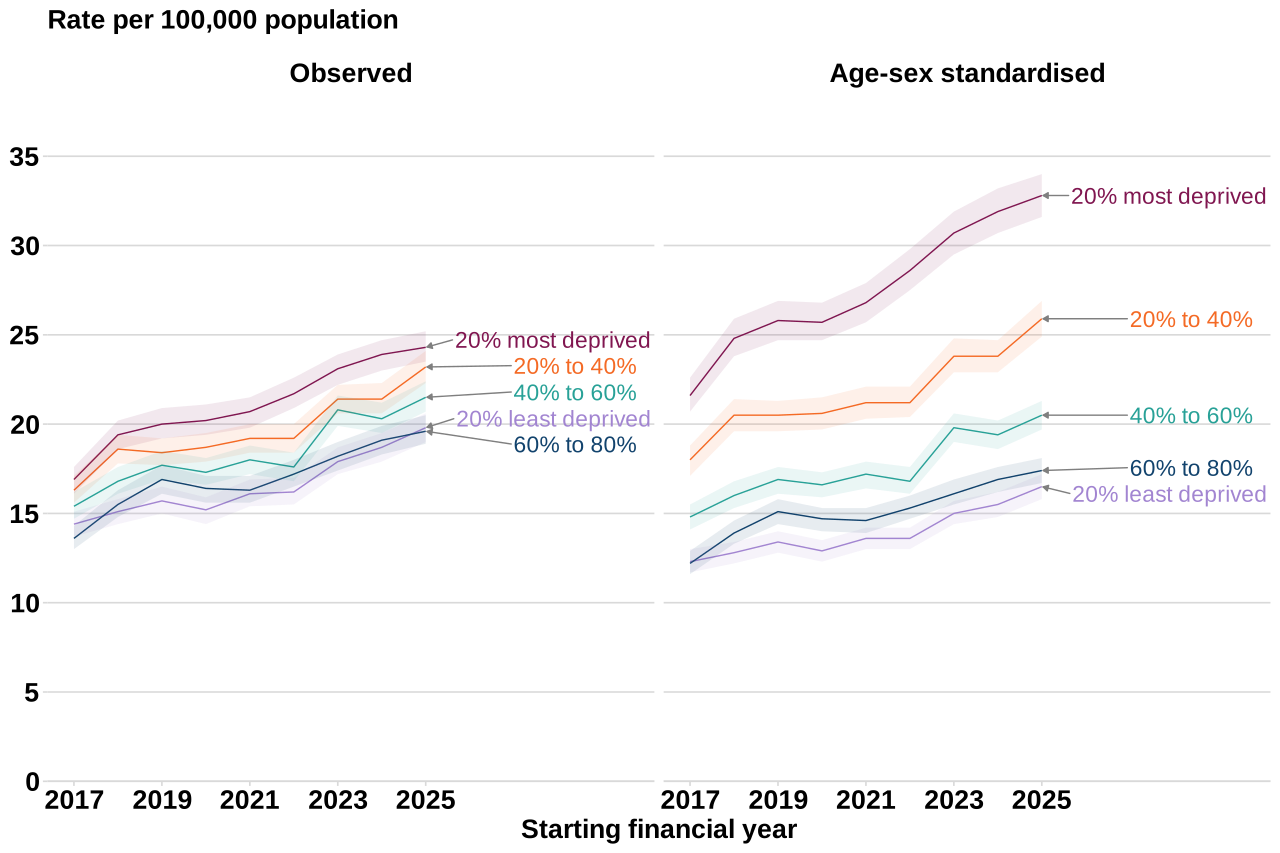
The observed incidence rate of Klebsiella spp. bacteraemia increased with deprivation. In FY 2025 to 2026, there were 24.3 cases per 100,000 people living in the 20% most deprived areas, and 19.8 cases per 100,000 people living in the 20% least deprived areas. The observed incidence rate of Klebsiella spp. bacteraemia increased with deprivation (Figure 16 and Table S13 in the accompanying data).
Figure 16. Klebsiella spp. bacteraemia rate by deprivation, England, by FY April 2017 to March 2026
Note 1: shaded bands indicate 95% CIs.
The range between deprivation quintiles was amplified when age-sex standardised incidence rates of Klebsiella spp. bacteraemia were used. With age-sex-standardised rates, the 20% most and 20% least deprived quintiles had rates of 32.8 and 16.5 cases per 100,000 population respectively. There has been a consistent ordering of age-sex-standardised Klebsiella spp. bacteraemia rates by increasing deprivation since April 2018.
Primary focus of Klebsiella spp. bacteraemia
Reporting of primary focus for Klebsiella spp. bacteraemia remains low. In FY 2025 to 2026 the primary focus was reported for 45.6% of all cases (Table S4 in the accompanying data). The most frequently reported primary focus of Klebsiella spp. bacteraemia was the urinary tract, constituting 36.2% of cases with a reported primary focus of infection in FY 2025 to 2026. This proportion has increased since FY 2017 to 2018 when it was 32.9% of cases. Hepatobiliary and respiratory tract as primary foci have decreased between FY 2017 to 2018 and FY 2025 to 2026, from 20.2% to 17.8% and from 9.2% to 8.6% respectively.
In FY 2025 to 2026, for inpatients with a time-to-onset of fewer than 2 days, the most common primary focus of bacteraemia was urinary tract (41.8%) (Table S5 in the accompanying data). As the time between admission and the onset of bacteraemia increased, the percentage of inpatients with urinary tract as the primary focus decreased to 25.2% (for those with onset in 7 days or more).
Among those with a time-to-onset of less than 2 days, 5.9% had a respiratory focus and 6.0% had a gastrointestinal focus. These percentages were higher among individuals with a time-to-onset of 7 days or more, at 11.0% and 13.6% for respiratory and gastrointestinal focus respectively. Caution is advised when interpreting these numbers due to low counts and annual fluctuations in trend.
Geographic distribution
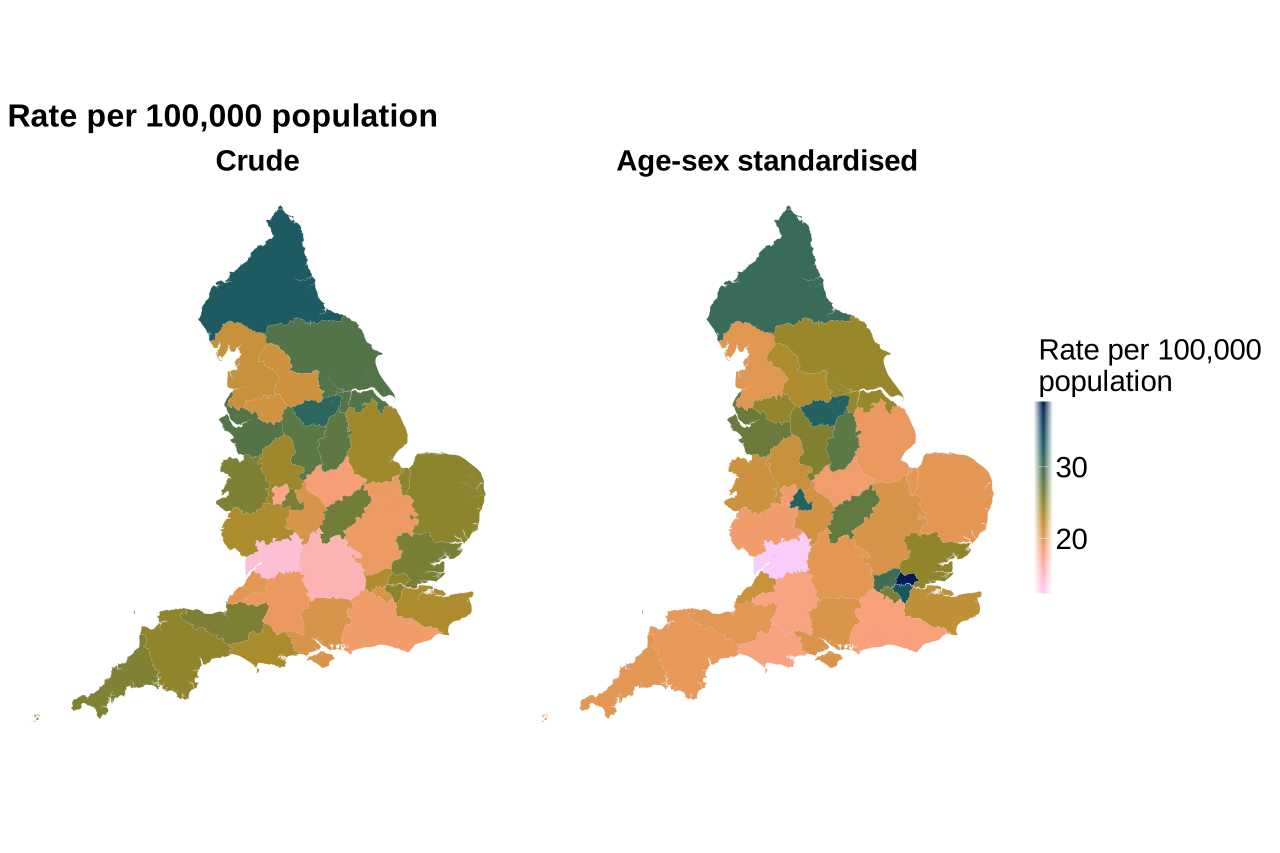
The crude and age-sex-standardised rates are presented across ICBs for FY 2025 to 2026. There is high spatial variability in Klebsiella spp. rates (cases per 100,000 population). The highest age-sex-standardised rates were seen in North East London ICB (39.1), South East London ICB (33.6), and South Yorkshire ICB (32.1). The lowest rates were seen in Gloucestershire ICB (12.4), Bath and North East Somerset, Swindon, and Wiltshire ICB (18.1), and Dorset ICB (18.1) (Figure 17 and Table S6 in the accompanying data).
Figure 17. Geographic distribution of Klebsiella spp. bacteraemia rate, by ICB, England, by FY April 2025 to March 2026
Mortality
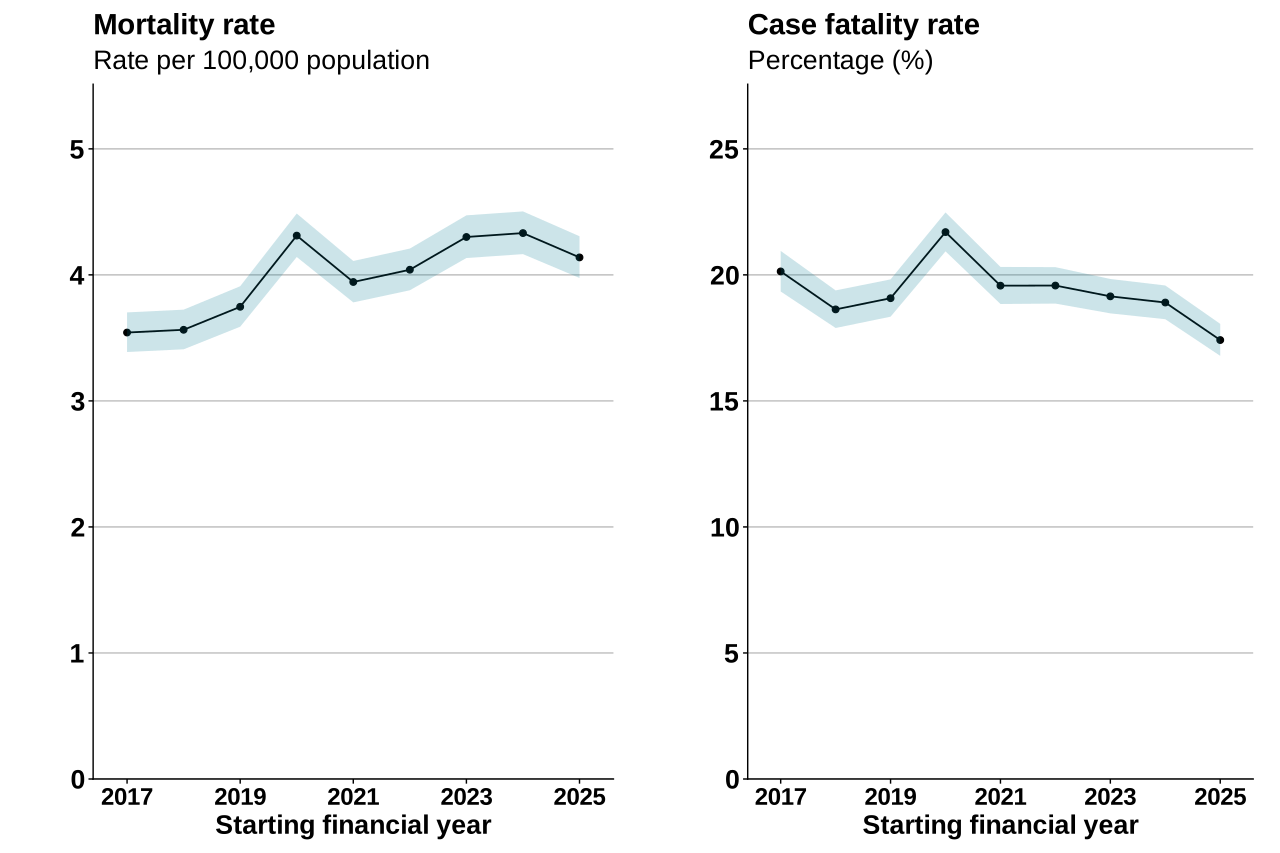
In FY 2025 to 2026, 13,961 Klebsiella spp. bacteraemia cases were reported in England (Table S9 in the accompanying data). Information on mortality was available for 99.1% (13,839) of total Klebsiella spp. bacteraemia cases. There were 2,426 deaths within 30 days of a Klebsiella spp. bacteraemia diagnosis, giving a mortality rate of 4.4 deaths per 100,000 population and a CFR of 17.4% (Figure 18).
The mortality rate increased from 3.5 to 4.1 deaths per 100,000 population between FY 2017 to 2018 and FY 2025 to 2026. Compared with the previous FY 2024 to 2025, there was a 4.5% decrease in the mortality rate from 4.3 to 4.1. In contrast, the CFR has fallen from 20.1% (1,973 deaths) to 17.4% (2,426 deaths) between FY 2017 to 2018 and FY 2025 to 2026, and is now at its lowest since surveillance began. Compared with the previous FY 2024 to 2025, the CFR also decreased from 18.9% to 17.4%.
Figure 18. CFR and mortality rate of Klebsiella spp. bacteraemia, England, by FY April 2017 to March 2026
Note 1: shaded bands indicate 95% CIs.
Note 2: scales vary across graphs.
Variation by onset of bacteraemia
Compared with the previous FY 2024 to 2025, the mortality rate of HO cases decreased from 2.6 deaths per 100,000 bed-days (959 deaths) to 2.4 (871 deaths) in FY 2025 to 2026 (Table S11 in the accompanying data). Similarly, the CFR for HO cases decreased from 23.0% to 21.6%.
The mortality rate in CO cases remained the same at 2.7 deaths per 100,000 population in FY 2024 to 2025 (1,576 deaths) and FY 2025 to 2026 (1,555 deaths). The corresponding CFRs decreased from 17.1% to 15.7%.
Variation by age and sex
In FY 2025 to 2026, as in previous years, the mortality rate and CFR increased with age, except among those aged 1 year and under, where values were higher than in other age groups (Table S10 in the accompanying data). Overall, the mortality rate and CFR were higher in male cases, except in those aged 65 to 85 years and over, where female cases had a higher CFR.
For male cases, the highest mortality rate was seen in those aged 85 years and over (75.7 deaths per 100,000 population) and those aged 75 to 84 years (26.9 deaths per 100,000 population) with corresponding CFRs of 25.2% and 18.3% of cases, respectively. Compared with FY 2024 to 2025, mortality rates for male cases aged 85 years and over increased by 1.0% but decreased by 8.6% for those aged 75 to 84 years.
For female cases, the highest mortality rate was also seen in those aged 85 years and over (25.6 deaths per 100,000 population) and those aged 75 to 84 years (11.8 deaths per 100,000 population). CFRs for these groups were 27.4% and 20.5%, respectively. Compared with FY 2024 to 2025, mortality rates for female cases aged 85 years and over increased by 9.1% but decreased by 5.4% for those aged 75 to 84 years.
Variation by region
CFRs in FY 2025 to 2026 were highest in the Midlands (18.9%) followed by North West (18.4%) and the East of England (18.2%) (Table S12 in the accompanying data). The CFR remained lowest in both London (15.4%) and the South West (16.7%).
Epidemiological analysis of Gram-negative organisms: Pseudomonas aeruginosa bacteraemia
Total reports
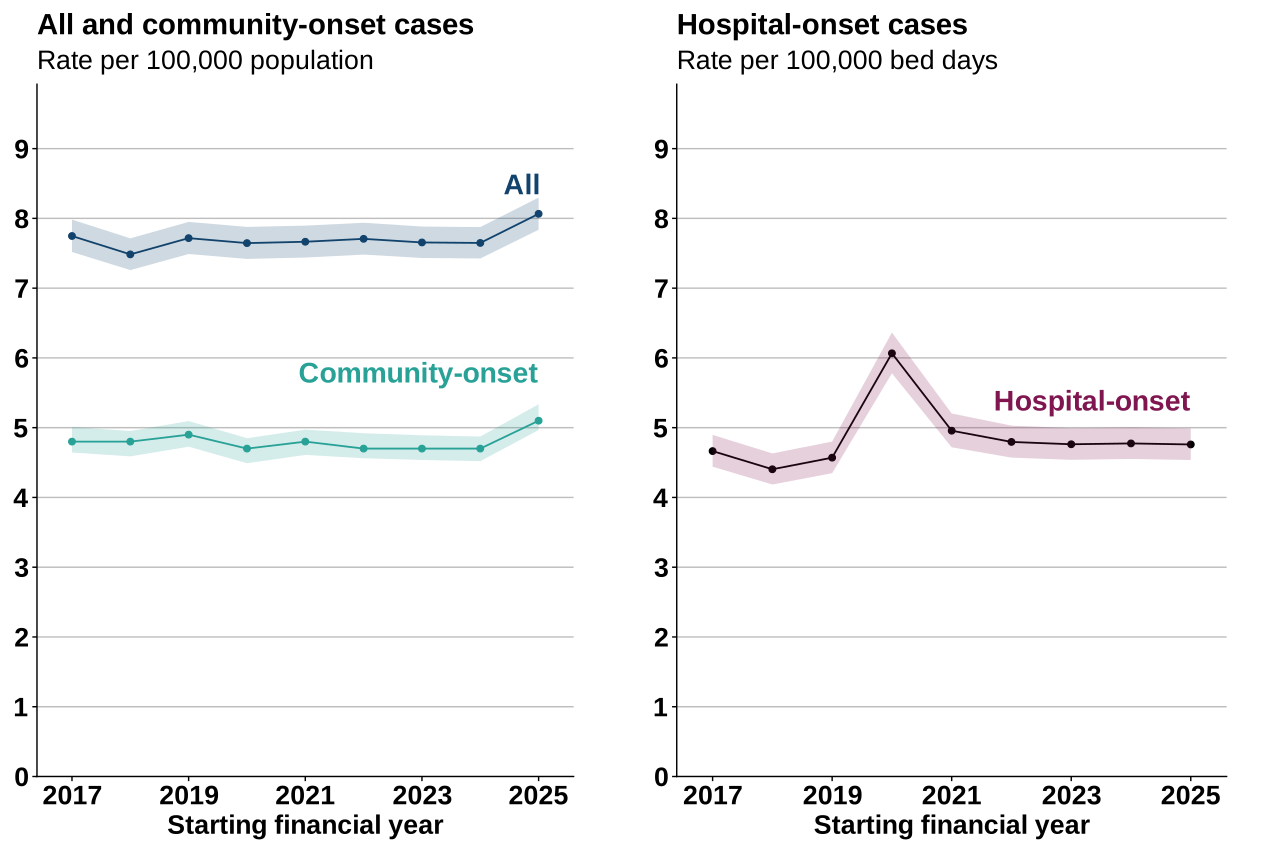
A total of 4,728 cases of Pseudomonas aeruginosa (P. aeruginosa) bacteraemia were reported by NHS acute trusts in England in FY 2025 to 2026. Of these cases, 1,710 (36.2%) were HO and 3,018 (63.8%) were CO. There has been little variation in the counts of total P. aeruginosa cases since the start of enhanced surveillance in FY 2017 to 2018, and the rates have remained largely stable, with 8.1 cases per 100,000 population in FY 2025 to 2026. This marked a small increase of 5.5% compared with FY 2024 to 2025 (7.6 cases per 100,000 population) (Figure 19 and Table S1 in the accompanying data).
Figure 19. Trends in the rate of P. aeruginosa bacteraemia, England, by FY April 2017 to March 2026
Note 1: shaded bands indicate 95% CIs.
The rate of P. aeruginosa HO cases was mostly stable since FY 2017 to 2018, other than a rise to 6.1 cases per 100,000 bed-days in FY 2020 to 2021. Otherwise, it ranged from 4.7 cases per 100,000 bed-days in FY 2017 to 2018 to 4.8 cases in FY 2025 to 2026, which was the same rate as FY 2024 to 2025.
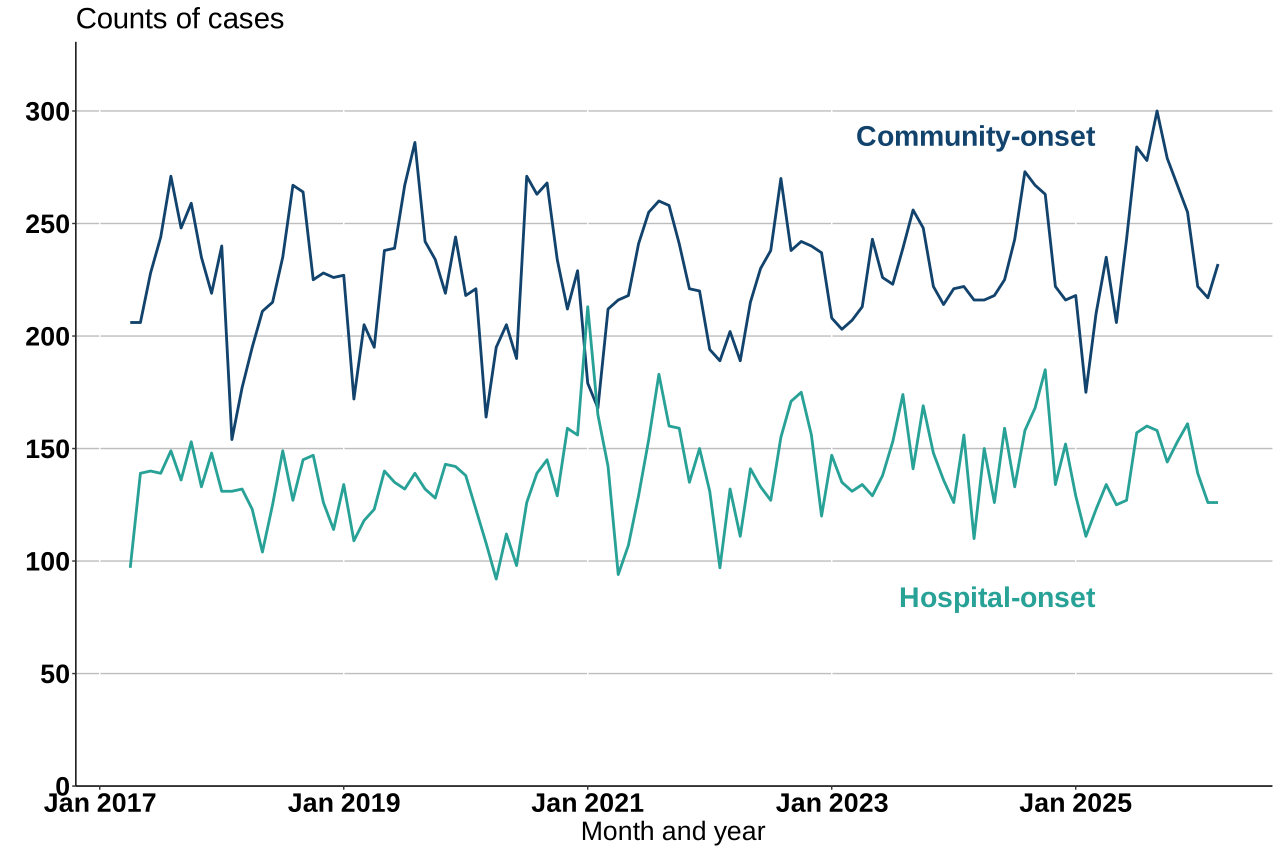
CO P. aeruginosa rates have remained mostly stable, except for an increase of 9.7% in FY 2025 to 2026 compared to the previous FY, with a rate of 5.1 cases per 100,000 population in FY 2025 to 2026 (Figure 20).
Figure 20. Monthly counts of P. aeruginosa bacteraemia by onset of infection, England, by FY April 2017 to March 2026
Seasonal trends
When assessing the distribution of CO P. aeruginosa cases per FY, the greatest proportion of cases occur in the July to September quarter. This has been seen since the beginning of P. aeruginosa surveillance in FY 2017 to 2018, where on average 28.4% of CO cases in the FY occur in the summer quarter. Since FY 2017 to 2018 on average (except for FY 2020 to 2021) 27.2% of HO cases occur in the summer quarter (Figure 20 and Table S7 in the accompanying data).
Prior trust exposure
There were 1,710 HOHA P. aeruginosa cases in FY 2025 to 2026. This corresponded to an incidence rate of 4.8 cases per 100,000 bed-days, which was the same as the previous FY (4.8 cases per 100,000 bed-days).
There were 878 COHA cases, which marked a decrease in the incidence rate from 2.5 to 2.2 cases per 100,000 bed-days compared with the previous year.
COCA cases were 2,140, with an increase in incidence rate by 11.5% from 3.3 to 3.7 cases per 100,000 population compared with the previous year (Table S8 in the accompanying data).
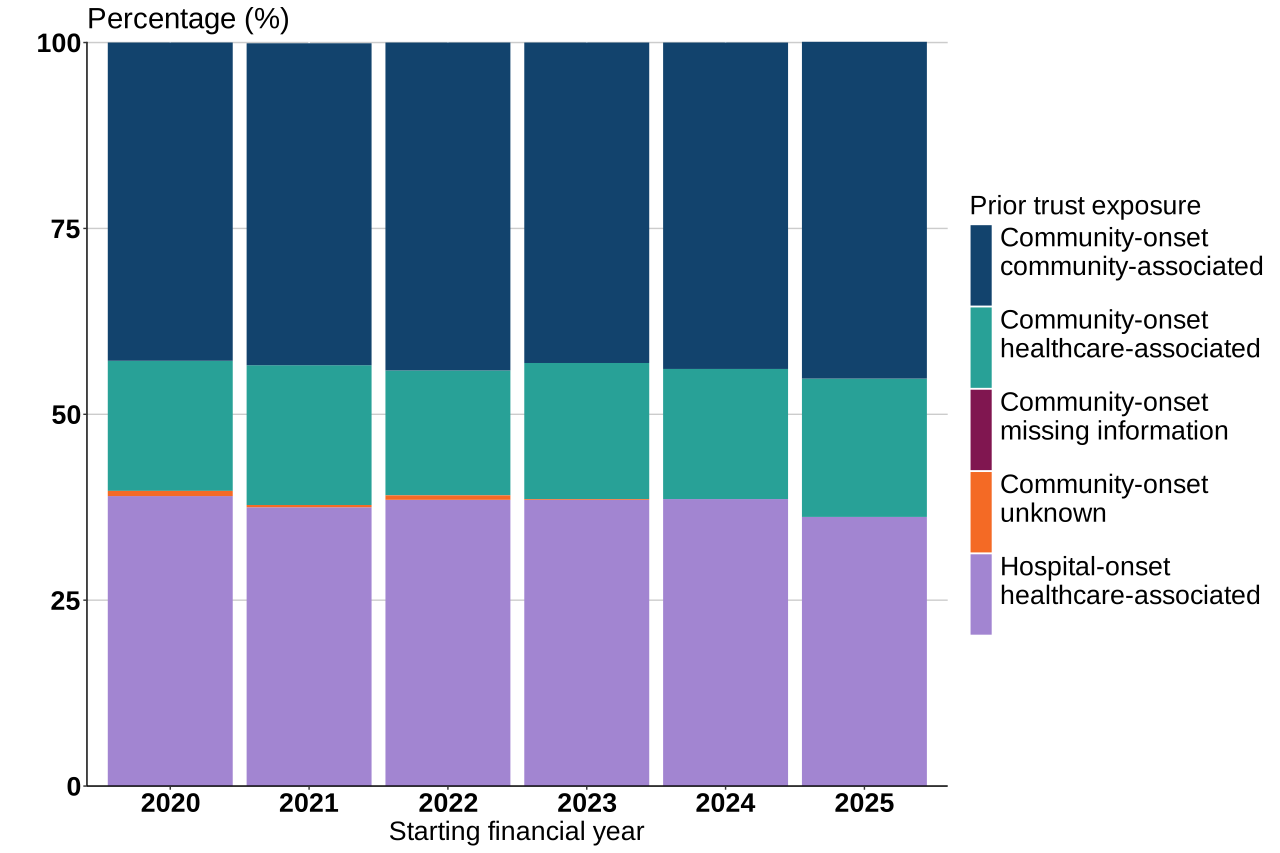
Since FY 2020 to 2021, the first full FY after prior trust exposure reporting became mandatory for P. aeruginosa, the distribution of cases by prior trust distribution has remained stable. In FY 2025 to 2026, 45.3% of cases were COCA, 18.6% were COHA and 36.2% were HOHA (Figure 21).
Figure 21. Proportion of prior trust exposure of P. aeruginosa bacteraemia cases, England, by FY April 2020 to March 2026
Age and sex distribution
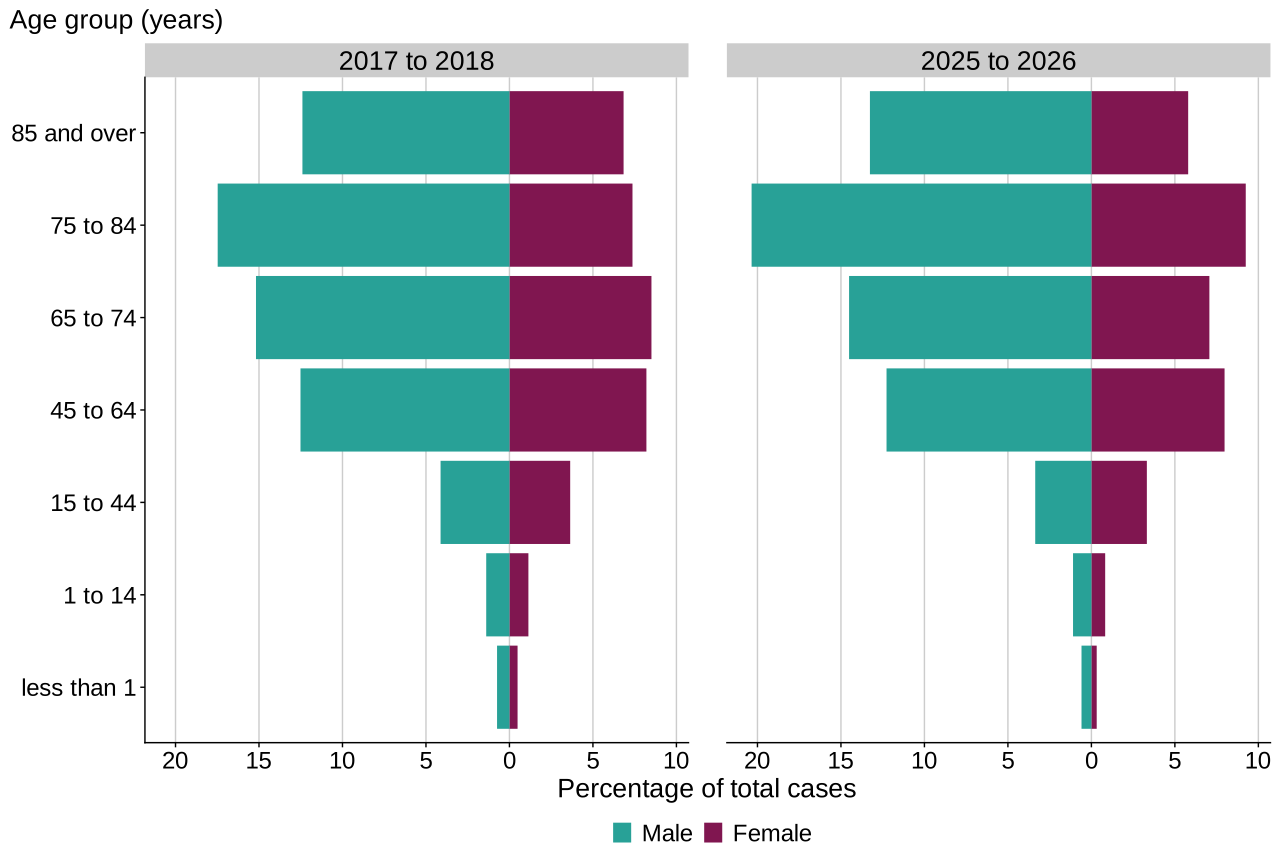
Overall, there was little change in the age and sex distribution of P. aeruginosa cases in FY 2017 to 2018 and FY 2025 to 2026. Most cases occurred in male cases aged 45 years and over. In FY 2025 to 2026, the highest proportions of both male and female cases occurred among those aged 75 to 84 years, accounting for 20.3% and 9.2% of total cases, respectively. Among individuals aged 15 to 44 years, the percentage of male cases was similar to female cases (Figure 22 and Table S2 in the accompanying data).
Figure 22. Age and sex distribution of P. aeruginosa bacteraemia by percentage of cases, England, by FY April 2017 to March 2026
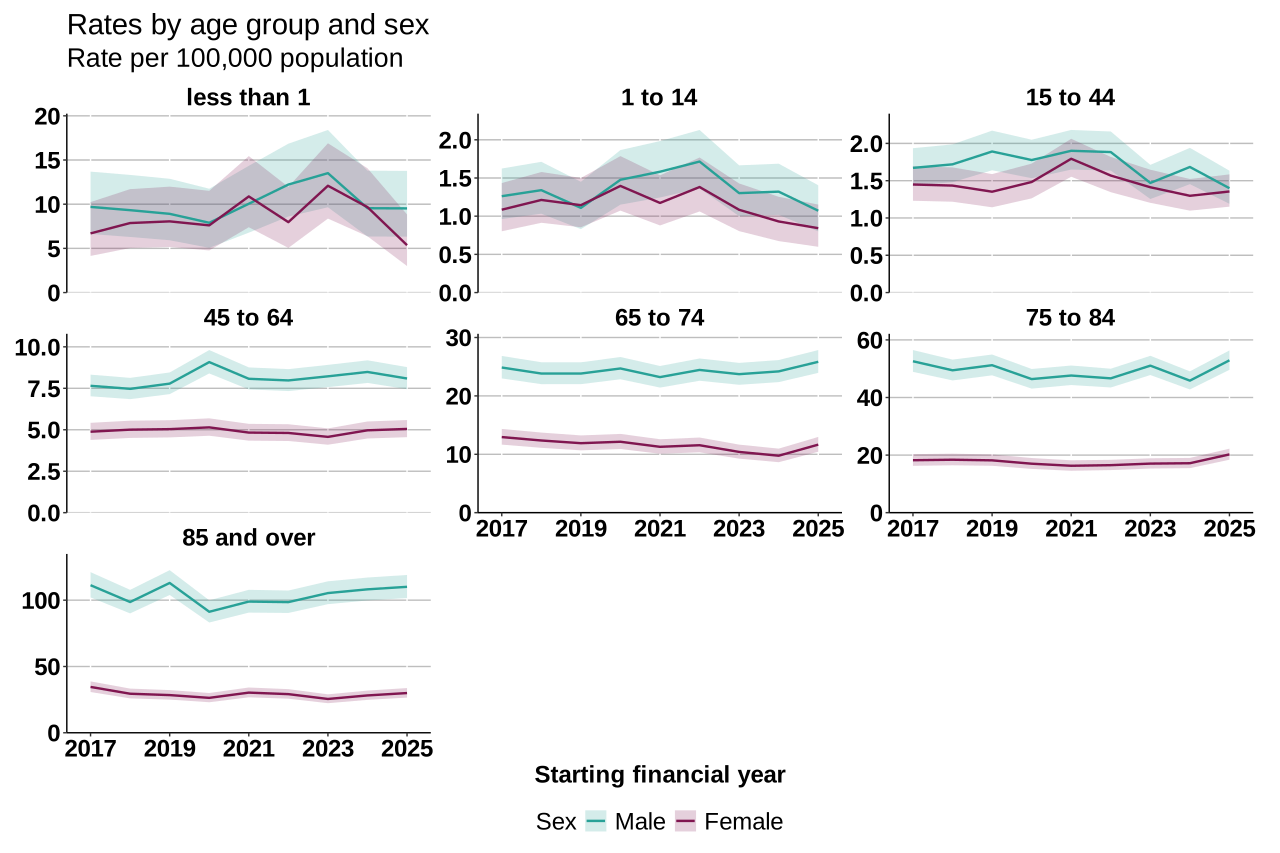
In FY 2025 to 2026, the incidence rate increased with age for both male and female cases, except for those aged 1 year and under. The rates are higher in male cases compared with female cases, especially in the older age groups (aged 65 years and over). The rates for male and female cases have remained broadly stable over the surveillance period (Figure 23).
Figure 23. Trends in age group and sex rates of P. aeruginosa bacteraemia, England, by FY April 2017 to March 2026
Note 1: shaded bands indicate 95% CIs.
Note 2: scales vary across graphs.
The highest rate seen was among those aged 85 years and over at 110.1 male cases and 30.0 female cases per 100,000 population. Compared with the previous year, increasing rates were seen in age groups over 75 years for male and female cases. The rate in male cases aged 75 to 84 years increased from 45.9 to 52.9 cases per 100,000 population. For those aged 85 years and over, there was a smaller increase from 108.2 to 110.1. For females aged 75 to 84 years, the rate increased from 17.2 to 20.2, and in those aged 85 years and over, the rate increased from 28.2 to 30.0.
Those aged 1 year and under are a relatively high-risk group. Whilst the rate in male cases aged under 1 year remained the same compared with the previous year (9.5 cases per 100,000 population), the rate in females of this age group decreased from 9.7 to 5.4. However, caution is advisable when interpreting data for P. aeruginosa among those aged 14 years and under as the number of cases is too small to properly interpret trends.
Trends by ethnicity
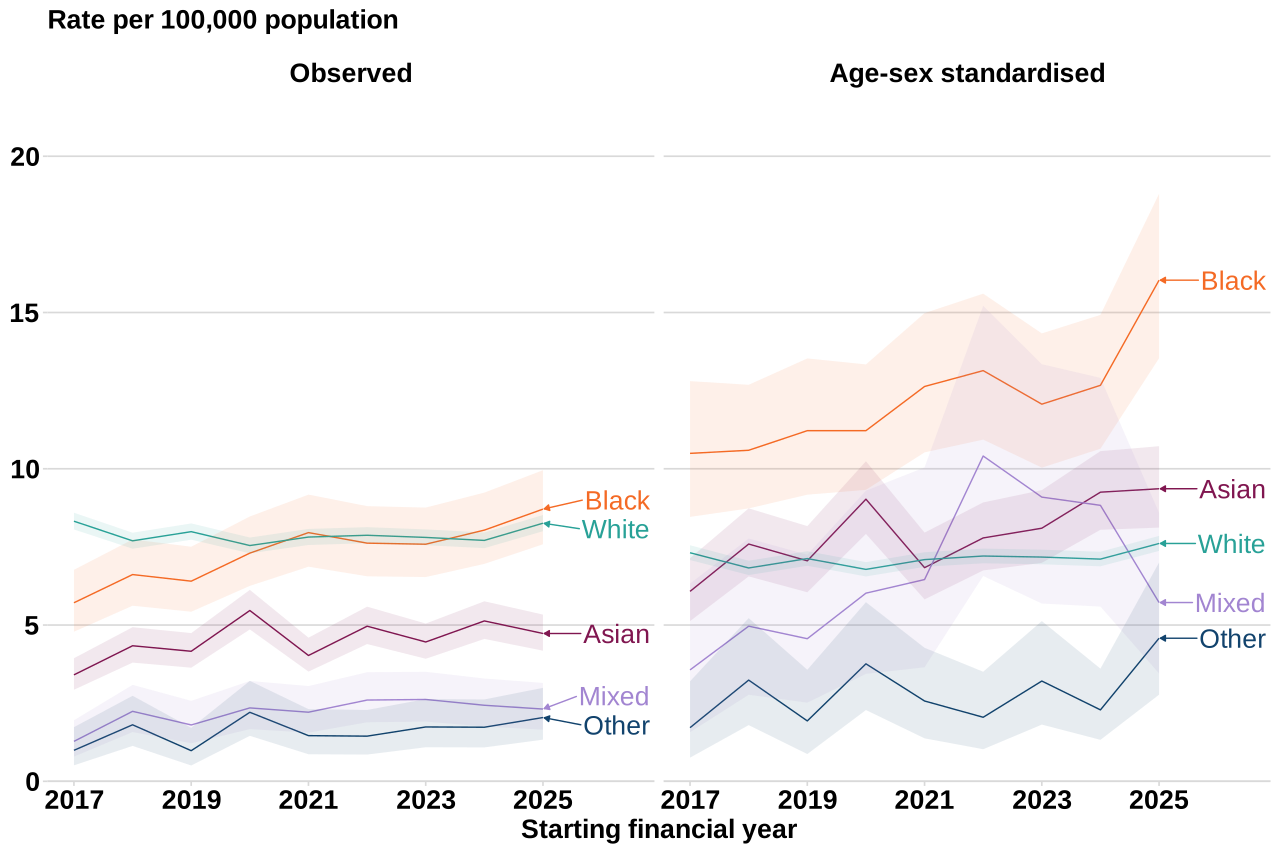
In FY 2025 to 2026, the observed incidence rate of P. aeruginosa bacteraemia was highest in the Black and White ethnic groups (8.7 and 8.3 cases per 100,000 population, respectively) and lowest in the Mixed and Other ethnic groups (2.3 and 2.0 cases per 100,000 population, respectively) (Figure 24).
Figure 24. P. aeruginosa bacteraemia rate by ethnicity, England, by FY April 2017 to March 2026
Note 1: shaded bands indicate 95% CIs.
Age-sex-standardised incidence rates were much greater than observed incidence in all except the White ethnic group. The Black ethnic group had the highest incidence compared with the other ethnic groups consistently over the surveillance period, with a marked rise in the past year.
Trends by deprivation
In FY 2025 to 2026 there was a little variation in incidence by deprivation, which ranged from 7.4 and 6.7 cases per 100,000 population in the 20% most deprived and 20% least deprived areas (Figure 25 and Table S13 in the accompanying data).
Figure 25. P. aeruginosa bacteraemia rate by deprivation, England, by FY April 2017 to March 2026
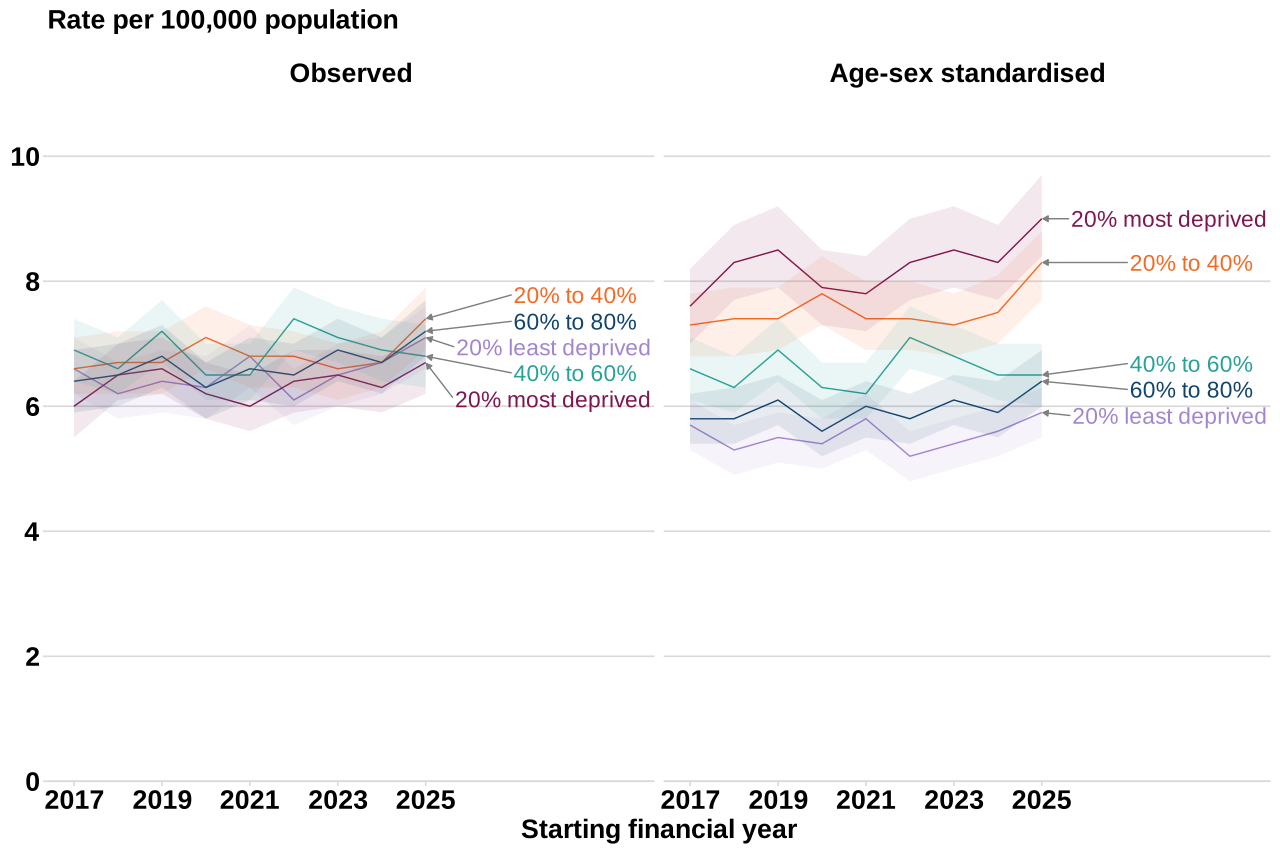
Note 1: shaded bands indicate 95% CIs.
However, age-sex-standardised incidence rates of P. aeruginosa bacteraemia varied more widely by deprivation, with 9.0 and 5.9 cases per 100,000 population in the 20% most or 20% least deprived areas respectively. Since April 2017, all levels have fluctuated without apparent trend.
Primary focus of P. aeruginosa bacteraemia
Reporting of primary focus for P. aeruginosa remains low. In FY 2025 to 2026, the primary focus was reported for 48.1% of cases, a decrease from 49.3% from the start of surveillance in FY 2017 to 2018 (Table S4 in the accompanying data).
The urinary tract remains the most reported primary focus of bacteraemia in FY 2025 to 2026, constituting 33.5% of cases, followed by respiratory at 12.1%, and gastrointestinal at 5.8%. Over the surveillance period, the percentage of primary focus reported as urinary tract was similar (ranging from 28.8% to 33.5%) but there has been a 7.7% increase compared with the previous year.
In FY 2025 to 2026, for inpatients with a time-to-onset (days between hospital admission and specimen date) of fewer than 2 days, the most common primary focus of bacteraemia was the urinary tract (41.8%) (Table S5 in the accompanying data). As time between admission and positive specimen increased, the percentage of inpatients reporting primary focus as urinary tract decreased to 24.0% among those with a time-to-onset of 7 days or greater.
In contrast, as the number of days between admission and positive specimen increased, so did the percentage of individuals with a reported respiratory tract primary focus. The increase was 8.6% among those with fewer than 2 days, peaking at 20.5% in the 2 to 6 days group before declining to 12.2% among those with 7 days or greater. Similarly, gastrointestinal (not hepatobiliary) increased from 5.1% among those with less than 2 days to 12.1% in the 2 to 6 days group followed by a decrease to 8.0% among those with 7 days or greater.
Geographic distribution
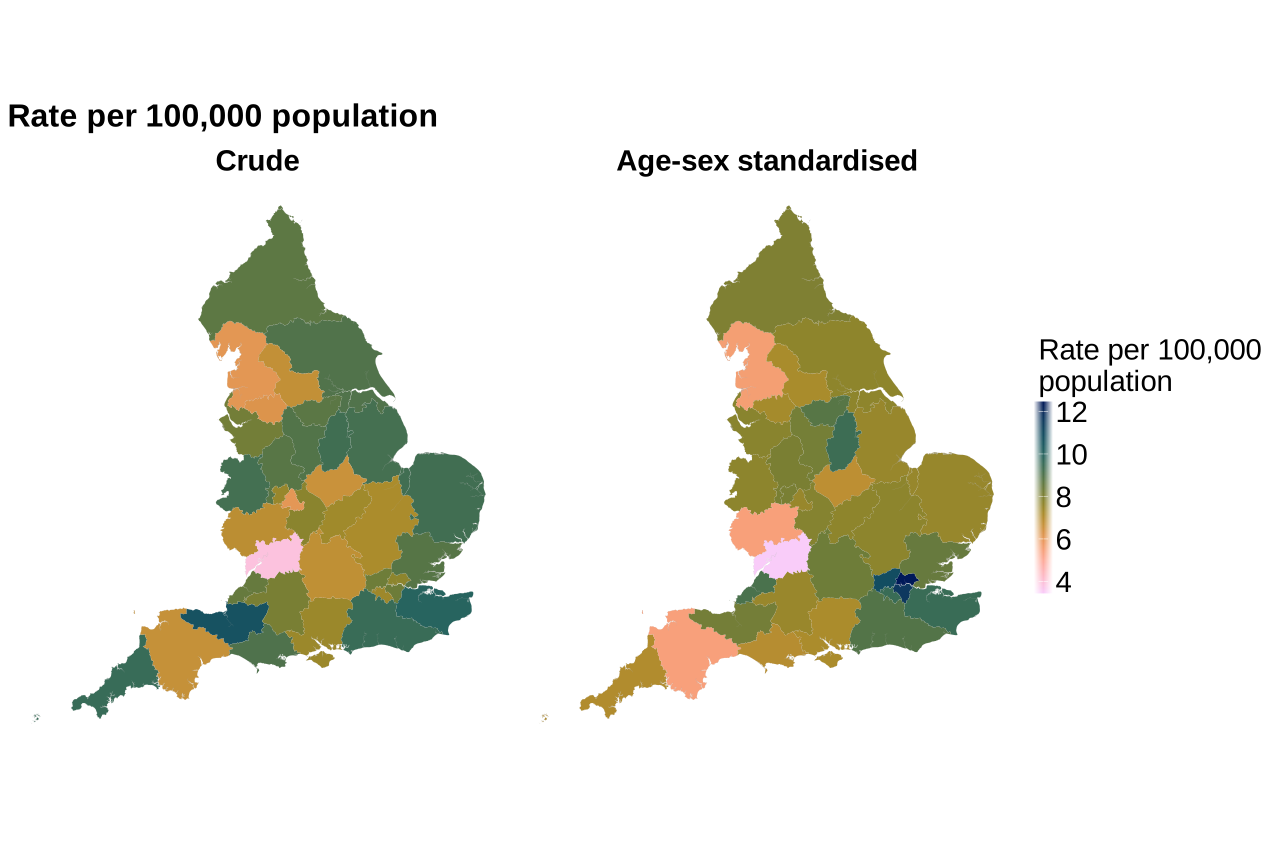
The crude and age-sex-standardised rates of P. aeruginosa bacteraemia are presented across ICBs for FY 2025 to 2026. The highest age-sex-standardised incidence rates (cases per 100,000 population) were seen in North East London ICB (12.5), South East London ICB (11.7), and West and North London ICB (10.9). The lowest were seen in Gloucestershire ICB (3.4), Devon ICB (5.5) and Herefordshire and Worcestershire ICB (5.5) (Figure 26 and Table S6 in the accompanying data).
Figure 26. Geographic distribution of P. aeruginosa bacteraemia rate, by ICB, England, by FY April 2025 to March 2026
Mortality
In FY 2025 to 2026, 4,728 P. aeruginosa bacteraemia cases were reported in England (Table S9 in the accompanying data). Information on mortality was available for 99.2% (4,689) of these cases. There were 1,099 deaths within 30 days of a P. aeruginosa bacteraemia, with a mortality rate of 1.9 deaths per 100,000 population and a CFR of 23.3% (Figure 27).
Figure 27. CFR and mortality rate of P. aeruginosa bacteraemia, England, by FY April 2017 to March 2026
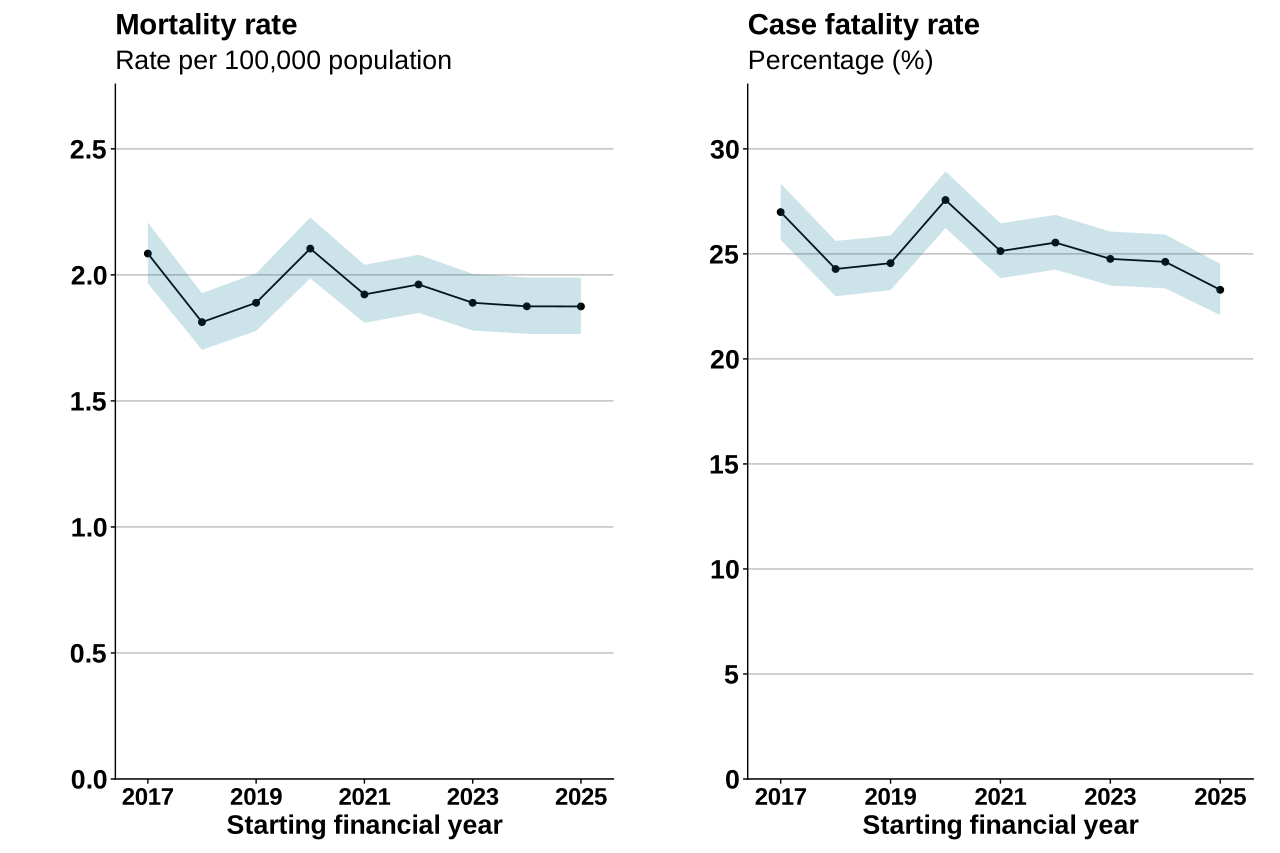
Note 1: shaded bands indicate 95% CIs.
Note 2: scales vary across graphs.
The mortality rate has remained consistent at around 1.9 deaths per 100,000 population between FY 2021 to 2022 and FY 2025 to 2026. The CFR has decreased from 27.0% (1,161 deaths) in FY 2017 to 2018 to 23.3% (1,099 deaths) in FY 2025 to 2026.
Variation by onset of bacteraemia
Between FY 2018 to 2019 and FY 2025 to 2026, the CFR of HO cases increased slightly from 27.2% to 27.6%, while for CO cases over the same period, the CFR had minor fluctuations but declined from 22.7% to 20.8%. Compared with FY 2024 to 2025, the CFR in HO cases in FY 2025 to 2026 decreased slightly from 27.9% to 27.6%, and the CFR in CO cases also decreased slightly from 22.6% to 20.8% (Table S11 in the accompanying data).
In FY 2025 to 2026, the mortality rate of HO cases remained stable at 1.3 deaths per 100,000 bed-days when compared with the previous FY 2024 to 2025 (471 and 480 deaths, respectively). Over the same period, the mortality rate in CO cases remained stable at 1.1 deaths per 100,000 population (628 deaths and 618 deaths, respectively).
Variation by age and sex
In FY 2025 to 2026, the highest mortality rates in male cases were in those aged 85 years and over (27.2 deaths per 100,000 population) and those aged 75 to 84 years (11.5 deaths per 100,000 population), which corresponded to CFRs of 24.8% and 21.9% of cases, respectively (Table S10 in the accompanying data). In female cases of the same age groups, the mortality rates were lower than their male counterparts at 11.2 deaths per 100,000 population (aged 85 years and over) and 6.8 deaths per 100,000 population (aged 75 to 84 years). However, these equated to higher CFRs than male cases of 37.4% and 33.5% of all cases in these age groups.
CFR and mortality rate generally increased with age, except among infants aged 1 year and under, which was higher than all other age groups in males and higher than those aged between 1 and 44 years of age in females (Table S10 in the accompanying data). The mortality rate was greater in male cases (except those aged 15 to 44 years) while the CFR was greater in female cases except for those aged under 1, those aged between 1 and 14 years, and those aged between 45 and 64 years. Among infants aged 1 year and under, the mortality rate in male cases was 3.7 deaths per 100,000 population and 0.7 in female cases. As the number of deaths was relatively small in both male and female cases, caution is required in interpreting this data.
Variation by region
CFRs in FY 2025 to 2026 were highest in the North West (28.7%), followed by the East of England (27.3%) and the Midlands (23.9%). The CFR was the lowest in the South West at 19.8% followed by London (20.7%) (Table S12 in the accompanying data).
E. coli, Klebsiella spp. and P. aeruginosa discussion and comparison
E. coli bacteraemia continued to account for the highest count and rate of all the Gram-negative organisms, with 44,879 cases and a rate of 76.6 cases per 100,000 population reported in FY 2025 to 2026. This was followed by Klebsiella spp. (n = 13,961, 23.8) and then P. aeruginosa (n = 4,728, 8.1) bacteraemia.
Long-term trends of E. coli and Klebsiella spp. bacteraemia continued to show increasing incidence rates in overall and CO cases since the start of mandatory surveillance. P. aeruginosa bacteraemia rates remained broadly stable, although a small increase in overall incidence rate was seen in the latest FY, largely driven by an increase in the CO rate.
Among the Gram-negative bacteraemia cases with a known primary focus of infection, the urinary tract remained a major source of bacteraemia for all Gram-negatives, accounting for 48.6% of E. coli, 36.2% of Klebsiella spp. and 33.5% of P. aeruginosa.
The age distribution of cases was similar in all 3 Gram-negative bacteraemias included in the mandatory surveillance programme. However, there were differences in the distribution of cases by sex. E. coli cases were more evenly distributed between male and female cases, while Klebsiella spp. and P. aeruginosa cases were more common in male cases, particularly in the older age groups.
Age-sex-standardised rates across all 3 of the Gram-negative bloodstream infections showed variations in geographic distributions in England. Rates were generally highest in London and in Northern regions of England. For all infections, those living in more deprived areas appeared to be disproportionately affected. After age-sex-standardisation, Black and Asian ethnic groups had relatively higher incidence rates compared with the White ethnic group.
Decreasing CFRs were seen in FY 2025 to 2026 for all 3 Gram-negative bloodstream infections, with P. aeruginosa at 23.3%, Klebsiella spp. at 17.4%, and E. coli at 14.0%. The mortality rate of each infection remained relatively stable at 10.7 deaths per 100,000 population for E. coli, 4.1 for Klebsiella spp., and 1.9 for P. aeruginosa.
Meticillin-resistant Staphylococcus aureus bacteraemia (MRSA)
Total reports
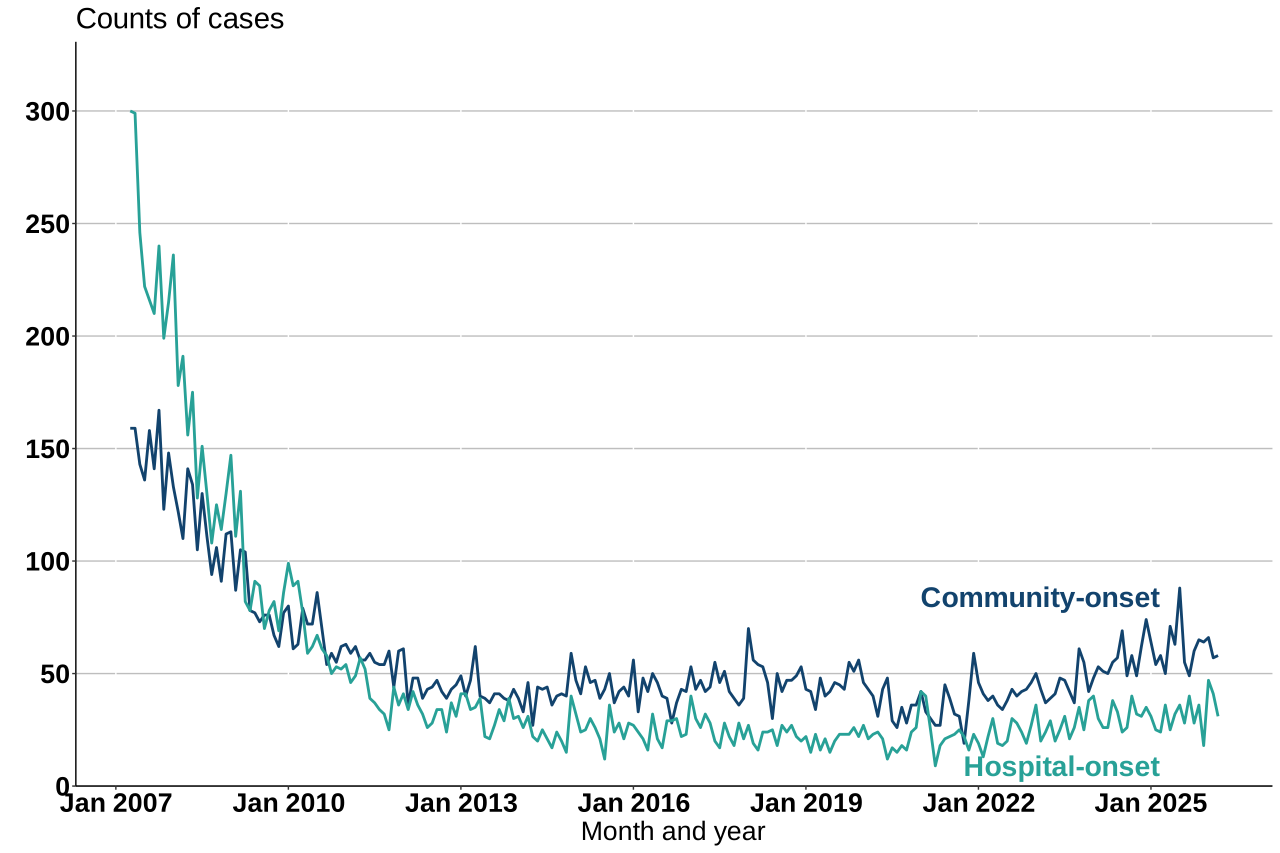
A total of 1,144 cases of MRSA bacteraemia were reported by NHS acute trusts in England in FY 2025 to 2026. This represented a rate of 2.0 cases per 100,000 population. At the start of surveillance in FY 2007 to 2008, MRSA levels were at their highest at 8.6 cases per 100,000 population. This was followed by declining rates for the next 7 years and a plateau during the COVID-19 pandemic. Subsequently, the incidence rate has increased year-on-year, with a 7.3% increase in FY 2025 to 2026 compared with the previous year, but it has not reached the high levels at the start of surveillance (Figure 28 and Table S1 in the accompanying data).
Figure 28. Trends in the all case and hospital-onset rate of MRSA bacteraemia, in England, by FY April 2007 to March 2026
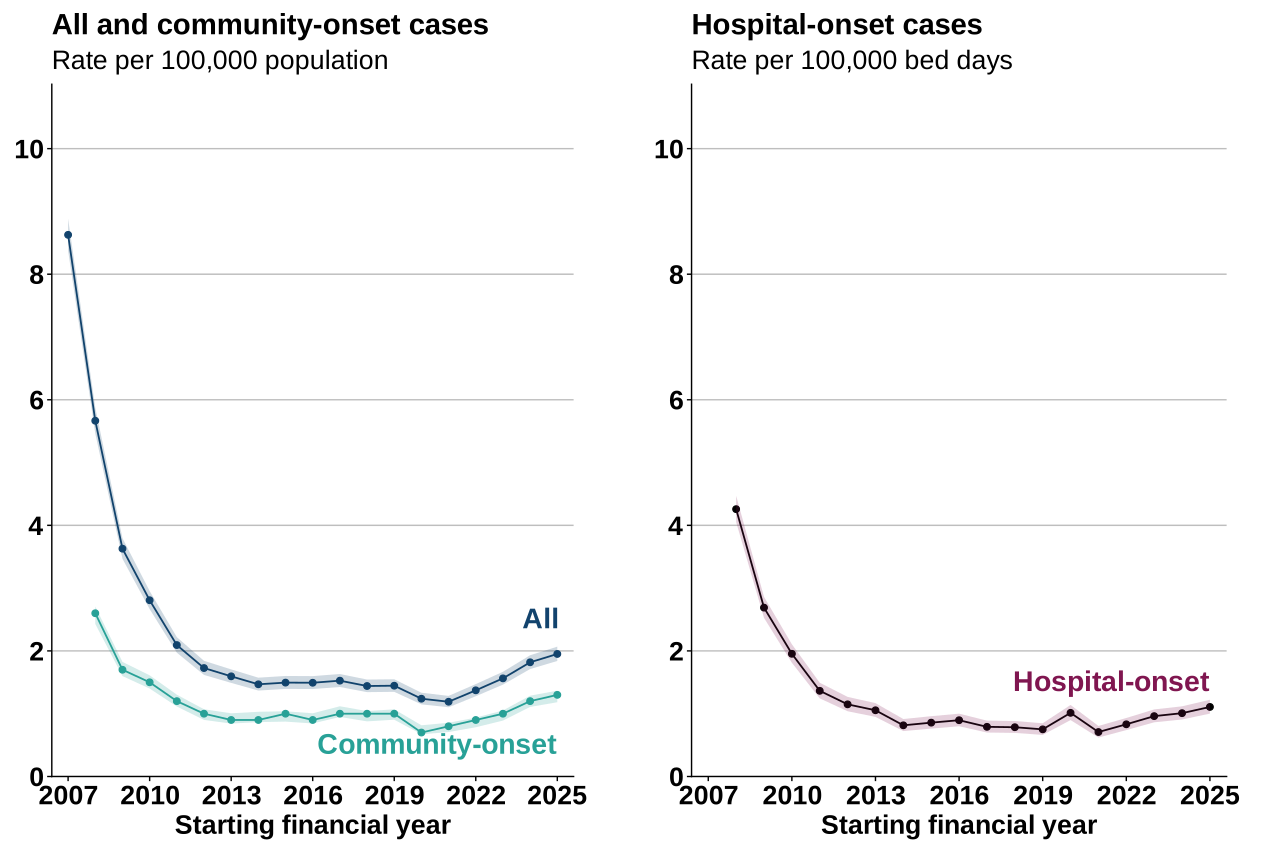
Note 1: shaded bands indicate 95% CIs.
In FY 2025 to 2026, there were 398 HO cases with a rate of 1.1 cases per 100,000 bed-days. Comparing FY 2025 to 2026 with the previous year (1.0 cases per 100,000 bed-days), there has been a 9.8% increase in the HO rate. The proportion of HO cases has declined from 54.7% in FY 2008 to 2009 to the current 34.8% in FY 2025 to 2026. Similar to the overall rate of MRSA bacteraemia, the HO rate has increased year-on-year since the COVID-19 pandemic.
In FY 2025 to 2026, there were 746 CO cases (1.3 cases per 100,000 bed-days), constituting 65.2% of cases. The CO rate has also decreased since the start of surveillance up to the COVID-19 pandemic, after which point it increased year-on-year, with a 6.5% increase since the previous year (Figure 29).
Figure 29. Monthly counts of MRSA bacteraemia by onset of infection, England, by FY April 2007 to March 2026
Seasonal trends
There has been no discernible seasonal trend in either CO or HO MRSA cases in mandatory surveillance (Figure 29 and Table S7 in the accompanying data).
Prior trust exposure
In FY 2025 to 2026, there were 398 HOHA cases. This was a rate of 1.1 cases per 100,000 bed-days, which was similar to the previous FY (1.0 cases per 100,000 bed-days) (Table S8 in the accompanying data).
There were 157 COHA cases, representing a rate of 0.4 cases per 100,000 bed-days and day-admissions. The rate was similar to the previous FY (0.3 cases).
There were 588 COCA cases for FY 2025 to 2026. This was a rate of 1.0 cases per 100,000 population, a slight increase of 3.1% since the last FY (1.0 cases per 100,000 population). Compared with FY 2019 to 2020 (0.7 cases per 100,000 population), the COCA rate increased by 40.0%. However, the underlying numbers are relatively small so caution should be exercised when interpreting rates.
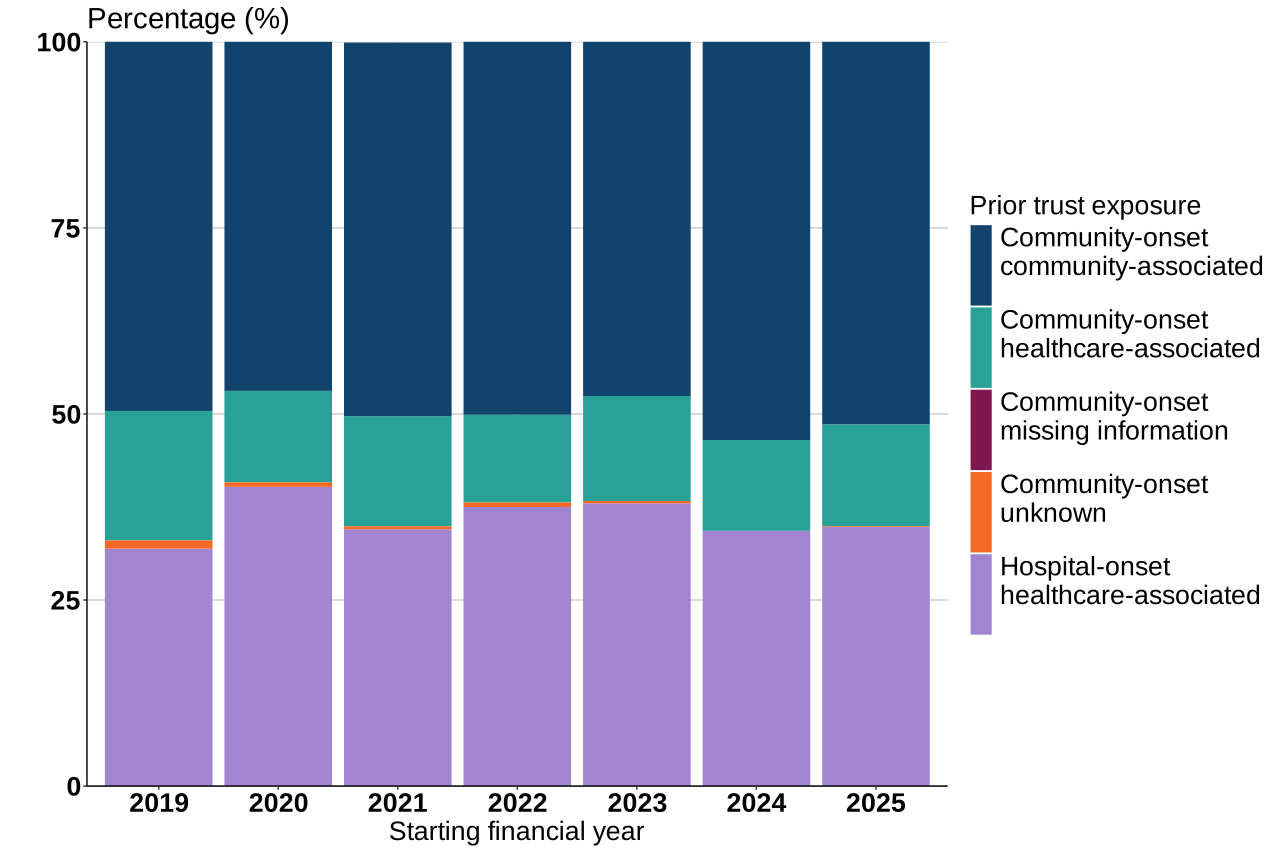
The distribution of cases by prior trust exposure has remained relatively stable since FY 2019 to 2020, the first full FY after prior trust exposure reporting became mandatory for MRSA. In FY 2025 to 2026 there were 51.4% COCA cases, 13.7% COHA cases and 34.8% HOHA cases (Figure 30).
Figure 30. Proportion of prior trust exposure of MRSA bacteraemia cases, England, by FY April 2019 to March 2026
Age and sex distribution
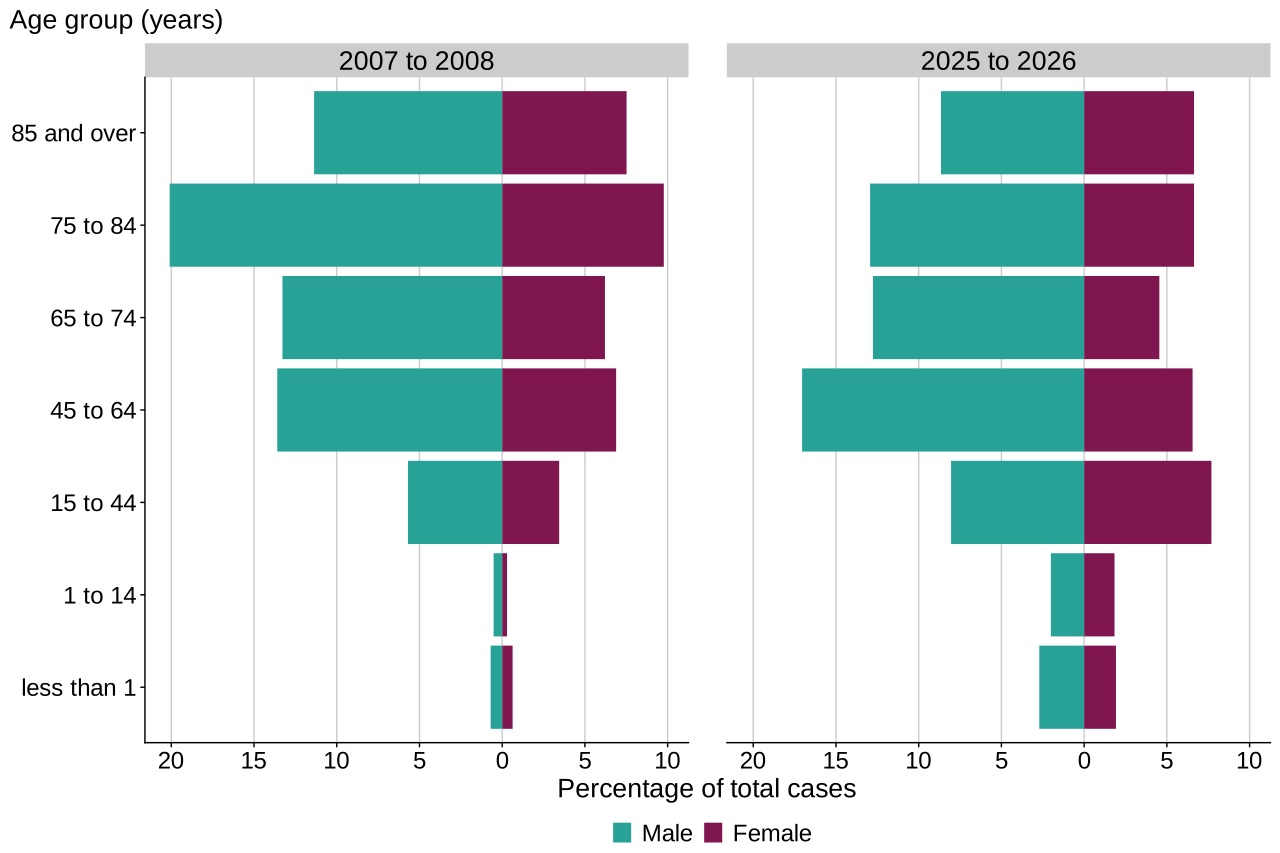
In FY 2025 to 2026, the highest proportion of male cases occurred among those aged 45 to 64 years (17.0%), while for female cases it occurred among those aged 15 to 44 years (7.7%), with the distribution among female cases more evenly distributed across age groups. This is a change from the distribution in FY 2007 to 2008, when the greatest percentage of total cases among both male and female cases was in those aged 75 to 84 years (20.1% and 9.8%, respectively). Additionally, there were slight increases in the proportion of cases aged 1 year and under in male and female cases, from 0.7% to 1.7% in male cases and from 0.6% to 1.6% in female cases, between FY 2007 to 2008 and FY 2025 to 2026. These increases were also seen in those aged 1 to 14 years, from 0.5% to 2.7% in male cases, and from 0.3% to 1.9% in female cases. However, caution is advisable when interpreting data for MRSA among those aged 14 years and under due to the small number of cases (Figure 31 and Table S2 in the accompanying data).
Figure 31. Age and sex distribution of MRSA bacteraemia by percentage of cases, England, by FY April 2007 to March 2026
Generally, higher rates of MRSA bacteraemia have been seen in male cases than female cases since the start of mandatory surveillance in FY 2007 to 2008. The greatest difference in rates by sex was seen in those aged 85 years and over, with a rate of 17.4 in male and 8.3 in female cases. Both male and female cases saw increasing rates of infection with increasing age, with the exception of those aged 1 year and under, where rates were higher than the subsequent age groups until the 85 years and over age group for both male and female cases (Figure 32).
Figure 32. Trends in age group and sex rates of MRSA bacteraemia, England, by FY April 2017 to March 2026
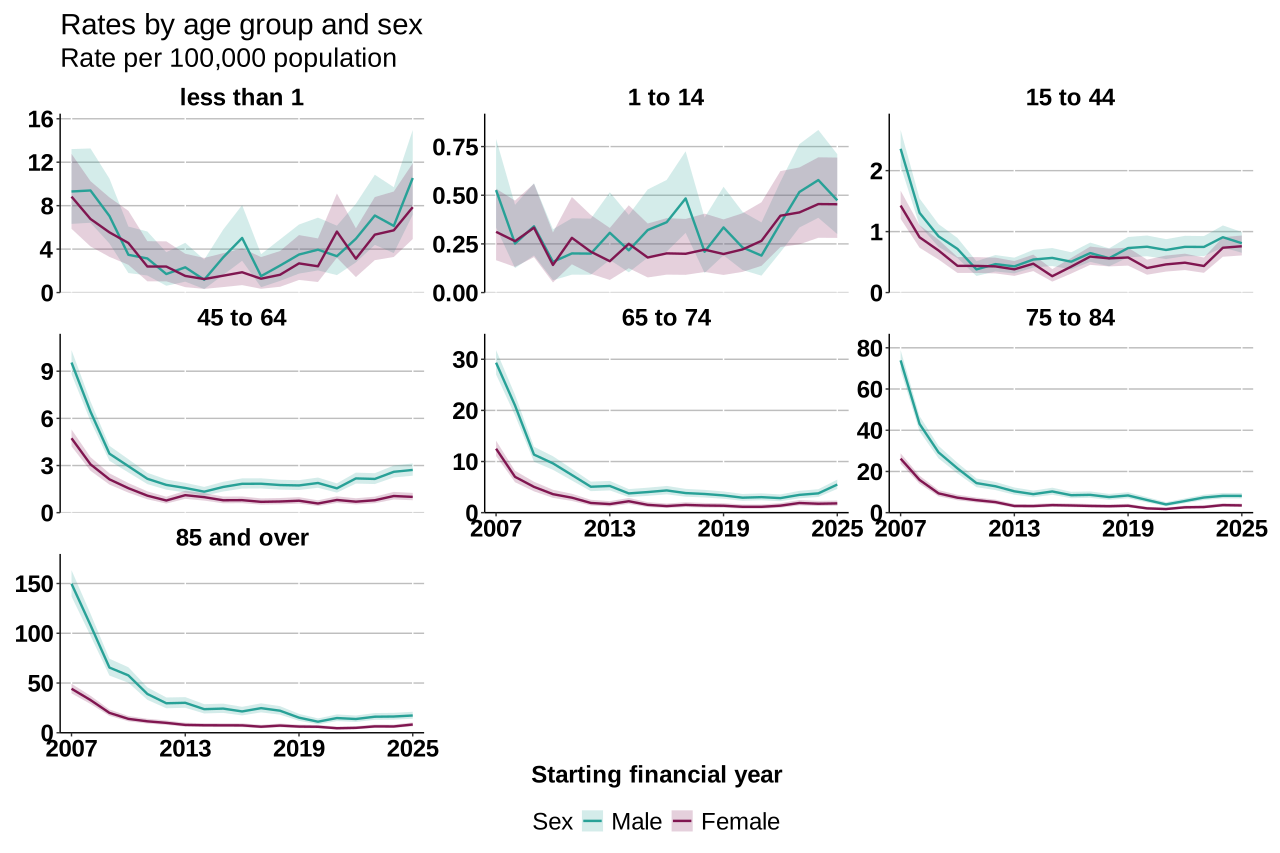
Note 1: shaded bands indicate 95% CIs.
Note 2: scales vary across graphs.
Trends by ethnicity
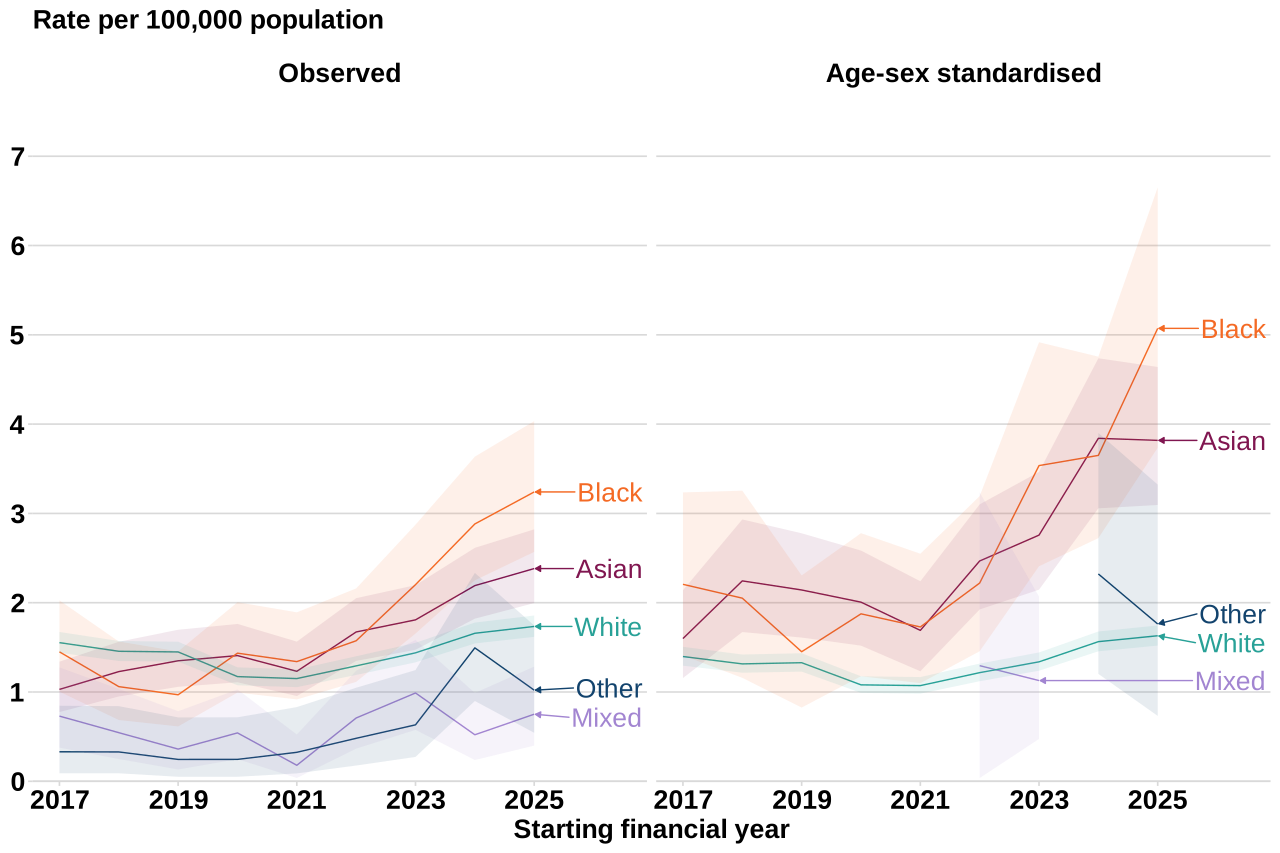
In FY 2025 to 2026, the observed incidence rate of MRSA bacteraemia varied by ethnicity. Rates were highest in the Black, Asian, and White ethnic groups (3.2, 2.4 and 1.7 cases per 100,000 population, respectively) and lowest in the Other and Mixed ethnic groups (1.0 and 0.8 cases per 100,000 population, respectively) (Figure 33).
Figure 33. MRSA bacteraemia rate by ethnicity, England, by FY April 2017 to March 2026
Note 1: shaded bands indicate 95% CIs.
The highest age-sex-standardised rate in FY 2025 to 2026 was seen in the Black ethnic group (5.1 cases per 100,000 population), followed by the Asian ethnic group (3.8 cases). There was a much sharper rise in the Black ethnic group since FY 2021 to 2022, seeing a near tripling in the incidence rate over 4 years. The difference in rates between the Black and Asian ethnic groups and the White ethnic group appears to be increasing. Age-sex-standardised rates for Mixed and Other ethnic groups could not be calculated for most of the period because their yearly counts were less than 10 for a given ethnic stratum. Therefore, the age-sex-standardised rates for these ethnic groups have high uncertainty and should be interpreted with caution.
Trends by deprivation
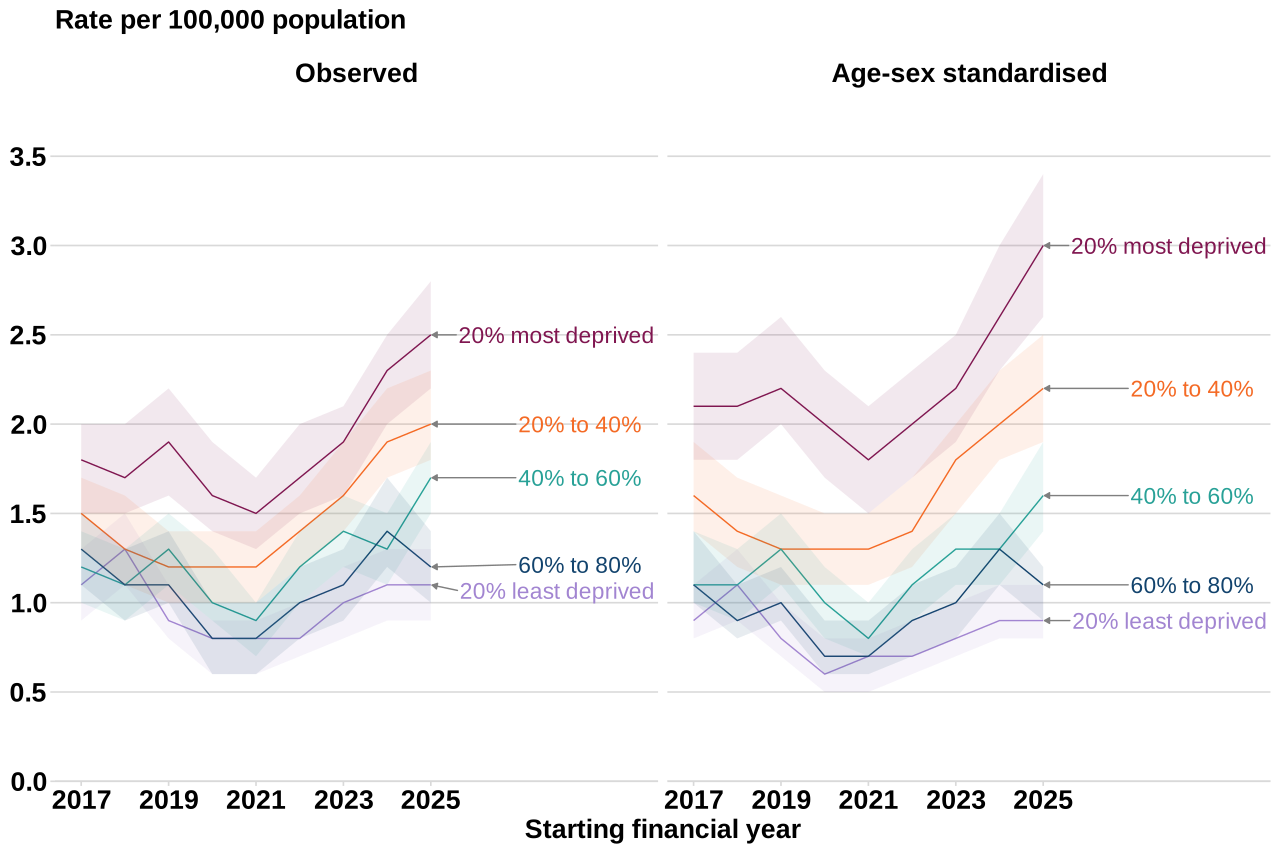
In FY 2025 to 2026, there were 2.5 cases per 100,000 people living in the 20% most deprived areas versus 1.1 cases per 100,000 people living in the 20% least deprived areas. Age-sex-standardised incidence rates showed greater variation by deprivation than the observed incidence rates. There were 3.0 and 0.9 cases per 100,000 population in the 20% most or 20% least deprived areas respectively. Since FY 2022 to 2023, the 2 most deprived quintiles have seen the greatest change in age-sex-standardised incidence of MRSA bacteraemia, increasing more sharply compared with other quintiles (Figure 34 and Table S13 in the accompanying data).
Figure 34. MRSA bacteraemia rate by deprivation, England, by FY April 2017 to March 2026
Note 1: shaded bands indicate 95% CIs.
Source of MRSA bacteraemia
The provision of information on the source of bacteraemia is voluntary and has declined over time in the MRSA surveillance. In FY 2007 to 2008, a total of 51.1% (n = 2,414) of MRSA records had entries (including ‘unknown’) for the source of bacteraemia. By FY 2025 to 2026, only 28.0% (n = 320) of MRSA records had entries for the source of bacteraemia (Table S14 in the accompanying data).
The most common source of MRSA bacteraemia in FY 2025 to 2026 was skin and soft tissue infection (38.8%). The proportion of infections caused by skin and soft tissue infection has steadily risen from 16.4% in FY 2007 to 2008. The second most common source was ‘other’ (35.3%).
The source of bacteraemia was a catheter or line for 14.7% of cases in FY 2025 to 2026, representing a decline from 25.6% of cases in FY 2007 to 2008.
The source of bacteraemia was pneumonia for 10.0% of cases, a slight increase from the proportion of 8.5% in FY 2007 to 2008. The underlying numbers are relatively small so caution should be exercised when interpreting these findings.
Geographic distribution
The crude and age-sex-standardised rates are presented across ICBs for FY 2025 to 2026. The highest age-sex-standardised incidence rates (cases per 100,000 population) were seen in North East London ICB (4.0), South East London ICB (3.6), Bristol, North Somerset and South Gloucestershire ICB (3.3), and Somerset ICB (3.2). The lowest age-sex-standardised incidence rates (cases per 100,000 population) were seen in Norfolk and Suffolk ICB (0.8), Black Country ICB (1.1) and Lincolnshire ICB (1.1). ICBs with 10 or fewer MRSA bacteraemia cases had too few counts to be able to calculate precise age-sex-standardised rates (Figure 35 and Table S6 in the accompanying data).
Figure 35. Geographic distribution of MRSA bacteraemia rate, by ICB, England, by FY April 2025 to March 2026
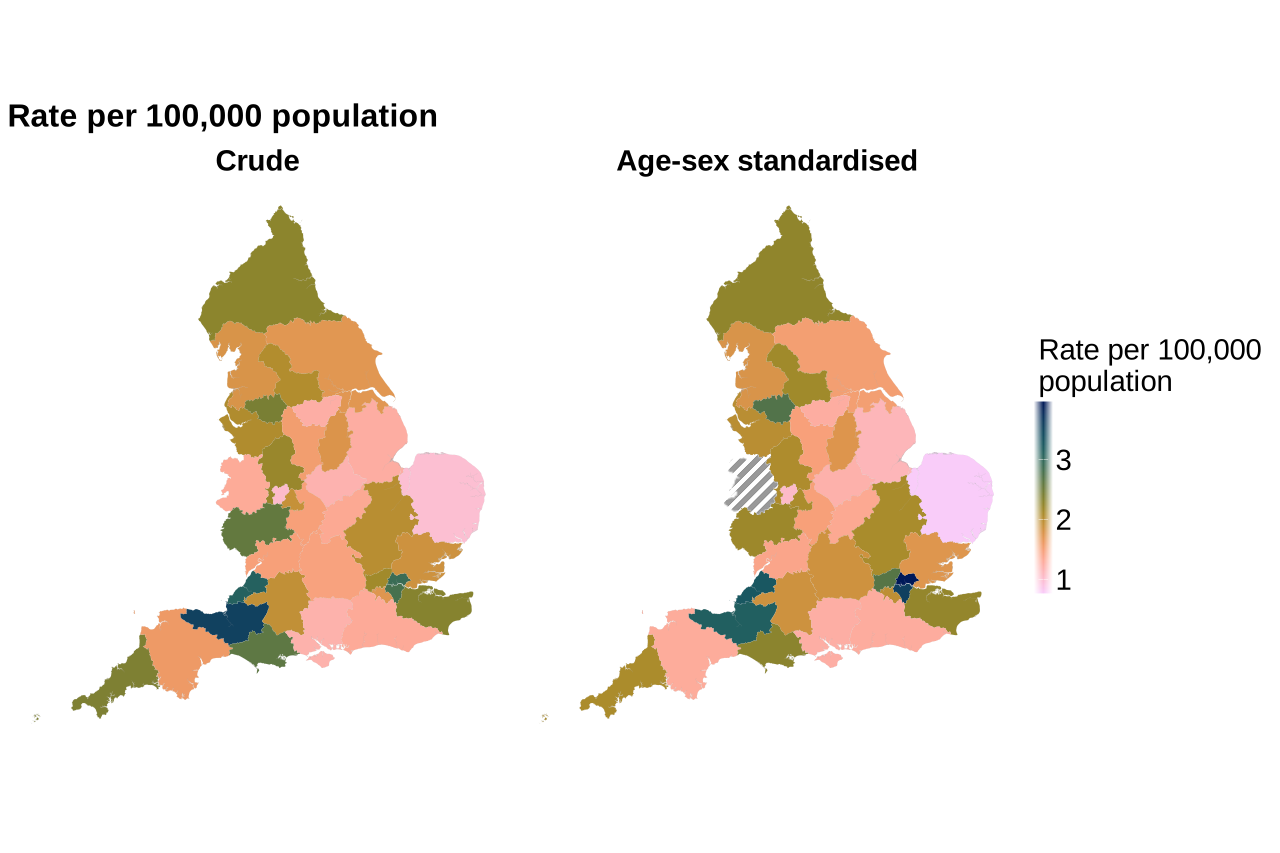
Note 3: ICBs which had 10 or fewer MRSA bacteraemia cases in FY 2025 to 2026 are marked as a hashed area. Their crude rates are still available. Although they had too few counts for standardisation this does not necessarily mean that their age-sex-standardised rate would have been the lowest, only that they would be too imprecise to use (Table S6 in the accompanying data).
Mortality
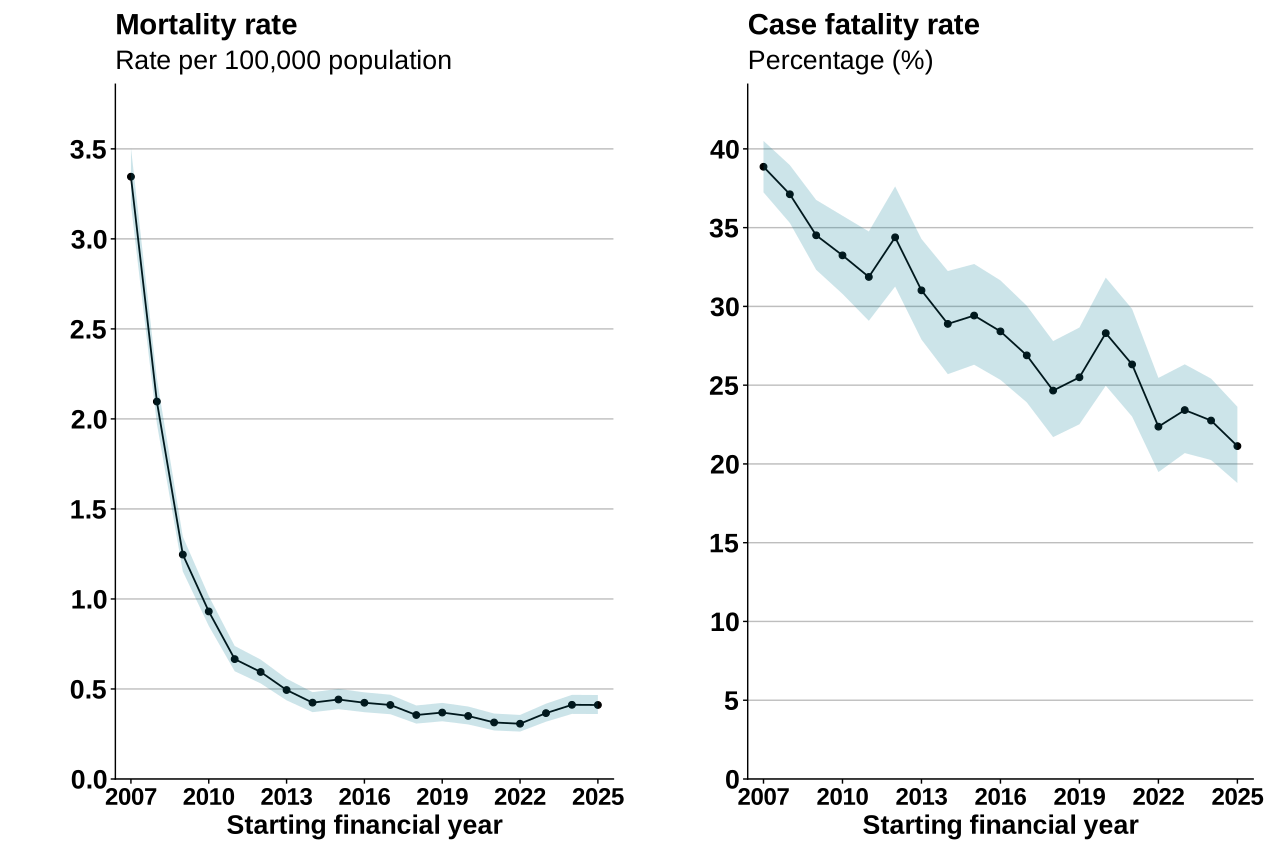
In FY 2025 to 2026, among the 1,144 MRSA bacteraemia cases reported in England, information on mortality was available for 98.9% (1,131 reports) (Table S9 in the accompanying data). Of those, there were 241 deaths within 30 days of an MRSA bacteraemia diagnosis, a mortality rate of 0.4 deaths per 100,000 population. There was an overall CFR of 21.1% (Figure 36).
Figure 36. CFR and mortality rate of MRSA bacteraemia, England, by FY April 2007 to March 2026
Note 1: shaded bands indicate 95% CIs.
Note 2: scales vary across graphs.
The CFR has been declining since the start of the surveillance (FY 2007 to 2008) compared with FY 2025 to 2026, from 38.9% to 21.1%. The mortality rate has decreased over this period from 3.3 to 0.4 deaths per 100,000 population. There was a sharp decrease in mortality rate from FY 2007 to 2008 until around FY 2014 to 2015, and subsequently the mortality rate has plateaued.
Variation by onset of bacteraemia
The mortality rate of CO cases was 0.3 deaths per 100,000 population in FY 2025 to 2026, which has remained fairly consistent since FY 2014 to 2015 (Table S11 in the accompanying data). The mortality rate of HO cases was 0.3 deaths per 100,000 bed-days in FY 2025 to 2026 and remained consistent over the same period as CO cases.
Comparing FY 2025 to 2026 to the previous year, the CFR decreased in HO cases from 24.3% to 23.2% and in CO cases from 21.9% to 20.1%, respectively.
Variation by age and sex
In FY 2025 to 2026, except for those aged 1 year and under, the mortality rate and CFR increased with age (Table S10 in the accompanying data). Overall, the mortality rate was higher in male cases except for those aged under 1 year of age. The CFR was greater in female cases except for those aged between 1 to 14 years of age. The highest mortality rate in male cases was in those aged 85 years and over (8.3 deaths per 100,000 population) and those aged 75 to 84 years (1.9 deaths per 100,000 population), and CFRs were similarly the highest at 47.5% and 23.4%, respectively.
The mortality rate in female cases was also higher in the oldest age groups, with a rate of 3.8 deaths per 100,000 population among those aged 85 years and over and 1.3 deaths per 100,000 population among those aged 75 to 84 years. The CFRs of both these groups were 46.1% and 38.7%, respectively.
There were relatively fewer deaths in cases aged 1 year and under and in cases aged 1 to 14 years compared with other age groups. However, the CFR in infants aged 1 year and under remained slightly elevated for female cases at 13.6%. In FY 2025 to 2026, there were zero deaths within 30 days in female cases aged 1 to 14 years.
Variation by region
The CFR in FY 2025 to 2026 was highest in the South West (27.2%), followed by the East of England (23.2%) and the South East (20.3%). The CFR remained lowest in the North East and Yorkshire at 17.6%, followed by London (17.9%) (Table S12 in the accompanying data).
Meticillin-sensitive Staphylococcus aureus (MSSA) bacteraemia
Total reports
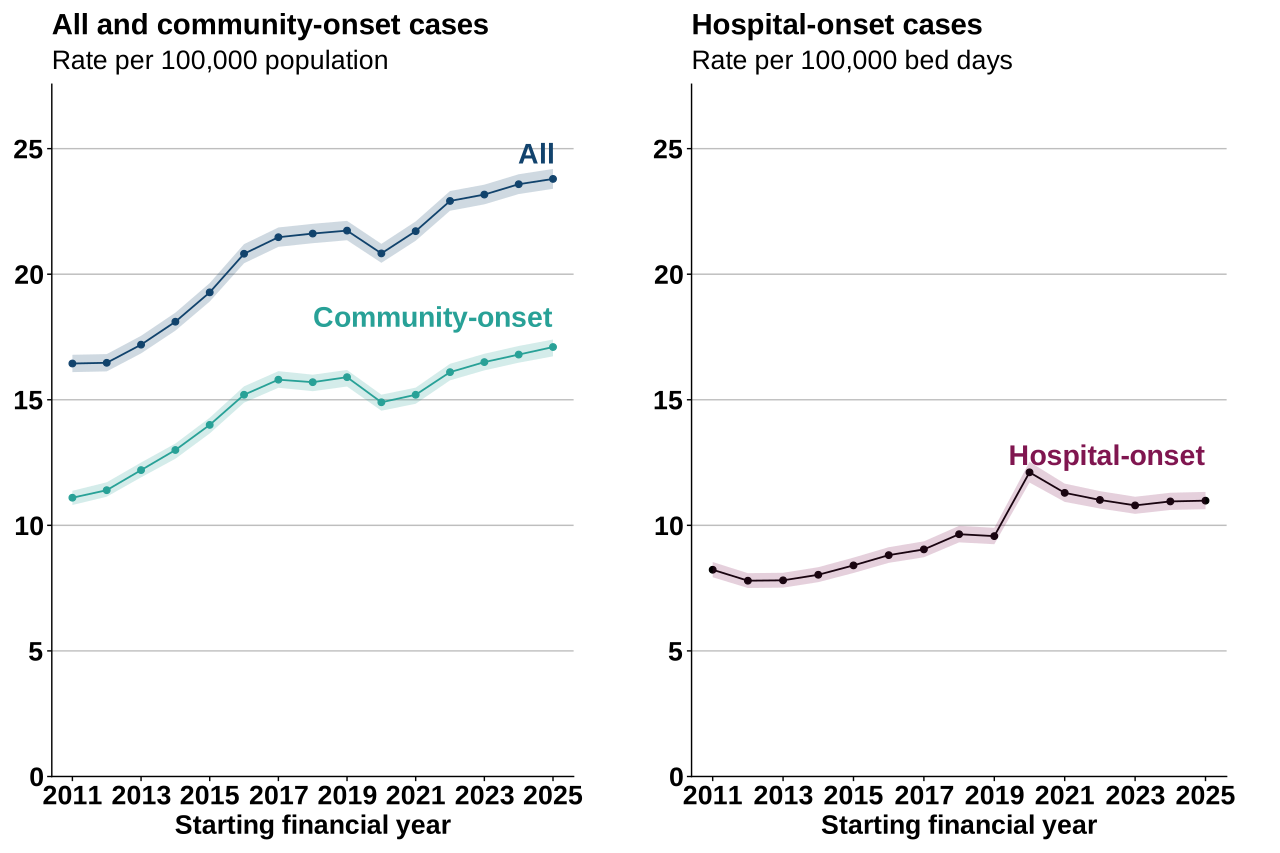
A total of 13,948 cases of MSSA bacteraemia were reported by NHS acute trusts in England in FY 2025 to 2026. Since surveillance began, the rate of all MSSA cases per 100,000 population has risen every year, except during the pandemic, from 16.4 (FY 2011 to 2012) to 23.8 (FY 2025 to 2026). These increases have been relatively small but consistent. For example, for FY 2025 to 2026, the rate increased by 0.9% compared with the previous year (23.6 cases per 100,000 population) (Figure 37 and Table S1 in the accompanying data).
Figure 37. Trends in the rate of MSSA bacteraemia, England, by FY April 2011 to March 2026
Note 1: shaded bands indicate 95% CIs.
Since FY 2011 to 2012, the HO incidence rate has increased from 8.2 to 11.0 cases per 100,000 bed-days in FY 2025 to 2026. There was a sharp rise in the HO rate in FY 2020 to 2021, during the COVID-19 pandemic, followed by a subsequent decline. The rate in FY 2025 to 2026 was the same as the previous year.
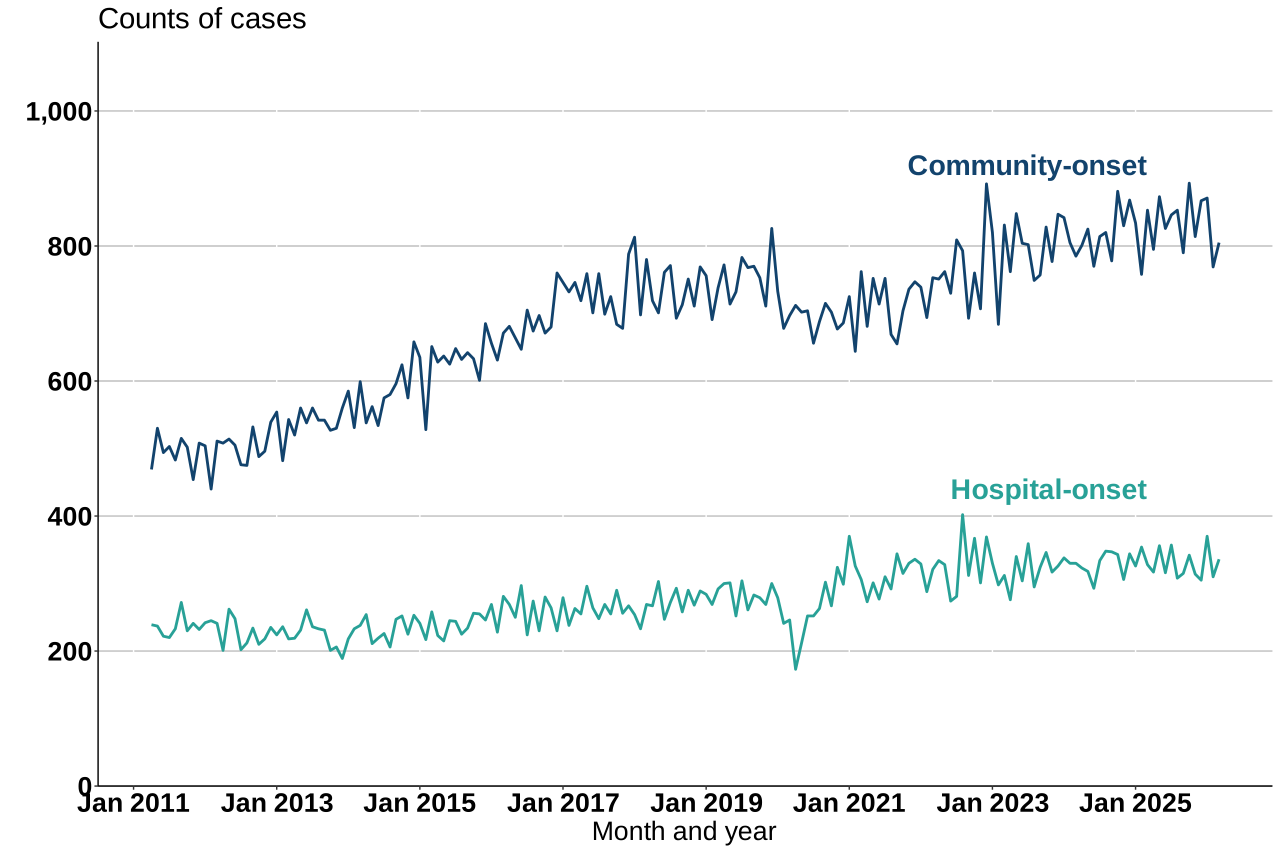
The CO rate has increased since the start of surveillance, rising from 11.1 in FY 2011 to 2012 to 17.1 per 100,000 population in FY 2025 to 2026, the highest since surveillance began and with year-on-year increases in the intervening years. Similar to trends in the overall MSSA rate, the increases have been relatively small but consistent, with a 1.5% increase in FY 2025 to 2026 compared with the previous year. The recent increases, particularly those of CO, can be seen at a monthly level by onset status (Figure 38).
Figure 38. Monthly counts of MSSA bacteraemia by onset of infection, England, by FY April 2011 to March 2026
Seasonal trends
There has been no discernible seasonal trend in either CO or HO MSSA cases in mandatory surveillance (Figure 38 and Table S7 in the accompanying data).
Prior trust exposure
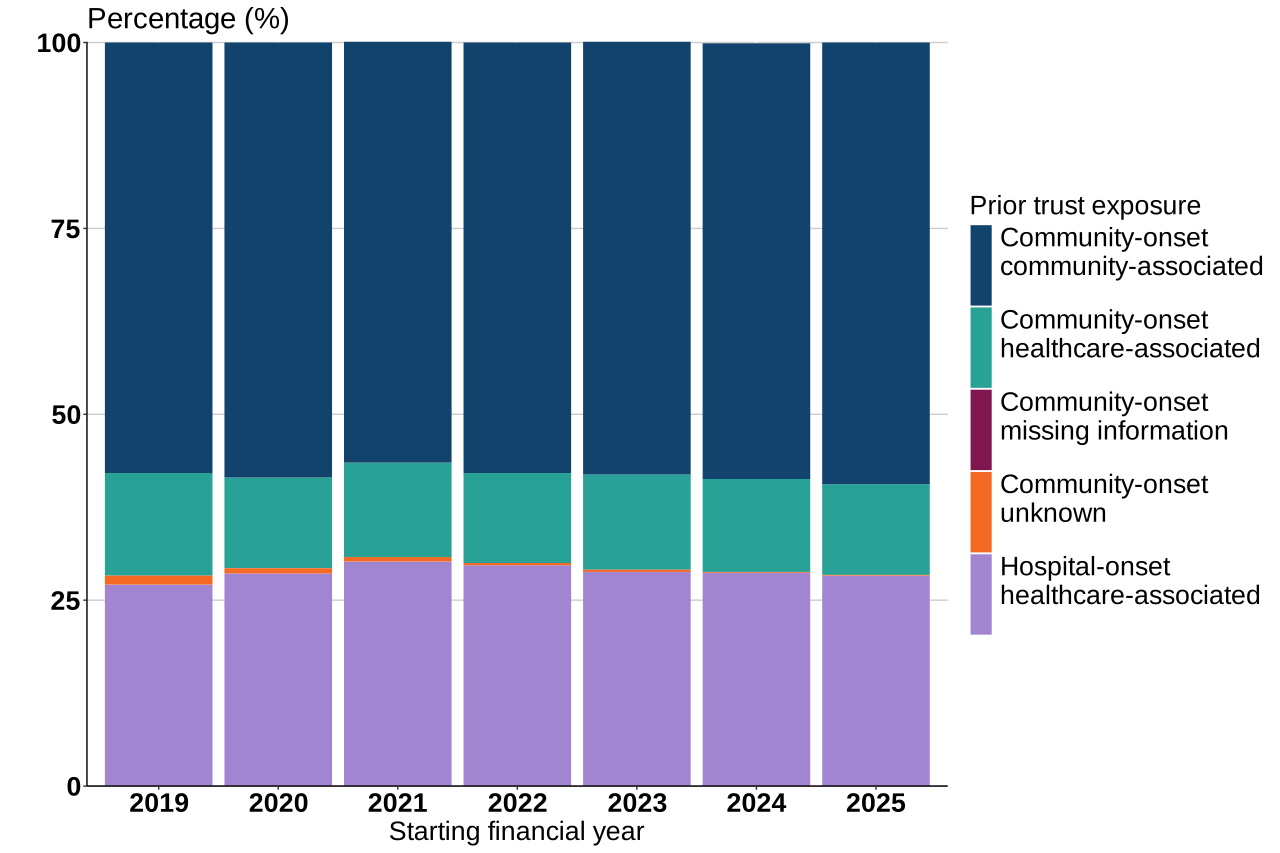
There were 3,946 cases of HOHA MSSA bacteraemia in FY 2025 to 2026 (Table S8 in the accompanying data). This was a rate of 11.0 cases per 100,000 bed-days, which was the same as the previous year.
There were 1,703 COHA cases in FY 2025 to 2026, with the rate remaining the same as the previous year at 4.3 cases per 100,000 bed-days and day admissions.
There were 8,291 COCA cases, a rate of 14.1 cases per 100,000 population. This was an increase of 2.8% from the previous year.
Since FY 2019 to 2020, the first full FY after prior trust exposure reporting became mandatory for MSSA, the distribution of cases by prior trust exposure has remained relatively stable. In FY 2025 to 2026, 59.4% of cases were COCA, 12.2% were COHA and 28.3% were HOHA (Figure 39).
Figure 39. Proportion of prior trust exposure of MSSA bacteraemia cases, England, by FY April 2019 to March 2026
Age and sex distribution
The distribution of cases by age and sex for MSSA bacteraemia has remained relatively stable despite a general increase in the number of cases and incidence rates (Figure 40, and Table S2 of the accompanying data).
Figure 40. Age and sex distribution of MSSA bacteraemia by percentage, England, by FY April 2011 to March 2026
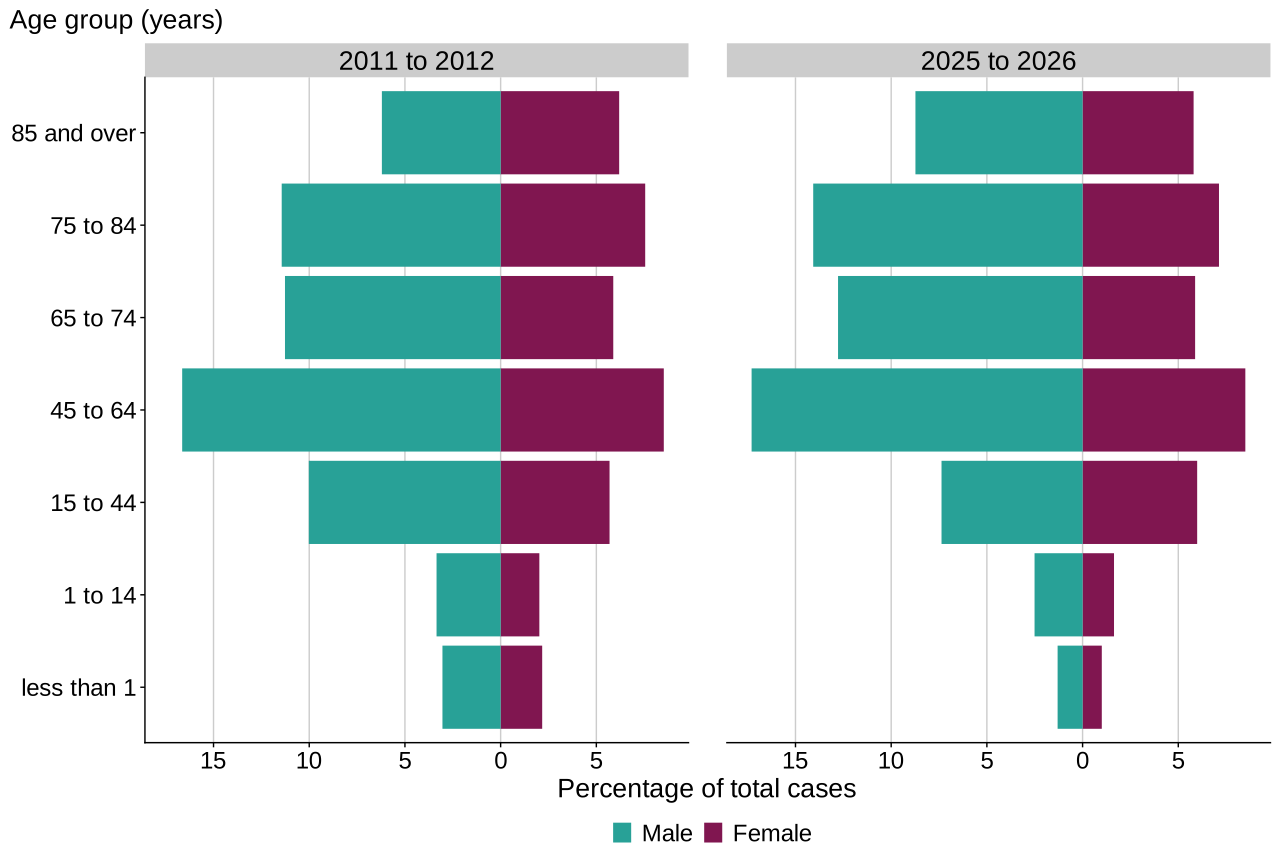
In FY 2025 to 2026, the bulk of the total cases were in adults aged 45 years and over, with twice as many male as female cases. Male cases had increased MSSA incidence rates in all age groups compared with female cases. Compared with FY 2011 to 2012, the proportion of cases in infants aged 1 year and under in FY 2025 to 2026 was the only group to decline for both male and female cases, from 3.0% to 1.3% in male cases and from 2.2% to 1.0% in female cases.
Between FY 2011 to 2012 and FY 2025 to 2026, the highest rates of MSSA incidence in male cases were seen among individuals aged 75 to 84 years and aged 85 years and over versus other age groups, increasing from 77.3 to 108.0 per 100,000 population and from 137.6 to 213.8, respectively. Those aged 85 years and over also saw the largest increase in rate since FY 2011 to 2012 for male and female cases. The trends in MSSA bacteraemia over time by age and sex were very similar to trends seen in MRSA bacteraemia (Figure 32 and Figure 41).
Figure 41. Trends in age group and sex rates of MSSA bacteraemia, England, FY April 2011 to March 2026
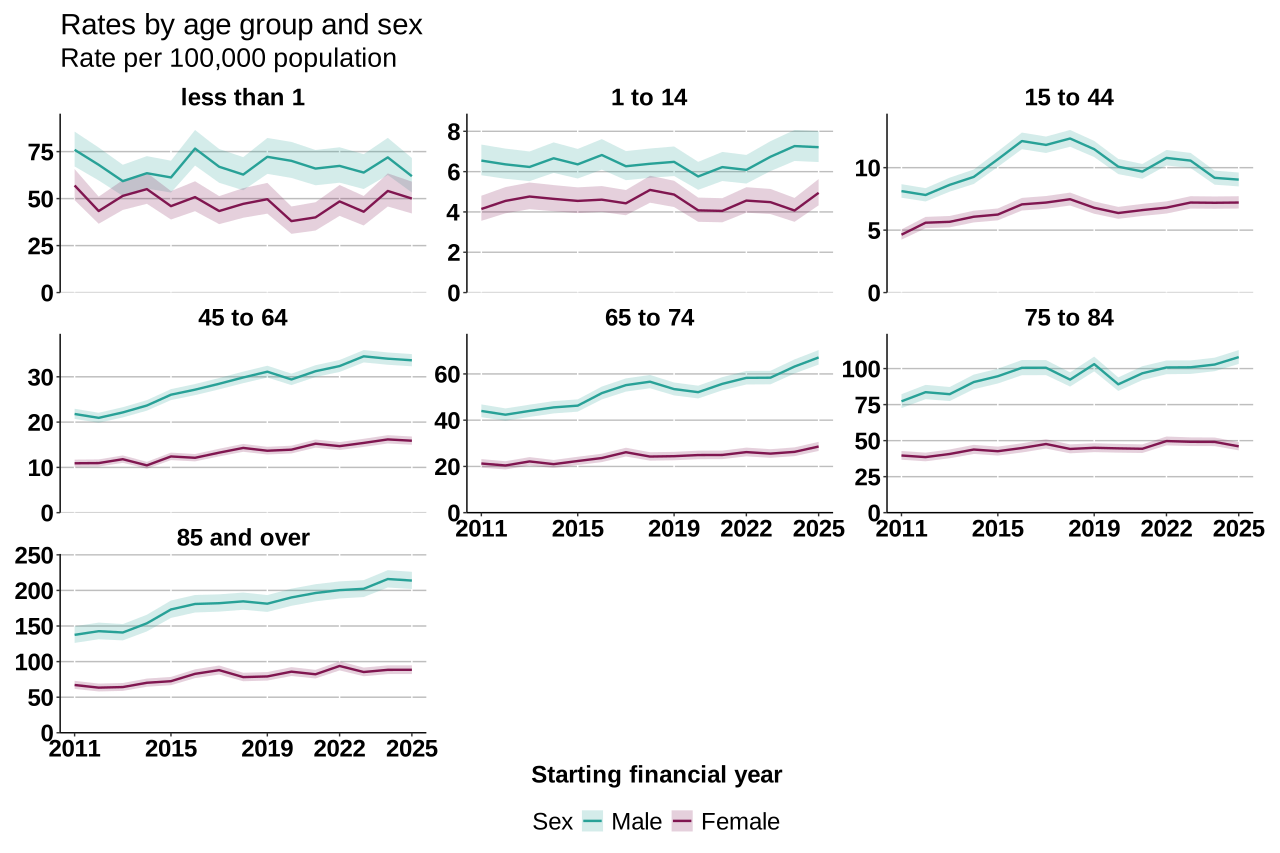
Note 1: shaded bands indicate 95% CIs.
Note 2: scales vary across graphs.
Similarly to male cases, the highest incidence rates in female cases in FY 2011 to 2012 and FY 2025 to 2026 were seen among those aged 75 to 84 years and aged 85 years and over versus other age groups, increasing from 39.7 to 46.0 cases per 100,000 population and from 67.1 to 88.5 cases per 100,000 population, respectively. Those aged 1 year and under also had relatively high rates of MSSA bacteraemia, with a male rate of 61.9 cases per 100,000 and a female rate of 50.0 cases per 100,000 in FY 2025 to 2026.
Trends by ethnicity
In FY 2025 to 2026, the observed incidence rate of MSSA bacteraemia was highest in the White ethnic group (24.9 cases per 100,000 population), followed by the Black and Asian ethnic groups (16.4 and 13.8 cases per 100,000 population, respectively) and lowest in the Mixed and Other ethnic groups (8.2 and 6.4 cases per 100,000 population, respectively). For age-sex-standardised incidence rates, the White, Black and Asian ethnic groups were much more similar (23.3, 22.8 and 20.3 cases per 100,000 population) (Figure 42).
Figure 42. MSSA bacteraemia rate by ethnicity, England, by FY April 2011 to March 2026
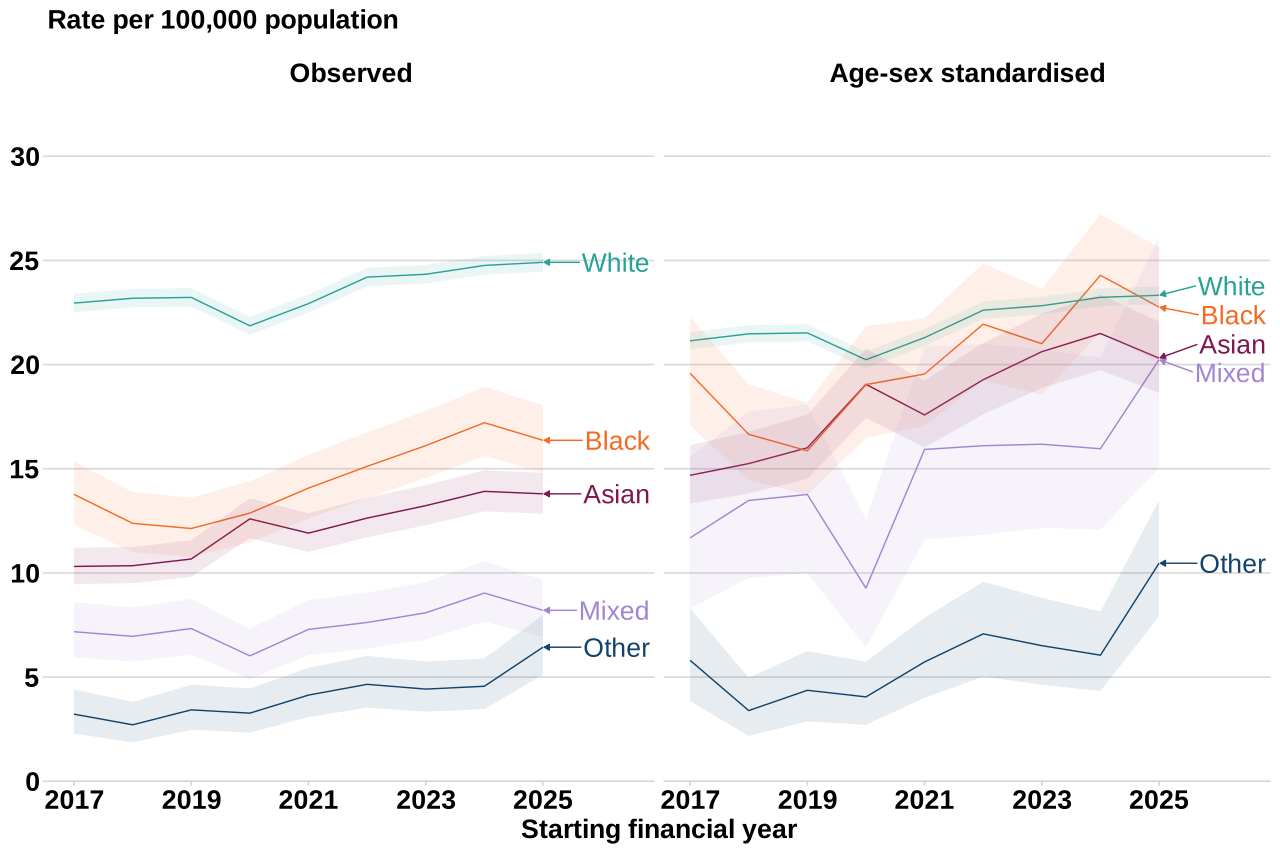
Note 1: shaded bands indicate 95% CIs.
Trends by deprivation
In FY 2025 to 2026, there were 26.1 cases per 100,000 people living in the 20% most deprived areas versus 18.3 cases per 100,000 people living in the 20% least deprived areas. The observed incidence rate of MSSA bacteraemia generally increased with deprivation. The general trend since FY 2020 is an increase in incidence across all IMD quintiles, except for a recent drop in the 20% most deprived level (Figure 43 and Table S13 in the accompanying data).
Figure 43. MSSA bacteraemia rate by deprivation, England, by FY April 2017 to March 2026
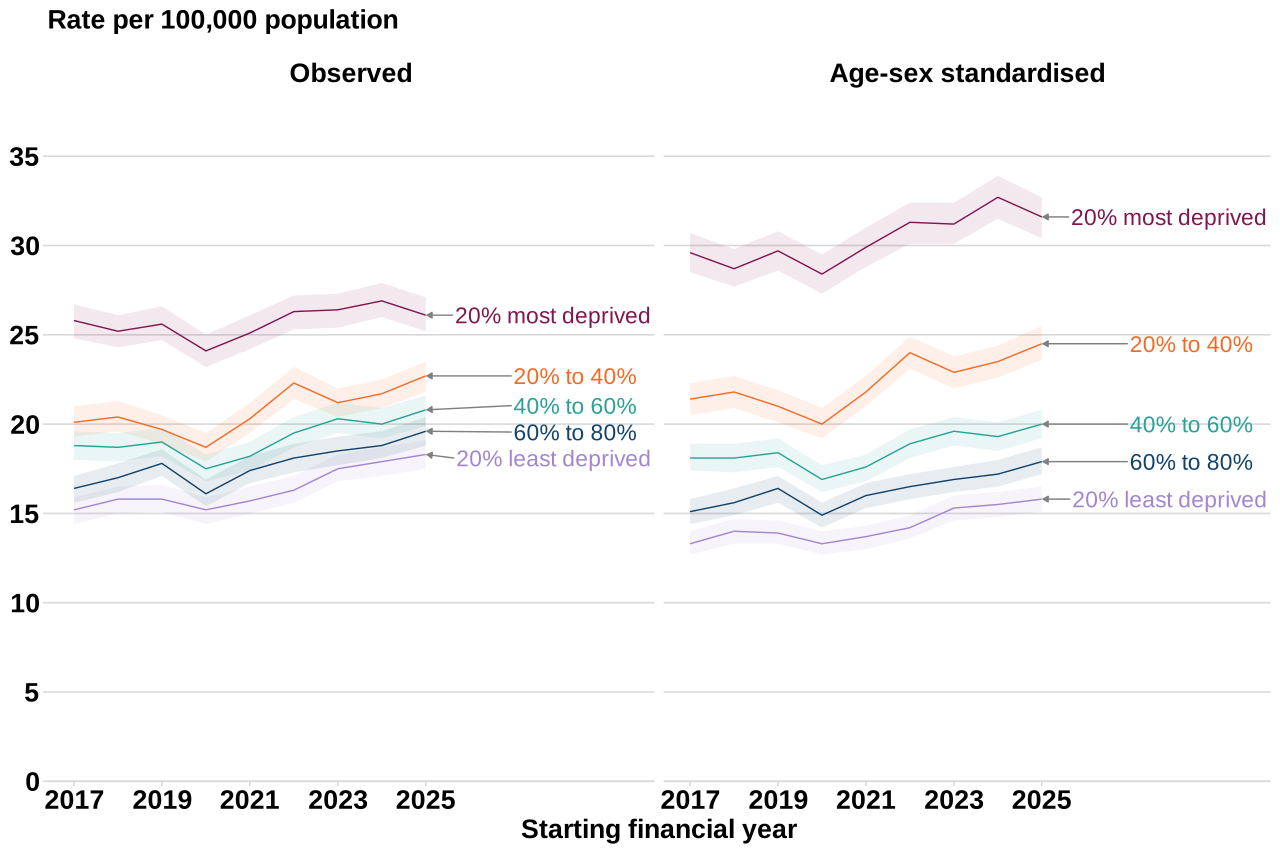
Note 1: shaded bands indicate 95% CIs.
Age-sex-standardised incidence rates in 2025 to 2026 showed greater variation by deprivation than the observed incidence rates, with 31.6 and 15.8 cases per 100,000 population in the 20% most and 20% least deprived areas respectively. Similar to the observed incidence rates, with age-sex standardisation, more deprived areas experienced increased incidence of MSSA bacteraemia.
Source of MSSA bacteraemia
The number of records reporting a source of bacteraemia has been steadily declining since the start of MSSA mandatory surveillance. In FY 2011 to 2012, a total of 3,305 (37.7%) records had entries for the source of bacteraemia (Table S4 in the accompanying data). By FY 2025 to 2026, a total of 3,784 (27.1%) had entries for the source of bacteraemia due to a lack of reporting.
The most reported source of MSSA bacteraemia was ‘other’ at 40.4% in FY 2025 to 2026. This was followed by skin and soft tissue infections at 29.5%. The percentage of cases caused by skin and soft tissue infections has increased over time from 20.3% in FY 2011 to 2012.
The percentage of MSSA cases with catheter or line as the reported source of bacteraemia was 15.6%. Overall, 12.3% of cases had pneumonia as the reported source of bacteraemia.
Geographic distribution
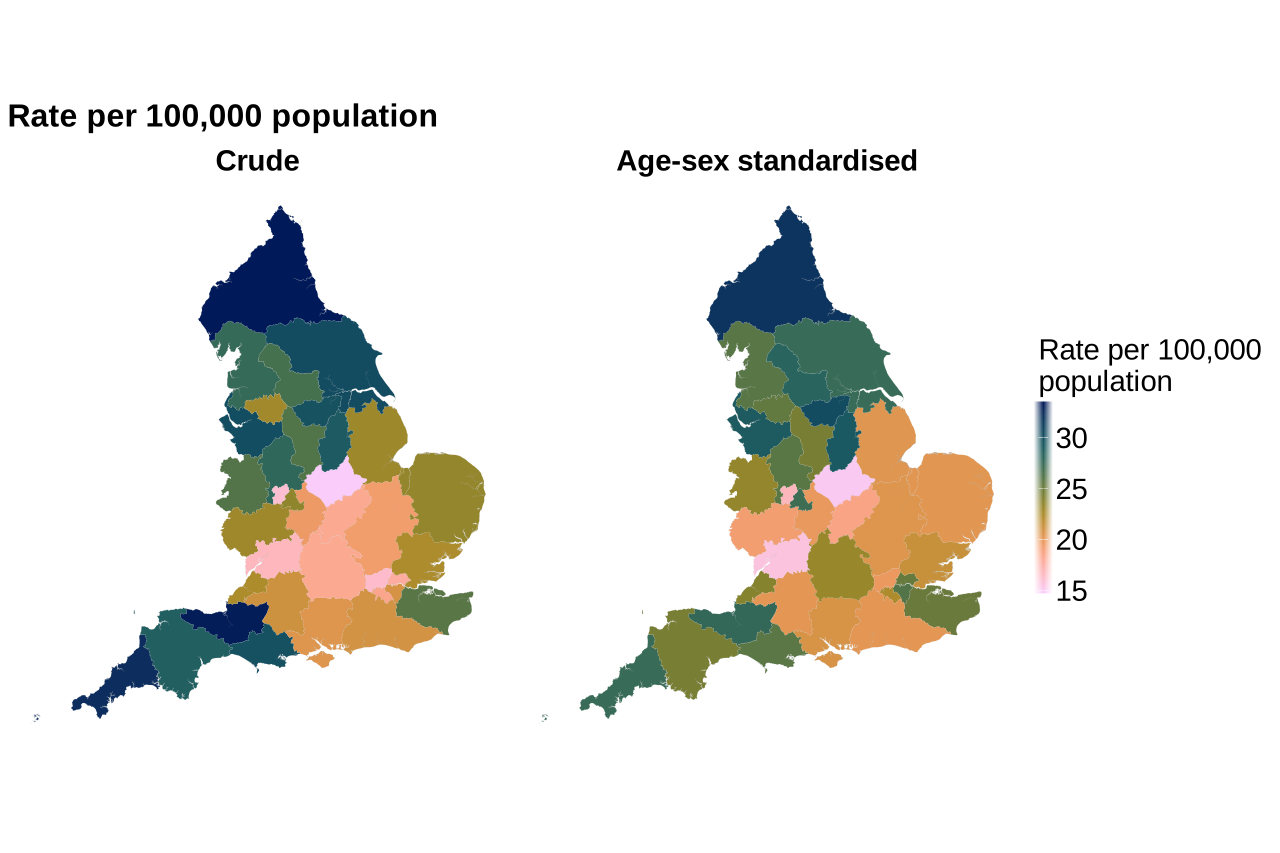
Crude and age-sex-standardised rates of MSSA bacteraemia are presented across ICBs for FY 2025 to 2026. The ICBs with the highest age-sex-standardised rates (cases per 100,000 population) were North East and North Cumbria ICB (32.1), South Yorkshire ICB (30.4), Nottingham and Nottinghamshire ICB (29.4), and Cheshire and Merseyside ICB (29.2). The ICBs with the lowest age-sex-standardised rates were Leicester, Leicestershire and Rutland ICB (15.0), Gloucestershire ICB (15.6), Black Country ICB (16.8), and Northamptonshire ICB (18.6) (Figure 44 and Table S6 in the accompanying data).
Figure 44. Geographic distribution of MSSA bacteraemia rate, by ICB, England, by FY April 2025 to March 2026
Mortality
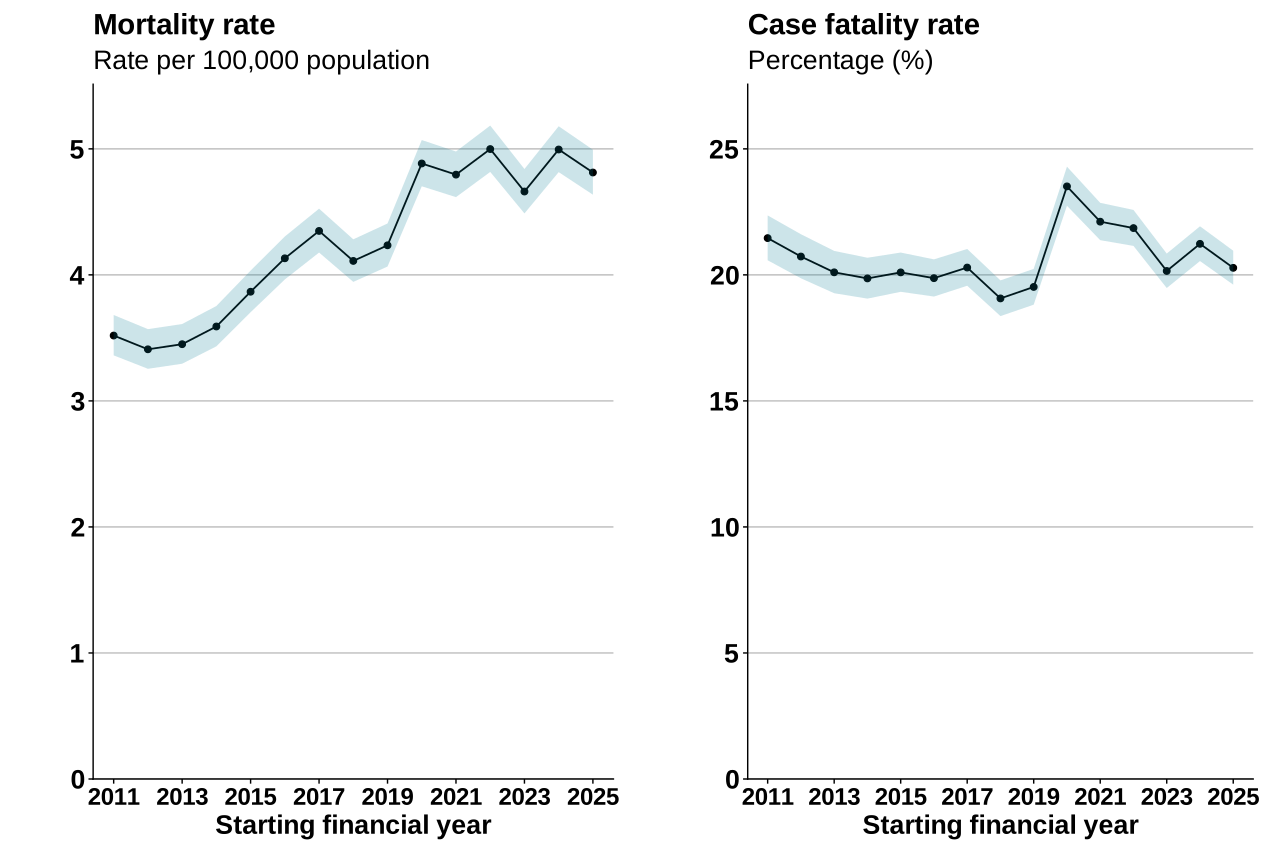
In FY 2025 to 2026, of the 13,948 MSSA bacteraemia cases reported in England, information on mortality was available for 99.2% (13,832) (Table S9 in the accompanying data). There were 2,821 deaths within 30 days of an MSSA bacteraemia diagnosis, with a mortality rate of 4.8 deaths per 100,000 population and a CFR of 20.3% (Figure 45).
Figure 45. CFR and mortality rate of MSSA bacteraemia, England, by FY April 2011 to March 2026
Note 1: shaded bands indicate 95% CIs.
Note 2: scales vary across graphs.
Compared to the previous FY, the CFR in FY 2025 to 2026 decreased from 21.2% to 20.3%. Over the same period, the mortality rate also decreased from 5.0 to 4.8 deaths per 100,000 population, higher than the start of surveillance but slightly reduced from the previous year.
Variation by onset of bacteraemia
The mortality rate of CO cases was 3.2 deaths per 100,000 population in FY 2025 to 2026 (1,900 deaths) (Table S11 in the accompanying data). This was similar to the previous year (3.3 deaths per 100,000 population).
The mortality rate of HO cases was 2.6 deaths per 100,000 bed-days in FY 2025 to 2026 (922 deaths), similar to the mortality rate of 2.7 deaths per 100,000 bed-days in the previous year.
Compared with the previous year, in FY 2025 to 2026, the CFR of CO cases decreased from 20.0% to 19.0%. For HO cases, the CFR decreased from 24.3% to 23.4%.
Variation by age and sex
In FY 2025 to 2026, the mortality rate and CFR increased with age except for those aged under 1 year (Table S10 in the accompanying data). The mortality rate was generally greater in male cases while the CFR was fairly similar in both male and female cases, with minor fluctuations.
The highest mortality rates in male cases were in those aged 85 years and over (92.3 deaths per 100,000 population), followed by those aged 75 to 84 years (29.3 deaths per 100,000 population). There were also higher CFRs in these age groups, at 43.3% (aged 85 years and over) and 27.2% (aged 75 to 84 years).
In female cases, the mortality rates were also higher in older age groups at 38.4 deaths per 100,000 population (aged 85 years and over) and 14.9 deaths per 100,000 population (aged 75 to 84 years). This represented CFRs of 43.5% and 32.4% in those respective age groups.
Among infants aged 1 year and under, the mortality rate in male cases was 2.7 deaths per 100,000 population compared with 1.8 deaths per 100,000 population in female cases. The numbers of deaths in the 1 year and under group are small so caution should be exercised in interpretation.
Variation by region
CFRs in FY 2025 to 2026 were highest in the North West (22.4%), followed by the East of England (21.2%) and the Midlands (21.2%) (Table S12 in the accompanying data). The CFR was lowest in London (17.6%), followed by the South West (19.1%), and the South East (19.8%).
MRSA and MSSA overview of trends
The rate of MRSA bacteraemia was highest when surveillance began in FY 2007 to 2008. Rates declined consistently for the next 7 years. Since FY 2020 to 2021, however, rates have increased year-on-year. In FY 2025 to 2026, the rate was 2.0 cases per 100,000, which continued this increasing trend. CO and HO rates of MRSA also continue to increase as of FY 2025 to 2026.
The rate of MSSA bacteraemia has increased year-on-year since surveillance began in FY 2011 to 2012, except during the COVID-19 pandemic. FY 2025 to 2026 saw a rate of 23.8 cases per 100,000 population, a continuation of the slight but steady increases seen each year. The CO rate followed a similar pattern to the overall rate and continued to increase in FY 2025 to 2026. The HO rate has declined since the COVID-19 pandemic and has remained fairly stable over the past 4 years.
Where the source of bacteraemia was available, skin and soft tissue infection was the most common reported source for MRSA (38.8%). For MSSA, skin and soft tissue infection was the most common (29.5%) after ‘other’ source (40.4%). For MRSA and MSSA bacteraemia, the proportion of infections caused by skin and soft tissue infection has risen over time. The next most commonly reported sources were catheter or line (14.7% MRSA, 15.6% MSSA) followed by pneumonia (10.0% MRSA, 12.3% MSSA).
For both MRSA and MSSA bacteraemia, cases are more prevalent in the most deprived areas of England. Trends by ethnicity differ for MRSA and MSSA. For MRSA, age-sex-standardised rates are highest in the Black and Asian ethnic groups. For MSSA, they are highest in the White and Black ethnic groups.
For MRSA and MSSA bacteraemia, excluding those aged less than 1 year, rates increase with age, with the highest rates seen in those aged 85 years and over. Rates in those aged under 1 year are still lower than the oldest age groups. For MRSA and MSSA bacteraemia, rates remain higher in males than females.
For MRSA, the CFR has declined significantly since the start of surveillance in FY 2007 to 2008, and was 21.1% in FY 2025 to 2026. The mortality rate showed an initial rapid decline over the first 7 years of surveillance but has since plateaued, and was 0.4 deaths per 100,000 population in FY 2025 to 2026. With the exception of cases under 1 year of age, mortality rate and CFR generally increased with age, reaching 8.3 deaths per 100,000 and 46.1% in the 85 years and over age group, respectively.
For MSSA, the CFR was 20.3% in FY 2025 to 2026, and has remained relatively stable excluding a rapid rise and subsequent fall during the COVID-19 pandemic. The mortality rate has shown a generally increasing trend and is now 4.8 deaths per 100,000 population, which is higher than the start of surveillance but slightly reduced compared with the previous year.
In FY 2025 to 2026, there appear to be no similarities between the geographical distribution of MRSA and MSSA. MSSA appears to be most prevalent in the northern regions of England, while rates of MRSA bacteraemia are highest in parts of London and the South West.
Laboratory blood cultures
On a quarterly basis, NHS acute trusts are mandated to report the total number of blood culture sets examined. Below is a summary of these aggregated blood culture set results by year for Gram-negative, MRSA, and MSSA bacteraemia.
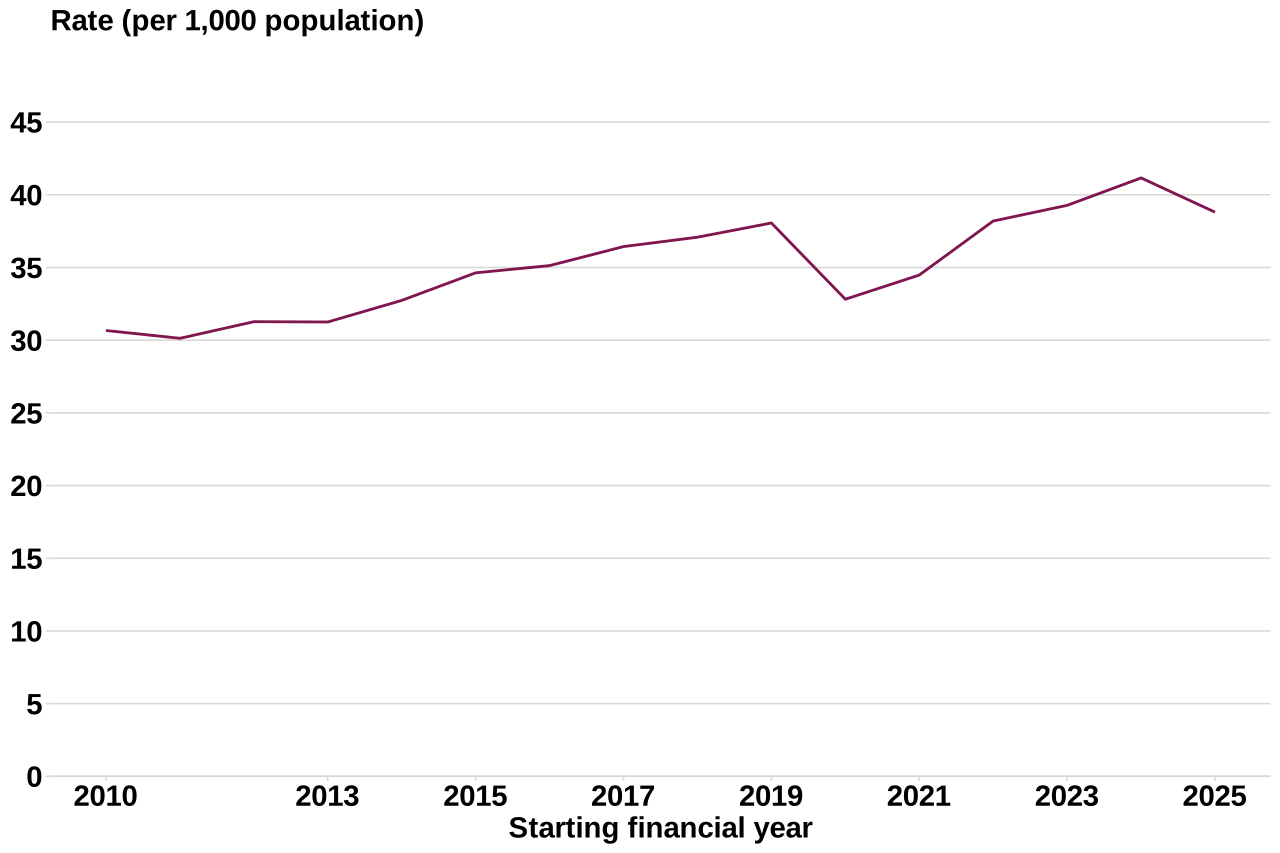
The rate of blood culture sets examined has increased between FY 2010 to 2011 and FY 2025 to 2026, rising from 30.7 to 38.8 per 1,000 population. For FY 2025 to 2026, there was a slight decrease compared with the previous year (41.2 per 1,000 population), but it remains slightly higher than pre-pandemic levels. The decline in the rate of blood culture sets examined for this year is currently under investigation, as the reduction in the number of trusts reporting during this period may have contributed to the decrease (Figure 46 and Table S15 in the accompanying data).
Figure 46. Trends in the rate of blood culture sets examined, England, by FY April 2010 to March 2026
Note 4: trends in blood culture sets examined may be influenced by variation in reporting completeness or delayed reporting. For the latest quarter of January to March 2026, 78% (105/134) NHS acute trusts had reported data at the time of extraction. For the three-quarters before, reporting ranged from 90% to 94% of NHS acute trusts.
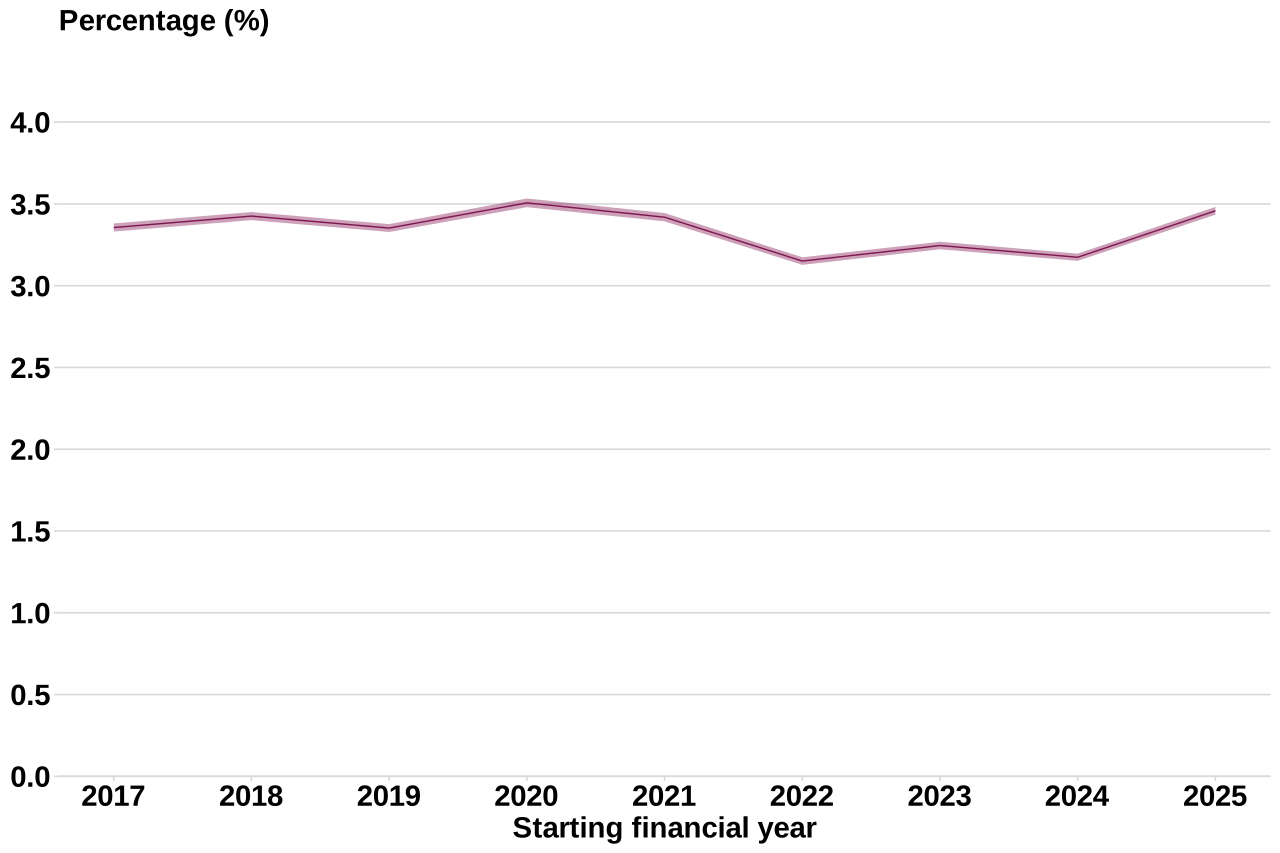
The proportion of blood cultures positive for organisms under mandatory reporting (E. coli, Klebsiella spp., P. aeruginosa, MRSA and MSSA) out of the total blood cultures tested has remained relatively stable with minor fluctuation since the start of surveillance. While the rate of blood culture sets examined has increased concurrently with the overall increase in bacteraemia incidence rates, this does not appear to have impacted positivity, which has remained relatively stable (between 3.3 to 3.5% during the surveillance period). However, there may be variation by data collection or at trust-level (Figure 47 and Table S15 in the accompanying data).
Figure 47. Trends in pooled E. coli, Klebsiella spp., P. aeruginosa, MRSA and MSSA blood culture positivity, England, by FY April 2017 to March 2026
Note 1: shaded bands indicate 95% CIs.
Note 4: trends in blood culture positivity may be influenced by variation in reporting completeness or delayed reporting. For the latest quarter of January to March 2026, 78% (105/134) NHS acute trusts had reported data at the time of extraction. For the three-quarters before, reporting ranged from 90% to 94% of NHS acute trusts.
New and future work
Please note, all investigations named below are being conducted by, or in affiliation with, UKHSA colleagues. There is also a wide variety of research being conducted by other academic institutes and bodies, and within the devolved nations.
E. coli, Klebsiella spp., P. aeruginosa
In FY 2019 to 2020, there were significant reductions in E. coli bacteraemia, particularly from the community setting. Investigations by the University of Oxford HPRU and UKHSA into the underlying causes of this trend are being undertaken. Bacteraemia due to Klebsiella spp., in contrast to E. coli, did not see much of a decline at the start of the COVID-19 pandemic and since then has increased both in terms of prevalence and AMR burden in the years following the pandemic. The reasons for the differing overarching trends in these infections are also being investigated.
There are various urinary tract infection (UTI) projects planned or underway as part of a larger UTI working group.
UKHSA are collaborating with the University of Bristol and NHS England on a 5-year NIHR funded programme called ‘Improving Primary Care Antibiotic Prescribing to Reduce Antibiotic Resistant Urinary Tract Infections (IPAP-UTI)’. The study aims to perform Randomised Controlled Trials (RCTs) to see if primary care prescribing can influence AMR trends.
S. aureus
Incidence rates of MRSA and MSSA have substantially increased since FY 2020 to 2021. Increased HO rates of MRSA and MSSA during FY 2020 to 2021 may be partially explained by a reduction in the size of the denominator (the number of hospital-bed days) when there was reduced hospital activity, leading to an apparent increase in the incidence rate. However, there have also been increasing case counts of MRSA and MSSA since FY 2021 to 2022, driven predominantly by CO cases. Current research focuses on investigating the rise in MSSA bacteraemia, analysing temporal trends and determining any epidemiological and clinical factors contributing to this increase.
Amin-Chowdhury Z, Mazzella A, Brown CS, Jeyaratnam D, Hope RJ, Chudasama DY. Meticillin-resistant Staphylococcus aureus bacteraemia rise in England – start of a troubling trend? Journal of Hospital Infection. 2026 Apr 2;172:272-274. doi: 10.1016/j.jhin.2026.03.028
Centrally implemented national bloodstream infection surveillance
Research conducted in collaboration with the Health Protection Research Network (HPRU) and our academic partners at Oxford University compared bacteraemia cases submitted through the mandatory surveillance of bacteraemia with those generated through linkage of routinely collected laboratory and hospital data including second-generation surveillance system (SGSS) and Hospital Episodes Statistics (HES). The centrally implemented system demonstrated high case identification and completeness of surveillance data fields, supporting its potential as an efficient alternative to local surveillance systems and reducing the burden of manual data collection and entry. Further work has been underway to pilot this approach with selected trusts, with results currently pending.
Cregan J, Nsonwu O, Chudasama D, Hopkins S, Muller-Pebody B, Hope R, Brown C, Eyre DW, Quan TP, Walker AS. The potential of a centrally implemented system for national surveillance of bloodstream infections in England, compared to current local surveillance, 2023-2024. J Hosp Infect. 2026;169:5-14. doi:10.1016/j.jhin.2025.11.041. Epub 2025 Dec 2. PMID: 41344650.
Health inequalities and geography
Following the introduction 2 years ago to include HCAI surveillance data by ethnicity and deprivation in this report, further exploration was carried out into the 5 bacteraemias with case-fatality estimates by deprivation and mortality in this publication:
Mazzella A, Amin-Chowdhury Z, Andrews A, Charlett A, Brown CS, Hope R and Chudasama D. Health inequalities in incidence of bacteraemias: A national surveillance and data linkage study, England, 2018 to 2022. (2025) Eurosurveillance.
Current research at national and local levels aims to clarify how socioeconomic factors, geography, ethnicity, and antimicrobial resistance influence the prevalence of Gram-negative and Staphylococcus aureus bacteraemia. The wide geographic variation, with some similarities and some disparate trends, warrants considerable further investigation.
There is a planned project to further investigate risk factors and other potential drivers of this disparity by ethnicity and socioeconomic factors.