Fire prevention and protection statistics, England, April 2025 to March 2026
Published 2 September 2026
Applies to England

© Crown copyright 2026
This publication is licensed under the terms of the Open Government Licence v3.0 except where otherwise stated. To view this licence, visit nationalarchives.gov.uk/doc/open-government-licence/version/3 or write to the Information Policy Team, The National Archives, Kew, London TW9 4DU, or email: psi@nationalarchives.gov.uk.
Where we have identified any third party copyright information you will need to obtain permission from the copyright holders concerned.
This publication is available at https://www.gov.uk/government/statistics/fire-prevention-and-protection-england-year-ending-march-2026/fire-prevention-and-protection-statistics-england-april-2025-to-march-2026
Frequency of release: Annual
Forthcoming releases: Ministry of Housing, Communities and Local Government statistics release calendar
MHCLG responsible statistician: Daniel Farrugia
Press enquiries: newsdesk@communities.gov.uk
Public enquiries: firestatistics@communities.gov.uk
This release presents statistics from administrative sources on the prevention and protection activities undertaken by Fire and Rescue Authorities (FRAs), and their partners, in England for the year ending March 2026. It also includes analysis of smoke alarm ownership data from the English Housing Survey (EHS) for the year ending March 2025. This release compares the year ending March 2026 with the years ending March 2025 and 2020.
The statistics in this release inform the government, fire and rescue authorities, and local authorities to plan and prioritise fire prevention and protection activity. The data are used to inform national fire safety policy, allocate resources effectively, and support decisions on funding. They also help authorities target prevention work at the most vulnerable households, monitor compliance with fire safety legislation, and evaluate the effectiveness of regulatory interventions.
Fire prevention refers to the statutory duty of FRAs under Section 6 of the Fire and Rescue Services Act 2004. Typical prevention activities include providing fire safety advice to households through Home Fire Safety Visits (HFSVs; previously called Home Fire Safety Checks), arson prevention, and educational work with vulnerable groups.
The fire statistics team stopped collecting data on campaigns and initiatives in 2018, to reduce the burden on FRAs. Historical data are available in FIRE1204.
Fire protection relates to FRAs’ statutory duty to promote and enforce fire safety in the built environment, primarily under the Regulatory Reform (Fire Safety) Order 2005 (FSO, also referred to as the RRO). This legislation applies to all non-domestic premises and common parts of multi-occupied residential buildings. It requires responsible persons to:
- carry out fire risk assessments to identify any general fire safety precautions
- implement and maintain fire safety precautions to protect the safety of people in or within the vicinity of the premises
MHCLG also collects information on enforcement activity related to petroleum, explosives and dangerous substances (see FIRE1205) under other legislation listed in the further information section.
This release does not include statistics related to the new fire safety requirements, which came into effect on 1 October 2023, Section 156 of the Building Safety Act 2022.
This release compares the year ending March 2026 with the previous year (year ending March 2025) and the last pre-pandemic year (year ending March 2020). Comparisons have been made with six years ago rather than five years ago because activity in the year ending March 2021 was substantially affected by restrictions introduced in response to the COVID-19 pandemic and is therefore not considered representative of typical levels of prevention and protection activity.
Key results
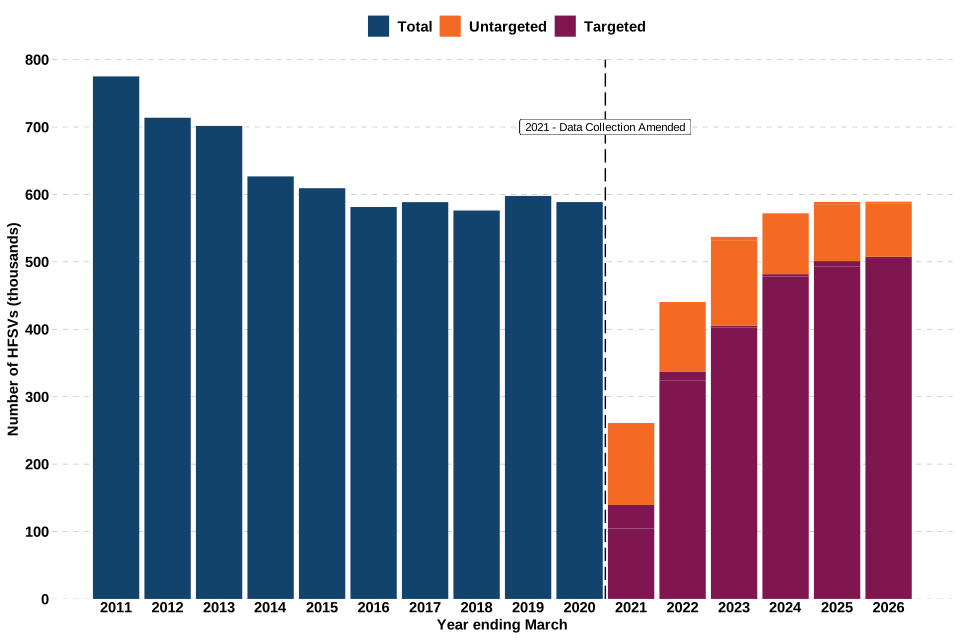
In the year ending March 2026, FRAs and their partners completed 589,278 HFSVs. This was virtually unchanged compared with the previous year (588,855), and virtually unchanged compared with 6 years ago (588,666).
Of these, 86% (507,527) were targeted at vulnerable households, the highest proportion recorded since targeting data began in year ending March 2021.
Figure KR.1: HFSVs completed by FRAs and their partners, England; year ending March 2011 to year ending March 2026
FRAs completed 50,195 fire safety audits in the year ending March 2026, of which 29,909 (60%) had a satisfactory outcome recorded, similar to the previous year (59%). The lowest proportion of satisfactory audits in the series was 58% in the year ending March 2024.
Breaches of Article 14 (Emergency routes and exits) were the most frequently cited reason for non-compliance, and breaches were 9.3% higher than in the previous year.
Formal notifications increased to 3,355, an increase of 11% from the previous year (3,026) and an increase of 46% compared with 6 years ago (2,295).
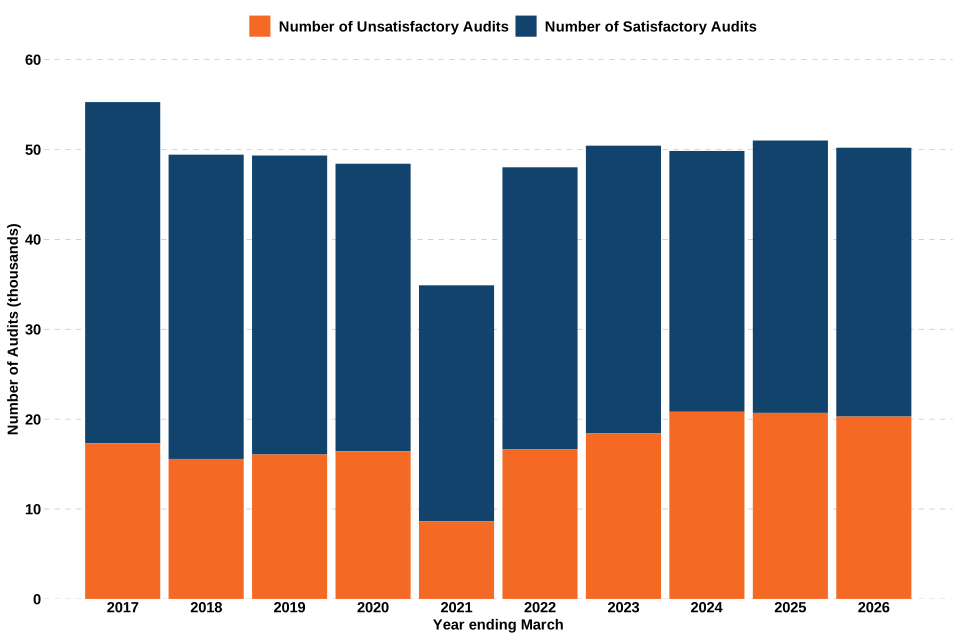
Figure KR.2: Number of fire safety audits conducted by FRAs in England, year ending March 2017 to year ending March 2026
1. Fire prevention
This section focuses on Home Fire Safety Visits (HFSVs) and smoke alarm ownership. HFSVs are known by a variety of names, including Home Fire Safety Checks, Home Fire Risk Checks and Safe and Well Visits; however, in this release they are referred to as HFSVs.
HFSVs provide tailored domestic fire safety advice based on household characteristics, vulnerabilities, and lifestyle. These visits are often prioritised for more vulnerable members of the community, including older and disabled individuals. Interventions may include installing smoke alarms and recommending changes to reduce fire risk, such as repositioning furniture.
FRA partners include organisations and sectors such as:
- Home Improvement Services
- Education
- Social services
- Voluntary sector
- Housing
- Primary care trusts
1.1 Key results
In the year ending March 2026:
- FRAs and their partners completed 589,278 HFSVs, which was virtually unchanged on year ending March 2025 (588,855), and virtually unchanged compared with the year ending March 2020 (588,666); Source: FIRE1201
- FRAs and their partners completed 507,527 HFSVs targeted at households containing at least 1 vulnerability or risk factor, which accounted for 86% of HFSVs, the highest proportion since the data collection was introduced Source: FIRE1201
1.2 Home fire safety visits (HFSVs)
Data are collected on both the total number of HFSVs, and the number targeted at households with at least one person with a vulnerability or risk factor. Targeting data are collected in the following sub-categories:
- at least 1 person aged 65 years and over, but no-one disabled
- at least 1 person aged 65 years and over and 1 person disabled (can be same person)
- all aged under 65 but at least 1 person disabled
The number of HFSVs completed by FRAs and their partners in England was on a general decline between the year ending March 2011, when data collection began, and the year ending March 2020. There was a large reduction in the year ending March 2021, due to lockdowns and social restrictions in response to COVID-19. Subsequently, numbers increased, with HFSV numbers in the year ending March 2026 rising to 589,278 (see Figure KR.1). See Further information for more details on the impact of COVID-19.
Since the pandemic, the proportion of HFSVs completed face-to-face has increased. In the year ending March 2026, 99% of all HFSVs were carried out face-to-face.
1.3 Targeting of HFSVs
A total of 507,527 HFSVs (86%) were targeted at households that had at least 1 person with at least 1 vulnerability or risk factor in the year ending March 2026, compared to 501,123 HFSVs (85%) in the previous year. This metric for HFSV targeting has been included in the data collection since the year ending March 2021.
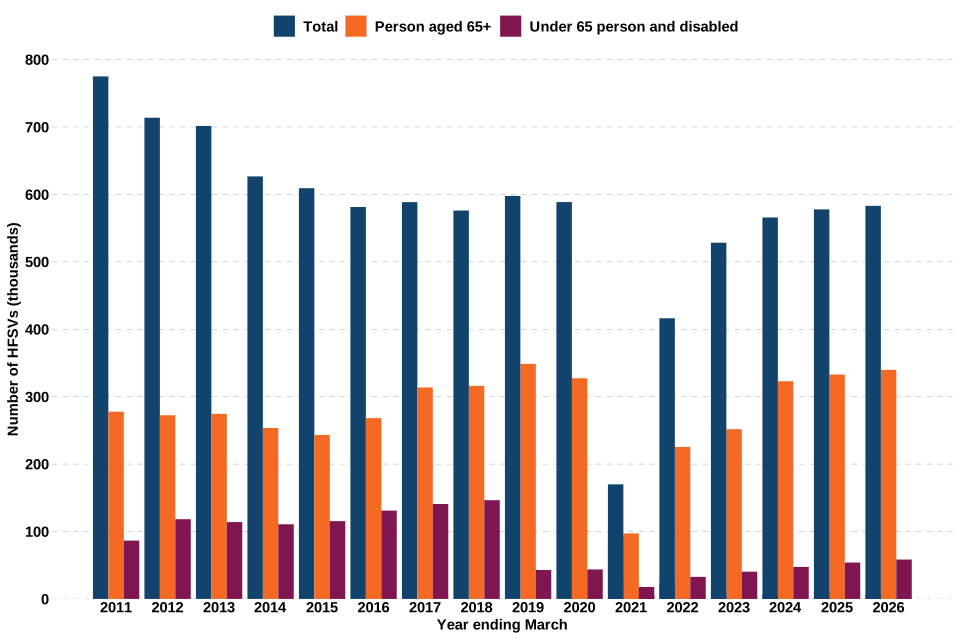
For the targeting of HFSVs in the year ending March 2026 (see Figure 1.1):
- 156,624 were targeted at households with at least 1 person aged 65 years and over but no one in household disabled, accounting for 27% of total HFSVs
- 185,270 were targeted at households with at least 1 person aged 65 years and over, and 1 disabled person, accounting for 31% of total HFSVs
- 58,840 were targeted at households with at least 1 disabled person, with all residents aged under 65, accounting for 10% of total HFSVs
- 106,793 were targeted at other vulnerabilities for which the detail on the categorisation was not collected, accounting for 18% of total HFSVs
In the year ending March 2026, the proportion of HFSVs targeted at people aged 65 years and over and/or disabled was 68% (400,734 HFSVs) compared to 63% 6 years ago (370,987).
The number and proportion of HFSVs not targeted at a person with at least 1 vulnerability or risk factor has decreased. In the latest year, 81,751 were not targeted at people deemed ‘vulnerable’ or ‘at risk’, accounting for 14% of total HFSVs. This compares to 87,732 (15%) not targeted at those with at least 1 vulnerability in the previous year.
Figure 1.1: Total numbers of HFSVs and targeted HFSVs completed by FRAs in England, year ending March 2011 to year ending March 2026
Notes:
- The person aged 65 years and over and disabled person categories in the chart above are not mutually exclusive. This means that a person aged 65 years and over and a disabled person would be counted in both targeting categories in this chart.
1.4 Staff carrying out HFSVs
In the year ending March 2026:
- there was an average of 1.9 staff members carrying out each HFSV, compared to 1.8 in the previous year and 2.3 in the year ending March 2020
- 81% of staff conducting HFSVs were firefighters, compared to 82% in the previous year and 86% in the year ending March 2020
Detailed breakdowns by staff role are available in table FIRE1201 in sheet FIRE1201b.
1.5 Smoke alarm ownership
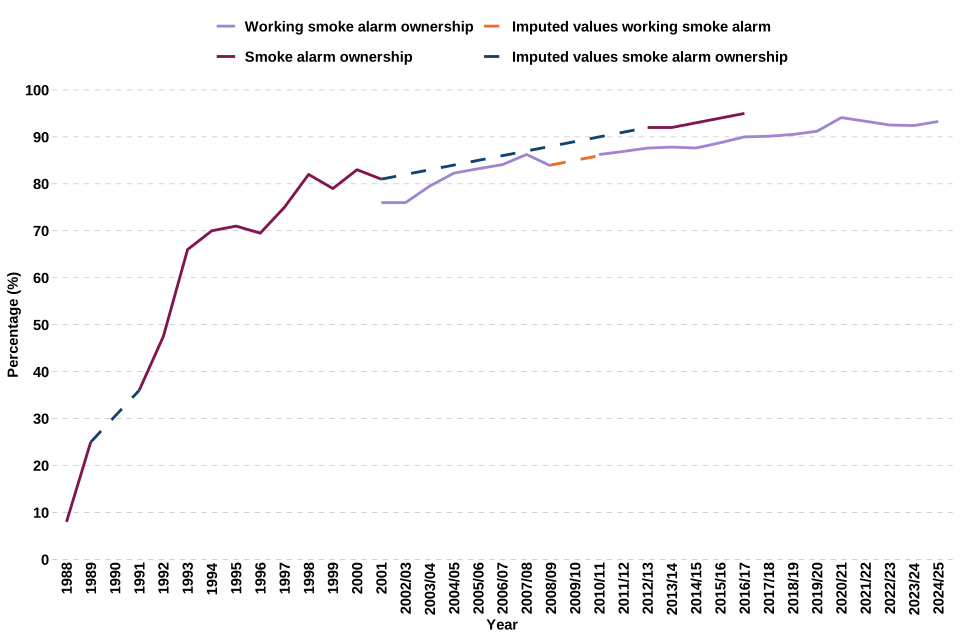
Figure 1.2 shows that 93% of households self-reported owning a working smoke alarm in the year ending March 2025 (this is the latest available data). However only 18% of households self-reported that they had tested their smoke alarm at least once a month (see FIRE0701). More information on the EHS, and the change in method during COVID-19, is available in the further information section.
Figure 1.2: Percentage of households owning a smoke alarm or working smoke alarm, England, 1988 to year ending March 2025
Source: EHS
Notes:
Dashed lines show values estimated by MHCLG for years where no published survey estimate was available. The data have been collected through different surveys and methods over time, so long-term comparisons should be treated with caution.
2. Fire protection - Fire safety audits
This section of the release specifically focuses on fire safety audits under the Regulatory Reform (Fire Safety) Order 2005 (FSO) and the specific non-compliance articles of the FSO cited in enforcement activity following unsatisfactory audits. Definitions for the main fire protection activities are provided below, with more information provided in the further information section.
Fire safety audit is a planned visit by an FRA to carry out a comprehensive assessment of the level of compliance with the requirements of the FSO in a particular premises. There is a requirement for fire risk assessments to be regularly conducted and reviewed.
Short audits are an initial evaluation of the fire safety of a building. They were designed by the sector to support better regulation, by enabling FRAs to focus enforcement resources more effectively on higher risk premises.
Satisfactory audits: the result of an audit is recorded as satisfactory, if the premises broadly complies with the FSO and no further action is necessary.
Unsatisfactory audits: the result of an audit is recorded as unsatisfactory, if further action is necessary to bring the premises up to compliance.
2.1 Key results
In the year ending March 2026:
- FRAs carried out 50,195 fire safety audits, a decrease of 1.6% compared to the year ending March 2025 (50,996); Source: FIRE1202
- 60% of audits had a satisfactory outcome, similar to the previous year (59%); Source: FIRE1202
- the most common type of premises to be audited was shops with 8,932 audits (18% of all fire safety audits); Source: FIRE1202
- the average time spent on audits was 5.6 hours; Source: FIRE1202
2.2 Number of fire safety audits
Since the year ending March 2018, the number of fire safety audits completed has remained stable, apart from the year ending March 2021 when there was a large decline likely due to the restrictions in response to the COVID-19 pandemic. The number of audits in the year ending March 2026 (50,195) was a decrease of 1.6% compared to the year ending March 2025 (50,996), and an increase of 3.7% on the year ending March 2020 (48,414).
In the year ending March 2026:
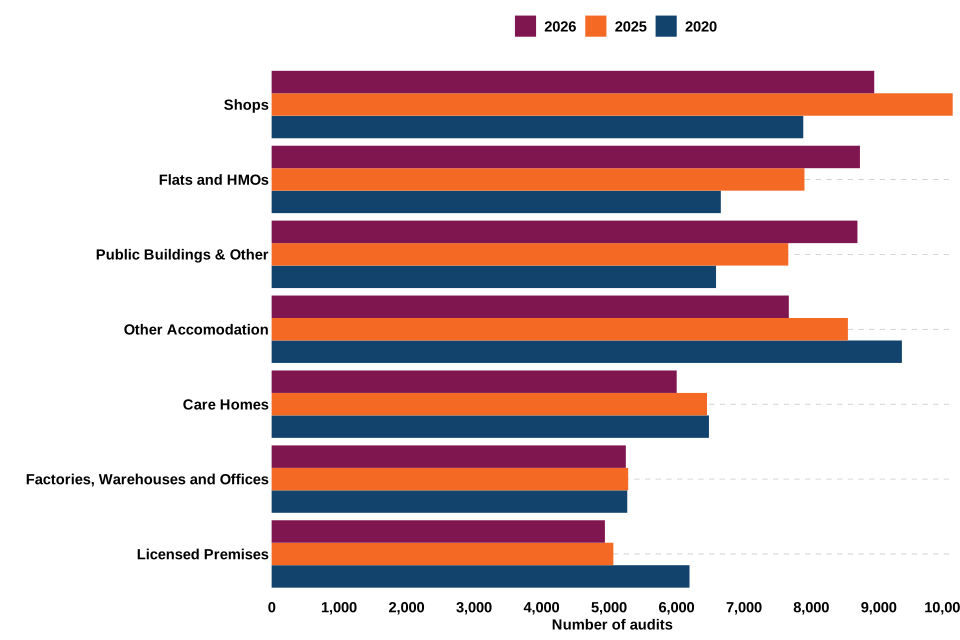
- the premises type with the highest number of fire safety audits was shops, with 8,932 audits conducted, accounting for 18% of all fire safety audits, a decrease of 12% from the previous year and an increase of 13% compared with the year ending March 2020
- the premises type with the second highest number of fire safety audits was care homes, with 6,004 audits conducted, a decrease of 7.0% from the previous year and a decrease of 7.4% compared with the year ending March 2020
- the premises type with the third highest number of fire safety audits was licensed premises, with 4,940 audits conducted, a decrease of 2.5% from the previous year and a decrease of 20% compared with the year ending March 2020
These 3 premises types together accounted for 40% of all fire safety audits in the year ending March 2026.
Compared with the previous year, audits and satisfactory rates for purpose-built flats varied by storey height, as shown below.
Table 2.1: Audits carried out and satisfactory rate at purpose-built flats comparing the year ending March 2026 with year ending March 2025
| Premises type | Audits, year ending March 2026 | Audits, year ending March 2025 | 1-year change in audits | Satisfactory rate, year ending March 2026 | Satisfactory rate, year ending March 2025 | 1-year change in satisfactory rate (percentage points) |
|---|---|---|---|---|---|---|
| purpose-built flats 1 to 3 storeys | 1,943 | 1,944 | -0.1% | 54% | 59% | -4.9pp |
| purpose-built flats 4 storeys and over (no breakdown available) | 607 | 553 | 9.8% | 68% | 50% | 17.4pp |
| purpose-built flats 4 to 5 storeys | 1,821 | 1,626 | 12% | 50% | 54% | -3.9pp |
| purpose-built flats 6 to 9 storeys | 1,303 | 1,329 | -2.0% | 49% | 51% | -1.8pp |
| purpose-built flats 10 storeys and over | 965 | 756 | 28% | 53% | 66% | -12.9pp |
Across all purpose-built flats of 4 storeys and over, including those where a more detailed height breakdown was not available, the number of audits increased by 10%, to 4,696 compared to the previous year (4,264), and increased by 35% compared to 6 years ago (3,473). The average time spent on audits was highest for this group of premises, at 7.2 hours in the year ending March 2026.
Figure 2.1: Total number of fire safety audits by FRAs, grouped by building types in England, for years ending March 2020, 2025, and 2026 (ordered by year ending March 2026 figures)
Notes:
Premises types in the chart above are categorised as follows:
- Flats and Houses in Multiple Occupation (HMOs): purpose-built flats (all height categories), houses converted to flats and HMOs.
- Other accommodation: hotels, hostels and other sleeping accommodation.
- Factories, warehouses and offices.
- Public building & other: public buildings, hospitals, schools, further education, other premises open to the public and other unspecified premises.
2.3 Time spent on audits
Table 5.2 in the Summary of changes over time section shows the number of audits, total and average hours spent, for all audits and by outcome (satisfactory or unsatisfactory).
For the year ending March 2026, the average time spent on all audits increased to 5.6 hours, compared to years ending March 2025 (5.2 hours) and 2020 (4.4 hours). The increase in average time spent on audits likely reflects the increase in the number and time spent on unsatisfactory audits (see 2.4 Outcome of fire safety audits). The average time spent on unsatisfactory audits was greater than satisfactory audits by 1.7 hours in the year ending March 2026.
Of all premises types, Purpose-built flats 10 storeys and over had the longest average time spent on audits, with an average of 9.4 hours, 3.8 hours above the overall average.
2.4 Outcome of fire safety audits
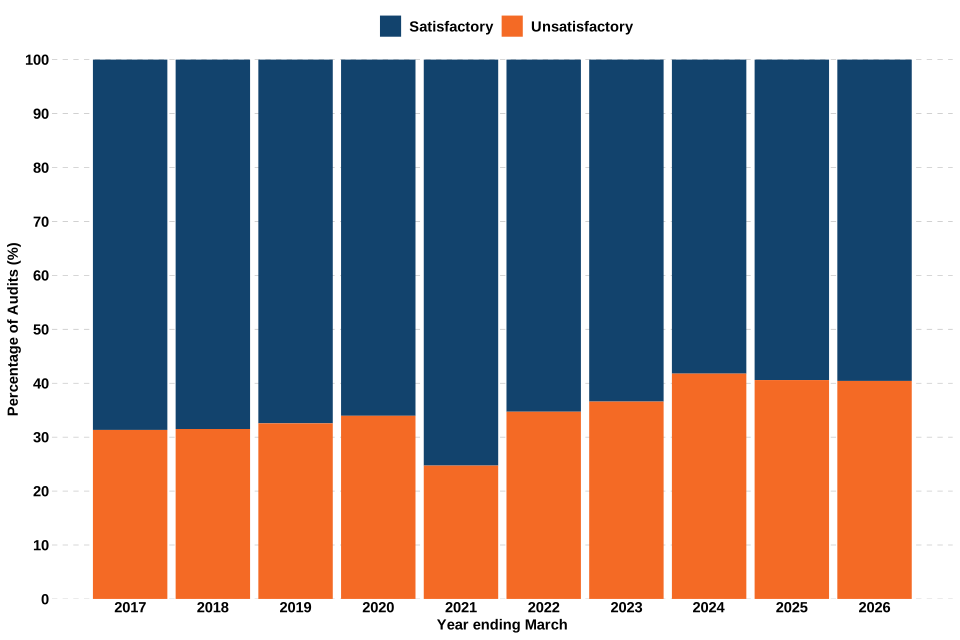
FRAs carried out 50,195 fire safety audits in the year ending March 2026, of which 29,909 (60%) had a satisfactory outcome recorded, similar to the previous year (59%). The lowest proportion of satisfactory audits in the series was 58% in the year ending March 2024.
Figure 2.2: Proportion of fire safety audits deemed satisfactory or unsatisfactory conducted by FRAs in England, year ending March 2017 to year ending March 2026
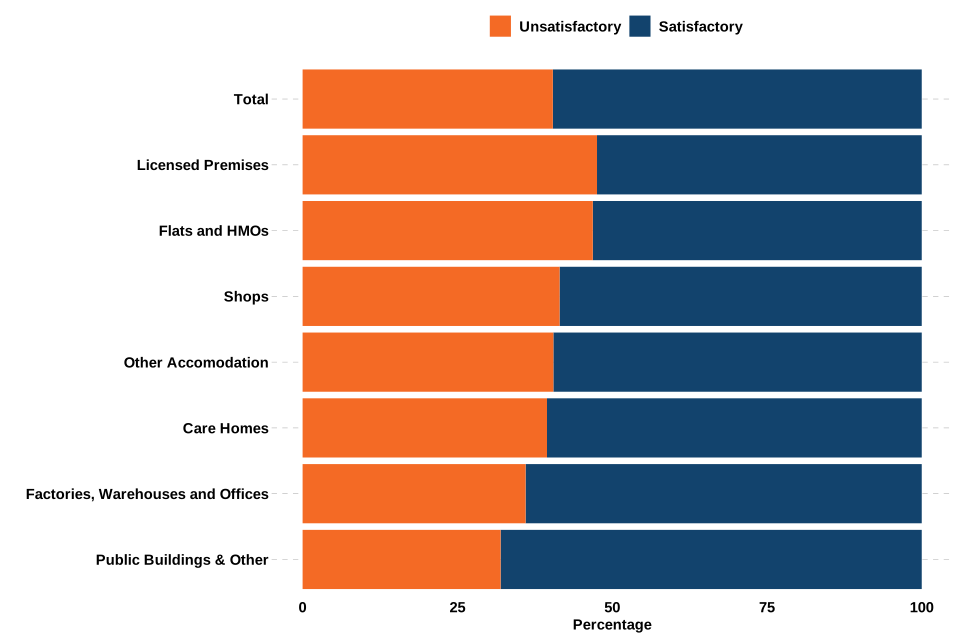
The premises type with the greatest proportion of satisfactory audits was schools, at 72% of the 2234 total audits in this premises type. Meanwhile, the premises type with the greatest proportion of unsatisfactory audits was purpose-built flats 6 to 9 storeys at 51% of the 1303 total audits in this premises type.
Of the 3 premises types with the highest number of audits, care homes (6,004) had the highest satisfactory rate at 61%, followed by shops (8,932) with a 58% satisfactory rate and licensed premises (4,940) with a 52% satisfactory rate.
Figure 2.3: Proportion of fire safety audits deemed satisfactory or unsatisfactory, by grouped building types, England, year ending March 2026 (ordered by percentage satisfactory)
2.5 Article-level non-compliance
Where premises do not meet the requirements, FRAs identify one or more specific articles of the FSO with which the premises is non-compliant.
In the year ending March 2026, 11,286 breaches of Article 14 (Emergency routes and exits) were recorded during fire safety audits. While this represents a 9.3% increase compared with the previous year (10,322), Article 14 (Emergency routes and exits) remained the most frequently breached provision under the FSO, accounting for 13% of all breaches.
Other commonly breached provisions included:
-
Article 17 (Maintenance): 9,727 breaches (up 12% from 8,668 in the previous year)
-
Article 9 (Risk assessment): 9,271 breaches (up 9.3% from 8,482 in the previous year)
-
Article 8 (Duty to take general fire precautions): 8,792 breaches (up 16% from 7,611 in the previous year)
-
Article 15 (Procedures for serious and imminent danger): 7,955 breaches (down 0.7% from 8,011 in the previous year)
The number of breaches increased for most of the ten most frequently cited articles compared with the previous year. Article 15 was the only article in the top ten to record a decrease.
Table 2.2: Top 10 most frequently breached articles comparing the year ending March 2026 with 1 and 6 years previously
| Article | Year ending March 2026 | Year ending March 2025 | 1-year change | Year ending March 2020 | 6-year change |
|---|---|---|---|---|---|
| Article 14: Emergency routes and exits | 11,286 | 10,322 | 9.3% | 8,111 | 39% |
| Article 17: Maintenance | 9,727 | 8,668 | 12% | 6,398 | 52% |
| Article 9: Risk Assessment | 9,271 | 8,482 | 9.3% | 6,723 | 38% |
| Article 8: Duty to take general fire precautions | 8,792 | 7,611 | 16% | 6,149 | 43% |
| Article 15: Procedures for serious and imminent danger and for danger areas | 7,955 | 8,011 | -0.7% | 5,003 | 59% |
| Article 13: Fire fighting and fire detection | 7,262 | 6,510 | 12% | 5,595 | 30% |
| Article 11: Fire safety arrangements | 5,240 | 4,195 | 25% | 3,134 | 67% |
| Article 21: Training | 4,445 | 4,277 | 3.9% | 3,287 | 35% |
| Article 19: Provision of information to employees | 3,954 | 3,514 | 13% | 2,095 | 89% |
| Article 10: Principles of prevention to be applied | 3,348 | 2,579 | 30% | 1,593 | 110% |
3. Fire protection - Formal, informal notifications and prosecutions
When an audit has an unsatisfactory outcome, an FRA may issue an informal notification or take formal enforcement action, depending on the nature and seriousness of the non-compliance. Formal notifications are issued in the most serious of cases where less formal action has failed to resolve issues of non-compliance. Definitions of the different formal and informal notification categories within the FSO are provided below. The data on notifications and non-compliance are published in FIRE1202 and FIRE1204.
Informal notification - these can be issued instead of a formal notice when an outcome is unsatisfactory and the risk to relevant persons is not significant, and the responsible person is willing to comply.
Enforcement notices (Article 30) - these are served if the enforcing authority is of the opinion that the responsible person has failed to comply with any provision of the FSO or of any regulations made under it.
Prohibition notices (Article 31) - these are served if the enforcing authority is of the opinion that use of premises involves or will involve a risk to relevant persons so serious that use of the premises ought to be prohibited or restricted.
Alteration notices (Article 29) - these are served if the enforcing authority is of the opinion that the premises constitutes a serious risk to relevant persons (whether due to the features of the premises, their use, any hazard present, or any other circumstances); or may constitute such a risk if a change is made to them or the use to which they are put.
Prosecutions (Article 32) - are legal proceedings brought in relation to offences under the Fire Safety Order, including failure to comply with an alteration, enforcement or prohibition notice.
3.1 Key results
In the year ending March 2026:
-
3,355 formal notices were issued, an increase of 11% from the previous year (3,026), and an increase of 46% compared with 6 years ago (2,295); Source: FIRE1202
-
18,039 informal notices were issued, a decrease of 6.2% from the previous year (19,232), and an increase of 31% compared with 6 years ago (13,727); Source: FIRE1202
Table 5.3, in the summary of changes over time section, displays the number and change in the number of informal and formal notifications across the latest year, the previous year and 6 years ago.
3.2 Informal notifications
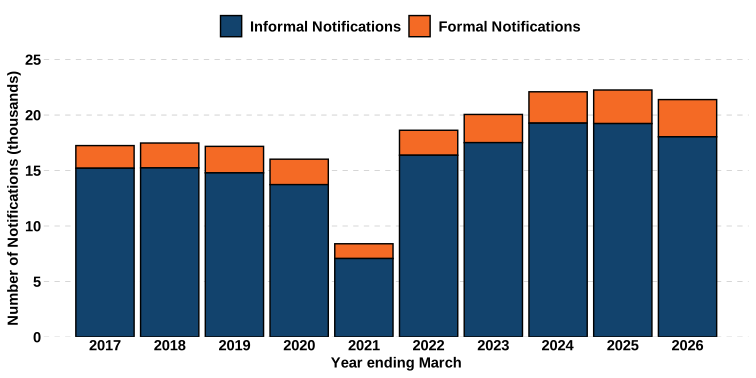
There were 18,039 informal notices issued in the year ending March 2026, a decrease of 6.2% on the previous year and an increase of 31% on the year ending March 2020. Shops received the highest number of informal notices, with (3,233), accounting for 18% of total informal notices.
Figure 3.1: Fire safety notices (informal and formal) resulting from unsatisfactory fire safety audits issued in England, year ending March 2017 to year ending March 2026
3.3 Formal notifications
In the year ending March 2026, 3,355 formal notifications were issued, equivalent to 6.7% of the number of fire safety audits carried out. This was an increase of 11% on the year ending March 2025. These can be broken down further into formal notification categories within the FSO as shown in figure 3.2.
Figure 3.2: Formal notifications, by type, issued in England, year ending March 2017 to year ending March 2026
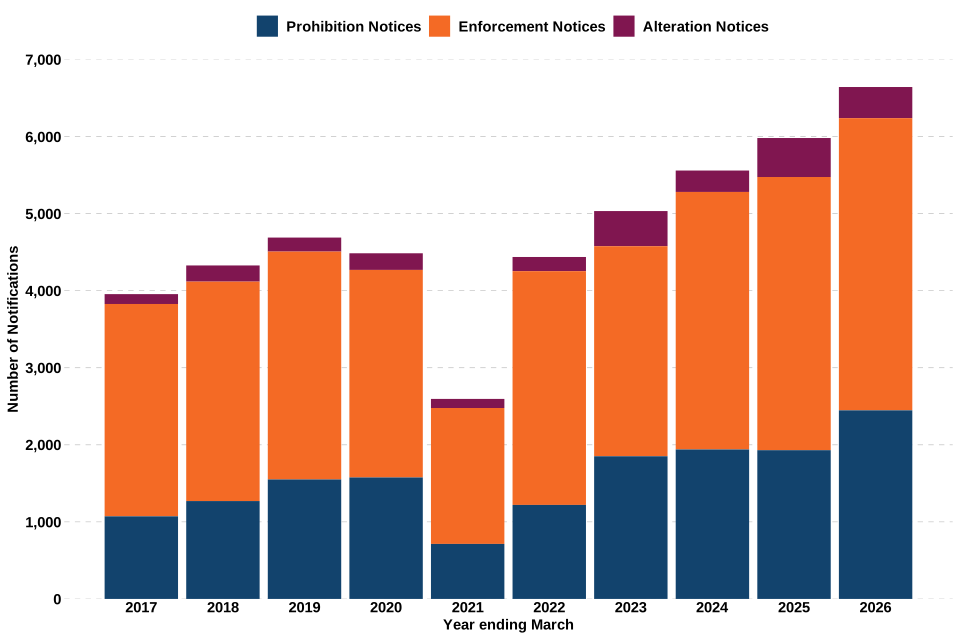
The most common type of formal notice was an enforcement notice under Article 30, with 1,896 issued, accounting for 57% of all formal notifications. Enforcement notices were issued most commonly to Shops (347), accounting for 18% of all enforcement notices issued, followed by Purpose-built flats 6 to 9 storeys (211, accounting for 11%) and Licensed premises (195, accounting for 10%).
4. Fire protection - Other fire safety activity
In addition to fire safety audits, FRAs complete other activities to promote fire safety such as responding to building regulations consultations on new builds and changes to existing building stock. This section summarises this activity with the supporting data available in FIRE1202, in particular FIRE1202c.
Non-statutory fire safety activity - all fire safety activity generated by requests from others, i.e. approaches from other agencies or bodies (such as Ofsted), the public, and business representatives, as well as any FSO related promotional or awareness raising activities generated within the FRA.
Building regulations consultations - consultations completed or supported under Building Regulations to support understanding, awareness and compliance with FSO. The local building control authorities, approved inspectors and the Building Safety Regulator (BSR) are required to consult with the relevant FSO authority under the Building Regulations.
Other consultations - statutory consultations with FRAs in accordance with the requirements of article 46 of the FSO.
4.1 Key results
In the year ending March 2026, FRAs carried out:
- 52,363 building regulations consultations, an increase of 9.9% on the previous year (47,664), and an increase of 3.1% compared with 6 years ago (50,812)
- 27,140 other consultations, an increase of 2.0% on the previous year (26,612), and an increase of 26% on the year ending March 2020 (21,554)
- 159,265 non-statutory fire safety activities, which was an increase of 33% on the previous year (119,529) and an increase of 91% on the year ending March 2020 (83,348).
4.2 Consultations
A total of 52,363 building regulations consultations were completed in the year ending March 2026, an increase of 9.9% on the previous year, and an increase of 3.1% on the year ending March 2020. In the latest year, the average time spent on each building regulations consultation was 1.7 hours. Shops accounted for the highest number of building regulations consultations with (9,086, equivalent to 17%) of the total in the latest year.
There were 27,140 other consultations, an increase of 2.0% on the previous year and 26% higher than year ending March 2020. The average time spent on these consultations was 1.1 hours, lower than the previous year, when the average was 1.2 hours. Shops were the location for 22% of these consultations (5,850).
4.3 Non-statutory fire safety activities
Non-statutory fire safety activities cover a broad range of work, including providing fire safety advice, awareness-raising activity, inspections where a full audit is not carried out, and responding to requests or enquiries from businesses, the public and other organisations.
There were 159,265 non-statutory fire safety activities in the year ending March 2026, an increase of 33% on the previous year and an increase of 91% on the year ending March 2020. The average time spent on these activities has decreased over time, with an average time spent of 1 hour in the year ending March 2026, compared to 1.2 hours in the year ending March 2025, and 1.5 hours in the year ending March 2020. The premises type with the largest proportion of non-statutory fire safety activities was shops (37%), with 58,654.
5. Summary of changes over time
Table 5.1: Total number of HFSVs, by targeting of HFSV, England, comparing the year ending March 2026 with 1 and 6 years previously
| Visit Type | Year ending March 26 | Year ending March 25 | 1-year change | Year ending March 20 | 6-year change |
|---|---|---|---|---|---|
| Home fire safety visits | 589,278 | 588,855 | +0.1% | 588,666 | +0.1% |
| at least 1 person with at least 1 vulnerability or risk factor | 507,527 | 501,123 | +1.3% | .. | .. |
| all aged under 65 but at least 1 person disabled | 58,840 | 54,212 | +8.5% | 43,673 | +35% |
| at least 1 person aged 65+ and one person disabled (can be same person) | 185,270 | 168,261 | +10% | 129,804 | +43% |
| at least 1 person aged 65+, but no one in household disabled | 156,624 | 166,344 | -5.8% | 197,510 | -21% |
Table 5.2: Total number of audits and average time taken by audit outcome, England, comparing the year ending March 2026, with 1 and 6 years previously
| Audit type | Year ending March 26 | Year ending March 25 | 1-year change | Year ending March 20 | 6-year change |
|---|---|---|---|---|---|
| Total audits (Number) | 50,195 | 50,996 | -1.6% | 48,414 | +3.7% |
| Total audits (Average hours) | 5.6 | 5.2 | 6.9% | 4.4 | +26.9% |
| Satisfactory audits (Number) | 29,909 | 30,301 | -1.3% | 31,978 | -6.5% |
| Satisfactory audits (Average hours) | 4.9 | 4.5 | 7.5% | 3.6 | +36.7% |
| Unsatisfactory audits (Number) | 20,286 | 20,695 | -2.0% | 16,436 | +23.4% |
| Unsatisfactory audits (Average hours) | 6.6 | 6.2 | 6.3% | 6.0 | +10.1% |
Table 5.3: Number of informal, formal notifications and prosecutions, comparing the year ending March 2026 with 1 and 6 years previously
| Notification Type | Year ending March 26 | Year ending March 25 | 1-year change | Year ending March 20 | 6-year change |
|---|---|---|---|---|---|
| Informal notifications | 18,039 | 19,232 | -6.2% | 13,727 | 31% |
| Formal notifications | 3,355 | 3,026 | 11% | 2,295 | 46% |
| Of which enforcement notices | 1,896 | 1,773 | 6.9% | 1,347 | 41% |
| Of which prohibition notices | 1,224 | 965 | 27% | 788 | 55% |
| Of which alteration notices | 202 | 253 | -20% | 108 | 87% |
| Prosecutions | 33 | 35 | -5.7% | 52 | -37% |
Table 5.4: Total number of consultations and non-statutory fire safety activities, by fire safety activity, England, comparing the year ending March 2026 with 1 and 6 years previously
| Activity Type | Year ending March 26 | Year ending March 25 | 1-year change | Year ending March 20 | 6-year change |
|---|---|---|---|---|---|
| Building regulations consultations | 52,363 | 47,664 | 9.9% | 50,812 | 3.1% |
| Other consultations | 27,140 | 26,612 | 2.0% | 21,554 | 26% |
| Non-statutory fire safety activities | 159,265 | 119,529 | 33% | 83,348 | 91% |
6. Further information
Fire and Rescue Incident Statistics and other MHCLG statistical releases are available via the Statistics at MHCLG pages on the GOV.UK website.
Data tables linked to this release and all other fire statistics releases can be found on the MHCLG’s Fire statistics data tables page. The sections above state the most relevant tables for each section.
Guidance for using these statistics and other fire statistics outputs is available on the fire statistics collection page.
The information published in this release is kept under review, taking into account the needs of users and burdens on suppliers and producers, in line with the Code of Practice for Statistics. If you have any comments, suggestions or enquiries, please contact the team via email using firestatistics@communities.gov.uk or via the user feedback form on the fire statistics collection page.
All fire-related Ministerial responsibilities moved from the Home Office to the Ministry of Housing, Communities and Local Government (MHCLG) on 1 April 2025. This change followed a recommendation from the Phase 2 report of the Grenfell Tower Inquiry, to bring all fire safety functions under one department. Therefore, as part of this move, all statistical publications and analysis on fire functions were also subject to the Machinery of Government (MoG) change.
6.1 Fire prevention additional information
Smoke alarm ownership
Data on the proportion of households with a smoke alarm have been collected since the 1980s from a variety of sources, and data on ownership of a working smoke alarm have been collected from 2001. Since the year ending March 2009 the English Housing Survey (EHS) has been the primary source of information on smoke alarm ownership. The exact questions asked have changed over time but have previously included ownership of a smoke alarm, ownership of a working smoke alarm, smoke alarm testing habits and carbon monoxide alarm ownership.
The EHS continued during the COVID-19 pandemic, although the survey methodology changed during the years ending March 2021 and March 2022. The face-to-face interviews were replaced by telephone interviews, with internal inspections replaced by external ones and analysis of administrative data. Testing of the changes to the survey was not possible, so it is not clear in the EHS whether changes observed in year ending March 2021 were ‘real’ changes or a reflection of the change in method. Further, the composition of the EHS sample significantly altered in year ending March 2021 compared with year ending March 2020, for example more outright owners and fewer renters, more households with older people and fewer households with children.
6.2 Fire protection additional information
Fire protection legislation
MHCLG collects information on fire safety enforcement activity under the Regulatory Reform (Fire Safety) Order 2005 and under other legislation, specifically:
- Dangerous Substances and Explosive Atmosphere Regulations 2002 (DSEAR)
- Petroleum (Consolidation) Act 1928
- Manufacture and Storage of Explosives Regulations 2005
- Fireworks Regulations 2004
Fire safety audits
A fire safety audit is a planned visit by an FRA to carry out a comprehensive assessment of the level of compliance with the requirements of the FSO in a particular premises. The FSO requires the ‘responsible person’ for a workplace or premises, to which the public have access to:
- to carry out and regularly review a fire risk assessment
- to ensure that the general fire precautions are adequate and appropriate
- to reduce the risk from fire to employees and other relevant persons to as low as reasonably practicable.
The FSO applies to most non-domestic premises and to the communal areas in residential buildings.
It is a matter for FRAs to determine how many audits they carry out per year, but they must have a locally determined risk-based inspection programme and management strategy in place for enforcing the FSO.
Short audits
Since 2016, FRAs have had the option of using the short audit form, designed by the sector to support the principles of better regulation, and allow FRAs to focus their enforcement resources more effectively on higher risk premises.
A short audit may record an ‘unsatisfactory’ outcome, where non-compliances are found that require attention but are not judged to reach the formal enforcement threshold. These may be dealt with by means of an informal Fire Safety Matters letter, which may or may not require a follow-up inspection. Failure to comply with a Fire Safety Matters letter may be escalated to formal enforcement.
It is expected that the number of audits on different premises types in individual FRAs will vary from year to year depending on the local need, targeting strategies and the complexity of the specific buildings being audited.
COVID-19
In the latest year of data (year ending March 2026), there were no restrictions in response to the COVID-19 pandemic. This release provides comparisons to year ending March 2025 (the previous year) and to year ending March 2020 (6 years ago), neither of which were affected by COVID-19 restrictions.
Patterns of prevention and protection activity in the year ending March 2021 were substantially affected by the COVID-19 pandemic and government guidance to limit social contact. In the year ending March 2022, prevention and protection activity started to recover from levels seen in the year ending March 2021. However, activity remained below pre-pandemic levels, given that many restrictions remained in place until July 2021.
During the COVID-19 pandemic throughout the year ending March 2021, the National Fire Chiefs Council (NFCC) published a series of position statements on Prevention strategic intentions, which took into account the COVID-19 management measures in place. The most recent statement can be found here. These statements resulted in a halt to face-to-face (or over the threshold) HFSVs in the first lockdown and a transition to virtual HFSVs and limited face-to-face visits throughout the remainder of the year. The Home Office collected the number of virtual (online or telephone) HFSVs.
In response to the COVID-19 pandemic restrictions in the year ending March 2021, the NFCC published Guidance on carrying out desktop appraisals. Where a remote desktop appraisal of fire safety measures was carried out and recorded in accordance with Chief Fire Officers Association (CFOA) Short Audit guidance, and there were no outstanding fire safety issues, this activity was recorded in FRA returns. In the year ending March 2021, as a result of the COVID-19 pandemic, desktop appraisals were included in the total number of short audits in the release and accompanying tables.
Other related publications
MHCLG publishes several other statistical releases relating to fire and rescue authorities:
-
fire and rescue incident statistics, England, which provides statistics on trends in fires, casualties, false alarms and non-fire incidents attended by fire and rescue services in England, and is updated quarterly
-
detailed analysis of fires attended by fire and rescue services in England, which provides detailed analysis of fires, fire-related fatalities and non-fatal casualties, the causes of fires, smoke alarm ownership and operation, and response times to fires
-
detailed analysis of non-fire incidents attended by fire and rescue services, England, which provides detailed analysis of non-fire incidents, including overall trends, fatalities, non-fatal casualties and different categories of non-fire incident
-
response times to fires attended by fire and rescue services, England, which provides statistics on trends in average response times to fires attended by fire and rescue services
-
fire and rescue workforce and pensions statistics, which provides information on the size and diversity of the fire and rescue service workforce, joiners and leavers, attacks on firefighters, pension scheme membership, and pension fund income and expenditure
Other MHCLG publications related to fire safety include:
-
the English Housing Survey, which includes analysis of fires in the home, smoke alarm ownership and other fire safety measures, and how these vary by household and dwelling characteristics
-
Building Safety Remediation statistics, which provide information on the progress of remediating residential buildings over 11 metres with unsafe cladding in England
Fire statistics are also published by the other UK nations:
Scottish and Welsh fire statistics are based on the Fire and Rescue Data and Processing system (FaRDaP). Statistics for Northern Ireland are produced using a similar system, but are not directly comparable with statistics for England, Scotland and Wales.
We’re always looking to improve the accessibility of our documents. If you find any problems, or have any feedback, relating to accessibility please email us at firestatistics@communities.gov.uk