Fire and rescue workforce and pensions statistics: England, April 2021 to March 2022
Published 20 October 2022
Applies to England

© Crown copyright 2022
This publication is licensed under the terms of the Open Government Licence v3.0 except where otherwise stated. To view this licence, visit nationalarchives.gov.uk/doc/open-government-licence/version/3 or write to the Information Policy Team, The National Archives, Kew, London TW9 4DU, or email: psi@nationalarchives.gov.uk.
Where we have identified any third party copyright information you will need to obtain permission from the copyright holders concerned.
This publication is available at https://www.gov.uk/government/statistics/fire-and-rescue-workforce-and-pensions-statistics-england-april-2021-to-march-2022/fire-and-rescue-workforce-and-pensions-statistics-england-april-2021-to-march-2022
Frequency of release: Annual
Forthcoming releases: Home Office statistics release calendar
Home Office responsible statistician: Helene Clark
Press enquiries: pressoffice@homeoffice.gov.uk
Telephone: 0300 123 3535
Public enquiries: firestatistics@homeoffice.gov.uk
This release presents workforce and pensions statistics for Fire and Rescue Services in England. The release includes information on total workforce numbers, workforce diversity, leavers and joiners, firefighter injuries, attacks on firefighters, pension fund income and expenditure and pension schemes membership.
Key results
31,064 staff full-time equivalent (FTE) were employed as firefighters on 31 March 2022. This is a one per cent decrease compared with the previous year (31,508 in 2021). Since 2012, the number of firefighters has decreased by 21 per cent, while the total number of incidents and fires attended has decreased by 5 per cent and 32 per cent respectively.
As of 31 March 2022, 8.2 per cent (2,862) of firefighters employed by FRAs were women, compared with 7.5 per cent (2,644) in the previous year, and 5.2 per cent (1,833) five years ago.
During the financial year 2021 to 2022, there was a total of 2,278 firefighter injuries, five per cent more than in the previous year (2,166) but ten per cent lower than five years previously (2,523).
1. Workforce trends
This section covers information on the total FRS workforce, leavers, joiners and apprentices. The total workforce subsection covers Full-time Equivalent (FTE) figures as of 31 March 2022. The leavers, joiners and apprentices’ subsections provide headcount figures that cover the financial year 2021 to 2022 and the position on 31 March 2022.
Key results
As of 31 March 2022:
-
39,588 staff (FTE) were employed by Fire and Rescue Authorities (FRAs), a one per cent decrease compared with the previous year (39,924), a two per cent decrease compared with five years ago (40,419) and a 19 per cent decrease compared with ten years ago (48,620)
-
31,064 staff (FTE) were employed as firefighters, a one per cent decrease compared with the previous year (31,508), a four per cent decrease compared with five years ago (32,524) and a 21 per cent decrease compared with ten years ago (39,544)
-
44,350 staff (headcount) were employed by Fire and Rescue Authorities (FRAs), a one per cent decrease compared with the previous year (44,657), similar compared with five years ago (44,230) and a 15 per cent decrease compared with ten years ago (52,067)
-
34,960 staff (headcount) were employed as firefighters, a one per cent decrease compared with the previous year (35,334), a two per cent decrease compared with five years ago (35,505) and a 17 per cent decrease compared with ten years ago (42,058)
During the financial year 2021 to 2022:
-
4,640 staff left FRSs (10 per cent of the 31 March 2021 headcount) and 3,845 staff joined (9 per cent of the 31 March 2022 headcount)
-
the most common reason for leaving was ‘normal’ or ‘early’ retirement which accounted for 35 per cent of leavers (1,646 staff)
Role definitions
Wholetime firefighter A full-time firefighter, regardless of rank.
On-call firefighter A firefighter responding when required during their ‘on-call’ hours, sometimes called Retained Duty System.
Fire control A uniformed member of staff working in a fire and rescue service control centre to answer emergency calls and deal with mobilising, communications and related activities, regardless of rank.
Support staff A member of staff employed by the FRA who is not a firefighter or in fire control. It includes, for example, administrative roles, clerical support, analytical support, finance, vehicle maintenance, property management etc.
1.1 Total workforce
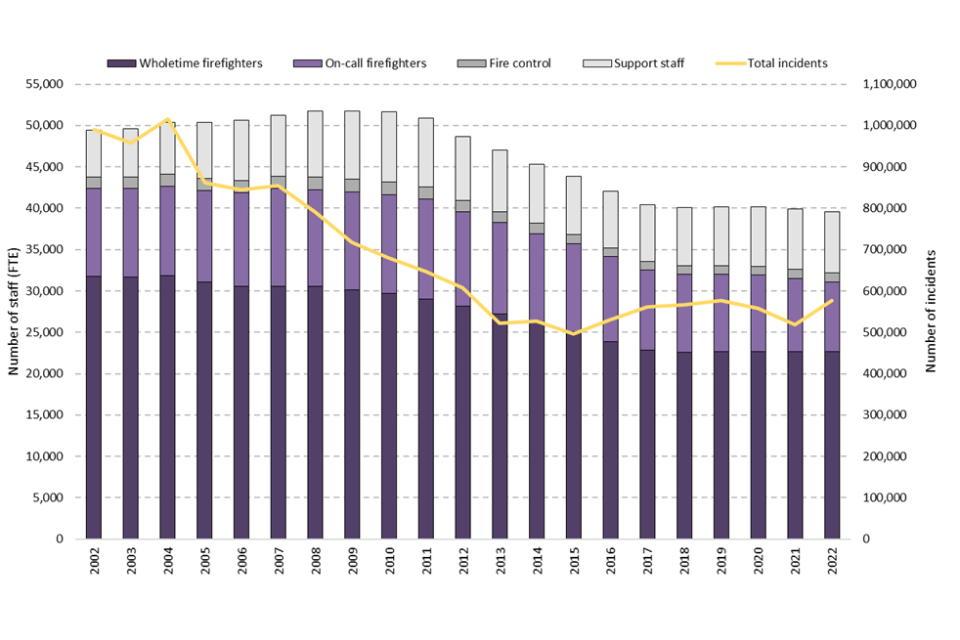
Figure 1.1 shows that the total full-time equivalent (FTE) workforce gradually increased from around 49,400 in 2002 to a peak of around 51,700 in 2009. This was an average increase of less than one per cent per year (0.7 per cent). Over this same time period, the total number of firefighters (FTE) was broadly stable (decreasing by around 400), while support staff (FTE) increased by around 2,500.
Figure 1.1: Total staff employed (FTE) by FRAs, by role, including incidents attended, England, 2002 to 2022

Source: FIRE1101
Since this peak in 2009, the total workforce (FTE) decreased to around 40,400 in 2017. From 2017 onwards the figure has continued to decrease but at much smaller magnitudes.
As of 31 March 2022, 39,588 staff (FTE) were employed by Fire and Rescue Authorities (FRAs), a one per cent decrease compared with the previous year (39,924), a two per cent decrease compared with five years ago (40,419) and a 19 per cent decrease compared with ten years ago (48,620).
Table 1.1: FRS staff (FTE) by role, England, 2021 and 2022
| Role | 2021 | 2022 | Percentage change |
|---|---|---|---|
| Fire control | 1,096 | 1,084 | -1% |
| Support staff | 7,321 | 7,440 | +2% |
| Wholetime firefighters | 22,632 | 22,642 | 0% |
| On-call firefighters | 8,876 | 8,422 | -5% |
| All staff | 39,924 | 39,588 | -1% |
1.2 Fire control
As of 31 March 2022, 1,084 staff (FTE) were employed by FRAs as fire control. This was a one per cent decrease compared with the previous year (1,096), a four per cent increase compared with five years ago (1,043) and a 21 per cent decrease compared with ten years ago (1,371).
1.3 Support staff
As of 31 March 2022, 7,440 staff (FTE) were employed by FRAs as support staff. This was a two per cent increase compared with the previous year (7,321), a nine per cent increase compared with five years ago (6,852) but a three per cent decrease compared with ten years ago (7,704).
Further information on total workforce can be found in fire data tables 1101, 1102, 1132 and 1133.
1.4 Firefighters
The number of firefighters (FTE) fell slowly from a peak of around 42,700 in 2004 to around 32,000 in 2018. The number remained broadly stable between 2018 and 2020 before falling by around one per cent in each of the last two years to around 31,100 in 2022. As of 31 March 2022, 31,064 staff (FTE) were employed as firefighters. This was a one per cent decrease compared with the previous year (31,508), a four per cent decrease compared with five years ago (32,524) and a 21 per cent decrease compared with ten years ago (39,544). The decrease compared with the previous year is driven by the decrease in on-call firefighters (FTE) (-454). The number of wholetime firefighters (FTE) was broadly similar compared with the previous year (+10).
Figure 1.2: Change in number of firefighters (FTE) compared with the previous year in England, 2010 to 2022
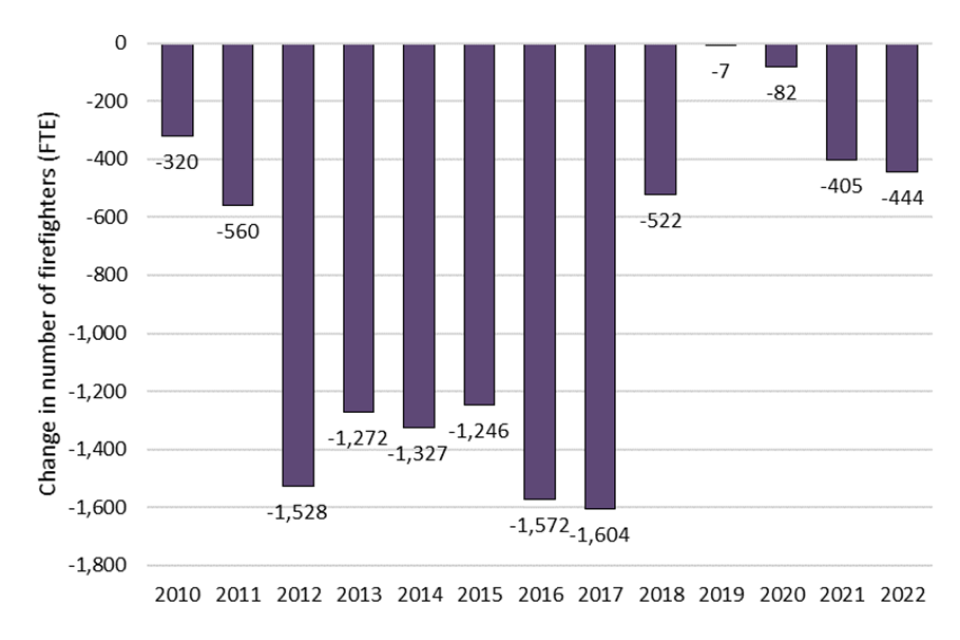
Source: FIRE1101
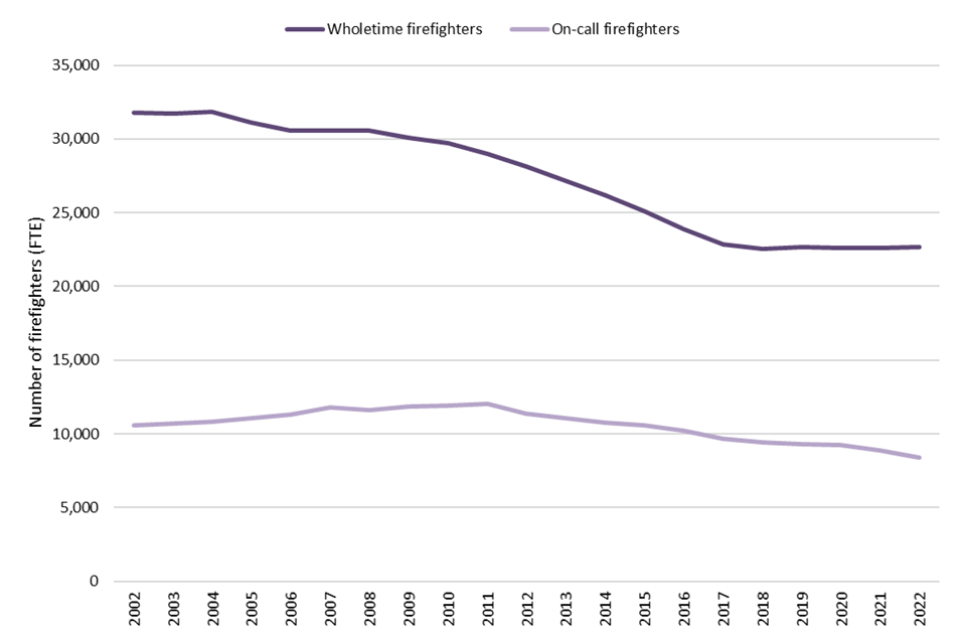
The numbers of wholetime firefighters (FTE) and on-call firefighters (FTE) have followed different trends. The number of wholetime firefighters (FTE) went through a period of decline between 2004 and 2018, reducing from a peak of around 31,800 to around 22,600, and has remained broadly stable since. The number of on-call firefighters (FTE) went through a period of increase between 2002 and 2011, increasing from around 10,600 to a peak of around 12,100. This was followed by a period of decline between 2011 and the current year in which the figure reduced year on year to around 8,400.
Figure 1.3: Wholetime and on-call firefighters (FTE) in England, 2002 to 2022
Source: FIRE1101
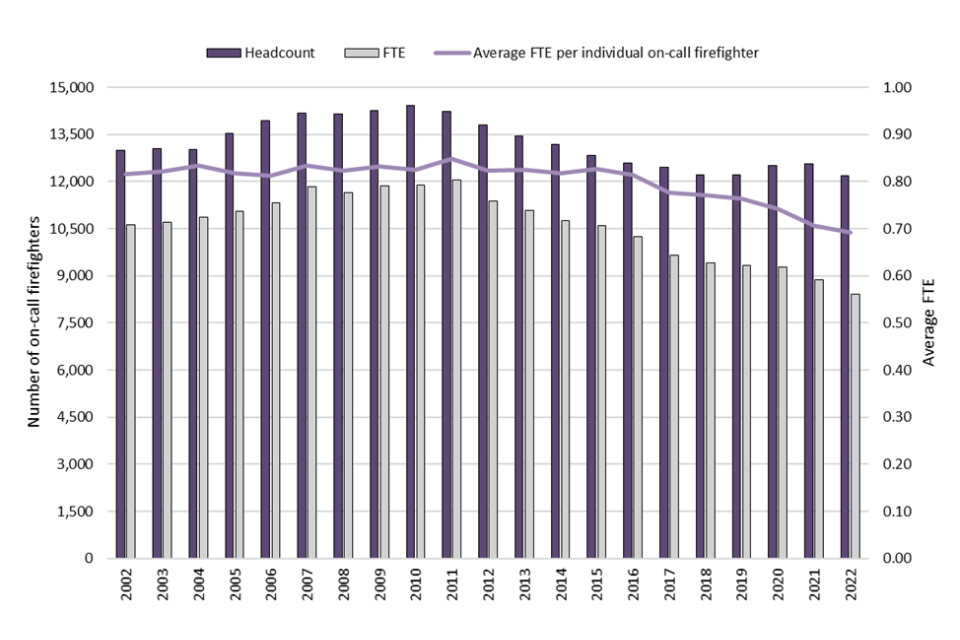
The average on-call firefighter FTE figure for England is calculated by dividing the total on-call firefighter FTE figure by the total on-call firefighter headcount figure. Between 2002 and 2010 this figure remained broadly stable between 0.81 and 0.83. The figure peaked at 0.85 in 2011 and has since been on a general downward trend, reaching 0.69 in 2022. This means that on average, on-call firefighters are working fewer hours.
Figure 1.4: On-call firefighters (headcount & FTE) and average FTE of on-call firefighters in England, 2002 to 2022
1.5 Workforce leavers and joiners
Information on leavers and joiners is collected on a headcount (i.e. an individual rather than FTE) basis. The proportion of FRS staff who left is calculated as the number of FRS staff who left in each year as a proportion of the headcount from the previous year.
Leavers
The absolute number of staff leaving FRSs each year has fluctuated between around 3,500 and 4,640 since data become available in 2009 to 2010. In 2021 to 2022, 4,640 staff left FRSs, the largest number in the time series, and a 32 per cent increase on the previous year. This follows two successive years of decreases in the number of leavers - down from 4,294 in 2018 to 2019 to 4,194 in 2019 to 2020 (a two per cent decrease) to 3,522 in 2020 to 2021 (a 16 per cent decrease).
Since 2010 to 2011, the proportion of FRS staff that left FRSs increased slowly from seven per cent to ten per cent in financial year 2018 to 2019. This proportion then decreased slightly to nine per cent in financial year 2019 to 2020 and again to eight per cent in financial year 2020 to 2021. During the financial year 2021 to 2022, the proportion of staff who left increased to ten per cent, the joint largest proportion in the time series similar to 2016 to 2017 and 2018 to 2019.
The proportion of firefighters that left the FRSs has followed a similar trend to the proportion of all staff that left. The proportion of firefighters that left the FRSs increased slowly from six per cent in financial year 2009 to 2010 to nine per cent in financial year 2018 to 2019 before decreasing slightly in the following two years to seven per cent in financial year 2020 to 2021. During the financial year 2021 to 2022, the proportion of firefighters who left increased to ten per cent, the largest proportion in the time series.
Reasons for leaving
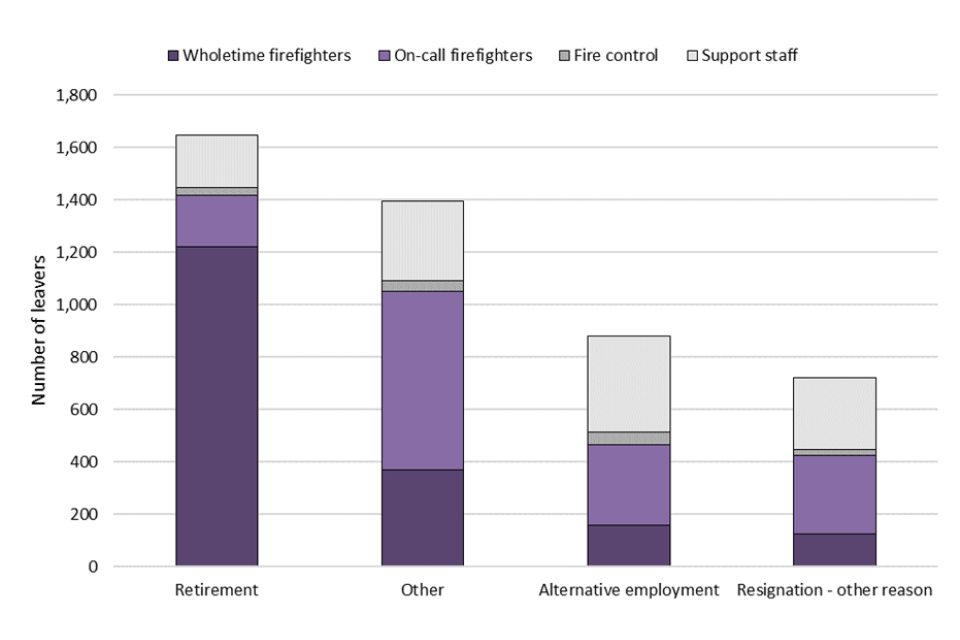
For the 4,640 staff who left FRSs in financial year 2021 to 2022, the most common reason for leaving was ‘normal’ or ‘early’ retirement[footnote 1] (see Figure 1.5), which accounted for 35 per cent of all leavers (1,646 staff). This figure has remained broadly stable during the last five years (between 31 per cent and 35 per cent).
Of the 1,646 FRS staff whose reason for leaving in 2021 to 2022 was ‘normal’ or ‘early’ retirement, 74 per cent (1,219) were wholetime firefighters, 12 per cent (197) were on-call firefighters, 12 per cent (198) were support staff and two per cent (32) were fire control staff.
The second most common reason staff left FRSs in financial year 2021 to 2022, as in the previous two years, was ‘resignation - to take up alternative employment’. The proportion of leavers who left for this reason decreased from 23 per cent (908) in 2017 to 2018 to 15 per cent (520) in 2020 to 2021. In 2021 to 2022, this figure increased to 19 per cent (879).
Of those whose reason for leaving in financial year 2021 to 2022 was ‘resignation - to take up alternative employment’, 42 per cent were support staff, 35 per cent were on-call firefighters, 18 per cent were wholetime firefighters and five per cent were fire control staff.
In financial year 2021 to 2022, 48 FRS staff resigned due to ‘ill health’ (1 per cent of those who left), the lowest number since data became available. The proportion of leavers who resigned due to ‘ill health’ has remained broadly stable over the last five years at between one and two per cent.
The reason for staff leaving FRSs in 2021 to 2022 varied by staff role. For wholetime firefighters, the most common reason was retirement, which accounted for 65 per cent of leavers, as in most of the last five years - except 2020 to 2021 when the proportion reduced to 62 per cent. However, retirement accounted for 13 per cent of on-call firefighter leavers, 22 per cent of fire control leavers and 17 per cent of support staff leavers.
The most common reason for leaving for on-call firefighters, fire control staff and support staff was resignation for alternative employment, accounting for 21 per cent, 33 per cent and 32 per cent respectively, but only 9 per cent for wholetime firefighters. Figure 1.5 shows the proportion of FRS leavers by reason and role for 2021 to 2022 - the ‘Other’ category comprises 12 other reasons for leaving reported by FRSs[footnote 2]. See table FIRE1111 for further detail.
Figure 1.5: Number of FRS leavers (headcount) by reason for leaving, England, 2022
Source: FIRE1111
Joiners
Data covering new joiners became available in 2016 to 2017; however, eight FRSs were unable to provide data that year and hence the new joiner figures (2,262 total staff and 1,484 firefighters) is not fully representative. Since 2017 to 2018, the annual number of staff who joined FRSs has fluctuated between around 3,750 and 4,300. In 2021 to 2022, 3,845 staff joined FRSs compared with 3,531 in the previous year – an increase of 314 staff, equivalent to a nine per cent increase. This follows two years of successive decreases in the number of new staff, from the peak of new joiners in financial year 2018 to 2019 of 4,255.
The annual number of firefighters who joined FRSs since 2017 to 2018 has fluctuated between around 2,500 and 3,200 and has followed a similar trend to the number of new staff. In 2021 to 2022 2,672 firefighters joined FRSs compared with 2,510 in the previous year – an increase of 162 staff equivalent to a six per cent increase. This follows two years of successive decreases in the number of new firefighters, from a peak of 3,181 new joiner firefighters in the financial year 2018 to 2019.
The proportion of FRS staff that were new joiners has fluctuated between eight per cent and ten per cent, since data became available in 2017 to 2018. In 2021 to 2022, nine per cent of FRS staff were new joiners compared with eight per cent in the previous year. This follows two years of successive decreases in the proportion of staff who were new joiners.
The proportion of firefighters that were new joiners has fluctuated between seven per cent and nine per cent, since data became available in 2017 to 2018 and has followed a similar trend to the proportion of all staff who were new joiners. In 2021 to 2022, eight per cent of firefighters were new joiners compared with seven per cent in the previous year. This follows two years of successive decreases in the proportion of firefighters who were new joiners.
Further information on workforce leavers and joiners can be found in fire data tables 1110, 1111, 1112, 1120, 1121 and 1122.
Apprentices
As of 31 March 2022, there were 1,413 apprentices employed by FRAs, similar to the previous year (1,415). Of the apprentices employed by FRAs, 85 per cent (1,194) were apprentice wholetime firefighters, 13 per cent (185) were support staff and two per cent (34) were control room staff.
In financial year 2021 to 2022, there were 807 new joiner apprentices, which was 21 per cent higher than the previous year (666). Wholetime firefighters accounted for 84 per cent (681) of the new joiner apprentices, with support staff accounting for 14 per cent (111), and fire control two per cent (16).
Further information on apprentices can be found in fire data tables 1123, 1124 and 1125.
2. Workforce diversity
This section covers information on six diversity characteristics - gender, ethnicity, age, religion, sexual orientation, and disability. The cohorts of staff covered include all FRS staff, joiners, apprentices, and joiner apprentices. The figures in this section are taken as of 31 March 2022, except the joiners’ figures which are for FRS staff who joined during financial year 2021 to 2022. All figures in this section are headcount figures (as opposed to FTE).
Key results
As of 31 March 2022:
-
8.2 per cent (2,862) of firefighters employed by FRAs were women compared with 7.5 per cent (2,644) in the previous year and 5.2 per cent (1,833) five years ago
-
5.0 per cent (1,582) of firefighters employed by FRAs who stated their ethnicity were from an ethnic minority, compared with 4.7 per cent (1,517) in the previous year and 3.9 per cent (1,255) five years ago
-
the average age of firefighters employed by FRAs was 41, compared with 41 in the previous year and 42 five years ago
-
of those who stated their sexual orientation, 3.9 per cent (872) of firefighters employed by FRAs were lesbian/gay or bisexual, compared with 3.4 per cent (750) in the previous year and 2.6 per cent (451) five years ago
2.1 Gender
Women accounted for 18.6 per cent of all staff employed by FRAs as of 31 March 2022. This is slightly higher than in previous years (17.9 per cent in 2021, 15.1 per cent five years ago and 14.5 per cent ten years ago).
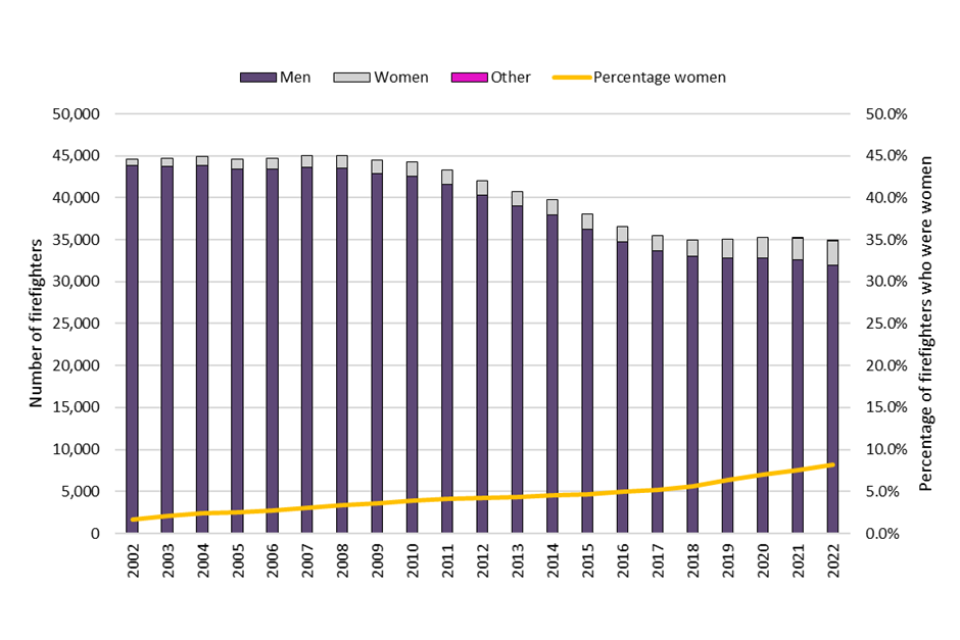
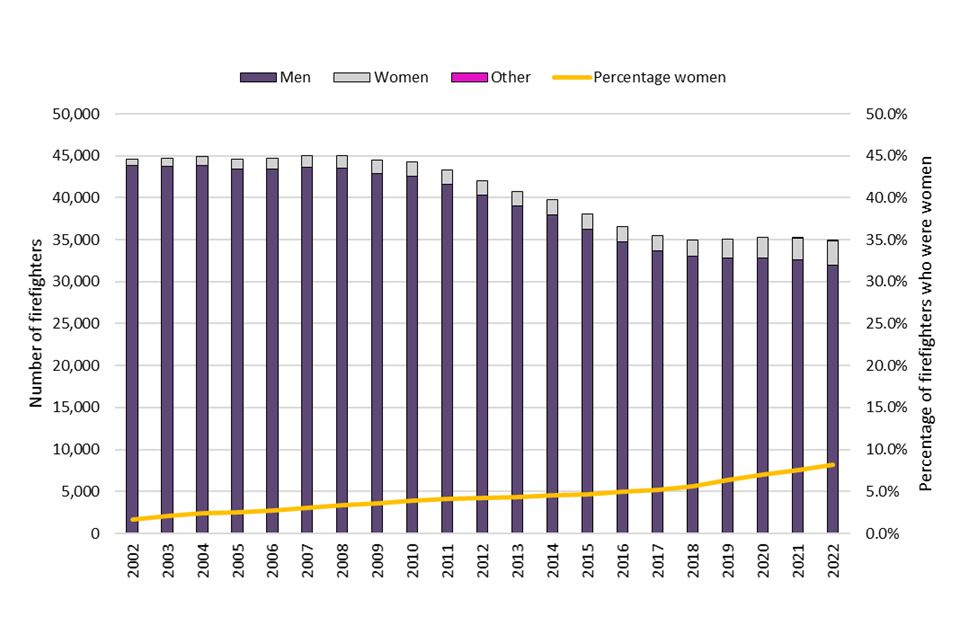
The number and proportion of women firefighters has slowly increased from 2002 (the first year for which comparable data are available) from 1.7 per cent (753) of all firefighters to 8.2 per cent (2,862) in 2022. For comparison, the percentage of police officers in England and Wales as at 31 March 2022 that were women was 33.5 per cent[footnote 3].
Figure 2.1: Gender of firefighters in England, 2002 to 2022
Source: FIRE1103
The number of firefighters was broadly stable between 2002 and 2008 between around 44,500 and 45,000. Between 2008 and 2018, the number of firefighters reduced from around 45,000 to around 35,000, with the number of firefighters who were men reducing from 43,500 to 33,000 and the number of firefighters that were women increasing from 1,500 to 2,000. Consequently, the proportion of firefighters that were women also increased from 3.3 per cent to 5.7 per cent. Since 2018, the number of firefighters has remained broadly stable at around 35,000, while the number of firefighters who are men has continued to reduce (to 31,960 in 2022), and the number of firefighters who are women has continued to increase (to 2,862) and hence the proportion of firefighters who are women has continued to increase.
As of 31 March 2022, when looking at women by role, 35 per cent were firefighters and 54 per cent were support staff. In contrast, 89 per cent of all men employed by FRAs were firefighters and 10 per cent were support staff. See figures 2.2 and 2.3 for further detail.
Figure 2.2: Men employed by FRAs, by role in England 2002 to 2022
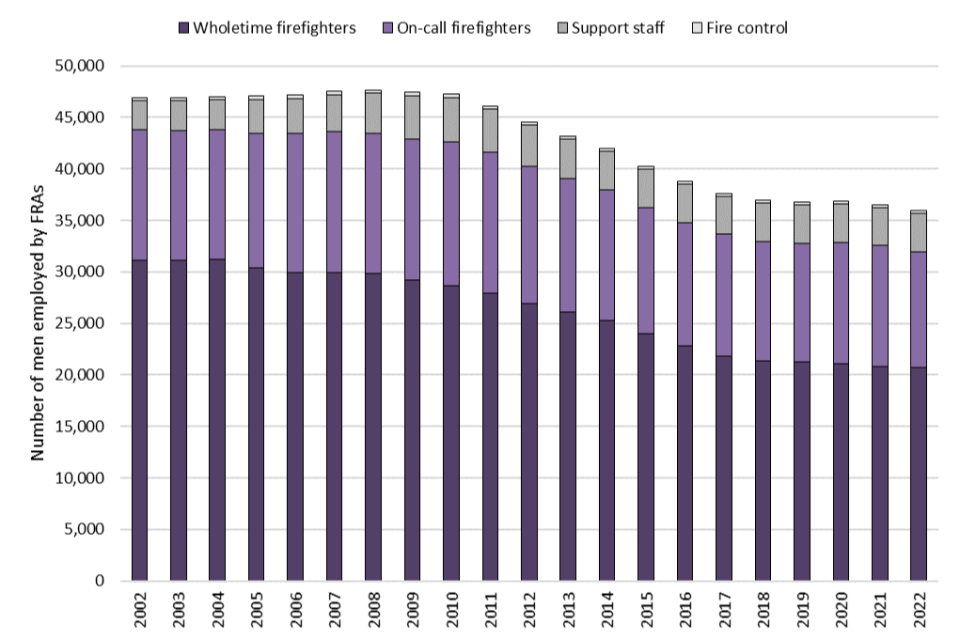
Figure 2.3: Women employed by FRAs, by role in England 2002 to 2022
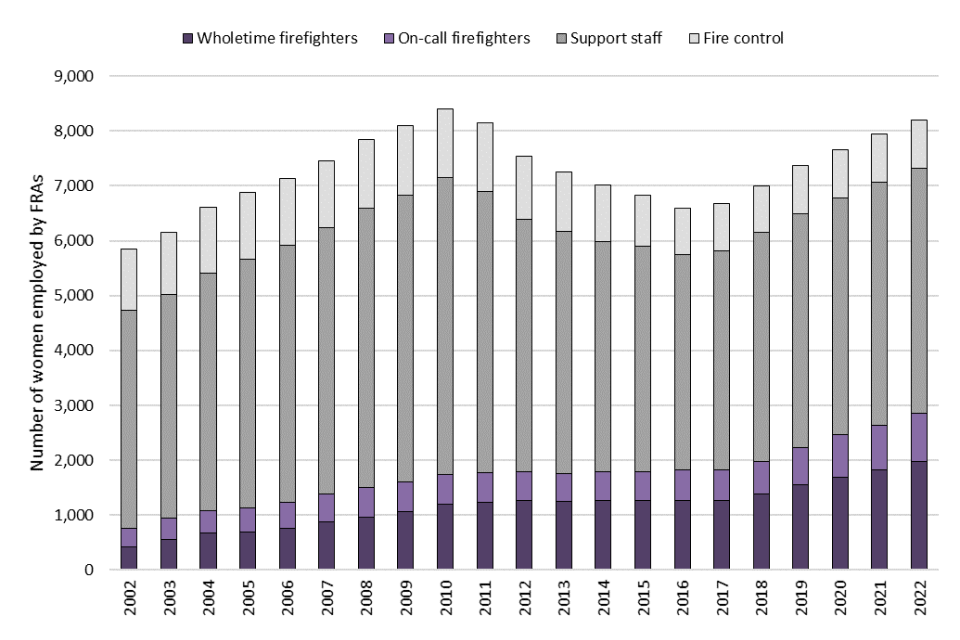
Source: FIRE1103
Since 2002, the proportion of support staff that are women has been over half, with the highest proportion in 2004 (60 per cent) and the lowest in 2016 (51 per cent).
For fire control staff, 77 per cent were women as of 31 March 2022. This figure was a one percentage point increase compared with the previous year (76 per cent) and five years ago (76 per cent), but a three-percentage point decrease compared with ten years ago (79 per cent).
The rank of women firefighters as of 31 March 2022 shows a mixed story, with the top and lowest ranks (brigade managers and firefighters) showing above average proportions of women (9.2 per cent and 9.8 per cent respectively, compared with 8.2 per cent for all ranks). The middle ranks (area manager, group manager, station manager, watch manager and crew manager) all showed proportions of women lower than the average for all ranks (ranging from 5.0 per cent to 6.8 per cent).
Figure 2.4: Proportion of firefighters who are women, by rank in England in 2022
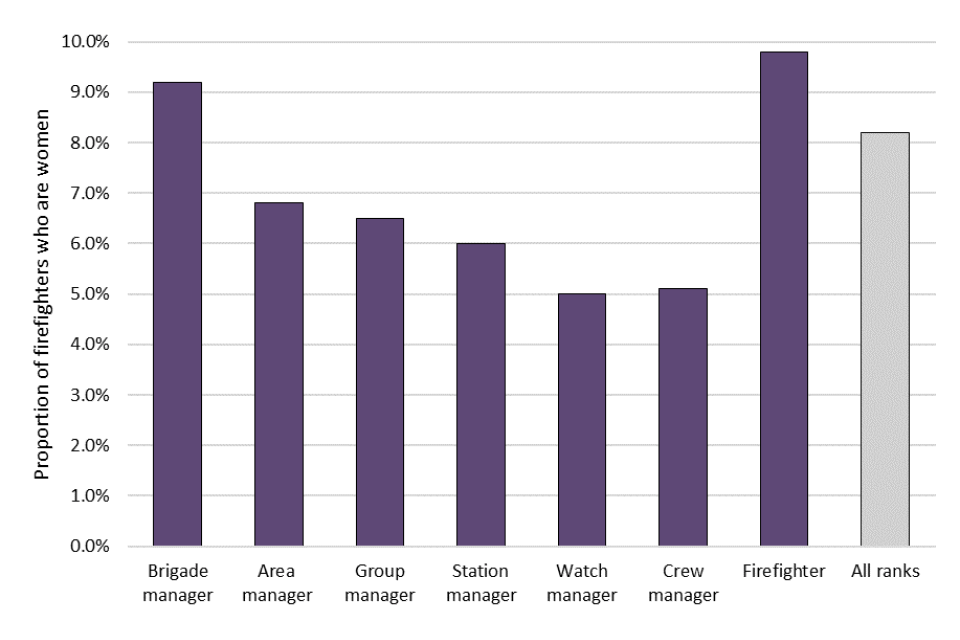
Source: FIRE1108
The gender category ‘Other’ was included in the data collection this year for the second time. As of 31 March 2022, there were 29 total staff that reported their gender as other, up from 18 the previous year. For the staff reporting their gender as other, 26 were firefighters, up from 15 the previous year.
2.2 Ethnicity
All FRSs collect and provide ethnicity information to the Home Office, however, 3,852 staff (8.7 per cent) did not state an ethnicity in 2022. This proportion has varied between 7.2 per cent and 11.3 per cent since 2011. Ethnicity statistics are published at an FRS level in Table FIRE1104.
Overall, on 31 March 2022, 5.6 per cent (2,258) of all FRS staff of known ethnicity were from an ethnic minority group, compared with 5.3 per cent in the previous year (2,157) and 4.4 per cent five years ago (1,786).
The proportion of firefighters that were from an ethnic minority group[footnote 4] has increased slowly from 3.5 per cent in 2011 (from when consistent data are available) to 5.0 per cent in 2022. This compares with 15.8 per cent of the England population in the most recent ONS population estimates[footnote 5] and 8.1 per cent of police officers in England in 2022 that were from an ethnic minority group[footnote 6].
Figure 2.5: Proportion of firefighters (of known ethnicity) from an ethnic minority group in England, 2002 to 2022
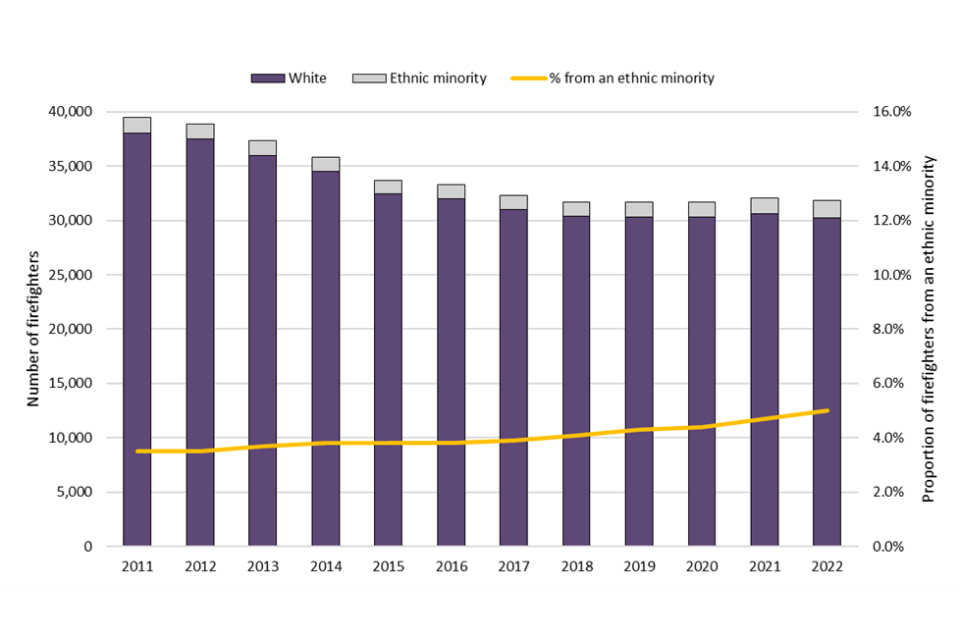
Source: FIRE1104
Between 2011 and 2018 the number of white firefighters decreased by 20 per cent while the number of firefighters from an ethnic minority decreased by six per cent. Since 2019, the number of white firefighters has decreased by 0.1 per cent whereas the number of firefighters from an ethnic minority has increased by 16 per cent.
As of 31 March 2022, the proportion of fire control staff from an ethnic minority group was 3.3 per cent (34). This figure has remained broadly similar during the last five years (3.0 per cent in the previous year and 3.2 per cent five years ago).
As of 31 March 2022, 8.4 per cent (642) of support staff were from an ethnic minority group. This figure is a slight increase compared with last year (8.1 per cent) and five years ago (7.2 per cent).
2.3 Age
Statistics on the age of FRS staff by role are published at an FRS level in table FIRE1105. Data on age is captured in five distinct age bands.
From 2011 to 2013 the average age of all FRS staff was 41. This figure increased to 42 in 2014 and has remained the same in each year since.
From 2011 to 2018 the average age of firefighters gradually increased from 40 to 42. From 2019 onwards the average age of firefighters has been 41.
As of 31 March 2022, 36 to 45 was the most common age category of firefighters, 34 per cent (11,701) were in this category. This is broadly consistent with previous years, 33 per cent (11,603) the previous year and 35 per cent (12,361) five years ago. For context 20 per cent of the resident population aged 15 to 64 (and hence approximately ‘working age’) were aged 35 to 44 in March 2021 according to 2021 census data[footnote 7]. The age bands used in the Home Office operational statistics data collection, that underpins this release, slightly differ from the bands used in the currently available 2021 census data and hence exact comparisons are not possible. Approximate comparisons are included here for context.
Only four per cent (1,412) of firefighters were aged 17 to 24 as of 31 March 2022. This proportion was four per cent in the previous year (1,387) and three per cent five years ago (1,049). For context 18 per cent of the resident population aged 15 to 64 (and hence approximately ‘working age’) were aged 15 to 24 in March 2021 according to 2021 census data[footnote 8]. Again, exact comparisons to the 2021 census data are not possible due to the slight misalignment of age bands used.
Experimental statistics and data quality
Statistics on religion, sexual orientation and disability are included as experimental statistics due to some quality limitations and other issues which users should be aware of, for example:
-
some FRSs do not collect these data
-
the data contain a relatively high proportion of ‘not stated’ entries; the proportion varies significantly across different FRSs, 33 per cent of data for religion, 34 per cent for sexual orientation and 23 per cent for disability are either not collected or not stated in 2022 (hence the figures may not be fully representative of FRSs as a whole)
-
for data protection reasons we have combined or suppressed any categories with very small figures, and statistics are published at an England level only as FRS level figures would require heavy suppression which would greatly limit the usefulness of many of the statistics
The statistics serve a public good in understanding the diversity of the FRS workforce but given the current quality limitations they are published as ‘Experimental Statistics’. Experimental Statistics are statistics which are published in order to involve users and stakeholders in their development and as a means to build in quality at an early stage. Statisticians have been working with the FRSs with the highest proportions of ‘not stated’ to try to improve the data.
2.4 Religion (experimental statistics)
Religion statistics are published in table FIRE1106.
Four FRSs did not provide information on religion in the datasets they supplied to the Home Office in 2022, meaning that no data were available for three per cent of staff for all FRSs in England (this compares with 27 per cent in 2011). A further 30 per cent of all FRS staff were recorded as religion not stated in 2022. All of these responses are excluded from the calculations below.
Figures on religion of the FRS workforce are available from 2011. ‘Christian’ was the most common response of FRS staff in each year between 2011 and 2021. In 2022, ‘no religion’ has superseded ‘Christian’ as the most common response for the first time in the time series.
The proportion of all staff who identified as ‘Christian’ peaked in 2012 at 62 per cent and has steadily reduced to 47 per cent in 2022. The proportion of staff who identify as having ‘no religion’ has steadily increased from 33 per cent in 2011 to 47 per cent in 2022.
The remaining staff of known religion in 2022 were allocated to the following categories, in descending order: Other (3.6 per cent), Muslim (1.0 per cent), Buddhist (0.6 per cent), Sikh (0.3 per cent), Hindu (0.3 per cent) and Jewish (0.1 per cent).
Figure 2.6: FRS staff by religion, England, 2011 to 2022
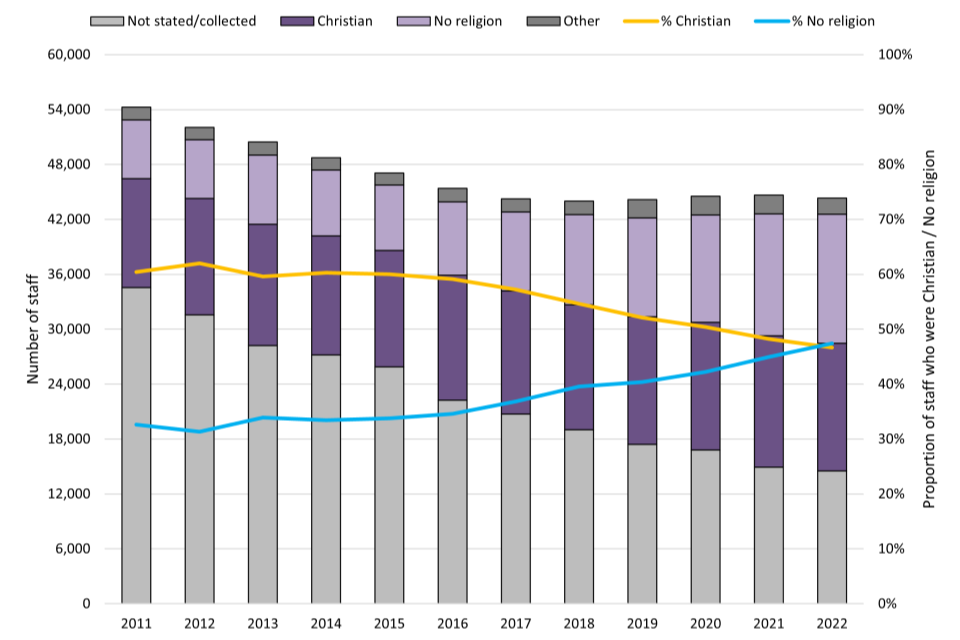
To note, for ease of comparison a broader ‘Other’ category is used in figure 2.6, relative to the ‘Other’ category referenced previously. This broader ‘Other’ category incorporates the following subcategories that were used in the data collection: ‘Muslim’, ‘Buddhist’, ‘Sikh’, ‘Hindu’, ‘Jewish’ and ‘Other’.
The proportion of firefighters that identified as ‘Christian’ peaked in 2012 at 61 per cent and has gradually reduced to 45 per cent in 2022. The proportion of firefighters who identify as having ‘no religion’ has steadily increased from 34 per cent in 2011 to 49 per cent in 2022.
The remaining firefighters of known religion in 2022 were allocated to the following categories, in descending order: Other (3.5 per cent), Muslim (0.8 per cent), Buddhist (0.7 per cent), Sikh (0.2 per cent), Hindu (0.1 per cent) and Jewish (0.1 per cent).
For comparison, according to the most recent ONS population estimates (2019) 51 per cent of England’s resident population identified as being ‘Christian’, 38 per cent as ‘No religion’, 5.9 per cent as ‘Muslim’, 1.7 per cent as Hindu, 1.5 per cent as ‘Other’, 0.7 per cent as ‘Sikh’, 0.6 per cent as ‘Jewish’ and 0.5 per cent as ‘Buddhist’[footnote 9].
2.5 Sexual orientation (experimental statistics)
Sexual orientation statistics are published in table FIRE1107.
Three FRSs did not provide information on sexual orientation in the datasets they supplied to the Home Office in 2022, meaning that no data were available for 2.8 per cent of staff for all FRSs in England (compared with 27 per cent in 2011). A further 31 per cent of all FRS staff were recorded as not stated in 2022 (broadly the same percentage as previous years). All of these responses are excluded from the data in this section. Hence the percentages below should be interpreted as percentages of those with known sexual orientation.
The proportion of FRS staff that stated they were gay, lesbian or bisexual was 3.0 per cent in 2011, the first year data became available. This figure reduced slightly in 2012 to 2.7 per cent and remained broadly stable until 2017. Since 2017, this figure has increased slightly each year to 3.9 per cent in 2022, the largest figure in the time series.
Figure 2.7: FRS staff by sexual orientation, England, 2011 to 2022
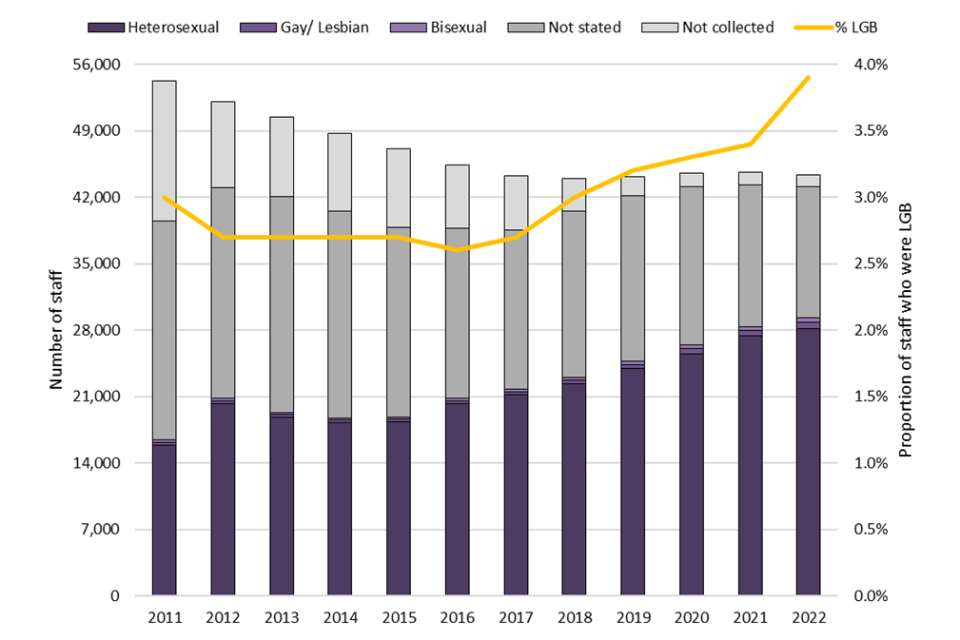
The proportion of firefighters that stated they were gay, lesbian or bisexual has followed an almost identical trend. The figure in 2022 was also 3.9 per cent, following slight increases in each of the last six years. This also represents the largest figure in the time series.
For comparison, around 3.1 per cent of the England population aged 16 and over identify as gay, lesbian or bisexual[footnote 10].
2.6 Disability (experimental statistics)
Disability statistics are published for the second time in table FIRE1130.
All FRSs provided disability data covering at least some proportion of their staff, although 23 per cent of all FRS staff were recorded as ‘not stated’. All of these responses are excluded from the data in this section. Hence the percentages below should be interpreted as percentages of those with known disability status.
As of 31 March 2022:
- 5.4 per cent of all staff were recorded as disabled compared with 5.1 per cent the previous year
- 4.4 per cent of firefighters were recorded as disabled compared with 4.0 per cent the previous year
- 7.3 per cent of fire control staff were recorded as disabled compared with 6.7 per cent the previous year
- 9.5 per cent of support staff were recorded as disabled compared with 8.9 per cent the previous year
For context, according to the 2020 to 2021 Department for Work and Pensions (DWP) Family Resources Survey figures[footnote 11], around 21 per cent of people of working age in the UK are disabled.
Further information on workforce diversity can be found in fire data tables 1103, 1104, 1105, 1106, 1107, 1108, 1130 and 1131.
2.7 Workforce joiner diversity
Gender
In financial year 2021 to 2022, the proportion of all new staff that were women was 25 per cent, the same as the previous year. This proportion remains greater than the proportion of the pre-existing workforce (those in post prior to financial year 2021 to 2022) who were women (18 per cent).
In financial year 2021 to 2022, the proportion of new firefighters who were women was 12.8 per cent, a slight decrease compared with the previous year (13.4 per cent). This follows four years of successive increases from 8.7 per cent in 2016 to 2017, when data became available. Despite the slight decrease in the 2021 to 2022 figure, the proportion of new firefighter recruits who were women remained greater than the proportion of the existing firefighter workforce (as of 31 March 2021) who were women (7.5 per cent).
Ethnicity
In 2021 to 2022, the proportion of all new staff that were from an ethnic minority was 6.8 per cent, a slight decrease compared with the previous year (8.0 per cent). Since data became available in 2016 to 2017 this figure has fluctuated between six and eight per cent. The proportion of all new staff that were from an ethnic minority in 2021 to 2022 is greater than the proportion of the pre-existing workforce (those in post prior to financial year 2021 to 2022) who were from an ethnic minority (5.3 per cent).
In 2021 to 2022, the proportion of new firefighters who were from an ethnic minority was 5.7 per cent, a decrease compared with the previous year (8.0 per cent). Prior to this peak in 2020 to 2021, this figure slowly increased from 5.1 per cent in 2016 to 2017 to 5.5 per cent in 2019 to 2020. Despite the decrease in the 2021 to 2022 figure, the proportion of new firefighter recruits who were from an ethnic minority remained greater than the proportion of the existing firefighter workforce (as of 31 March 2021) who were from an ethnic minority (4.7 per cent).
Age
The proportion of all new staff that were under the age of 35 increased marginally from 61 per cent in financial year 2020 to 2021 to 62 per cent in financial year 2021 to 2022. This figure has fluctuated between around 61 percent and 66 per cent since data became available in 2016 to 2017. The proportion of all new staff that were under the age of 35 in 2021 to 2022 remains greater than the proportion of the pre-existing workforce (those in post prior to financial year 2021 to 2022) who were under the age of 35 (29 per cent).
The proportion of new firefighters who were under the age of 35 increased slightly from 67 per cent in financial year 2020 to 2021 to 69 per cent in financial year 2021 to 2022. This figure has fluctuated between around 67 per cent and 74 per cent since data became available in 2016 to 2017. The proportion of new firefighter recruits who were under the age of 35 in 2021 to 2022 remained greater than the proportion of the existing firefighter workforce (as of 31 March 2021) who were under the age of 35 (30 per cent).
Further information on workforce joiners including on fire control and support staff can be found in fire data tables 1120, 1121 and 1122.
2.8 Apprentice diversity
This year is the fourth year in which the Home Office has collected information on the diversity of apprentices (2019 to present). The data covers apprentices who were employed by FRAs as of 31 March each year and also those joining during the financial year.
Gender
- as of 31 March 2022, 13.3 per cent (158) of wholetime firefighter apprentices were women, compared with 14.9 per cent (182) in the previous year; since data became available in 2019, this proportion has remained broadly stable with marginal fluctuations between 13 per cent and 15 per cent
- an 2021 to 2022 12.9 per cent (88) of new wholetime firefighter apprentices were women, compared with 20.3 per cent (124) in the previous year; since data became available in 2019 to 2020, this proportion has fluctuated between around 13 per cent and 20 per cent
Ethnicity
- as of 31 March 2022, 10.6 per cent (120) of wholetime firefighter apprentices were from an ethnic minority, compared with 12.5 per cent (139) in the previous year; since 2019, the year in which data became available, this proportion has increased from 8.1 per cent (40)
- in 2021 to 2022 10.6 per cent (68) of new wholetime firefighter apprentices were from an ethnic minority, compared with 15.5 per cent (88) in the previous year; since 2018 to 2019, this proportion has increased from 7.6 per cent (29)
Age
- as of 31 March 2022, 74 per cent (882) of wholetime firefighter apprentices were under the age of 35, compared with 73 per cent (893) in the previous year.; this follows two years of successive decreases from 83 per cent (490) in 2019
- in 2021 to 2022 79 per cent (534) of new wholetime firefighter apprentices were under the age of 35, similar to the previous year (79 per cent, 481); prior to this, the proportion was 84 per cent (390) in 2018 to 2019 and 76 per cent (422) in 2019 to 2020
Further information on apprentices can be found in fire data tables 1123, 1124 and 1125.
3. Firefighters’ health and safety
Key results
During the financial year 2021 to 2022:
- there were a total of 2,278 firefighter injuries, five per cent more than in the previous year (2,166) but ten per cent lower than five years previously (2,523)
- 49 injuries to firefighters were classed as major injuries[footnote 12], compared with 25 in the previous year and 130 five years earlier
- 977 firefighter injuries were sustained during operational incidents, four per cent more than in the previous year (941) but nine per cent fewer than five years previously (1,071)
- there were no firefighter fatalities recorded – since 2012 to 2013 there have only been four firefighter fatalities in total, the most recent occurred in 2020 to 2021
Data are collected on injuries sustained by on-duty firefighters and whether they were sustained during operational incidents (at fires, road traffic collisions or at other special service incidents) or during training (operational or fitness) and routine activities. The collection asks for the total number of personnel injured, the number of ‘over seven-day injuries’, the number of RIDDOR[footnote 13] major injuries, and the number of fatalities.
The total number of incidents attended during the financial year 2021 to 2022 was eleven per cent higher than the previous year. The increase in the number of incidents attended is likely to have been a contributing factor to the increase in firefighter injuries during the financial year 2021 to 2022; however, injuries do also occur during training and routine activities. The total number of injuries remains below pre-pandemic levels.
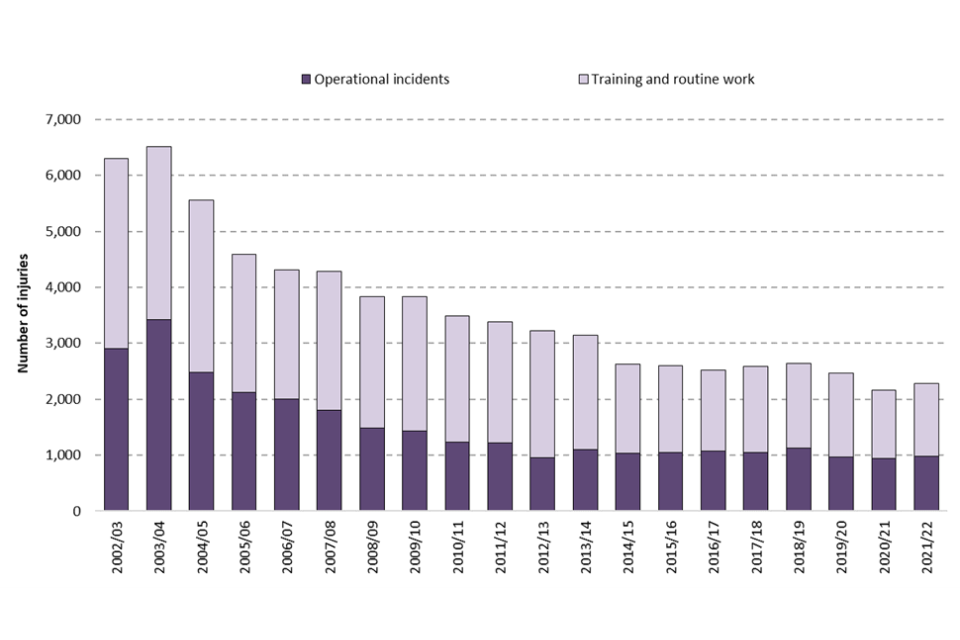
Between financial year 2003 to 2004 and financial year 2014 to 2015 the number of firefighters injured was on a downward trend, partly reflecting the reduced number of incidents attended as well as other factors. Over this time period injuries decreased in both operational incidents (-64 per cent) and training and routine activities (-53 per cent). Since financial year 2014 to 2015 the number of injuries plateaued at around 2,600 injuries per year before decreasing to 2,466 injuries in financial year 2019 to 2020 and again to 2,166 in financial year 2020 to 2021 before increasing to 2,278 in 2021 to 2022.
Figure 3.1: Total injuries to firefighters by activity type, England; financial year 2002 to 2003 to financial year 2020 to 2022

Source: FIRE0508
3.1 Injury severity
During the financial year 2021 to 2022, there were 49 injuries to firefighters that were classed as major injuries. This compared with 25 in the previous year and 130 five years ago.
Of the 44 FRSs in England, 26 reported at least one major injury in 2021 to 2022 compared with 18 in the previous year.
3.2 Injuries in operational incidents
During the financial year 2021 to 2022, there were 977 firefighter injuries sustained during operational incidents. This was a four per cent increase compared with the previous year (941), a nine per cent decrease compared with five years ago (1,071) and a twenty per cent decrease compared with ten years ago (1,220).
Of the 977 firefighter injuries that occurred during operational incidents in 2021 to 2022, 601 (62 per cent) occurred during fire incidents and 376 (38 per cent) occurred during non-fire incidents. Over the same time period, excluding fire false alarms, fires accounted for 44 per cent of incidents attended and non-fire incidents accounted for 56 per cent. Since 2019, the proportion of injuries that occurred during fires has decreased from 71 per cent to 62 per cent and the proportion that occurred during non-fire incidents has increased from 29 per cent to 38 per cent.
3.3 Firefighter fatalities
During the financial year 2021 to 2022 there were no firefighter fatalities recorded. Since 2012 to 2013 there have only been four firefighter fatalities in total (two during training/routine activities and two during operational incidents).
Further information on firefighters’ health and safety can be found in fire data tables 0508 and 0509.
4. Attacks on firefighters
This section summarises the number of incidents attended by FRSs in England involving an attack on firefighters. The statistics are sourced from the Home Office’s Incident Recording System (IRS)[footnote 14].
Key results
During the financial year 2021 to 2022:
- there were 983 incidents involving an attack on firefighters, an increase of five per cent (or an increase of 49 incidents) on the previous year
- these incidents resulted in 60 injuries to firefighters, of which 54 were classed as slight and six as serious (requiring a hospital stay)
- the majority of incidents involving an attack involved verbal abuse (60 per cent, 590 incidents)
It should be noted that the IRS does not provide a complete picture of attacks on firefighters, as it only covers incidents attended by firefighters through an emergency call. It does not cover attacks occurring on training or routine activities. In addition, it provides a count of the number of incidents that involved an attack not the number of attacks, as more than one firefighter could have been attacked at one incident. The IRS only allows one option of type of attack to be coded and FRSs record the one that best describes it, so there may be an undercount of some types of attacks, and it may be possible for verbal attacks to include an injury and vice versa.
Figure 4.1: Attacks on firefighters, England; financial year 2010 to 2011 to financial year 2021 to 2022
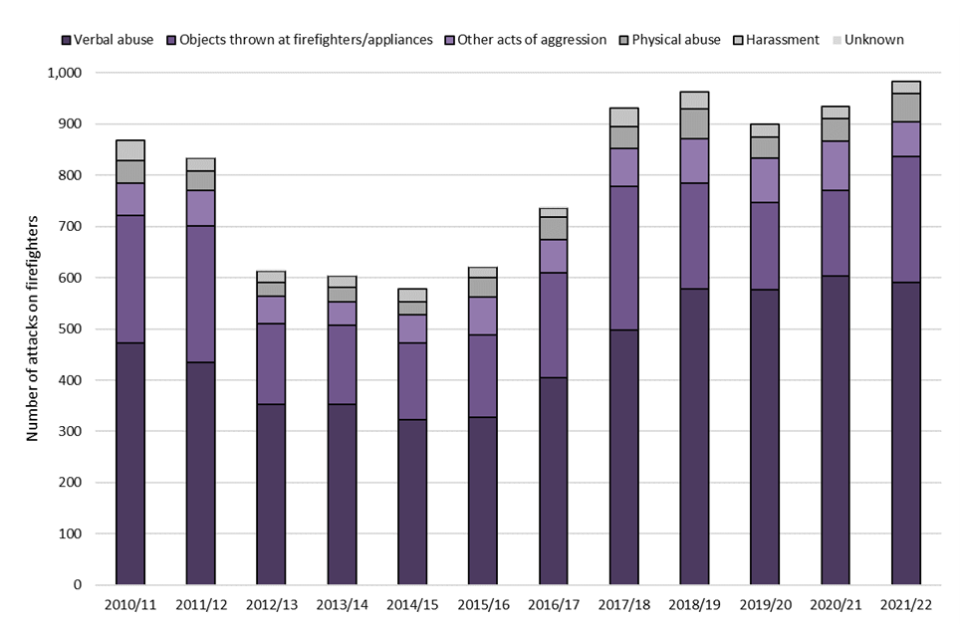
Source: FIRE0510
In 2021 to 2022, 60 per cent of incidents involving an attack involved verbal abuse (590 incidents) and 25 per cent (247 incidents) involved objects being thrown at firefighters and/or appliances. The remaining incidents involved physical abuse (six per cent, 55 incidents), harassment (two per cent, 24 incidents) and other acts of aggression (seven per cent, 67 incidents). These proportions were similar to those in previous years.
In financial year 2021 to 2022, there were 60 injuries in total from the 983 incidents that involved an attack on a firefighter, similar to the previous year (61). Of these 60 injuries, 54 were classed as slight and six were classed as serious, similar to last year (56 slight, 5 serious).
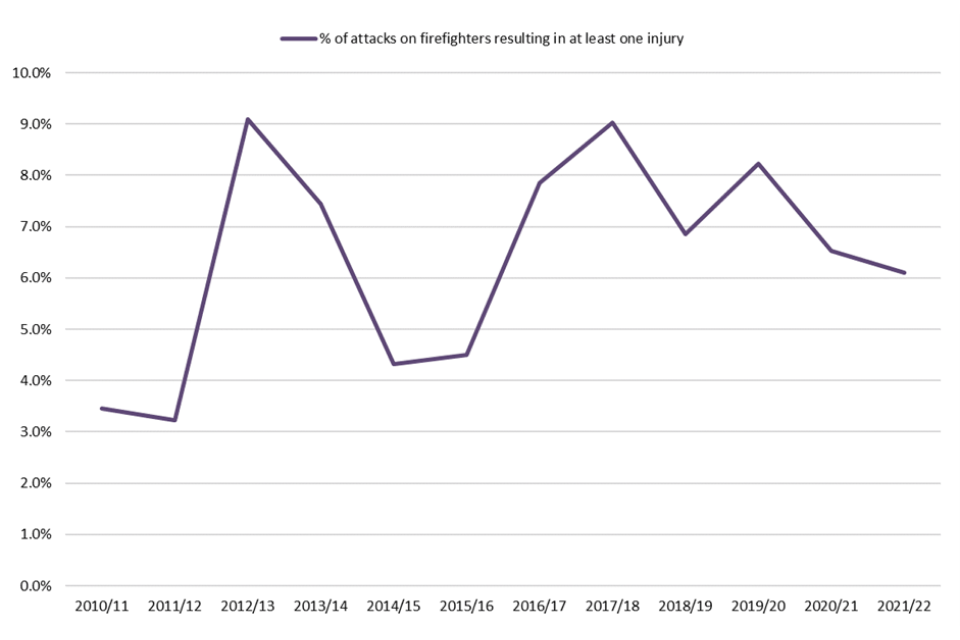
Since data became available in 2010 to 2011 the proportion of attacks on firefighters that have resulted in at least one injury has fluctuated between 3.2 per cent and 9.1 per cent. In 2021 to 2022 the proportion was 6.1 per cent, down from 6.5 per cent in the previous year and 7.8 per cent five years ago.
Figure 4.2: Percentage of attacks on firefighters that resulted in at least one injury, England, financial year 2010 to 2011 to financial year 2021 to 2022
Further information on attacks on firefighter can be found in fire data table FIRE0510.
5. Firefighters’ pensions
This section provides income, expenditure and membership data submitted by all 44 fire and rescue authorities (FRAs) in England. This includes data from 1 April 2021 to 31 March 2022. There are three pension schemes for firefighters: the 1992 Scheme, the 2006 Scheme and the 2015 Scheme.
Definitions
The 1992 Scheme Regular firefighters employed before 6 April 2006 were eligible for membership of the 1992 Scheme, which was closed to new membership on 5 April 2006.
The 2006 Scheme This scheme was introduced for regular (i.e. wholetime) and on-call (or retained) firefighters employed since 6 April 2006. A Modified Scheme was introduced in April 2014 in response to an Employment Tribunal decision in 2011 that required retained firefighters, employed during the period 1 July 2000 and 5 April 2006 inclusive, to be given access to a pension arrangement that provided similar benefits as those provided by the 1992 Scheme. The data published in this release amalgamate the 2006 and Modified Scheme membership data.
The 2015 Scheme Newly recruited regular and on-call (or retained) firefighters are now only eligible to join the 2015 Scheme, which was introduced in England on 1 April 2015.
Pensioners Those firefighters who have retired from service and are in receipt of their pension benefits.
Deferred members This category includes those firefighters who continue in employment but have elected to opt-out of their membership of the pension scheme, and those who have left their employment before reaching the age at which they are entitled to receive immediate payment of their pension benefits.
Regular firefighter members Personnel currently employed in the role of a wholetime firefighter who are members of one of the pension schemes and pay employee contributions based on the pensionable pay that they earn.
On-call / retained firefighter members Part-time personnel contracted to be available for agreed periods of time for firefighting purposes, but who may also have an alternative employment and occupational pensions elsewhere.
Full definitions available here.
Key results
During the financial year 2021 to 2022:
-
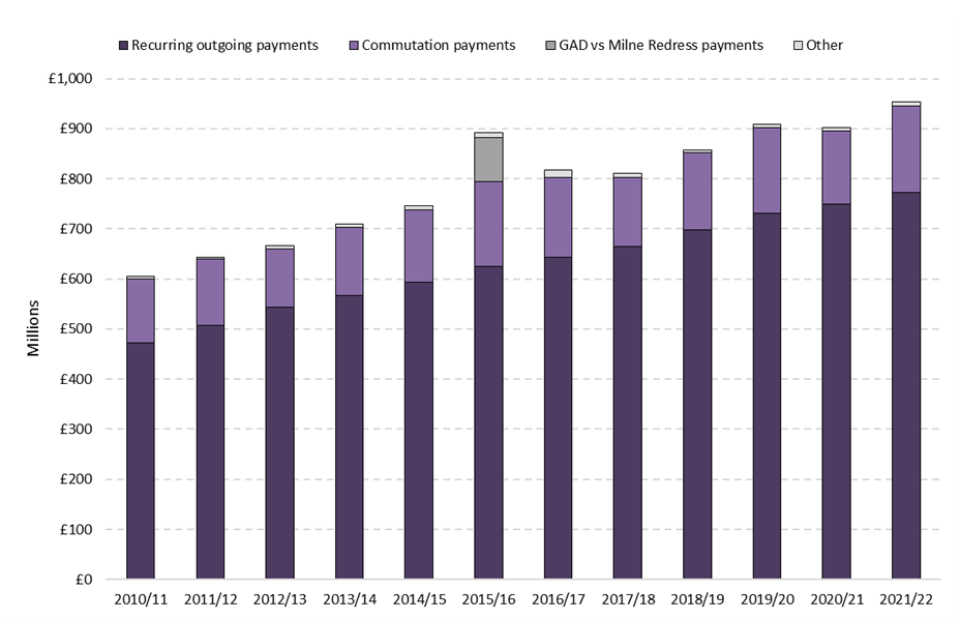
the Firefighters’ Pension Scheme total expenditure was around £954 million, a six per cent increase compared with the previous year (£903 million in financial year 2020 to 2021) and 17 per cent higher than five years previously (£818 million in financial year 2016 to 2017)
-
81 per cent of expenditure was ‘recurring outgoing payments’, 18 per cent was ‘commutation payments’, while ‘transfers’ and ‘miscellaneous expenditure’ together totalled one per cent
-
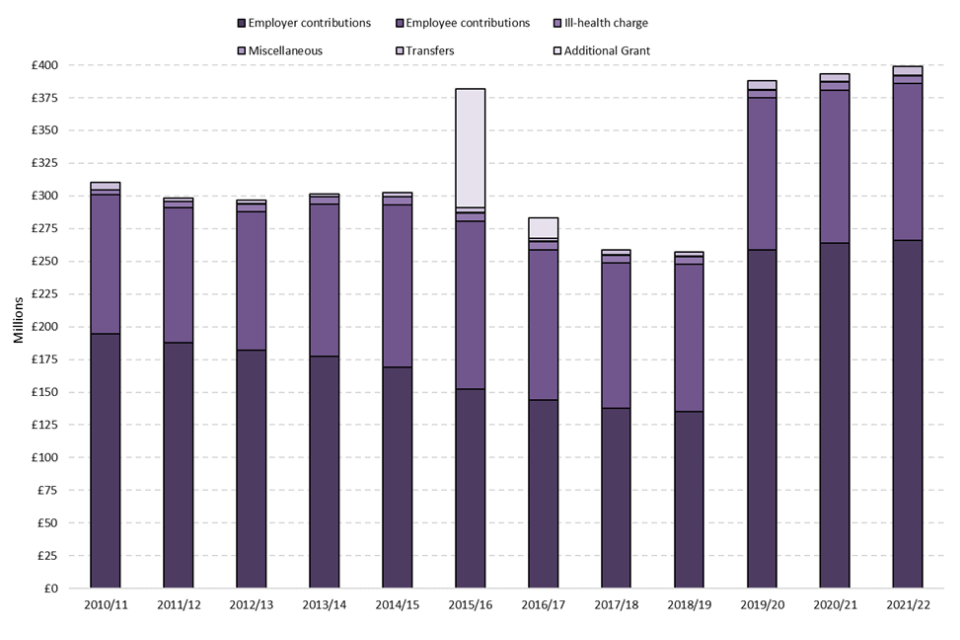
the Firefighters’ Pension Scheme total income was around £399 million, a one per cent increase compared with the previous year (£393 million in financial year 2020 to 2021) and a 41 per cent increase from five years previously (£283 million in financial year 2016 to 2017)
-
employer contributions rose one per cent to £266 million, from £264 million in financial year 2020 to 2021, and nearly double the value of £134.9 million in financial year 2018 to 2019 as a result of changes to the discount rate set by HM Treasury from April 2019
-
67 per cent of income was ‘employer contributions’, 30 per cent was ‘employee contributions’ and the remaining three per cent comprised a combination of transfers, miscellaneous income and ill-health charges
-
the Firefighters’ Pension Scheme deficit was around £556 million, a nine per cent increase compared with the previous year (£510 million in financial year 2020 to 2021) and a four per cent increase compared with five years previously (£535 million in financial year 2016 to 2017)
5.1 Pension scheme expenditure and income
Pension Scheme Expenditure The total eligible pension spend by employers in respect of their retired employees, paid directly out of their local pension fund account.
Between financial year 2010 to 2011, from when consistent and comparable data were collected, and financial year 2016 to 2017, the firefighters’ pension scheme expenditure gradually increased from around £604 million to around £818 million. The only exception to the gradual increase was caused by a large redress payment[footnote 15] of £89 million in financial year 2015 to 2016. A slight decrease in financial year 2017 to 2018 was followed by two consecutive increases to around £909 million in financial year 2019 to 2020, followed by a slight decrease in financial year 2020 to 2021 to £903 million. This has now increased to around £954 million in financial year 2021 to 2022 (Figure 5.1).
Figure 5.1: Firefighters’ pension scheme expenditure in England, financial year 2010 to 2011 to financial year 2021 to 2022
Source: FIRE1301
Pension Scheme Income The cash flow paid into the local pension fund account by an employee (member of the scheme) and employer.
The Firefighters’ pension scheme income was broadly stable from financial year 2010 to 2011, when consistent and comparable data were first collected, until financial year 2014 to 2015, at around £300 million per year. Since then, excluding the additional grant payments received by FRAs from the Government Actuary Department (GAD) following the GAD v Milne case[footnote 16] and the employee contributions holiday, income decreased gradually to a series low of £257 million in financial year 2018 to 2019. However, in financial year 2019 to 2020, income increased by 51 per cent to £387.7 million, mainly due to employer contributions nearly doubling from £135 million in financial year 2018 to 2019 to £260 million in financial year 2019 to 2020, as a result of changes to the discount rate set by HM Treasury from April 2019. For more information, see the House of Commons Library ‘Public service pensions - employer contributions’ briefing. The pension scheme income has since been followed by two consecutive increases to £393.3 million in the financial year 2020 to 2021, followed by a slight increase in 2021 to 2022 to £398.7 million (Figure 5.2).
Figure 5.2: Firefighters’ pension scheme income in England, financial year 2010 to 2011 to financial year 2021 to 2022
Source: FIRE1302
Pension Scheme Deficit The annual difference in total expenditure and total income of the Firefighters’ Pension Fund.
The Firefighters’ Pension Scheme deficit in financial year 2021 to 2022 was around £556 million, a nine per cent increase compared with the previous year (£509 million in financial year 2020 to 2021), and a three per cent increase compared with five years previously (£535 million in financial year 2016 to 2017). Between financial year 2010 to 2011 and financial year 2018 to 2019, the general trend of increasing expenditure and decreasing income led to eight consecutive annual increases in the firefighters’ pension scheme deficit. Although expenditure continued to increase in financial year 2019 to 2020, this was overtaken by the near doubling of employer contributions to the pension scheme income, leading to the first decrease in deficit in the series. This decrease continued in financial year 2020 to 2021, although at a slower rate. However, in the latest financial year (2021 to 2022), the firefighters’ pension scheme deficit increased, due to the large increase in expenditure.
Figure 5.3: Firefighters’ pension scheme total deficit in England, financial year 2010 to 2011 to financial year 2021 to 2022

Source: FIRE1303
Further information on fire pension income and expenditure can be found in fire data tables 1301, 1302 and 1303.
5.2 Pension scheme membership
The data refer to 2016 to 2022 only. This is due to a change in the way Firefighters’ Pension Fund (FPF) forms collected data on membership, which means that data are not directly comparable with previous years.
As of 31 March 2022, the total number of pensioner members was 47,240 and of these, 73 per cent (34,490) were members who have retired and were in receipt of benefits from the 1992 Scheme, down from 90 per cent on 31 March 2021. In the latest year, 20 per cent of members were in the 2015 Scheme, this was an increase from the four per cent of members who were part of the 2015 scheme in the previous year.
There were 11,569 deferred members, of which 16 per cent were still employed as a firefighter.
In financial year 2021 to 2022, there were 24,191 active regular members of firefighter pension schemes, of which 97 per cent (23,401) belonged to the 2015 Scheme. Similarly, 94 per cent of the 7,464 active retained members belonged to the 2015 Scheme. The majority of members are in the 2015 Scheme, which is due to the transition of 1992 and 2006 Scheme members to the 2015 Scheme on 1 April 2015.
Home Office is no longer collecting information on pension scheme membership opt-outs. For the most recent figures on these, please see Fire and rescue workforce and pensions statistics: England, April 2017 to March 2018.
Further information on fire pension scheme membership can be found in fire data tables 1304 and 1305 (no longer updated).
6. Further information
This release contains administrative statistics about workforce and pensions for fire and rescue services (FRSs) in England. This release also contains statistics from the Home Office’s online Incident Recording System (IRS) for incidents attended by FRSs where there were attacks on firefighters.
Fire and Rescue Incident Statistics and other Home Office statistical releases are available from the Statistics at Home Office pages on the GOV.UK website.
Data tables linked to this release and all other fire statistics releases can be found on the Home Office’s Fire statistics data tables page. The most relevant tables for each topic are signposted at the end of each section in this release.
Guidance for using these statistics and other fire statistics outputs is available on the fire statistics collection page.
The information published in this release is kept under review, taking into account the needs of users and burdens on suppliers and producers, in line with the Code of Practice for Statistics). If you have any comments, suggestions or enquiries, please contact the team via email using firestatistics@homeoffice.gov.uk.
6.1 Revisions
The figures in this release refer to activity that occurred in the financial year 2021 to 2022, the year up to and including 31 March 2022. The statistics published may not match those held locally by FRSs and revisions may occur in the future.
The analysis of attacks on firefighters, which use data from the IRS, are based on records of incidents that occurred up to and including the end of March 2022. This includes incident records that were submitted to the IRS by 29 June 2022, when a snapshot of the database was taken for the purpose of analysis. As a snapshot of the database was taken, the statistics published may not match those held locally by FRSs, and revisions may occur in future.
Due to a clerical error, on-call firefighters were omitted from the deferred pension membership figures in table FIRE1304 for the 2018-19 release.
6.2 Other related publications
Home Office publish five other statistical releases covering fire and rescue services:
-
Fire and rescue incident statistics, England provides quarterly statistics on trends in fires, casualties, false alarms and non-fire incidents attended by fire and rescue services in England, updated quarterly
-
Detailed analysis of fires attended by fire and rescue services in England focuses on fires attended by fire and rescue services across England, and fire-related fatalities and non-fatal casualties in those fires, including analyses of the causes of fires and smoke alarms ownership and operation
-
Detailed analysis of non-fire incidents attended by fire and rescue services, England focuses on non-fire incidents attended by fire and rescue services across England, including analysis on overall trends, fatalities and non-fatal casualties in non-fire incidents, and further detailed analysis of different categories of non-fire incidents
-
Detailed analysis of response times to fires, England covers statistics on trends in average response times to fires attended by fire and rescue services
-
Fire prevention and protection statistics focuses on trends in smoke alarm ownership, fire prevention and protection activities by fire and rescue services, in England
The Department for Levelling Up, Housing and Communities also publish statistical releases on fire.
These include:
-
the English housing survey: fire and fire safety report focuses on the extent to which the existence of fire and fire safety features vary by household and dwelling type
-
the English housing survey: feeling safe from fire report focuses on whether people felt safe from fire in their homes by household and dwelling type
Fire statistics are published by the other UK nations:
Scottish fire statistics and Welsh fire statistics are published based on the IRS. Fire statistics for Northern Ireland are published by the Northern Ireland Fire and Rescue Service using data from a system similar to the Incident Recording System, which means that they are not directly comparable to English, Welsh and Scottish data.
We’re always looking to improve the accessibility of our documents. If you find any problems, or have any feedback, relating to accessibility please email us at firestatistics@homeoffice.gov.uk.
-
The normal pension age under the 2015 Pension Scheme is 60. Early retirement is available in certain circumstances for those aged between 55 and 60. ↩
-
The ‘Other’ category includes the following reasons for leaving: ‘Moving to another FRS’, ‘Moving within FRS from operational (firefighter or control) to support staff’, ‘Resignation due to ill health’, ‘Resignation for any other reason’, ‘Resignation due to issues with primary employment/other work commitments’, ‘Resignation for personal reasons (including work / life balance & caring responsibilities)’, ‘Resignation due to relocation/leaving the area (including going travelling, moving country)’, ‘Compulsory redundancy’, ‘Voluntary redundancy’, ‘Dismissal for poor performance (including failure to maintain fitness)’, ‘Dismissal on disciplinary grounds’, ‘Deceased’ and ‘Unknown / Reason for leaving not recorded’. ↩
-
See the most recent Home Office Police workforce statistics here - Police workforce, England and Wales: 31 March 2022 ↩
-
The Operational Statistics data collection that underpins this release collects ethnicity information using five groups - White, Mixed, Asian or Asian British, Black or Black British and Chinese or Other Ethnicity. The other option is ‘not stated’ and these responses are excluded from calculations of proportions. ↩
-
See the most recent Office for National Statistics (ONS) England population estimates (2019) by ethnicity here - Population estimates by ethnic group, England and Wales ↩
-
See the most recent Home Office Police workforce statistics here - Police workforce, England and Wales: 31 March 2022 ↩
-
See 2021 census data by age bands here - Population and household estimates, England and Wales - Office for National Statistics ↩
-
See 2021 census data by age bands here - Population and household estimates, England and Wales - Office for National Statistics ↩
-
See the most recent Office for National Statistics (ONS) England population estimates (2019) by religion here - Population estimates by religion, England and Wales - Office for National Statistics ↩
-
See the most recent Office for National Statistics (ONS) estimates of the England population by sexual orientation here - Sexual orientation, UK - Office for National Statistics ↩
-
Further detail available here - Family Resources Survey: financial year 2020 to 2021 ↩
-
For a full definition please see the Fire Statistics Definitions Document. ↩
-
For full definitions of RIDDOR injuries, see the HSE online guidance. ↩
-
More information on the IRS can be found in the Fire Statistics Definitions Document. ↩
-
In May 2015, the Pensions Ombudsman’s findings in the case of Milne v the Government Actuary’s Department (GAD) meant that FRAs were required to pay commutation redress to affected members of the 1992 Scheme who retired between 2001 and 2006. ↩
-
For further information on the GAD v Milne case see Firefighters’ pension scheme: additional payments in respect of past commutations. ↩