Fire and rescue incident statistics, year ending March 2026
Published 22 July 2026
Applies to England

© Crown copyright 2026
This publication is licensed under the terms of the Open Government Licence v3.0 except where otherwise stated. To view this licence, visit nationalarchives.gov.uk/doc/open-government-licence/version/3 or write to the Information Policy Team, The National Archives, Kew, London TW9 4DU, or email: psi@nationalarchives.gov.uk.
Where we have identified any third party copyright information you will need to obtain permission from the copyright holders concerned.
This publication is available at https://www.gov.uk/government/statistics/fire-and-rescue-incident-statistics-year-ending-march-2026/fire-and-rescue-incident-statistics-year-ending-march-2026--2
Frequency of release: Quarterly
Forthcoming releases: Ministry of Housing, Communities and Local Government statistics release calendar
MHCLG responsible statistician: Paul Gaught-Allen
Public enquiries: firestatistics@communities.gov.uk
Media enquiries: newsdesk@communities.gov.uk
The statistics in this release inform the government, fire and rescue services (FRSs), and local authorities. The data is used to inform policy of the most relevant headline statistics, enhancing decision making by providing an overview of the most recent incident statistics and the latest trends.
This quarterly release contains statistics about incidents attended by FRSs in England for the year ending March 2026 covering as far back as comparable figures are available. Fire data were collected by the Incident Recording System (IRS) until November 2025. Since November 2025, fire data has been collected by the Fire and Rescue Data Platform (FaRDaP) and includes statistics on all incidents, fire-related fatalities, non-fatal casualties from fires and response times to fires.
Key results
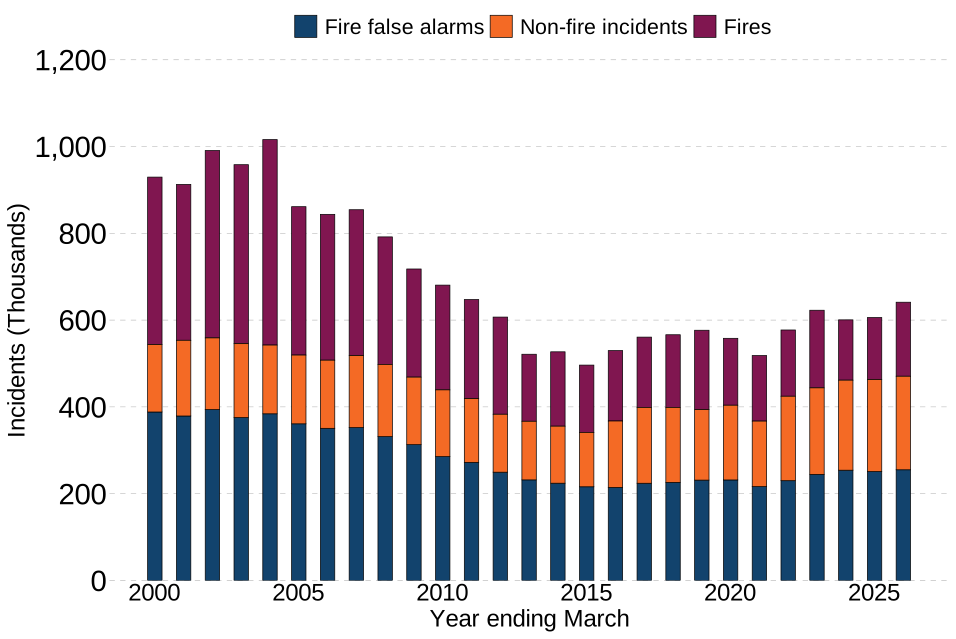
FRSs attended 641,227 incidents in the year ending March 2026, an increase of 5.8% compared with the previous year (605,936). Of these incidents, there were 170,597 fires, which was an increase of 19% compared with the previous year (143,049).
Figure KR.1: Total incidents attended by incident type, England; the year ending March 2000 to the year ending March 2026
Source: FIRE0102
Notes:
- X axis labelling is every 5 years from 2000 onwards.
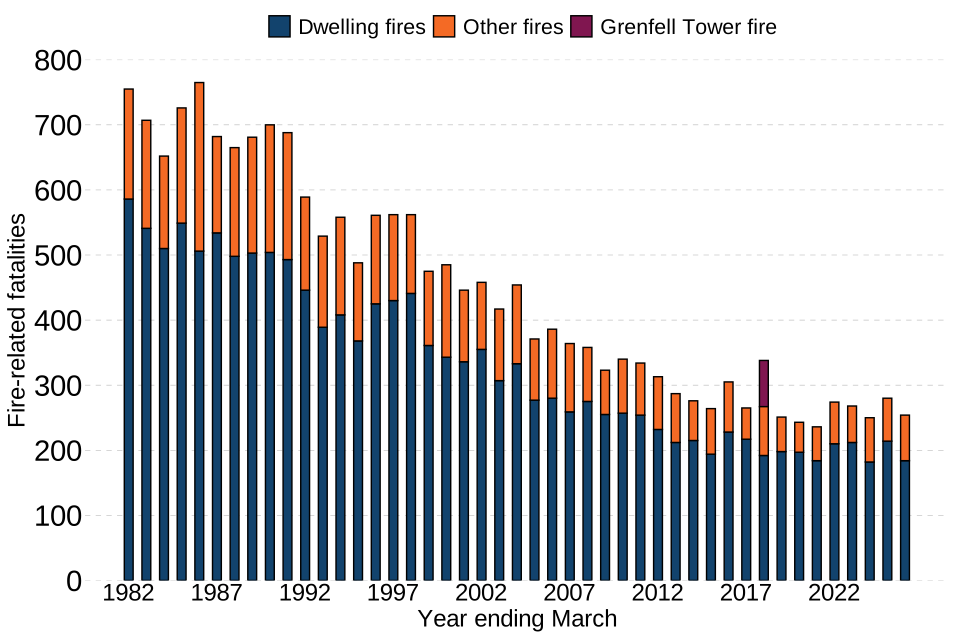
In the year ending March 2026, there were 254 fire-related fatalities in 239 fatal fires, compared with 280 fire-related fatalities in 255 fatal fires in the previous year.
Figure KR.2: Total fire-related fatalities, England; the year ending March 1982 to the year ending March 2026
Source: FIRE0502
Notes:
- X axis labelling is every 5 years from 1982 onwards.
1. Incident summary
Incidents that FRSs attend are categorised into fires, non-fire incidents and fire false alarms.
Key results
In the year ending March 2026:
- 641,227 incidents were attended by FRSs, an increase of 5.8% compared with the previous year (605,936), an increase of 24% compared with 5 years ago (518,328) and an increase of 21% compared with 10 years ago (529,733)
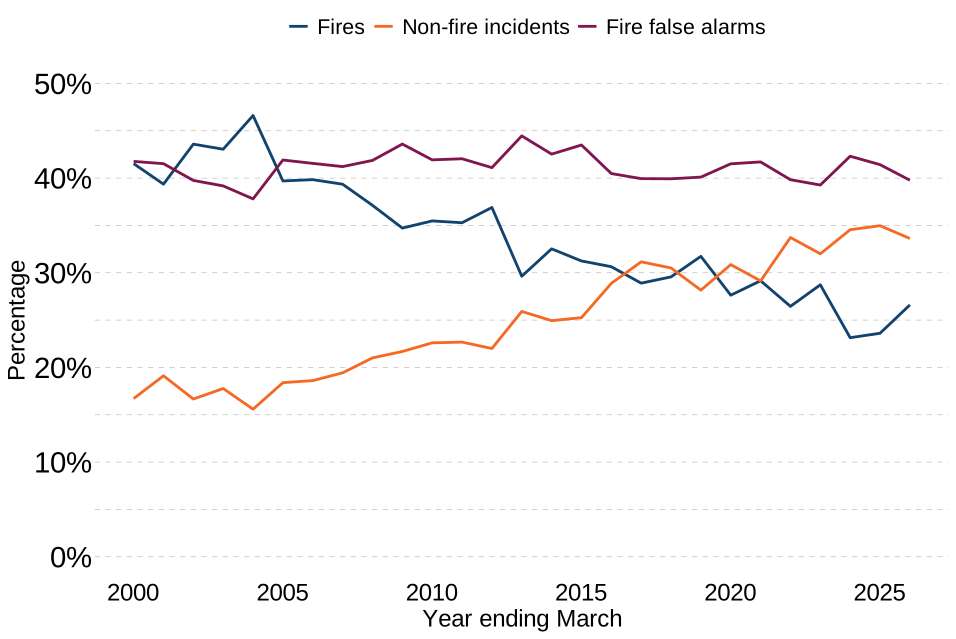
- of all incidents attended by FRSs, fires accounted for 27%, fire false alarms 40% and non-fire incidents 34%, compared with fires accounting for 31%, fire false alarms 40% and non-fire incidents 29% 10 years ago
Total incidents
As shown in figure KR.1, the total number of incidents attended by FRSs in England peaked in the year ending March 2004, at over 1 million incidents. From that point for around a decade, there was a general decline in all 3 categories of incidents attended and by the year ending March 2015 there were fewer than half a million incidents. Over the past decade, the number of incidents attended by FRSs in England has been on a gradual, if fluctuating, upward trend, from around 530,000 in the year ending March 2016, to around 641,000 in the year ending March 2026, an increase of 21% in all incidents. Despite this upward trend the number of incidents attended in recent years has been roughly two-thirds of the level seen at the start of the century.
As figure 1.1 shows, the share of incidents between incident types has changed since the beginning of the century. Over recent years, there has been an increasing share of non-fire incidents and a decreasing share of fire incidents. The increasing numbers of non-fire incidents over the past decade, including the latest financial year being the largest financial year figure since consistent data became available.
Figure 1.1: Total share of incidents attended by incident type, England; the year ending March 2000 to the year ending March 2026
Source: FIRE0102
Notes:
- Non-fire incidents include non-fire false alarms
- X axis labelling is every 5 years from 2000 onwards.
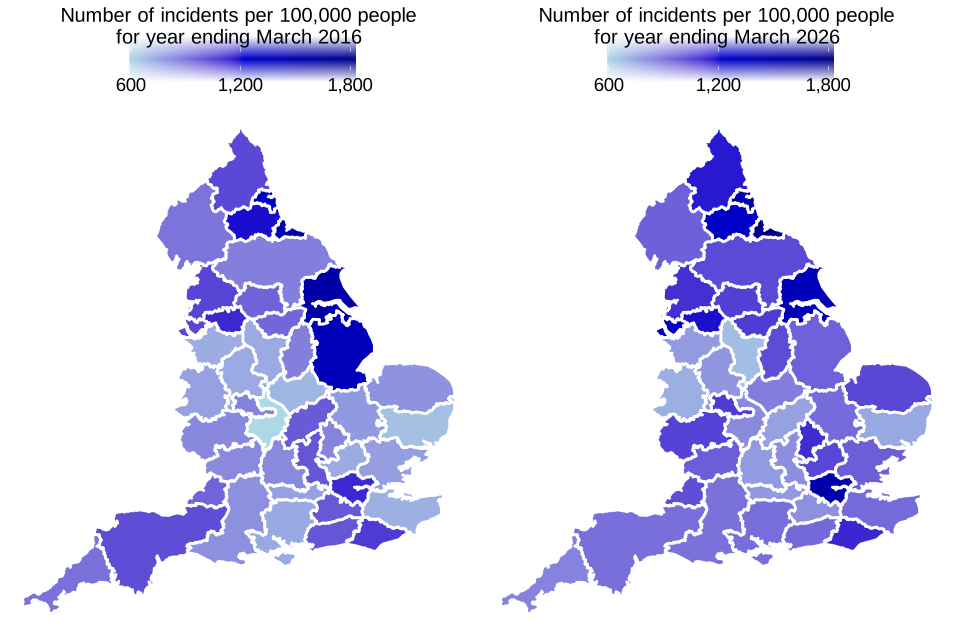
Figure 1.2 shows the changing rate of incidents per 100,000 people by FRS over the past decade.
Between year ending March 2016 and March 2026, the FRSs with both the highest and lowest rates of incidents per 100,000 people have remained broadly consistent. FRSs with the highest incident rates include the most metropolitan and urban FRSs in the north east, north west and south east of England, while those with the lowest rates cover more rural and larger areas.
The number of incidents has increased in the vast majority of FRSs, and although population has increased in all local authorities in England, incident rates have also increased in the majority over this same period, driven primarily by non-fire incidents and fire false alarms. Between the year ending March 2016 and March 2026, the largest increase in incident rates was observed in Hertfordshire, increasing by 316 incidents per 100,000 people (43.2%), while Lincolnshire experienced the largest decrease in rates, falling by 429 incidents per 100,000 people (30.7%).
Figure 1.2: Rate of total incidents per 100,000 people by FRS for year ending March 2016 and 2026
Notes:
- Colour scale does not start at 0, but at lowest value for incidents per 100,000 people, and is the same for both figures
- Between September 2024 and June 2025 Suffolk FRS could not submit all incidents due to technical reasons. Figures for Suffolk over this time period are therefore an underestimate.
For more detail on incidents attended see table FIRE0102
2. Fires attended
Fire incidents attended are broadly categorised as primary, secondary or chimney fires, depending on the location, severity and risk levels of the fire, and on the scale of response needed from FRSs to contain them.
Primary fires Those that meet at least 1 of the following criteria: (i) occurred in a (non-derelict) building, vehicle or outdoor structure (ii) involved a fatality, casualty or rescue (iii) were attended by 5 or more pumping appliances.
Secondary fires Generally small outdoor fires, not involving people or property.
Chimney fires In (non-industrial) buildings where the flame was contained within the chimney structure.
Key results
In the year ending March 2026:
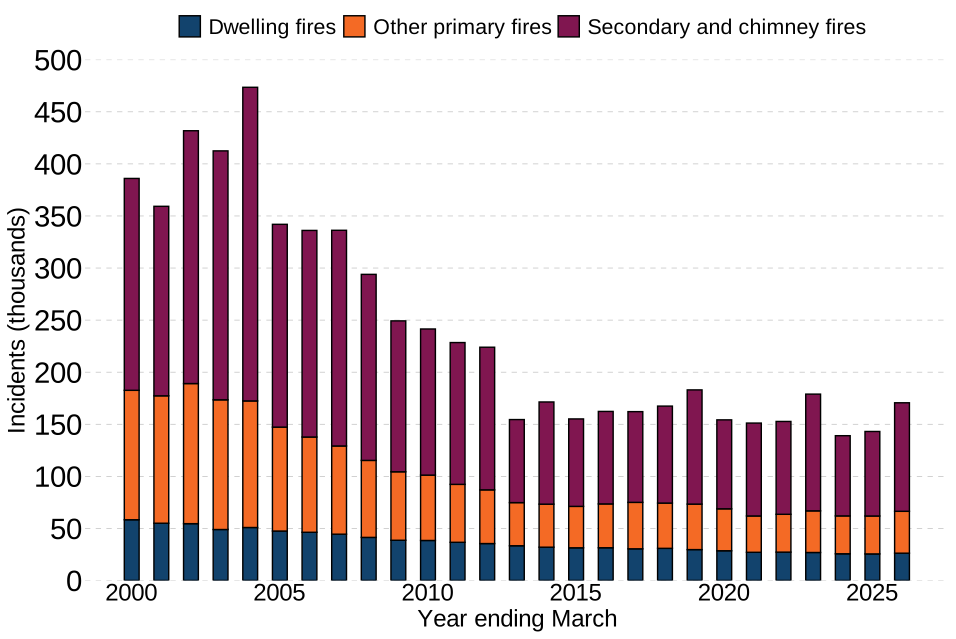
- FRSs attended 170,597 fires, which increased by 19% compared with the previous year (143,049) and increased by 5.1% compared with 10 years ago (162,301)
- there were 66,383 primary fires, an increase of 7.3% compared with the previous year (61,889), but a decrease of 9.7% compared with 10 years ago (73,495)
- there were 6,924 outdoor primary fires, an increase of 48% compared with the previous year (4,685), and an increase of 33% compared with 10 years ago (5,218)
- there were 102,549 secondary fires, an increase of 30% compared with the previous year (79,121) and an increase of 21% compared with 10 years ago (84,599)
- FRSs attended 695 fires in purpose-built high-rise (10 or more storeys) flats or maisonettes, an increase of 4.0% compared with the previous year (668)
Total fires
As shown in figure 2.1, the long-term picture shows that the total number of fires attended by FRSs decreased for around a decade falling by around two-thirds from a peak of around 474,000 in the year ending March 2004 to around 154,000 in the year ending March 2013. Over the past decade, the number of fires attended by FRSs in England has fluctuated between around 138,000 and 184,000.
The number of fires is affected by the weather. The summers of 2018, 2022 and 2025 were hot and dry, which caused high numbers of fires in those years, particularly outdoor primary and secondary fires. Figure 2.1 indicates that during the year ending March 2026 a summer spike contributed to a higher annual total of secondary fires and outdoor primary fires, with figures returning to typical seasonal levels over the winter period. The total number of fires increased by 27,548 for the year ending March 2026 compared to the previous year, with increases of 2,239 outdoor primary fires and 23,428 secondary fires making up the majority of that increase. This summer spike reflected the hot, dry summer conditions similar to those seen in summer 2022.
Figure 2.1: Total fires attended by type of fire, England; year ending March 2000 to year ending March 2026
Source: FIRE0102
Notes:
- X axis labelling is every 5 years from 2000 onwards.
Primary fires
The number of primary fires (those considered to be the most serious or with a threat to life or property) increased from around 115,000 in the year ending March 1982 to a peak of around 189,000 in the year ending March 2002. From then the number of primary fires decreased greatly to a figure of around 71,000 in the year ending March 2015. Since then the number of primary fires has decreased over the past decade.
Primary fires accounted for 39% of total fires in the year ending March 2026. This compares with 43% in the previous year, 41% 5 years ago and 45% 10 years ago. The proportion of total fires accounted for by primary fires has fluctuated year-on-year over the past decade.
There were 39,859 building fires (dwelling and other building fires) attended by FRSs in the year ending March 2026, an increase of 3.1% compared with the previous year (38,658), an increase of 2.4% compared with 5 years ago (38,942) and a decrease of 16% compared with 10 years ago (47,413).
Building fires accounted for 6.2% of all incidents, 23% of all fires and 60% of all primary fires in the year ending March 2026. Over the last 10 years this share has been steadily decreasing, from 9.0% of all incidents, 29% of all fires and 65% of all primary fires in the year ending March 2016.
For more detail on fires attended see tables FIRE0102, FIRE0201 and FIRE0205 and the detailed analysis of fires statistical release.
3. Fire false alarms
Fire false alarms are where an FRS attends a location believing there to be a fire incident but, on arrival, discovers that no such incident exists or existed. These are broadly categorised by motive into ‘due to apparatus’, ‘good intent’ and ‘malicious’.
Due to apparatus
These calls are where a fire alarm or fire-fighting equipment operate (including accidental initiation by persons) in error.
Good intent
These calls are made in good faith in the belief that the FRS really would be attending a fire.
Malicious
These false alarms are made with the intention of getting the FRS to attend a non-existent incident.
Key results
In the year ending March 2026:
- FRSs attended 255,047 fire false alarms, which increased by 1.6% compared with the previous year (250,987), increased by 18% compared with 5 years ago (216,182) and increased by 19% compared with 10 years ago (214,426)
Fire false alarms by type
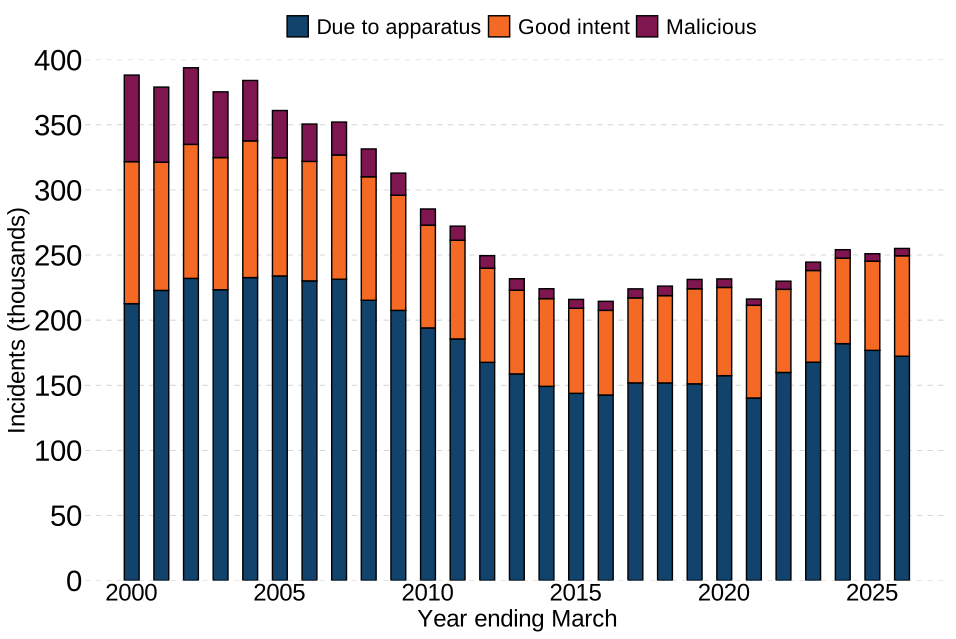
Data on the number of fire false alarms have been available in a consistent manner since the turn of the century. They reached their highest level in the year ending March 2002 (around 394,000 incidents) before falling to around 214,000 incidents in year ending March 2016. Since then with the exception of a period of decreases around the COVID-19 pandemic, there was a gradual increase in fire false alarms to around 255,000 in the year ending March 2026. Recent years have showed high figures relative to the previous decade but around three-fifths of the level seen at the start of the century.
Figure 3.1: Total fire false alarms by type of false alarm, England; year ending March 2000 to year ending March 2026
Source: FIRE0102
Notes:
- X axis labelling is every 5 years from 2000 onwards.
Figure 3.1 shows the type of fire false alarm incidents by year. In the year ending March 2026, there were:
- 172,247 fire false alarms due to apparatus, a decrease of 2.6% from the previous year (176,757), an increase of 23% from 5 years previously (140,171) and an increase of 21% from 10 years previously (142,442)
- 77,181 fire false alarms due to good intent, an increase of 13% from the previous year (68,493), an increase of 8.4% from 5 years previously (71,198) and an increase of 19% from 10 years previously (65,039)
- 5,619 malicious fire false alarms, a decrease of 2.1% compared with the previous year (5,737), an increase of 17% from 5 years previously (4,813) and a decrease of 19% from 10 years previously (6,945)
For more detail on fire false alarms see tables FIRE0102 and FIRE0104
4. Non-fire incidents attended
FRSs attend many types of incidents that are not fires or fire false alarms. These are known as non-fire incidents or special service incidents. Examples include flooding incidents, responding to Road Traffic Collisions (RTCs), animal assistance and collaboration incidents such as effecting entry or exit and assisting other agencies (a complete list can be found in fire data table FIRE0901).
Key results
In the year ending March 2026:
- FRSs attended 215,583 non-fire incidents, the largest financial year figure since consistent data became available
- non-fire incidents increased by 1.7% compared with the previous year (211,900), increased by 43% compared with 5 years ago (151,031) and increased by 41% compared with 10 years ago (153,006)
Types of non-fire incidents
The presentation of non-fire incidents has been updated in recent releases to improve clarity and interpretation for users. This brings together non-fire incident types into a smaller number of groupings based on existing FaRDaP categories. These changes have been applied retroactively and do not reflect any changes to underlying definitions, recording practices or data coverage. No new incident categories have been introduced.
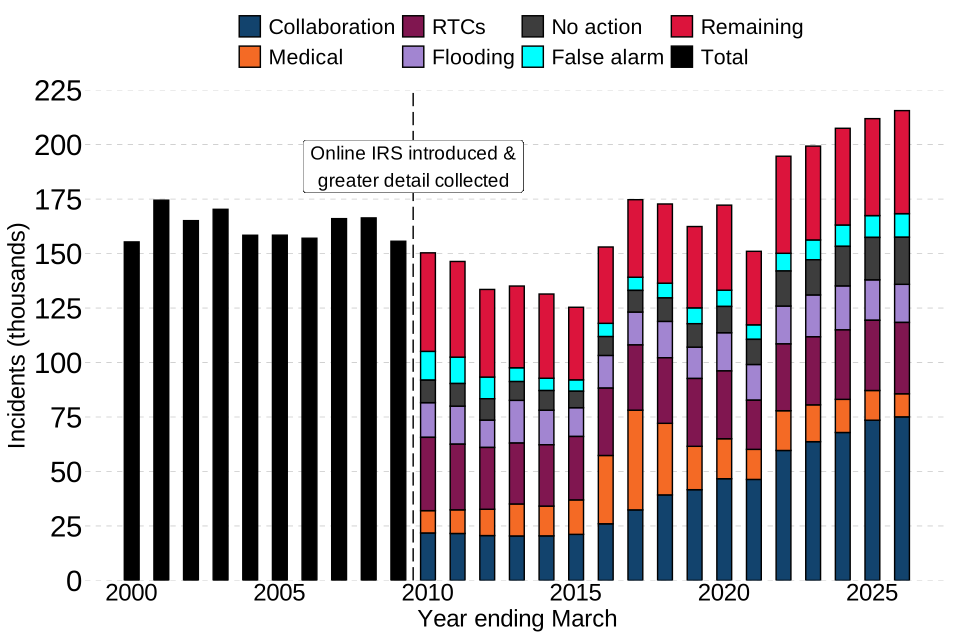
As shown in figure 4.1, there was a general decline in the number of non-fire incidents attended between the year ending March 2008 and the year ending March 2015. Over the last decade there has been a gradual increase in the number of non‑fire incidents, although this trend has been accompanied by year‑to‑year fluctuations and differing stories for different non-fire groups.
Collaboration incidents
Collaboration incidents include 3 FaRDaP categories ‘Assisting other agencies’, ‘Effecting entry or exit’ and ‘Suicide or suicide attempts’. The number of collaboration incidents has more than trebled from 21,146 in the year ending March 2015 to 75,060 in the year ending March 2026. This is the highest rolling year figure since the implementation of the online IRS in 2010. These increases started with the introduction of the duty to collaborate legislation in the second half of the 2010s but has continued into the 2020s. 10 years ago these collaboration incidents accounted for 17% of non-fire incidents, in the year ending March 2026 this figure was 35%. The largest category of collaboration incidents is ‘effecting entry or exit’, which made up 41,130 incidents in the year ending March 2026 (an increase of 3.1% compared with the previous year).
Medical incidents
Medical incidents include ‘First responder’ and ‘Co-responder’ FaRDaP categories. Medical incidents peaked in the year ending March 2017 (45,761), during the EMR (Emergency Medical Responding) trials. This increase was temporary, with the number of medical incidents decreasing to 13,807 in the year ending March 2021 and then 10,602 in the year ending March 2026. Medical incidents accounted for 4.9% of non-fire incidents, a decrease from 6.4% in the previous year and from 9.1% 5 years ago.
Road Traffic Collisions
Road Traffic Collisions (RTCs) generally increased from 30,901 in the year ending March 2016 to around 31,119 in the year ending March 2019, before falling during the COVID-19 period to around 22,545 in the year ending March 2021. Since then, the number of RTCs has increased, reaching 32,713 in the year ending March 2026. The percentage of non-fire incidents that RTCs accounted for has, with the exception of the time around COVID-19 lockdowns, has been relatively stable with 15% in the year ending March 2026, aligning with the previous year and 5 years ago (both 15%).
Flooding and rescue or evacuation from water incidents
Flooding and rescue or evacuation from water incidents include ‘Flooding’ and ‘Rescue or evacuation from water incidents’ FaRDaP categories. The long‑term trend shows a higher number of these incidents attended by FRSs compared with a decade ago, with 17,502 incidents in the year ending March 2026 compared to 15,007 incidents in the year ending March 2016. The largest portion of those 17,502 incidents in the year ending March 2026 were in the ‘flooding’ category (15,920) with a far smaller portion (1,582) in the ‘rescue or evacuation from water incidents’ category.
No action, false alarm and remaining incidents
The number of no action/advice[footnote 1] incidents has shown a large increase over the past decade, from 8,647 10 years ago, to 11,531 5 years ago, and 21,587 in the year ending March 2026. Over the last decade, the number of non-fire false alarm incidents[footnote 2] has increased by 4,752 incidents (an increase of 78%). Over the past 10 years, the number of ‘remaining’ non-fire incidents[footnote 3] has increased from 35,025 to 47,278 in the year ending March 2026, an increase of 35%. The largest category in this group is ‘lift release’, with 13,760 incidents in in the year ending March 2026.
Figure 4.1: Total non-fire incidents attended by FRSs, England; year ending March 2000 to year ending March 2026
Source: FIRE0901
Notes
- X axis labelling is every 5 years from 2000 onwards.
For more detail on non-fire incidents see tables FIRE0901 and FIRE0902 and the non-fire statistical release.
5. Fire-related fatalities and casualties
Fire-related fatalities Those that would not have otherwise occurred had there not been a fire. For the statistical releases, a fire-related fatality includes those that were recorded as ‘don’t know’.
Non-fatal casualties Those resulting from a fire, whether the injury was caused by the fire or not.
Fatal fires Those resulting in at least 1 fatality that would not have otherwise occurred had there not been a fire.
As the FaRDaP is a continually updated database, the statistics published in this release may not match those held locally by FRSs, and revisions may occur in the future (see the revisions section for further detail). This may be particularly relevant for fire-related fatalities, where a coroner’s report could lead to revisions in the data sometime after the incident. It should also be noted that the numbers of fire-related fatalities are prone to year-on-year fluctuations due to the relatively small numbers.
Key results
In the year ending March 2026:
- there were 254 fire-related fatalities compared with 280 in the previous year (a decrease of 9.3%)
- there were 184 fire-related fatalities in dwelling fires, compared with 214 in the previous year (a decrease of 14%)
- there were 2 fatal fires resulting in a total of 2 fire-related fatalities in purpose-built high-rise flats (10 or more storeys) or maisonettes, compared to 1 fatal fire with 1 fire-related fatality in the previous year
- there were 6,848 non-fatal casualties[footnote 4], an increase of 6.2% compared with the 6,449 in the previous year
- there were 2,998 non-fatal casualties requiring hospital treatment, an increase of 5.7% compared with the 2,835 in the previous year
Fire-related fatalities
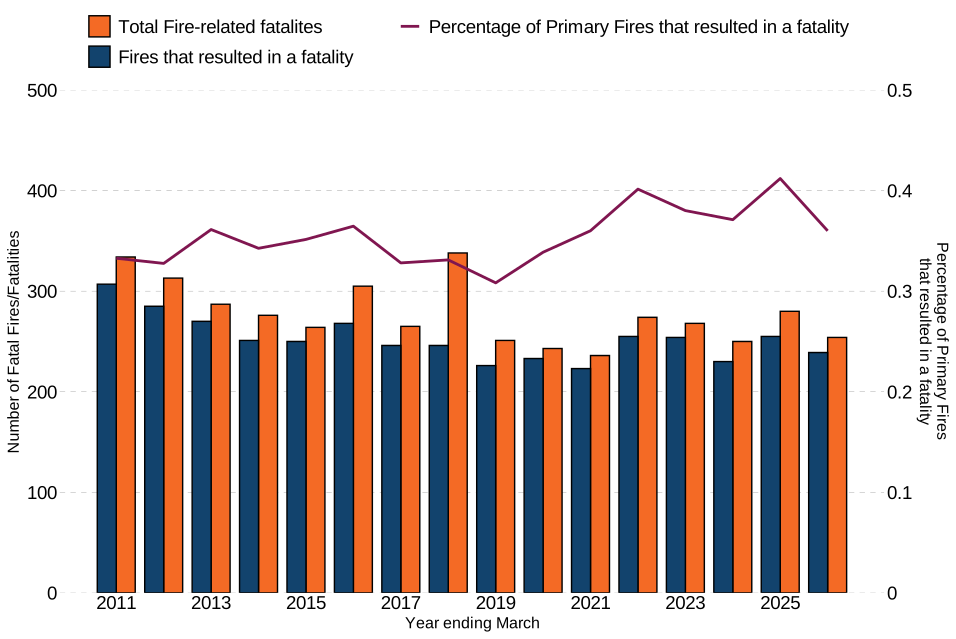
As shown in figure KR.2 and figure 5.1, the number of fire-related fatalities in England followed a general downward trend between the year ending March 1982, when comparable figures first became available, and the year ending March 2015. Over the past decade the number of fire-related fatalities have fluctuated year-on-year. There were notable increases in the year ending March 2016 (305)[footnote 5] and the year ending March 2018 (338) - the latter of which included 71 fatalities as a result of the Grenfell Tower fire[footnote 6].
Some quarters have shown high numbers of fire-related fatalities over the past few years, resulting in some relatively high rolling year figures since the turn of the decade. The number of fire-related fatalities, 52, in the most recent quarter (January to March 2026) compares to 81, 48 and 73 in the previous 3 quarters of the year ending March 2026. It should be noted that the number of fire-related fatalities, whether annual or quarterly, are prone to fluctuations due to relatively small numbers.
Fire-related fatalities in dwelling fires were the largest category, accounting for 72% of fire-related fatalities in the year ending March 2026. During this year, there were 184 fire-related fatalities in dwelling fires, a decrease of 14% compared with 214 in the previous year.
As shown in figure 5.1, the percentage of primary fires that resulted in a fatality has ranged between 0.3% and just over 0.4% over the past 10 years. With the exception of the year ending March 2018, the ratio of fire-related fatalities and fires that resulted in at least 1 fatality has been relatively stable over the same period. There were 254 fire-related fatalities in the year ending March 2026, from 239 fires that resulted in at least 1 fatality (0.36% of primary fires).
Figure 5.1: Total fire-related fatalities, primary fires that resulted in a fatality and the percentage of primary fires that resulted in a fatality England; year ending March 2011 to year ending March 2026
Source: FIRE0502
Notes:
- Fire-related fatalities are those that would not have otherwise occurred had there not been a fire. Those where the role of fire was ‘not known’ are included in ‘fire-related’.
- X axis labelling is every other year from 2011 onwards.
Fatalities in high-rise flats and maisonettes
In the year ending March 2026, FRSs attended 695 fires in purpose-built high-rise (10 or more storeys) flats or maisonettes, an increase of 4.0% compared with the previous year (668), a decrease of 5.4% compared with 5 years ago (735) and a decrease of 11% compared with 10 years ago (784).
Over the 5-year period ending in March 2026, FRSs attended 3,584 fires in purpose-built high-rise (10 or more storeys) flats or maisonettes, which resulted in 10 fatal fires and 10 fire-related fatalities. This compared to 3,885 fires, resulting in 19 fatal fires and 91 fire-related fatalities in the 5-year period ending in March 2021 (note that this 5-year span included the Grenfell Tower Fire).
Non-fatal casualties
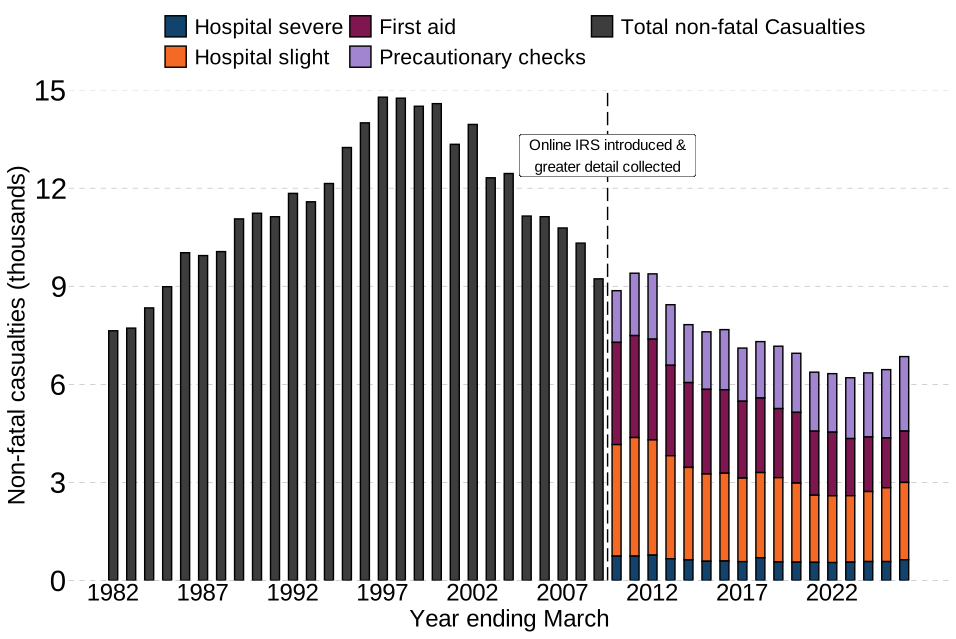
The number of non-fatal casualties in fires in England has been on a downward trend since the mid-1990s. More detailed data became available in 2009, due to the introduction of the online IRS, with the ‘hospital slight’ and ‘first aid’ categories showing the biggest decline over this time.
In the year ending March 2026, there were 6,848 non-fatal casualties, an increase of 6.2% compared with the previous year (6,449). The 4 sub-categories were as follows:
- 632 hospital severe casualties, an increase of 9.5% compared with the previous year
- 2,366 hospital slight casualties, an increase of 4.8% compared with the previous year
- 1,570 first aid casualties, an increase of 3.1% compared with the previous year
- 2,280 precautionary check casualties, an increase of 9.0% compared with the previous year
Figure 5.2: Total non-fatal casualties in fires by injury severity, England; year ending March 1982 to year ending March 2026
Source: FIRE0502
Notes:
- These figures are for all non-fatal casualties in fires, whether the fire caused the casualty or not.
- X axis labelling is every 5 years from 1982 onwards.
For more detail on fire-related fatalities and casualties see tables FIRE0501 and FIRE0502
6. Response times to fire incidents
Table FIRE1001 is published alongside this release and shows greater detail than this commentary, for example, breakdowns by time components. Full commentary and further tables can be found in detailed analysis of fire incidents and response times.
Key results
In the year ending March 2026:
- the average total response time to primary fires[footnote 7] in England was 9 minutes and 25 seconds, an increase of 19 seconds on the previous year
- the average total response time to secondary fires[footnote 8] in England was 9 minutes and 58 seconds, an increase of 36 seconds on the previous year
Response times to fire incidents
Total response time Defined as the minutes and seconds elapsed from the time of call to the arrival of the first vehicle at the incident.
The following incidents are not included in response time totals:
a. Road vehicle fires, where the road vehicle was abandoned.
b. Where the location of the fire was a derelict property.
c. Where an FRS learned of the fire when it was known to have already been extinguished (known as ‘late calls’).
d. Where the total response time for an incident was over an hour or less than 1 minute (to avoid erroneous data or exceptional incidents from skewing the averages).
e. Where the sequence of events (time of call - mobilisation - vehicle mobile - arrival at scene) in an incident is not recorded in a logical sequence, either through recording error (for example a vehicle appears to have arrived before it left) or absence of data (null values).
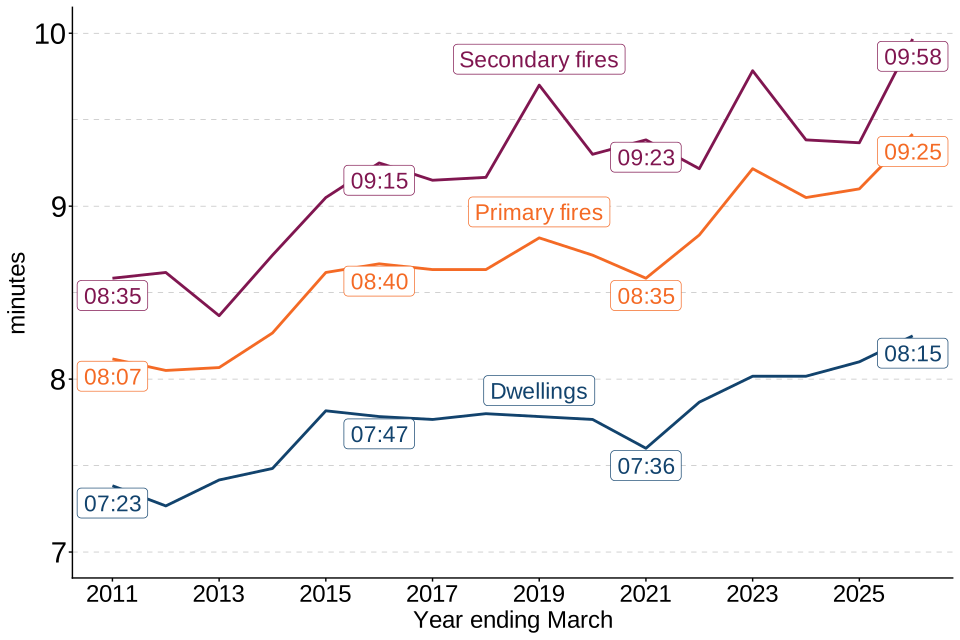
As shown in figure 6.1, response times to fires have increased gradually over the past decade. There was an increase in the average response time to primary fires in the year ending March 2020, which may reflect operational pressures associated with the COVID-19 pandemic. In addition to this gradual upward trend, there were spikes in the year ending March 2019, March 2023 and March 2026, particularly in response times to secondary fires, corresponding to the summers of 2018, 2022 and 2025 respectively.
Figure 6.1: Average total response times (minutes) by type of fire, England; year ending March 2011 to year ending March 2026
Source: FIRE1001
Notes:
- Y-axis is from 7 to 10 minutes.
- X axis labelling is every other year from 2011 onwards.
All primary fires
The average response time to primary fires was 9 minutes and 25 seconds, in the year ending March 2026. This was:
- an increase of 19 seconds compared with the previous year (9 minutes and 6 seconds)
- an increase of 50 seconds compared with 5 years ago (8 minutes and 35 seconds)
- an increase of 45 seconds compared with 10 years ago (8 minutes and 40 seconds)
Dwelling fires
The average response time to dwelling fires was 8 minutes and 15 seconds, in the year ending March 2026. This was:
- an increase of 9 seconds compared with the previous year (8 minutes and 6 seconds)
- an increase of 39 seconds compared with 5 years ago (7 minutes and 36 seconds)
- an increase of 28 seconds compared with 10 years ago (7 minutes and 47 seconds)
Primary outdoor fires
The average response time to other outdoor fires was 12 minutes and 10 seconds, in the year ending March 2026. This was:
- an increase of 1 minute 0 seconds compared with the previous year (11 minutes and 10 seconds)
- an increase of 1 minute 2 seconds compared with 5 years ago (11 minutes and 8 seconds)
- an increase of 1 minute 12 seconds compared with 10 years ago (10 minutes and 58 seconds)
It should be noted that other outdoor fires are numerically the smallest of the main primary fire types, accounting for 10% of primary fires in the year ending March 2026. The small number of primary outdoor fires means that the response times are prone to fluctuation, which can impact year-on-year comparisons. These incidents increased by 48% from the previous year.
Secondary fires
The average response time to secondary fires was 9 minutes and 58 seconds, in the year ending March 2026. This was:
- an increase of 36 seconds compared with the previous year (9 minutes and 22 seconds)
- an increase of 35 seconds compared with 5 years ago (9 minutes and 23 seconds)
- an increase of 43 seconds compared with 10 years ago (9 minutes and 15 seconds)
The increase in the average response time to secondary fires might reflect the increase in the number of these incidents attended compared with the previous year.
For more detail on response times to fire incidents see table FIRE1001 and the detailed analysis of fires statistical release.
7. Summary of changes over time
Table 7.1: Number of incidents, comparing the year ending March 2026 with 1, 5 and 10 years previously
| Incident Type | Year ending March 2026 | Year ending March 2025 | One year change | Year ending March 2021 | Five year change | Year ending March 2016 | Ten year change |
|---|---|---|---|---|---|---|---|
| All incidents | 641,227 | 605,936 | 5.8% | 518,328 | 24% | 529,733 | 21% |
| Fires | 170,597 | 143,049 | 19% | 151,115 | 13% | 162,301 | 5.1% |
| Primary fires | 66,383 | 61,889 | 7.3% | 61,924 | 7.2% | 73,495 | -9.7% |
| Dwelling fires | 26,180 | 25,465 | 2.8% | 27,018 | -3.1% | 31,385 | -17% |
| Accidental dwelling fires | 23,795 | 22,996 | 3.5% | 24,287 | -2.0% | 28,367 | -16% |
| Other building fires | 13,679 | 13,193 | 3.7% | 11,924 | 15% | 16,028 | -15% |
| Road vehicle fires | 19,600 | 18,546 | 5.7% | 17,525 | 12% | 20,864 | -6.1% |
| Outdoor primary fires | 6,924 | 4,685 | 48% | 5,457 | 27% | 5,218 | 33% |
| Secondary fires | 102,549 | 79,121 | 30% | 86,086 | 19% | 84,599 | 21% |
| Fire false alarms | 255,047 | 250,987 | 1.6% | 216,182 | 18% | 214,426 | 19% |
| Non-fire incidents | 215,583 | 211,900 | 1.7% | 151,031 | 43% | 153,006 | 41% |
Table 7.2: Number of fire-related fatalities and non-fatal casualties, comparing the year ending March 2026 with 1, 5 and 10 years previously
| Fatal fires, fatalities and non-fatal casualties | Year ending March 2026 | Year ending March 2025 | One year change | Year ending March 2021 | Five year change | Year ending March 2016 | Ten year change |
|---|---|---|---|---|---|---|---|
| Fatal fires | 239 | 255 | -6.3% | 223 | 7.2% | 268 | -11% |
| Fire-related fatalities | 254 | 280 | -9.3% | 236 | 7.6% | 305 | -17% |
| Fire-related fatalities in dwellings | 184 | 214 | -14% | 184 | 0.0% | 228 | -19% |
| Non-fatal casualties | 6,848 | 6,449 | 6.2% | 6,371 | 7.5% | 7,673 | -11% |
| Non-fatal casualties requiring hospital treatment | 2,998 | 2,835 | 5.7% | 2,607 | 15% | 3,280 | -8.6% |
| Non-fatal casualties in dwellings | 4,898 | 4,714 | 3.9% | 4,894 | 0.1% | 5,772 | -15% |
Table 7.3: Average response times, comparing the year ending March 2026 with 1, 5 and 10 years previously
| Type of Fire | Year ending March 2026 | Year ending March 2025 | One year change | Year ending March 2021 | Five year change | Year ending March 2016 | Ten year change |
|---|---|---|---|---|---|---|---|
| Primary fires | 9m 25s | 9m 06s | +19s | 8m 35s | +50s | 8m 40s | +45s |
| Dwellings | 8m 15s | 8m 06s | +9s | 7m 36s | +39s | 7m 47s | +28s |
| Other buildings | 9m 12s | 9m 03s | +9s | 8m 36s | +36s | 8m 26s | +46s |
| Other outdoors | 12m 10s | 11m 10s | +1m 0s | 11m 08s | +1m 2s | 10m 58s | +1m 12s |
| Road vehicles | 10m 19s | 10m 12s | +7s | 9m 27s | +52s | 9m 48s | +31s |
| Secondary fires | 9m 58s | 9m 22s | +36s | 9m 23s | +35s | 9m 15s | +43s |
Source: Fire statistics data tables
8. Further information
Fire Statistics tables, guidance and statistical releases
Fire and rescue incident statistics and other MHCLG statistical releases are available via the Ministry of Housing, Communities and Local Government statistics release calendar pages on the GOV.UK website.
Fire Statistics publish 4 other statistical releases covering fire and rescue services.
These include:
- Detailed analysis of fires and response times attended by fire and rescue services in England: focuses on fires attended by fire and rescue services across England, fire-related fatalities and non-fatal casualties in those fires; including analyses of the causes of fires, smoke alarm ownership and operation, average response times to fires attended by fire and rescue services
- Detailed analysis of non-fire incidents attended by fire and rescue services, England: focuses on non-fire incidents attended by fire and rescue services across England, including analysis on overall trends, fatalities and non-fatal casualties in non-fire incidents, and further detailed analysis of different categories of non-fire incidents
- Fire workforce and pension statistics: Information on total workforce, the diversity of the workforce, staff leaving and joining, firefighter injuries, attacks on firefighters, firefighters’ pensions
- Fire prevention and protection statistics, England: focuses on trends in smoke alarm ownership, fire prevention and protection activities by fire and rescue services
Data tables linked to this release and all other fire statistics releases can be found on MHCLG’s Fire statistics data tables page.
Guidance for using these statistics and other fire statistics outputs, including a Quality Report, is available on the fire statistics guidance page.
All fire-related Ministerial responsibilities moved from the Home Office to the Ministry of Housing, Communities and Local Government (MHCLG) on 1 April 2025. This change followed a recommendation from the Phase 2 report of the Grenfell Tower Inquiry, to bring all fire safety functions under one department. Therefore, as part of this move, all statistical publications and analysis on fire functions were also subject to the Machinery of Government (MoG) change.
Other related publications
The Ministry of Housing, Communities and Local Government (MHCLG) also publish statistical releases on fire.
These include:
- the English Housing Survey: fire and fire safety report focuses on the extent to which the existence of fire and fire safety features vary by household and dwelling type and this report focuses on whether people felt safe from fire in their homes by household and dwelling type
Fire statistics are published by the other UK nations:
Scottish fire statistics and Welsh fire statistics are published based on the FaRDaP Fire statistics for Northern Ireland are published by the Northern Ireland Fire and Rescue Service using data from a system similar to the FaRDaP, which means that it is not directly comparable to English, Welsh and Scottish data.
Fire and Rescue Data Platform (FaRDaP) data collection system
This release contains statistics on incidents attended by fire and rescue services (FRSs) in England. Incident data was collected through the Incident Recording System (IRS) until November 2025. Since then, the statistics have been sourced from the Fire and Rescue Data Platform (FaRDaP).
FaRDaP allows FRSs to complete an incident record for every incident attended, including fires, false alarms and non-fire incidents (also known as special service incidents).
From autumn/winter 2026, FRSs will begin transitioning to FaRDaP v2. The new version includes additional questions, amendments to existing questions, and new response options for some existing questions. For example, a new response option of “air fryer” has been added to the question on sources of ignition.
We intend to publish statistics derived from some of these new data items from autumn/winter 2027 onwards. The scope and timing of these publications will depend on the rate at which FRSs transition to FaRDaP v2 and the quality and completeness of the data collected through the new and amended questions.
Revisions
FaRDaP is a continually updated database, with FRSs adding incidents daily. The figures in this release refer to records of incidents that occurred up to and including the end of March 2026. This includes incident records that were submitted to FaRDaP by 12 May 2026, when a snapshot of the database was taken for the purpose of analysis. As a snapshot of the data set was taken on 12 May 2026, the statistics published may not match those held locally by FRSs and revisions may occur in the future. This is particularly the case for statistics with relatively small numbers, such as fire-related fatalities. For instance, this can occur because coroner’s reports may mean the initial view taken by the FRS will need to be revised; this can take many months, even years, to do so.
Between September 2024 and June 2025 Suffolk FRS could not submit all incidents due to technical reasons. Figures for Suffolk over this time period are therefore an underestimate.
Accredited official statistics status
Following the National Statistics designation review by the Office for Statistics Regulation the term “Accredited Official Statistics” was introduced to describe National Statistics in September 2023. This release was formerly badged as “National Statistics” and should now be considered “Accredited Official Statistics”. National Statistics is the legal term set out in the Statistics and Registration Service Act 2007 for “Accredited Official Statistics” that have been judged by the Office for Statistics Regulation (OSR)[footnote 9], to comply with the Code of Practice for Statistics (“the Code”). This means these statistics meet the standards of trustworthiness, quality and value as set out in “the Code”. Further information about accredited official statistics can be found on the OSR’s website.
The information published in this release is kept under review, taking into account the needs of users and burdens on suppliers and producers, in line with the Code of Practice for Statistics. The Office for Statistics Regulation carried out a compliance check in 2021 of the fire and rescue incident statistics against the Code of Practice, this was conducted when fire policy was under Ministerial responsibility of the Home Office. The results can be found in a letter to the Head of Profession published on the OSR website.
If you have any comments, suggestions or enquiries, please contact the team via email using firestatistics@communities.gov.uk.
Percentages greater than or equal to 10% have been rounded to the nearest whole number. The term ‘virtually unchanged’ is used in relation to percentage changes of less than 0.5%.
A rolling year in this release is any period of 4 quarters in a row, so either 1 January to 31 December, 1 April to 31 March, 1 July to 30 June or 1 October to 30 September.
-
The no action/advice group consists of the three FARDAP categories ‘No action (not false alarm)’, ‘advice only’ and ‘stand by’. These occur when an FRS is mobilised in response to a non‑fire emergency call but when crews arrive no action was required, but it was at the time of the call (i.e. the incident was dealt with by someone else). ↩
-
The false alarm group comprises 2 FARDAP categories, malicious and good intent non-fire false alarms. These occur when an FRS is mobilised in response to a non‑fire emergency call but when crews arrive no action was ever required. ↩
-
The remaining non-fire incidents group comprises 10 relatively small FARDAP categories. ↩
-
For more detailed technical definitions of fire-related and non-fatal casualties, see the Fire statistics definitions document. A further breakdown of the different types of non-fatal casualties is available in the published fire data tables. ↩
-
For more information on the number of fire related fatalities in the year ending March 2016, see the Fire statistics monitor: April 2015 to March 2016. ↩
-
For more information on the Grenfell Tower fire and how the associated fire-related fatalities figures are recorded, see the Fire statistics definitions document. ↩
-
Primary fires are those that meet at least 1 of the following criteria - occurred in a (non-derelict) building, vehicle or outdoor structure or involved a fatality, casualty or rescue or were attended by 5 or more pumping appliances. ↩
-
Secondary fires are generally small outdoor fires, not involving people or property. ↩
-
OSR are the regulatory arm of the UK Statistics Authority ↩