Family Resources Survey: financial year 2020 to 2021
Updated 12 May 2023

© Crown copyright 2023
This publication is licensed under the terms of the Open Government Licence v3.0 except where otherwise stated. To view this licence, visit nationalarchives.gov.uk/doc/open-government-licence/version/3 or write to the Information Policy Team, The National Archives, Kew, London TW9 4DU, or email: psi@nationalarchives.gov.uk.
Where we have identified any third party copyright information you will need to obtain permission from the copyright holders concerned.
This publication is available at https://www.gov.uk/government/statistics/family-resources-survey-financial-year-2020-to-2021/family-resources-survey-financial-year-2020-to-2021
Results from the Family Resources Survey (FRS) for the financial year 2020 to 2021, providing information on income and circumstances of UK households.
The FRS is a continuous household survey which collects information on a representative sample of private households in the United Kingdom.
Detailed information is recorded on each respondent:
- their incomes, from all sources including self-employment
- housing tenure
- caring needs and responsibilities
- disability
- expenditure on housing
- education
- pension participation
- childcare
- family circumstances
- child maintenance
- household food security
1. Main Stories
This report summarises the key findings from the Family Resources Survey for the financial year 2020 to 2021. The data in this report are from interviews conducted between April 2020 and March 2021. They form an important benchmark of household incomes and circumstances during the coronavirus (COVID-19) pandemic.
This publication is the first survey year where coronavirus (COVID-19) has impacted data collection. In March 2020, the introduction of Government restrictions led to a compulsory halt to face-to-face interviewing in the home. This meant that from April 2020, and for the whole of the 2020 to 2021 survey year, data collection was by telephone instead of face-to-face.
This shift in mode of interview has been accompanied by a substantial reduction in the number of interviews achieved: just over 10,000 interviews were achieved this year, compared with 19,000 to 20,000 in a typical FRS year.
Whilst these statistics have undergone extensive quality assurance prior to publication, we recommend that users exercise additional caution when using the data for 2020 to 2021. We especially advise caution when interpreting some of the changes observed since the previous, 2019 to 2020 release.
See the background information and methodology available alongside this publication for more on the issues affecting this release of the FRS.
We are seeking user feedback on this report, in terms of the impact that the coronavirus (COVID-19) pandemic has had upon FRS data collection and findings: on the presentation of the statistics; the handling of the uncertainty with these statistics; and the guidance we have provided on interpretation. Please send comments to our email team.frs@dwp.gov.uk
Income and State Support

Income from employment and self-employment made up 73p of every £1 of household income.
Tenure
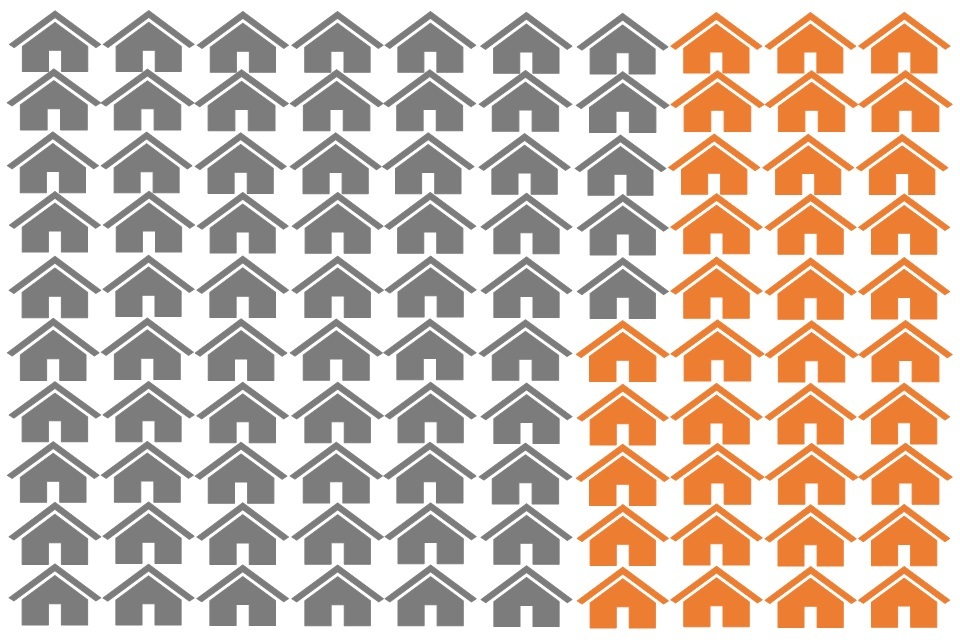
The percentage of households in the rented sector has decreased gradually over the last five years and is now 35%.
Disability
Most age groups had a higher proportion of females than males reporting a disability. The exceptions were younger age groups (ages 14 and younger).
Care
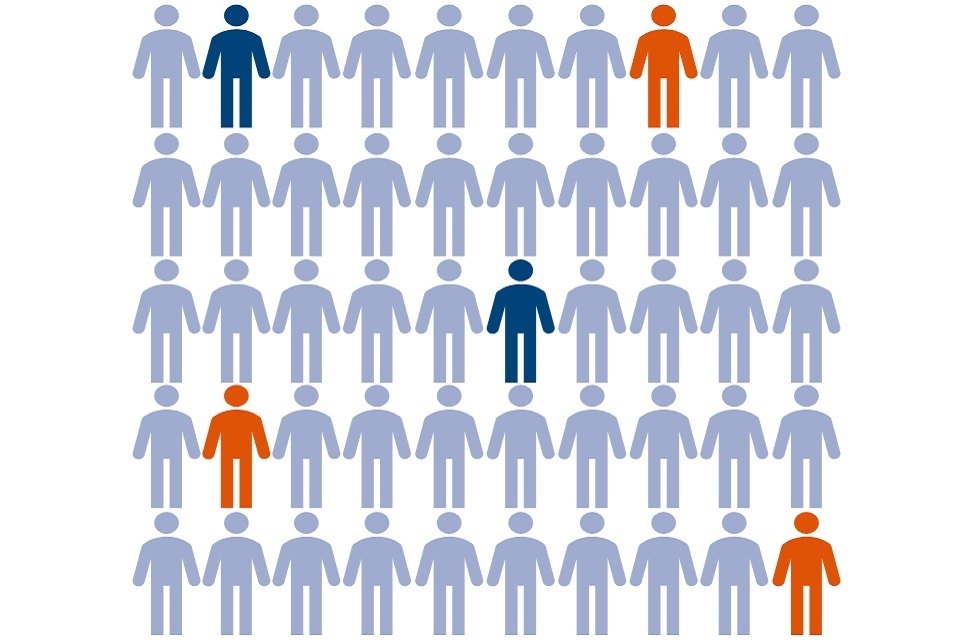
Two in every 50 people are in receipt of care. Three in every 50 people are providing informal care to someone else, with almost half caring for someone living within their household.
Pension Participation
Pension scheme participation has continued its steady increase since the completion of automatic enrolment for employees in 2017 to 2018.
Savings and Investment
Four in ten families had either no savings or investments, or less than £1,500 in savings and investments. A sixth of families had savings and investments of £30,000 or more.
Self Employment
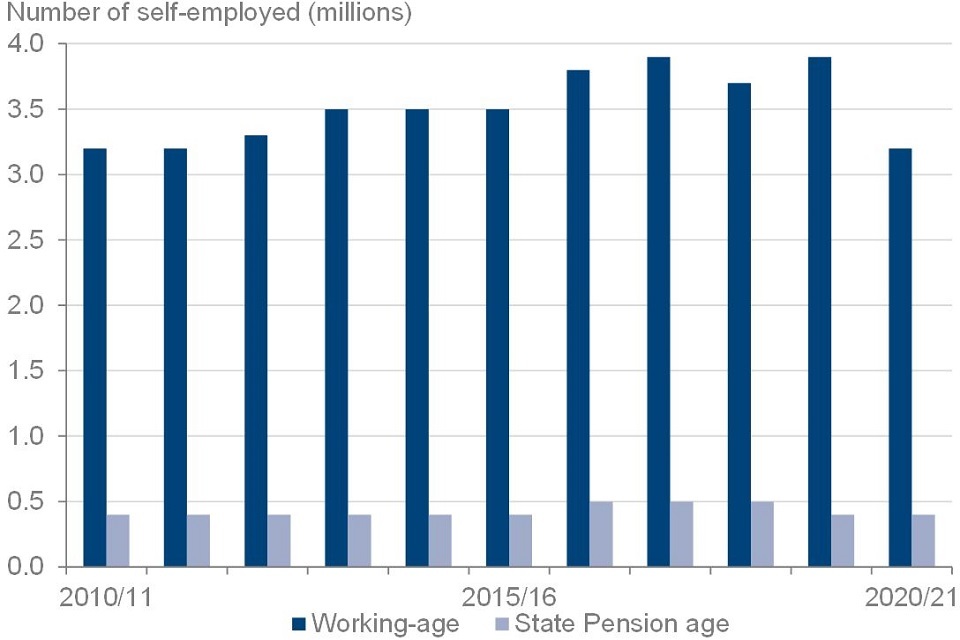
The number of working-age self-employed people fell by 0.7 million between 2019 to 2020 and 2020 to 2021. Apart from a 0.2 million fall between 2017 to 2018 and 2018 to 2019, there has been an upward trend since 2010 to 2011.
Household Food Security
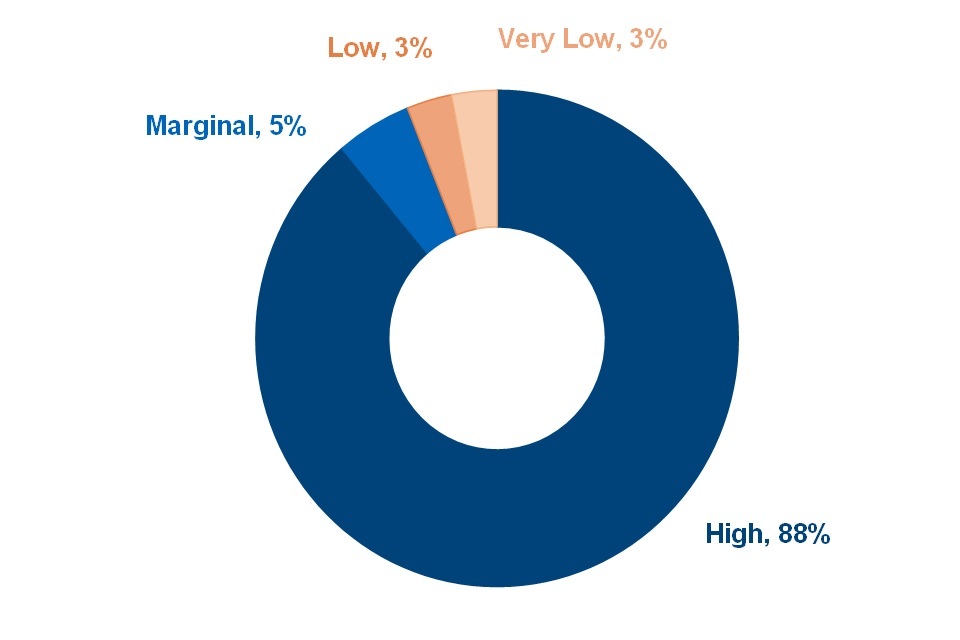
Most people lived in households with high household food security (88%) or marginal household food security (5%). A minority of households were food insecure, with low household food security (3%) or very low household food security (3%).
2. What you need to know
The primary purpose of the FRS is to provide the Department for Work and Pensions (DWP) with data to inform the development, monitoring and evaluation of social welfare policy.
The survey is used by many other government departments and is used for tax and benefit policy modelling by HM Treasury and HM Revenue and Customs. The FRS is also used extensively by academics and research institutes for social and economic research.
For further contextual information on the statistics presented, as well as detailed information about FRS methodology, see the background information and methodology available alongside this publication.
Other FRS-based publications
The FRS provides the underlying data for three other DWP National and Official Statistics reports:
- Households Below Average Income
- Pensioners’ Incomes Series
- Income-Related Benefits: Estimates of Take-up
Households, benefit units and individuals
Results in this report, depending on the context, are presented at:
- household level
- family or benefit unit level
- individual level
Household level definition
One person living alone, or a group of people (not necessarily related) living at the same address, who share cooking facilities and share a living room, sitting room or dining area. A household will consist of one or more families and benefit units.
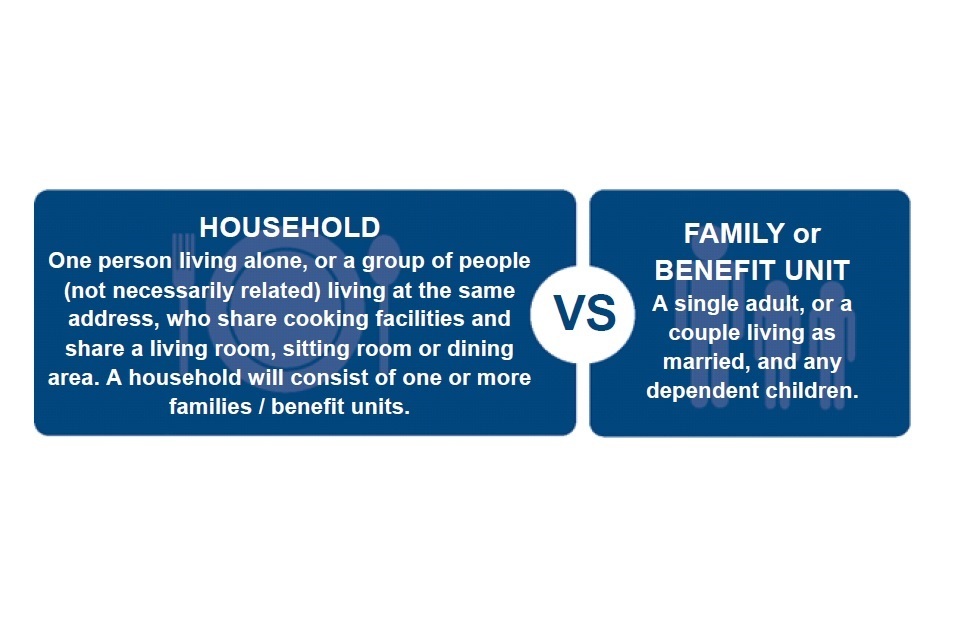
Family or benefit unit level definition
A single adult, or a couple living as married, and any dependent children.
Additional tables and data
A comprehensive set of detailed tables complementing the results presented are available alongside this publication.
These tables are referenced throughout this report.
An anonymised version of the FRS dataset is available to download via the UK Data Archive.
3. Income and state support
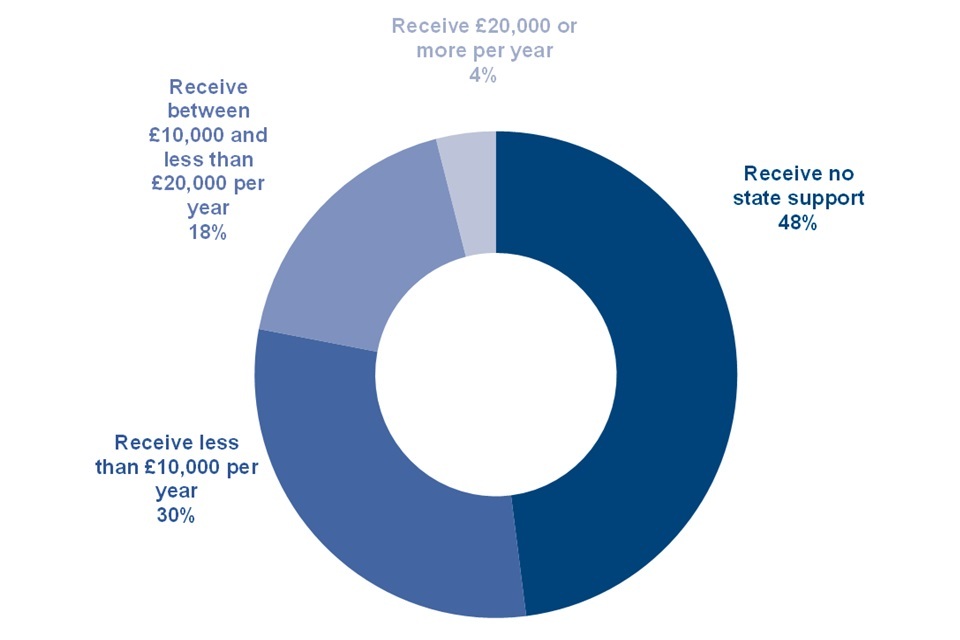
Families (benefit units) by income received from state support, 2020 to 2021, United Kingdom
The percentage of families receiving state support rose to 52%.
State support refers to state benefits or tax credits and includes Child Benefit.
The proportion of UK families receiving state support has not changed significantly since the previous survey year. This year, it is estimated at 52%, with central estimates for the previous two survey years being 50% in 2019 to 2020 and 52% in 2018 to 2019.
Thirty per cent of UK families received less than £10,000 per year from state support, which is equivalent to 10.4 million families. 18% of families received between £10,000 and less than £20,000 annually from state support, which equates to 6.4 million families. Four per cent of families received £20,000 or more per year from state support, which is equivalent to 1.3 million families. In all of these categories, the increase since 2019 to 2020 is one percentage point.
See table 2.14 for full data.
Sources of total gross household income, FYE 2011 to FYE 2021, United Kingdom
Income from non-state pensions formed a slightly higher proportion of total income than in previous years.
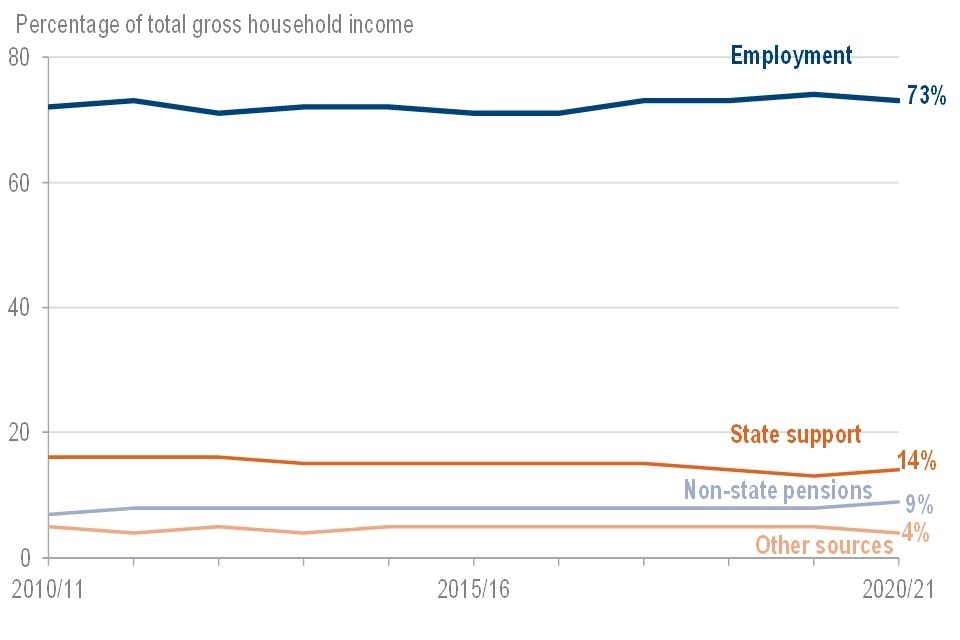
Having varied between 71% and 74% from 2010 to 2011 to 2019 to 2020, the proportion of income from employment (wages, salaries and self-employment) was 73% this survey year.
Note that self-employed incomes do not include any reported grants received as part of the Self-Employment Income Support Scheme (SEISS). Also, for employees, all wages are treated as income from employment rather than state support, irrespective of any payments from the Coronavirus Job Retention Scheme (CJRS) that the respondent’s employer was receiving on their behalf.
From 2010 to 2011 to 2019 to 2020, the proportion of income from state support (benefits, including the State Pension and tax credits) either declines or remains the same in comparison to the previous year. However, this long-term trend has not continued in 2020 to 2021 with an increase of one percentage point since 2019 to 2020.
After remaining at five per cent from 2014 to 2015 to 2019 to 2020, the proportion of income from other sources (including investments, rents received, grants and allowances) fell to four per cent.
See table 2.1 for full data.
Percentage of total gross household income from earnings by region, 2020 to 2021, United Kingdom
London had a higher proportion of income from employment than other regions.
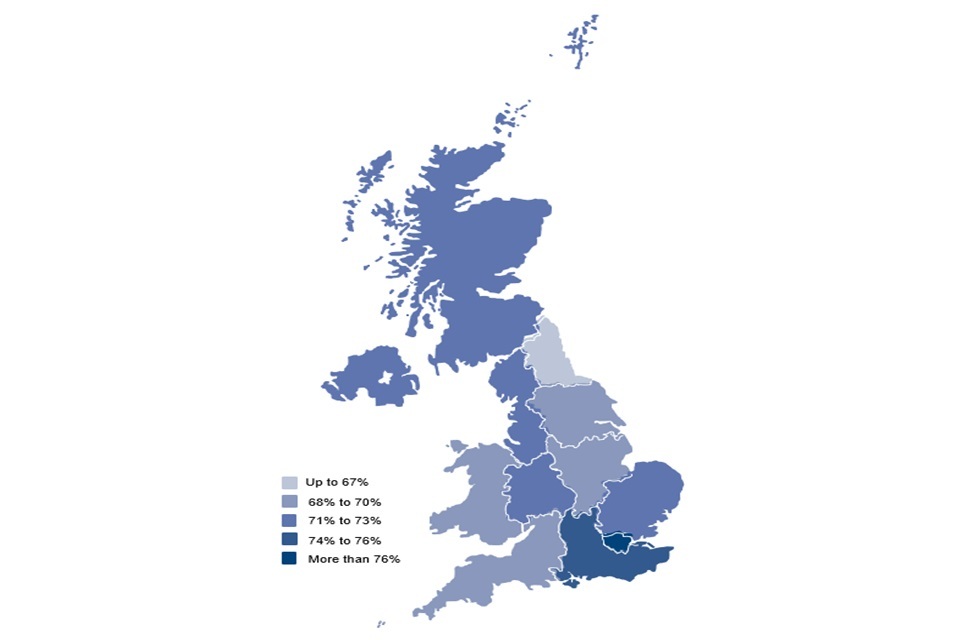
Seventy-three per cent of gross household income came from employment in the United Kingdom. London had the highest proportion of income from employment at 83% and the North East had the lowest proportion at 67%.
Conversely, the North East had the highest proportion of income from state support at 21% whilst London had the lowest proportion at eight per cent.
The highest proportion of income from non-state pensions was 12% for both Wales and the South West whilst the lowest proportion was for London at five per cent.
A minority of income came from other sources. The highest proportion was five per cent for both the South East and the South West and the lowest proportion was two per cent for each of Wales, Northern Ireland and the North East.
These regional differences are likely to be associated with the demographic and economic variations between regions. Differences may also be partly due to the effects of the coronavirus (COVID-19) pandemic.
See table 2.2 for full data.
Receipt of state support by age of head of family, 2020 to 2021, United Kingdom
The percentage of families receiving state support varied by age of family head and type of benefit.
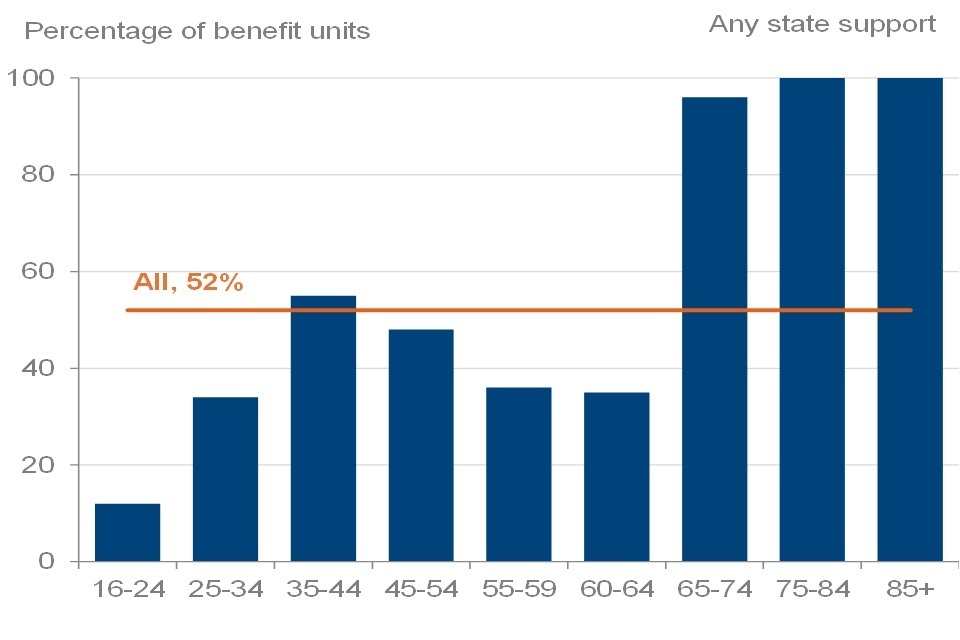
For working-age families, where the head was below State Pension age, the highest percentage of state support receipt was 55% (where the head of the family was aged 35 to 44 years). This is likely to be associated with the high proportion of such households (47%) who received Child Benefit.
Nearly every family where the head was over State Pension age received some form of state support, with the vast majority receiving State Pension.
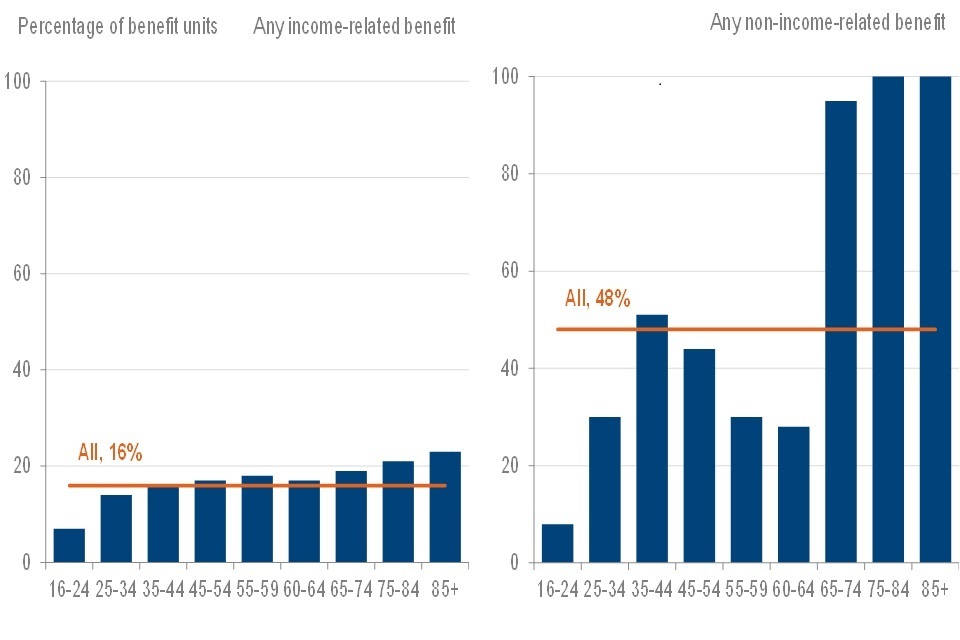
With an exception where the head of the family was aged 60 to 64 years, the proportion of families receiving any income-related benefit increased with the age of the head of the family. This increase was from seven per cent where the head of the family was aged 16 to 24 years, to 23% where the head was aged 85 years or more.
See table 2.11 for full data.
4. Tenure
Households by tenure, FYE 2011 to FYE 2021, United Kingdom
The percentage of households in the private renting sector has gradually decreased over the last five years.
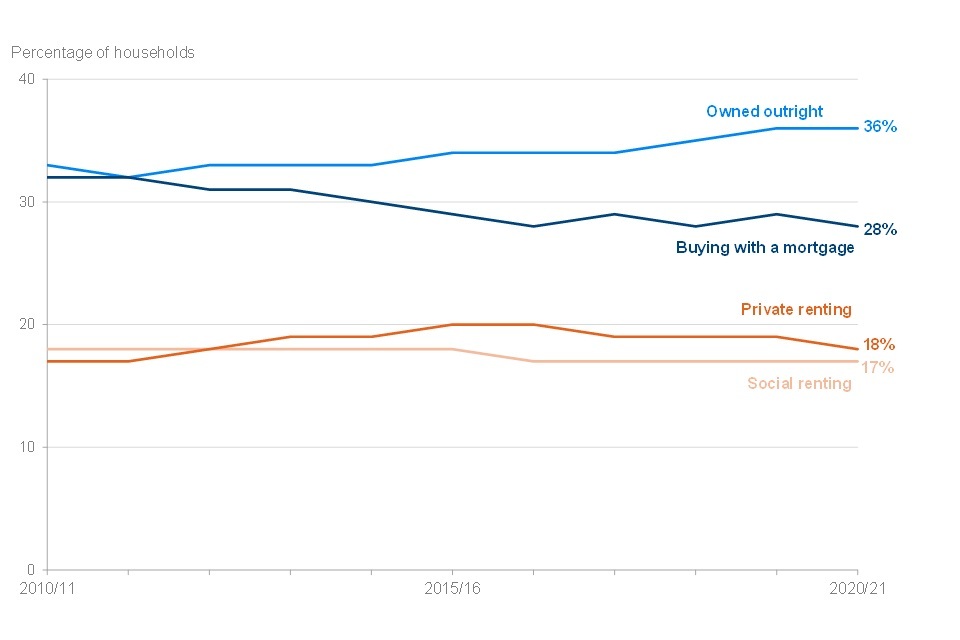
Over the last five years, the proportion of households in the private renting sector has decreased to 18%. This is one percentage point lower than the 3-year period from 2017 to 2018 to 2019 to 2020.
Over the past decade, with the exception of 2011 to 2012, the proportion of households that are owned outright has either increased or remained the same in comparison to the previous year. The proportion of households owned outright remains at 36% this survey year, the same as in 2019 to 2020.
The proportion of households that are bought with a mortgage has fluctuated between 28% and 29% since 2015 to 2016. The percentage was estimated at 28% in 2020 to 2021.
From 2016 to 2017 to 2020 to 2021, the proportion of households in the social renting sector has remained at 17%.
See table 3.6 for full data.
Median household weekly mortgage payment by region, 2020 to 2021, United Kingdom
Repayment mortgage instalments varied greatly by region.
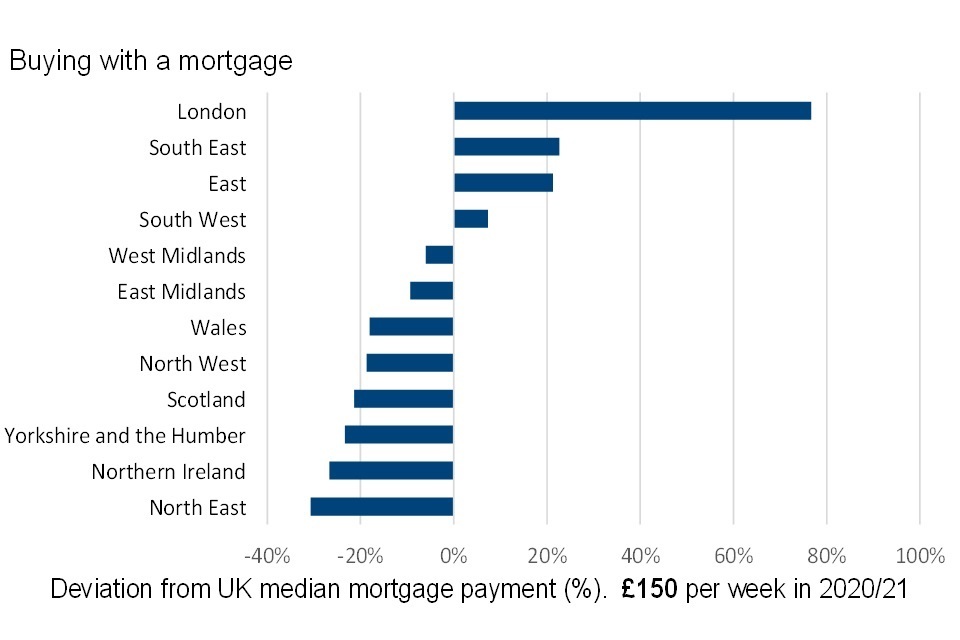
Sizeable regional variations remain this survey year, and are even more pronounced than in the previous, 2019 to 2020 results.
The region with the highest median instalment on repayment mortgages was London, which at £265 per week was £115 above the median for the United Kingdom.
In contrast, the North East had the lowest median repayment at £104 per week which was £46 below the median for the UK. The difference in median repayment between London and the North East was £161 per week.
Median household weekly social rent payment by region, 2020 to 2021, United Kingdom
Social sector rents for nearly all regions were within £12 per week of the UK median social sector rent.
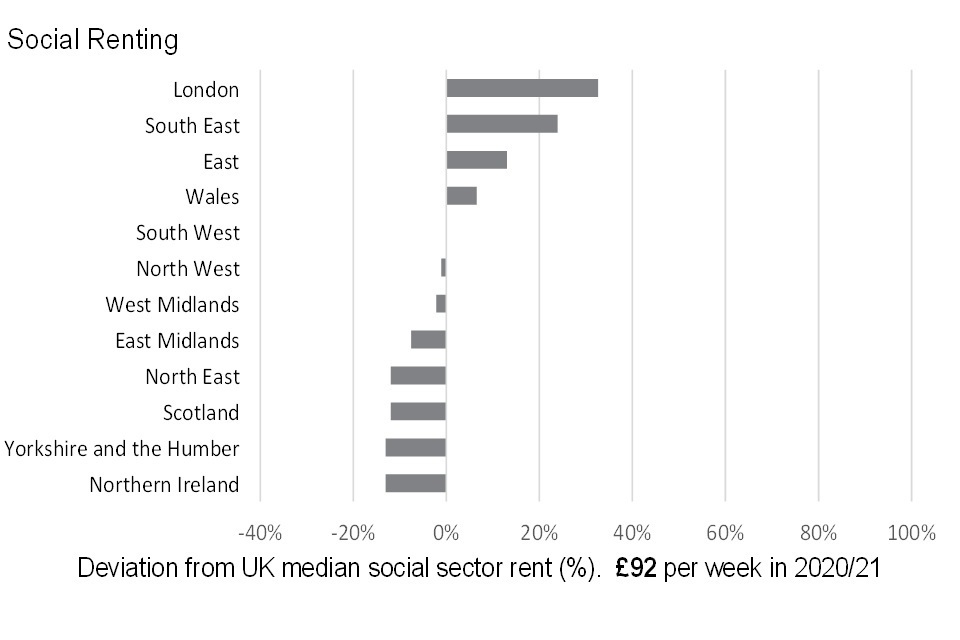
The median social sector rent was highest for the London region at £122 per week, which was £30 greater than the median rent for the UK. The lowest median social sector rent was seen in both Yorkshire and the Humber and Northern Ireland at £80 per week, which was £12 lower than the median rent for the UK.
The median social sector rent for the South West was in line with the UK median of £92 per week.
The median social sector rents for all regions, except for London and the South East, were within £12 per week of the median social sector rent for the UK.
Median household weekly private rent payment by region, 2020 to 2021, United Kingdom
Private sector rents were significantly higher in London compared to all other regions.
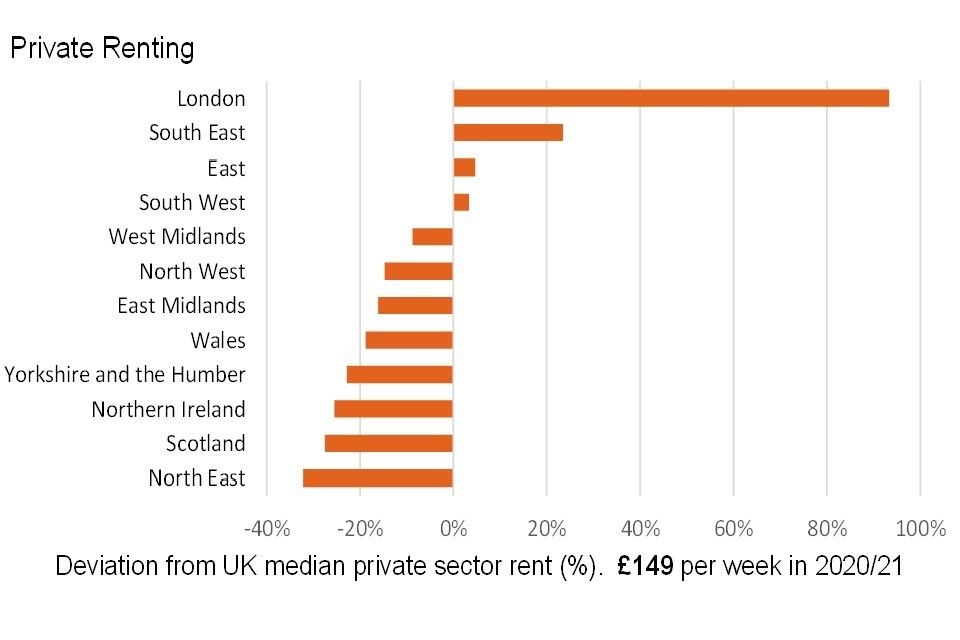
London had the highest median private sector rent, which at £288 per week was £139 above the median rent for the UK. Conversely, the North East had the lowest median rent at £101 per week which was £48 below the median private sector rent for the UK.
The median private sector rent for London was nearly triple the equivalent figure for the North East.
Median private sector rents were greater than median social sector rents for all regions. These differences may be partly due to social sector rents being controlled by government-set formulae. Differences may also be associated with the private rented sector having a more varied range of housing stock in comparison with the social rented sector.
See table 3.8 for full data.
Tenure type by age of head of household, FYE 2011 and FYE 2021, United Kingdom
All age groups have seen a shift towards private sector renting.
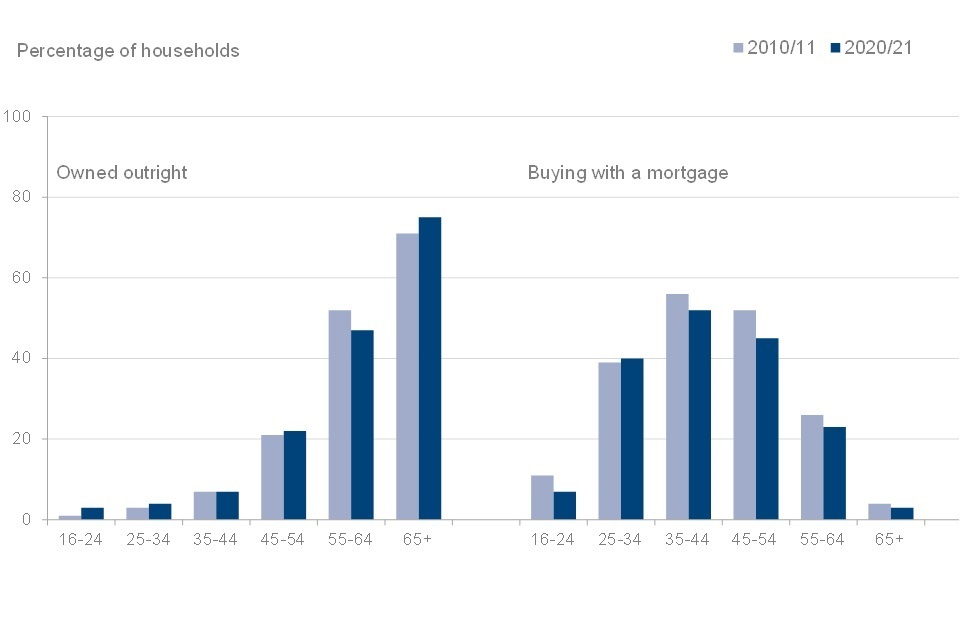
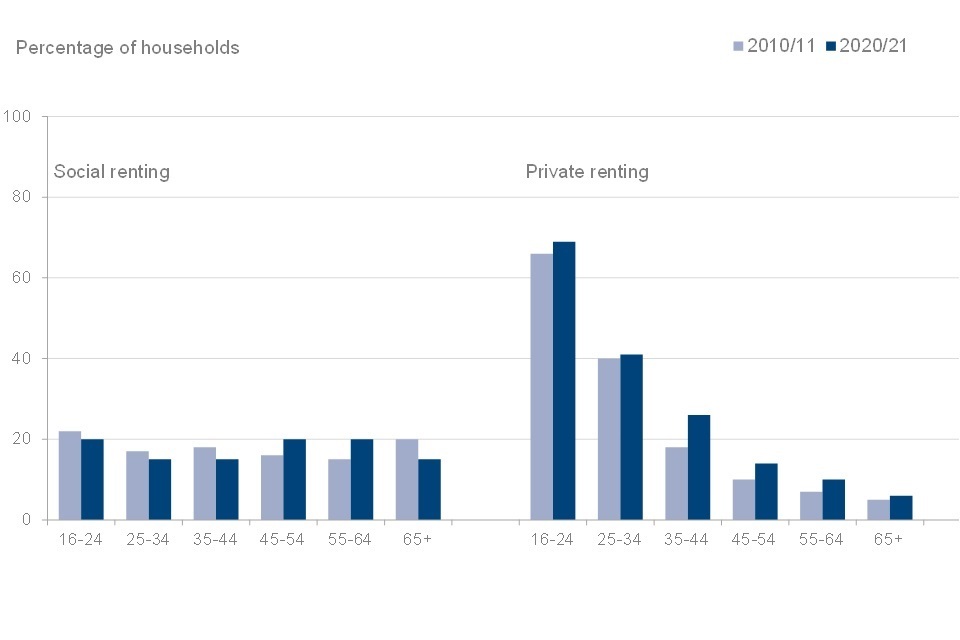
For every age category, there was a greater proportion of private renting in 2020 to 2021 compared to 2010 to 2011. The largest increase was eight percentage points for households where the head was aged 35 to 44 years, from 18% in 2010 to 2011 to 26% in 2020 to 2021.
The percentage of households that are owned outright has been stable for most age groups over the past decade, except where the head of the household was aged 55 to 64 years (falling by five percentage points) and 65 years or more (increasing by four percentage points).
The decade between 2010 to 2011 and 2020 to 2021 has seen a shift away from households that are bought with a mortgage. This was true for every age group except where the head of the household was aged 25 to 34 years. The largest decline was seven percentage points where the head of the household was aged 45 to 54 years, from 52% in 2010 to 2011 to 45% in 2020 to 2021.
For younger working-age households, there has been a decrease in social renting over the past decade. Conversely, for older working-age households, there has been an increase in social renting from 2010 to 2011 to 2020 to 2021.
See table 3.7 for full data.
Households by tenure and receipt of income-related benefits, 2020 to 2021, United Kingdom
Social sector renters were much more likely to receive income-related benefits.
Nineteen per cent of all households in the UK receive some form of income-related benefit. This proportion rises to 62% receiving any income-related benefit for social sector renters which is over three times higher than for all households. This proportion has risen slightly from 60% in 2019 to 2020.
Forty per cent of households in the social renting sector received Housing Benefit and 49% received Council Tax Reduction. This will have likely contributed to the considerably larger proportion of households in the social renting sector who received income-related benefits.
See table 3.5 for full data.
5. Disability
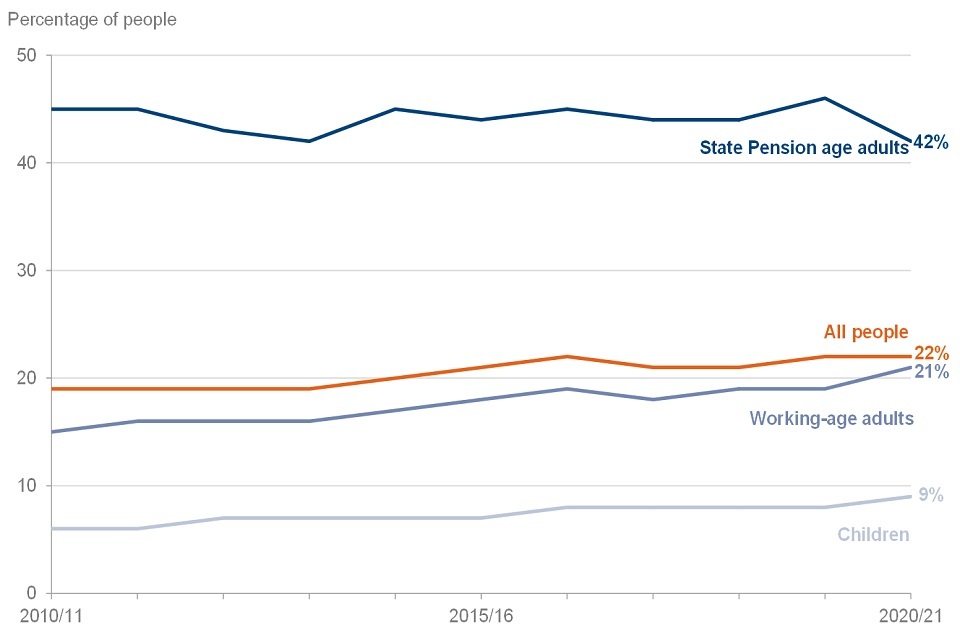
Disability prevalence by age group, FYE 2011 to FYE 2021, United Kingdom
There were changes in the prevalence of disability reported in 2020 to 2021 FRS, with a two percentage-point increase in the proportion of working-age adults reporting a disability, and a four percentage-point decline in the proportion of those over State Pension age reporting a disability.
For those of working age, the change may be linked to restrictions limiting movement outside of the home. For those above State Pension age, the reduction may be a consequence of the change in mode, as fewer participants reported impairments in hearing, memory or vision.
One in five people reported a disability.
A person is considered to have a disability if they have a physical or mental impairment that has ‘substantial’ and ‘long term’ negative effects on their ability to do normal daily activities. This is the core definition of disability in the Equality Act 2010.
In 2020 to 2021 the number of people who reported a disability was 14.6 million, an increase of 3 million since 2010 to 2011, where disability was reported by 11.6 million people. The percentage of people who reported a disability in 2020 to 2021 has increased to 22%, a change of three percentage points over the period since 2010 to 2011, when the percentage was 19%.
- the main drivers of this change were increases in the percentage of working-age adults (15% to 21%) and children (six to nine per cent) reporting a disability
- for those of State Pension age, the percentage reporting a disability has been between 42% and 46% in every year of the past decade, with the percentage estimated at 42% this year
- for working-age adults, the percentage reporting a disability has increased from 2019 to 2020 to 2020 to 2021, from 19% to 21%. The percentage of children reporting a disability has also increased for the first time since 2016 to 2017, rising from eight to nine per cent this survey year
See the background information and methodology section for more details.
See tables 4.1 and 4.2 for full data.
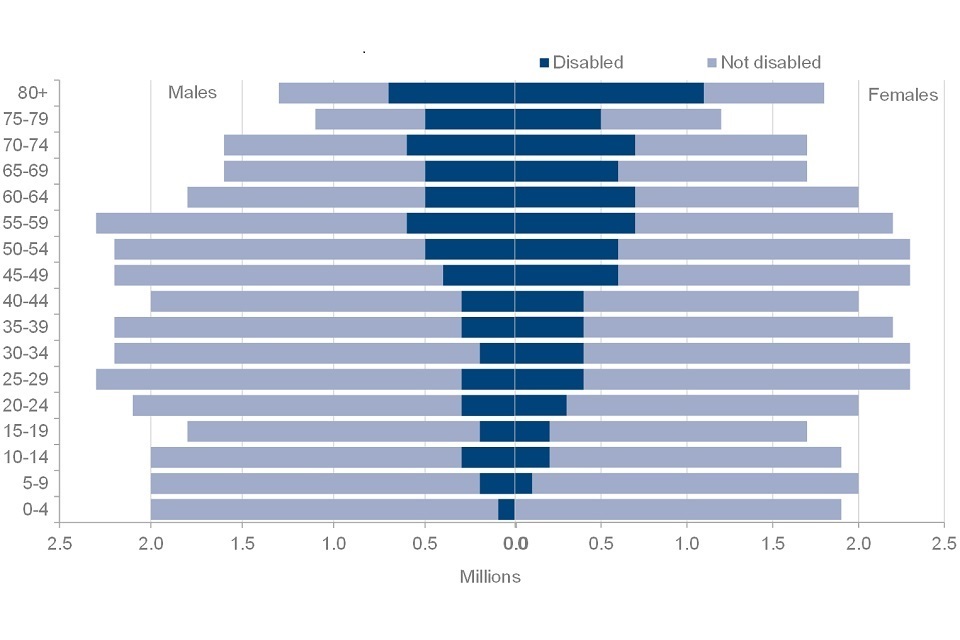
Disability prevalence by gender, FYE 2011 to FYE 2021, United Kingdom
The proportion reporting a disability has grown more among females than males.
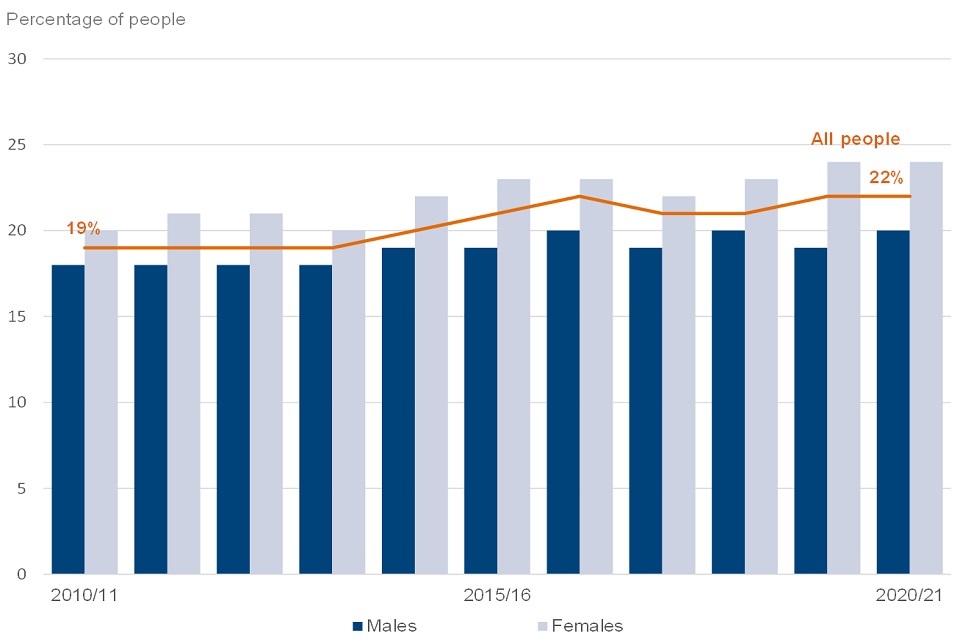
Twenty-four per cent of females (8.0 million) reported a disability in 2020 to 2021, an increase from 20% (6.2 million) in 2010 to 2011. In comparison, reporting a disability amongst males increased from 18% (5.5 million) in 2010 to 2011 to 20% (6.6 million) in the most recent survey year.
In 2020 to 2021 most age groups had a higher proportion of females than males reporting that they are disabled. The exception are younger ages (14 years and younger). Another exception were the 20-24 year olds and 75-79 year olds who reported the same proportion of disability for males and females.
See Table 4.2 and 4.3 for full data.
Disability prevalence by region and country, 2020 to 2021, United Kingdom
The percentage of people reporting a disability varied by region.
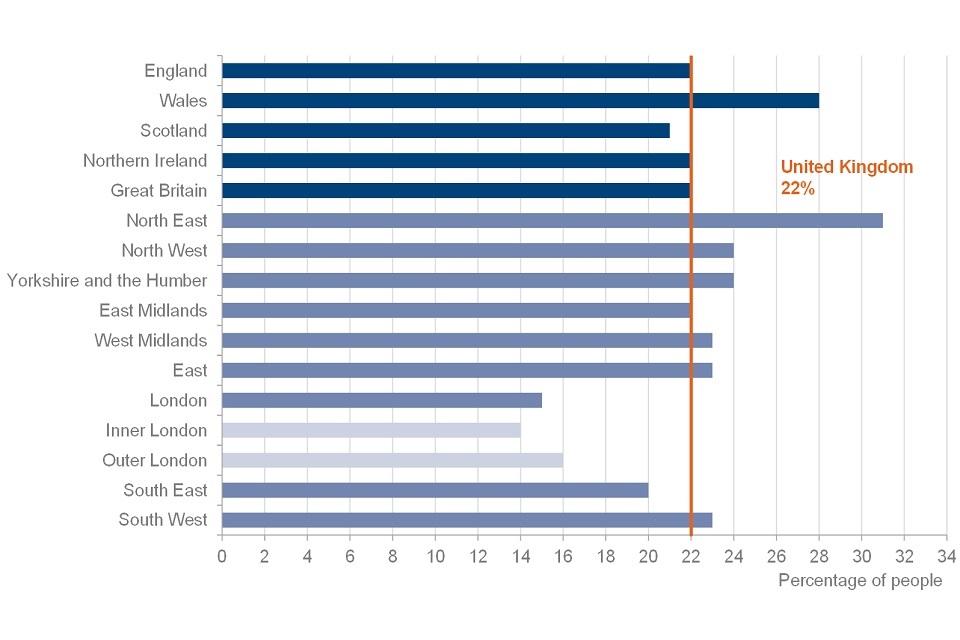
The number of people in the UK who reported a disability in 2020 to 2021 was 14.6 million, equating to 22% of people, however the prevalence varied across the UK.
- in Wales, the proportion of people who reported a disability was 28%, six percentage points higher than UK national average. Scotland was the only country within the UK to fall below the UK national average, with 21% of people reporting a disability. England and Northern Ireland matched the UK national average of 22%
- within England, the North East had the highest proportion of people reporting a disability in 2020 to 2021, at 31%. The percentage of people reporting a disability in the South West, East and West Midlands was one percentage point higher than the UK national average, with 23% of people within these regions reporting a disability
- London had the lowest proportion of people who reported a disability at 15%
The differences in disability reporting could be partially explained by the varying demographics in each region. For example, disability prevalence may correlate with the percentage of the population who are of State Pension age in a particular region, noting that reporting of a disability is almost double amongst this age group, compared to the overall population (see Table 4.1).
See table 4.1 and 4.4 for full data.
Impairment types reported by disabled people, by age group, 2020 to 2021, United Kingdom
Impairments reported by disabled people varied by age group.
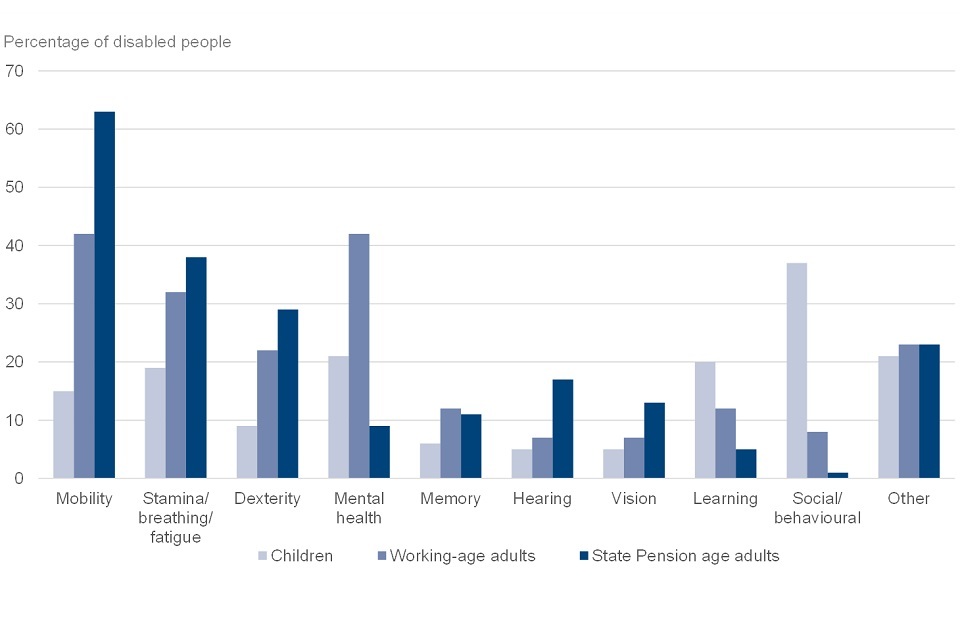
Among disabled working-age adults, the impairments reported most frequently were mental health and mobility (in both cases, by 42% of this group).
For those disabled and over State Pension age, 63% reported mobility as one of their impairments. Stamina (or breathing or fatigue) were reported by 38% and only nine per cent of this group reported a mental health impairment.
In children, social (or behavioural) impairments were the most common category reported, at 37% of disabled children. Mental health and the category including all ‘Other’ impairment types were the second most prevalent for children, at 21%. A learning impairment was reported for 20% of disabled children, making it the fourth most prevalent impairment type reported by this age group.
See table 4.6 for full data.
6. Care
Percentage of people providing informal care by age and gender, 2020 to 2021, United Kingdom
Those aged 45 to 64 years are most likely to be carers.
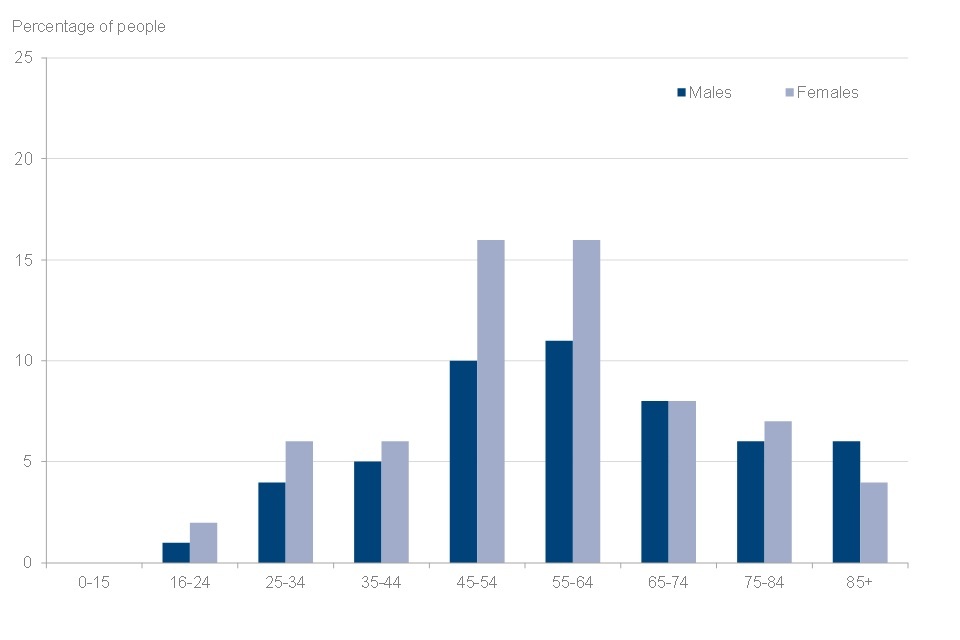
Six per cent of UK people were informal carers in 2020 to 2021. The number of carers varied by gender. Females were more likely to be informal care providers, with 2.5 million versus 1.7 million males.
- those aged between 45 and 54, and 55 and 64 were equally the largest groups of informal care providers with an overall 13 per cent in each group. The proportion of females in each group was equal (16%) compared to 10% of males in the 45-54 category and 11% in 55-64.
- the proportion of females providing informal care was generally greater than males, particularly in middle-age. The only age group where males were more likely to be informal carers was 85+.
The FRS questionnaire asks if people are caring for others on an informal basis (that is, where caring is not a paid job; this contrasts with formal care, which comes from paid help, such as the local authority, district nursing or private domestic help). Examples of care include helping with shopping, preparing meals and feeding, and household chores. See tables 5.1 and 5.2 for full data.
Percentage of people receiving care by age and gender, 2020 to 2021, United Kingdom
The likelihood of receiving care varies by age and gender.
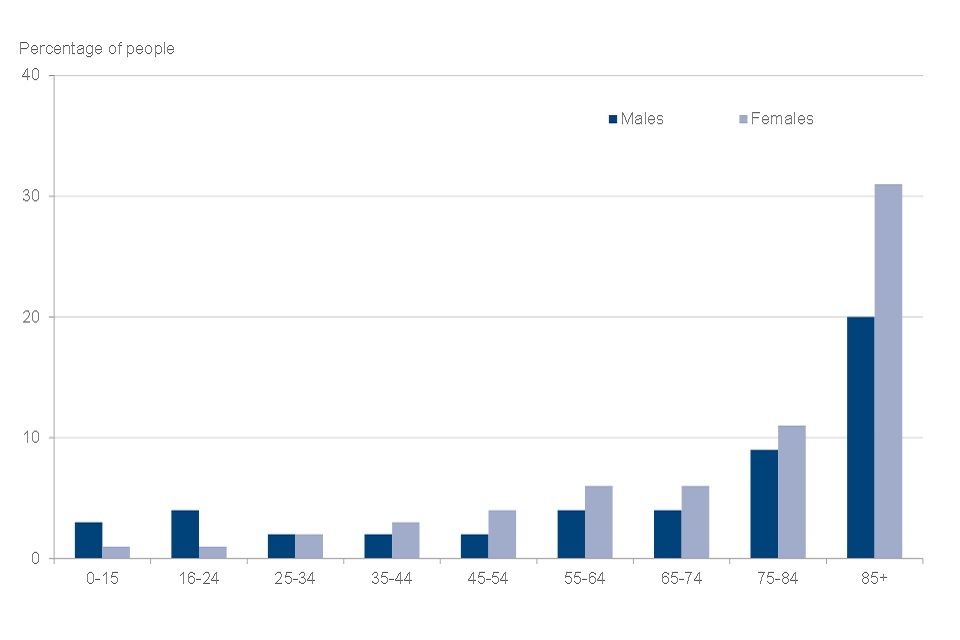
The percentage of people receiving care remains unchanged, at four per cent, from the 2019 to 2020 survey year.
It is rare to be a recipient of care if aged below 55: only four per cent or fewer were in receipt of care in all the younger age groups across genders. However, the likelihood of receiving care increases with age; 26% of people aged 85 and over were care recipients in 2020 to 2021.
In all age groups from 35-44 and above, females were more likely than males to be in receipt of care. This is most clearly visible in those aged 85 and over, where 31% of women were care recipients in comparison with 20% of men. In contrast, the proportion of males in receipt of care is larger than females for those below the age of 24.
See table 5.8 for full data.
Who informal carers care for, 2020 to 2021, United Kingdom
Family members were the main recipients of informal care.
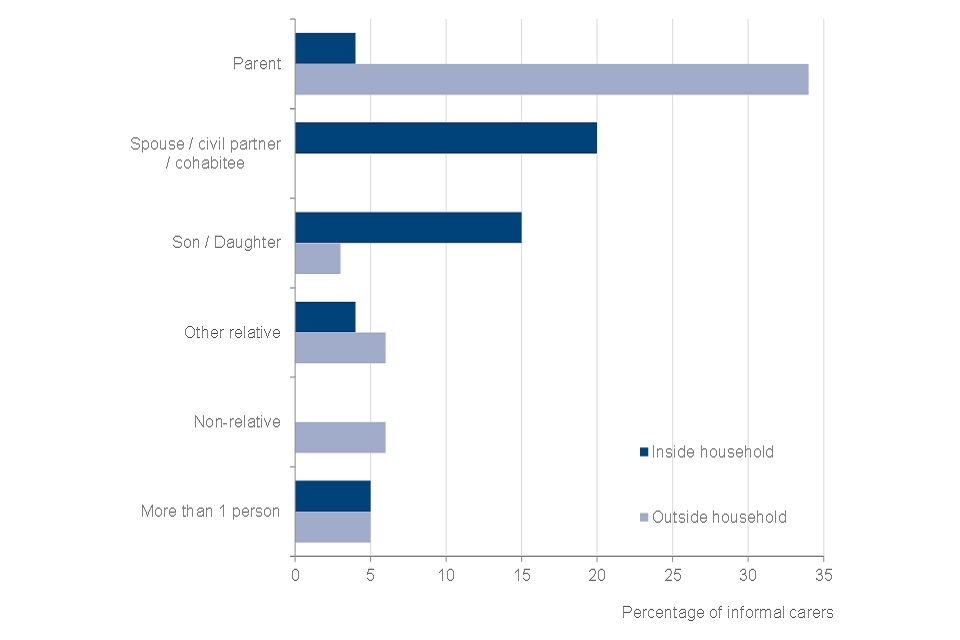
Of all informal carers, 48% provided care to someone living within their household and 55% provided care to someone living outside their household. Since the FRS 2019 to 2020 data, there has been a shift in this balance, with a four percentage point increase in those caring for someone inside the household, a three percentage point decrease in those caring for someone outside the household. This may reflect the requirements for social distancing, self-isolation and shielding, as a consequence of coronavirus (COVID-19).
A small minority of informal carers were caring for more than one person, both inside and outside their household.
The main recipients of informal care were parents. Of all informal carers, 34% provided care to parents living outside their household, with a further four per cent providing informal care to parents living inside their household.
The groups most likely to be cared for inside the household were their partner (spouse, or civil partner or cohabitee) and sons or daughters. Of all informal carers, 20% provided care to their partner and a further 15% to sons and daughters.
See table 5.7 for full data.
Adult informal carers by economic status and gender, 2020 to 2021, United Kingdom
More than one third of adult informal carers were also in full-time employment.
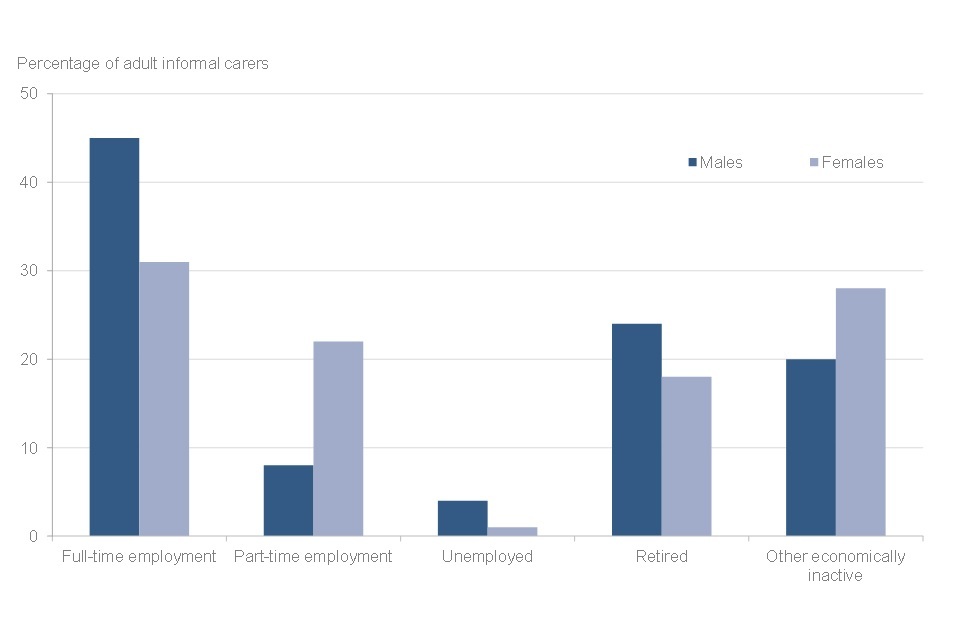
Of all adult informal carers, 53% were in employment with 36% working full-time. Male informal carers were more likely to be working full-time than female informal carers. The proportion of male informal carers that were also working full-time was 45% in comparison with 31% for females. In contrast, female informal carers were more likely to work part-time, with 22% of women in comparison with eight per cent of men.
Of all informal carers, 20% were retired. The proportion of economically inactive informal carers was 25%. Economically inactive status includes those who are students, those looking after a family or home, those permanently or temporarily sick or disabled and those inactive due to other reasons. Those unemployed (that is, seeking work) formed a very small minority of all adult informal carers, at only two per cent.
See table 5.4 for full data.
Adult informal carers by gender and hours of care provided per week, 2020 to 2021, United Kingdom
More than half of informal carers provide care for up to 19 hours per week.
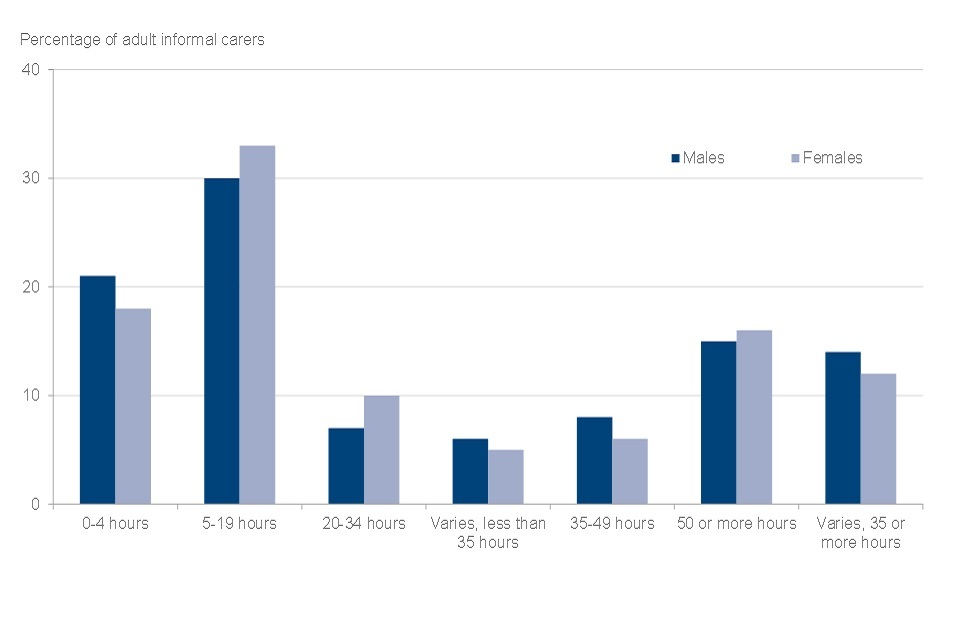
Of all adult informal carers, over half (51%) provided care for 19 hours per week or fewer. Adult informal carers providing care for 5-19 hours per week were the largest single group with 32% of carers delivering this number of hours. Informal care of 50 or more hours per week was provided by 16% of adult carers and 36% reported providing informal care for 35 or more hours per week.
Between genders, the more noticeable differences occur at lower numbers of caring hours, with a three percentage point difference in each of the 0-4 hours, 5-19 hours, and 20-34 hours groups. For the 0-4 hours group, the proportion is greater for males, but the 5-19 and 20-34 hours groups had a larger female proportion. Caring hours were distributed more similarly in all other groups.
See table 5.3 for full data.
People receiving care at least once a week, by frequency of care, 2020 to 2021, United Kingdom
Forty-four per cent of those receiving care every week are receiving continuous help.
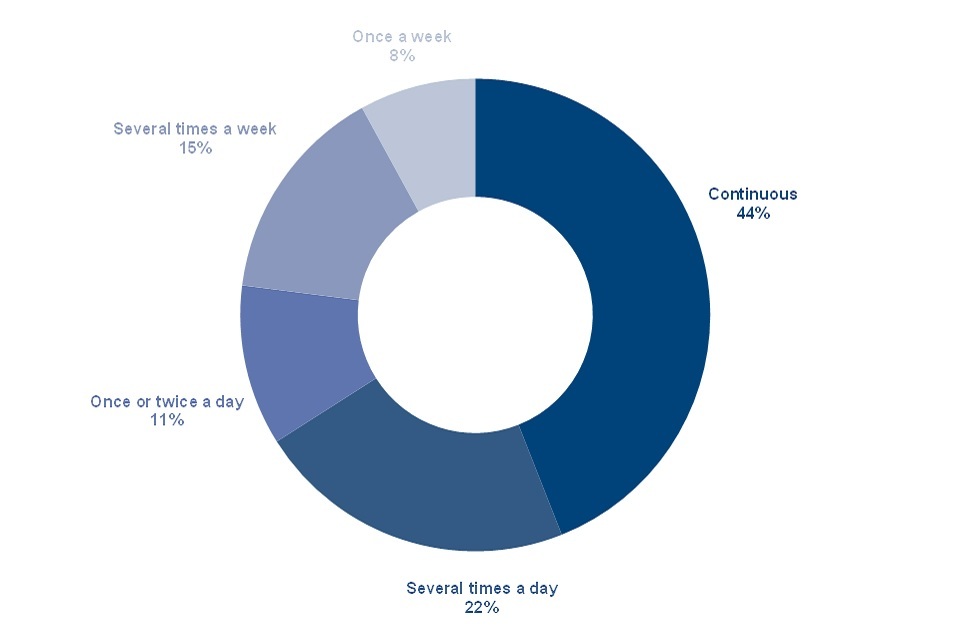
Of those receiving any form of care at least once a week (paid-for or informal), 44% received continuous care. An additional 33% of people received care at least once per day and a further 23% of people were cared for either several times, or just once per week.
There was a strong relationship between the frequency of care received and the age of the recipient. Children up to the age of 15 were more likely to receive continuous care than any other age group (81%). For those in the 16-24 age group, the proportion of continuous care recipients was over a half (52%).
Of all care recipients, those aged 85 and over were least likely to receive continuous care, with 30%, but most likely to receive care once or twice a day, with 24%.
Note that the Family Resources Survey is designed to be representative of all private households in the United Kingdom. Therefore, some individuals, such as those in care homes, are not included.
See table 5.9 for full data
7. Pension Participation
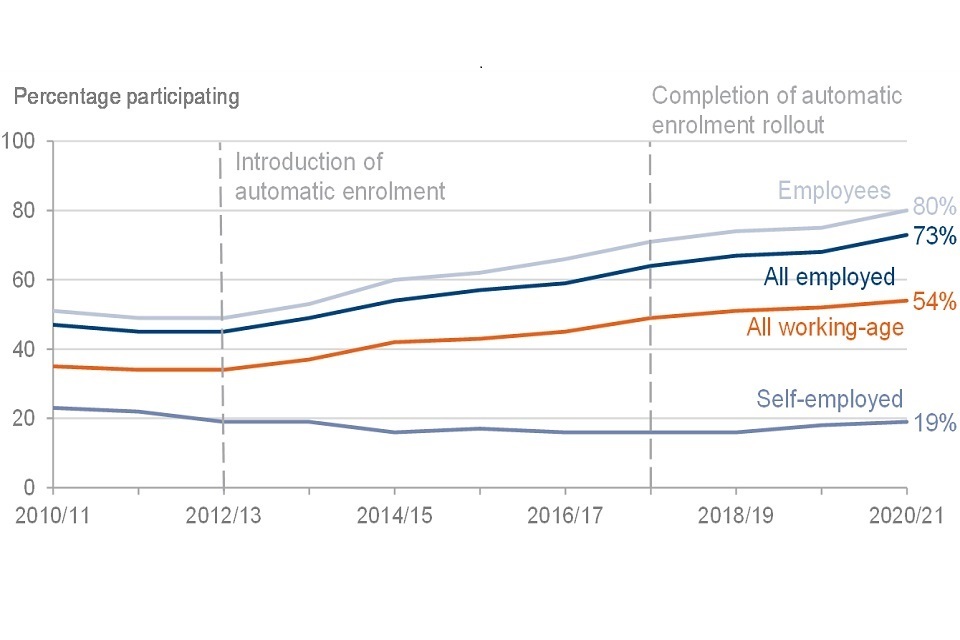
Pension scheme participation of working-age adults by employment status, FYE 2011 to FYE 2021, United Kingdom
Pension scheme participation increased substantially, following the introduction of automatic enrolment for employees in 2012.
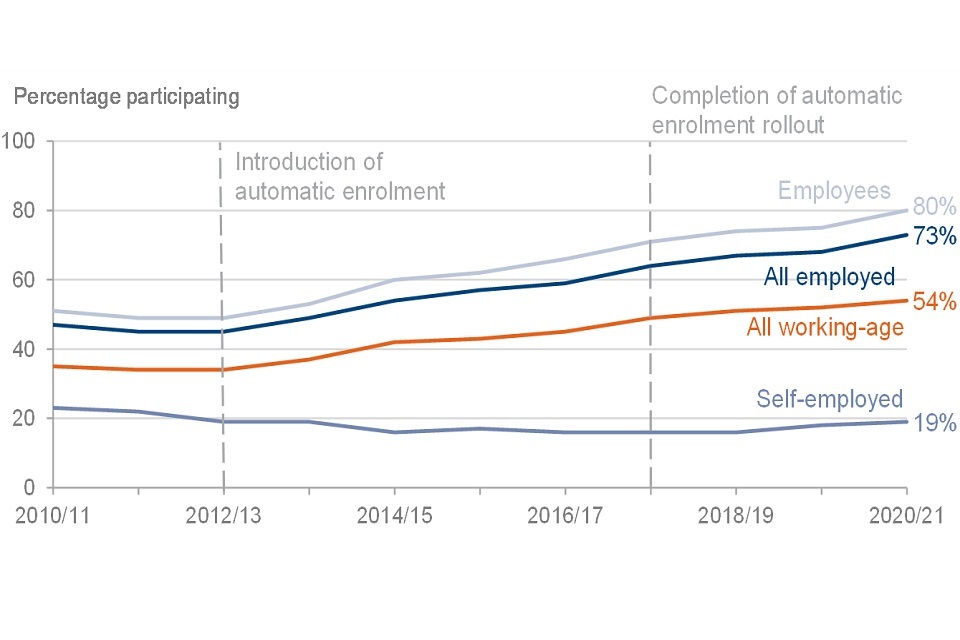
Pension scheme participation has increased considerably for working-age employees since the introduction of automatic enrolment in October 2012, with the full nationwide rollout being completed in 2018. From 49% of employees in 2012 to 2013, participation rose to 71% in 2017 to 2018. It has since maintained its steady growth, increasing to 80% for 2020 to 2021.
For working-age adults generally, 54% are now participating in a pension scheme. This is an increase of 20 percentage points since automatic enrolment began. Age eligibility for automatic enrolment is from 22 years to State Pension age, so those between 16 to 21 years will have lower levels of pension participation than older groups.
The self-employed are not eligible for automatic enrolment. Their participation has stayed relatively stable over the past decade, at between 16% and 23%.
See table 6.5 for full data.
Pension scheme participation for working-age adults by pension type and gender, 2020 to 2021, United Kingdom
Pension participation rates were lower for women than men.
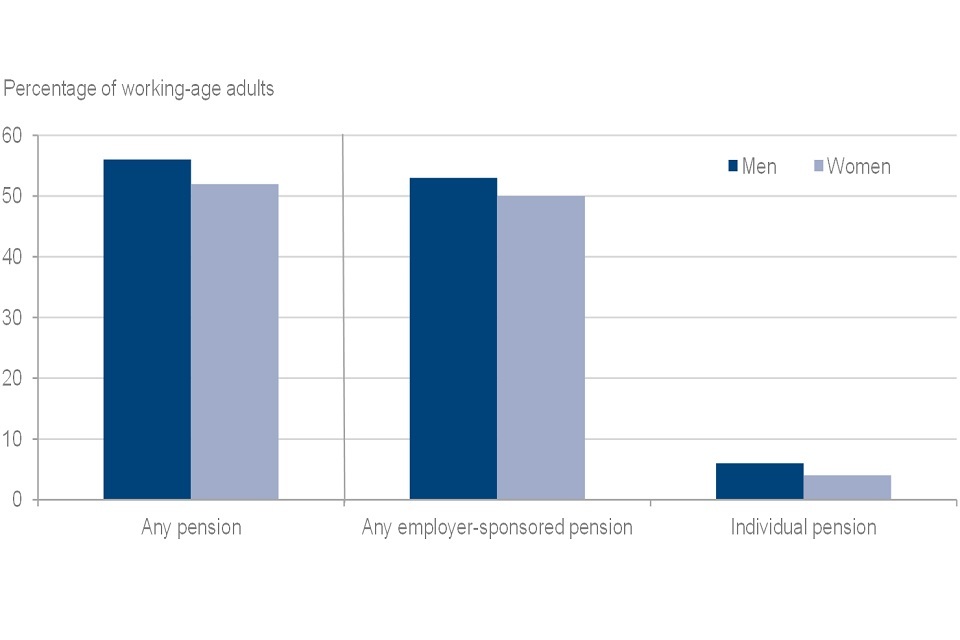
The overall pension scheme participation rate was slightly lower for working-age women than working-age men in 2020 to 2021.
- fifty-six per cent of all working-age men were contributing to a pension compared to 52% of working-age women
- participation rates in employer-sponsored schemes were slightly higher for working-age men (53%) than for women (50%)
- participation in individual pension schemes (personal pensions, including stakeholder schemes) was lower for working-age women (four per cent) compared with working-age men (six per cent)
Some individuals participated in both types of scheme.
See table 6.1 for full data.
8. Savings and Investment
Level of savings for families in 2020 to 2021, United Kingdom
In 2020 to 2021, one in seven UK families reported having no savings. A further two out of seven families reported that their savings were £1,500 or less. Taken together, 42% of families had either no savings or investments, or less than £1,500. The other 58% of families had savings and investments of £1,500 or more, with 16% of families having £30,000 or more.
Pensioner couples had higher levels of savings and investments than other kinds of family. Forty per cent of pensioner couples had savings and investments of £30,000 or more.
The group most likely to have no savings or investments, or less than £1,500 in savings and investments, were lone parents (single-adult benefit units with children): 75% reported this level of savings, compared to the UK average of 42%.
Among singles without children, 59% of males, and 57% of single females without children, reported either no savings or investments, or less than £1,500 in savings and investments.
See table 7.10 for full data.
Bank accounts and ISAs
Almost all respondents reported having a current account or basic bank account. Respondents in 92% of UK households reported having a current account and four per cent reported having a basic bank account.
Current accounts were least common in the North West, where 85% of households had a respondent with a current account. The North West had the highest percentage of basic bank accounts of any region, at eight per cent of households. This was twice that of the UK as a whole.
The North West was also the region where people were least likely to report any type of account. Eight per cent of households in the North West did not report having any type of account open in 2020 to 2021, compared with four per cent of households across the UK.
The other group less likely to report having any type of account were single males without children: Nine per cent of single males without children reported having no accounts in 2020 to 2021, compared with six per cent of UK families.
Individual Savings Accounts (ISAs) were most common in households in the West Midlands (39%) and the South West (also 39%). ISAs were least common in Northern Ireland, where 21% of households reported having an ISA.
Pensioner couples were most likely to hold an ISA, with 41% doing so. Single adults with children (16%) and single adults without children (20% of males, 23% of females) were least likely to have an ISA.
See tables 7.1 and 7.5 for full data.
Holdings of stocks and shares, and premium bonds
Only a minority of respondents said that they held stocks and shares (eight per cent).
Older respondents were more likely to do so: For those aged between 25 and 34, five per cent held stocks and shares, but this rose to 13% for those aged 65 to 74. Men (9%) were also more likely to invest in this way than women (6%).
A minority of respondents said they held Premium Bonds. As with other assets, the percentage holding them increased with age: For those aged 25 to 34, five per cent of adults said that they held Premium Bonds, but this rose to 22% for those aged 65 to 74, and was 23% among those aged 75 to 84.
Six per cent of households in Northern Ireland held Premium Bonds, compared with the UK average of 17% of households.
See tables 7.1, 7.5 and 7.7 for full data.
9. Self Employment
Note that all earnings discussed in this section include only earnings from work and business, and do not include any reported grants received as part of the Self-Employment Income Support Scheme (SEISS).
The statistics for 2020 to 2021 suggest a material decrease in the number of self-employed people when compared to recent years. This may have affected the earnings estimates being presented.
Self-employment by age group and gender, FYE 2011 to FYE 2021, United Kingdom
The number of working-age self-employed people fell by 0.7 million between 2019 to 2020 and 2020 to 2021, having risen since 2011 to 2012.

The number of working-age self-employed people rose from 3.2 million in 2010 to 2011 to 3.9 million in 2019 to 2020. In the financial year 2020 to 2021 this number fell by 0.7 million, back down to 3.2 million (a fall of 18%). There were 0.4 million fewer self-employed men in 2020 to 2021 than in 2019 to 2020, and 0.3 million fewer self-employed women. The number of self-employed individuals of State Pension age remained at 0.4 million which is consistent with previous years.
See table 8.4 for full data.
Median net earnings of working-age employees and the self-employed, by part-time and full-time, FYE 2011 to FYE 2021, United Kingdom
Median self-employed earnings continue to be lower than those of employees.
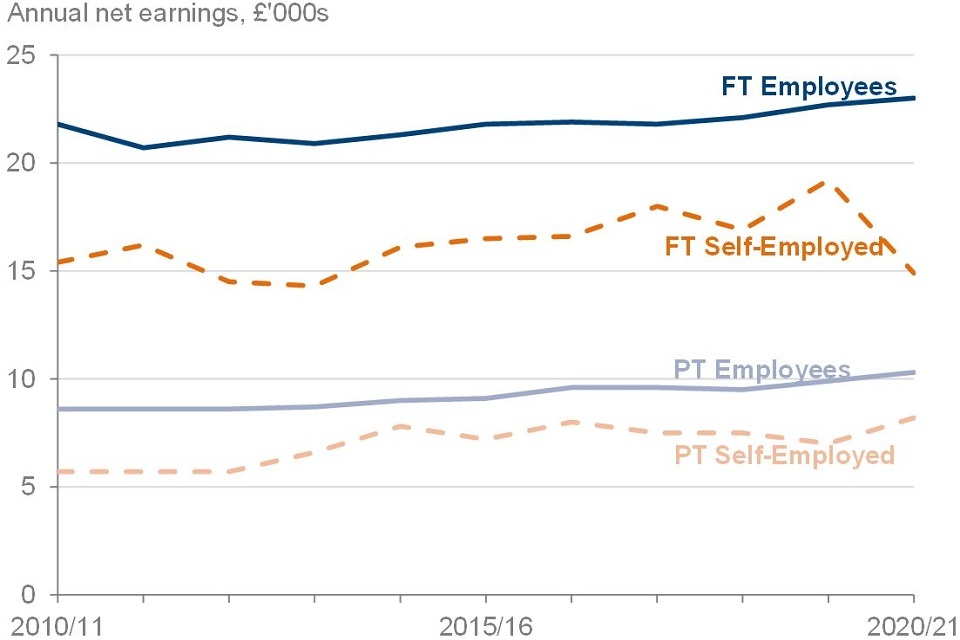
Self-employed earnings remained below employee earnings, which is consistent with the outcome of the previous ten years. Median net earnings for the full-time self-employed were £14,900 in the 2020 to 2021 financial year. This was 35% lower than the median earnings of full-time employees (£23,000) in the same year.
Median net earnings for the part-time self-employed remained 20% below those of part-time employees (£10,300).
Median net earnings for full-time self-employed workers declined sharply between 2019 to 2020 and 2020 to 2021. The extent of this year-on-year change should be treated with caution, owing to the impact of the pandemic on the FRS, and the difficulty in capturing self-employed incomes data generally. For more on this, see the Background Information and Methodology which accompanies this publication.
See table 8.2 for full data.
Median net earnings of the self-employed, by gender and by part-time and full-time, FYE 2011 to FYE 2021, United Kingdom
Self-employed men continue to earn more than self-employed women.
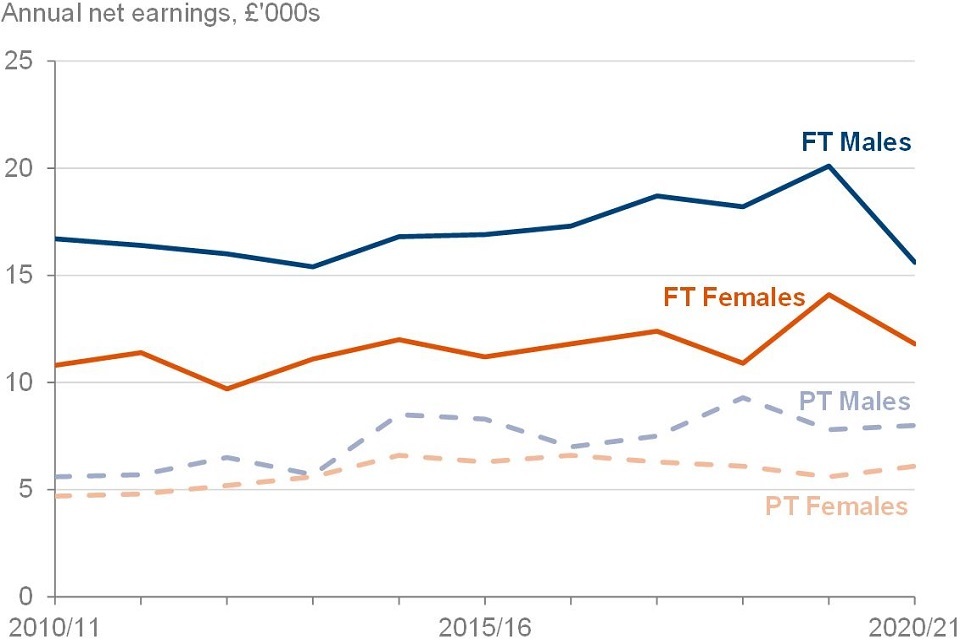
Median net earnings for self-employed men have remained consistently higher than those of self-employed women over time.
- for men who worked full-time, median net earnings were £15,600, 32% higher than the £11,800 of full-time women
- for men who worked part-time, the median net earnings were £8,000 compared to £6,100 for women who worked part-time
Consistent with each of the past ten years, the percentage difference in median net earnings between men and women is smaller for part-time workers (31%) than full-time workers, however only marginally so this year due to the large fall in median net earnings of full-time males.
See table 8.5 for full data.
Percentage of self-employed working full-time and part-time by gender, 2020 to 2021, United Kingdom
Self-employed men were more likely to work full-time than self-employed women.
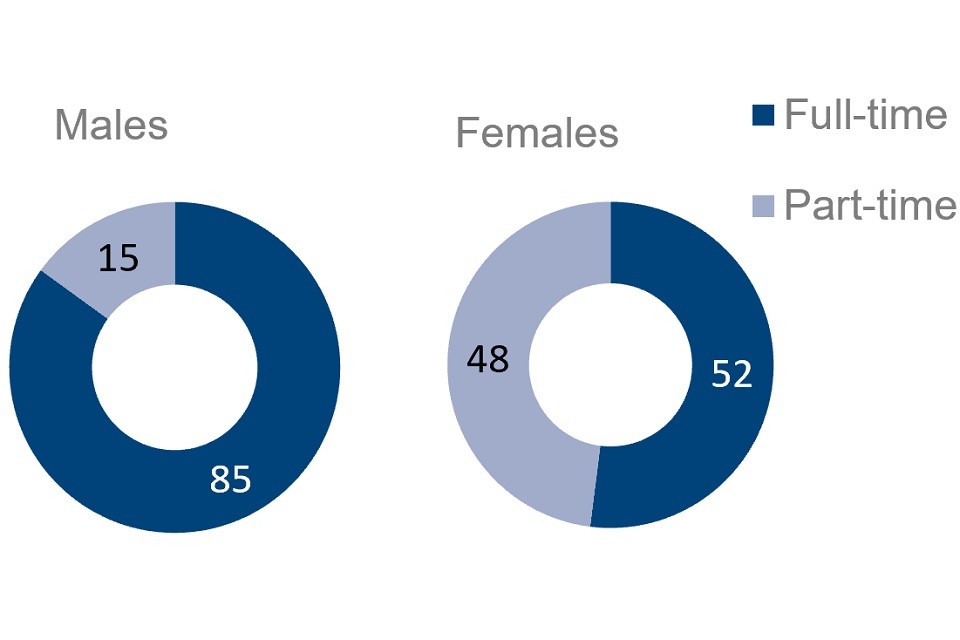
Of all self-employed men, nearly six out of seven were working full-time (85%). For self-employed women the difference between full-time and part-time working was more balanced.
See table 8.1 for full data.
10. Household Food Security
Introduction
Since April 2019, the FRS has asked questions on household food security. This measures whether households have sufficient food to facilitate an active and healthy lifestyle. Questions are asked of the person in the household who knows the most about buying and preparing food. In common with the rest of the FRS, the focus is on the period immediately before the interview (30 days).
The questions are comparable to those used by other public bodies in the UK, and also internationally. Further information on the approach is available in the background information and methodology.
These statistics should be treated with caution when interpreting them:
-
where a household is food insecure, information about the individual experiences of food insecurity within the household is not available. A young child’s experience in a food insecure household may be very different from their parent’s, for example
-
these statistics do not directly measure hunger. They instead explore the financial situation of households and how that affects their access to food. Only households with very low food security would anticipate substantive disruption to their food intake. For more information, see the background information and methodology section
Household food security status of all households, 2020 to 2021, United Kingdom
Most households in the UK were food secure.

Most households were food secure, with high household food security (88%) or marginal household food security (5%). A minority of households were food insecure, with low household food security (3%) or very low household food security (3%). The proportion of households that are food secure has increased by one percentage point from 92% in 2019 to 2020 to 93% in 2020 to 2021.
Geographically there were differences in the reporting of food security. Wales was most food secure (87% high; 10% marginal), England and Scotland were the least food secure at 93%, though Scotland had more households in the high food security bracket (91% high; 2% marginal) than England (88% high; 5% marginal).
Within England the rate varied to a larger extent between regions:
- households in the North East (81% high; 8% marginal) were the least likely to be food secure
- households in the South East (92% high; 4% marginal) and South West (93% high; 3% marginal) were the most likely to be food secure
See table 9.1 for more data.
Households by total gross weekly income and household food security status, 2020 to 2021, United Kingdom
As income increases, households were more likely to be food secure.
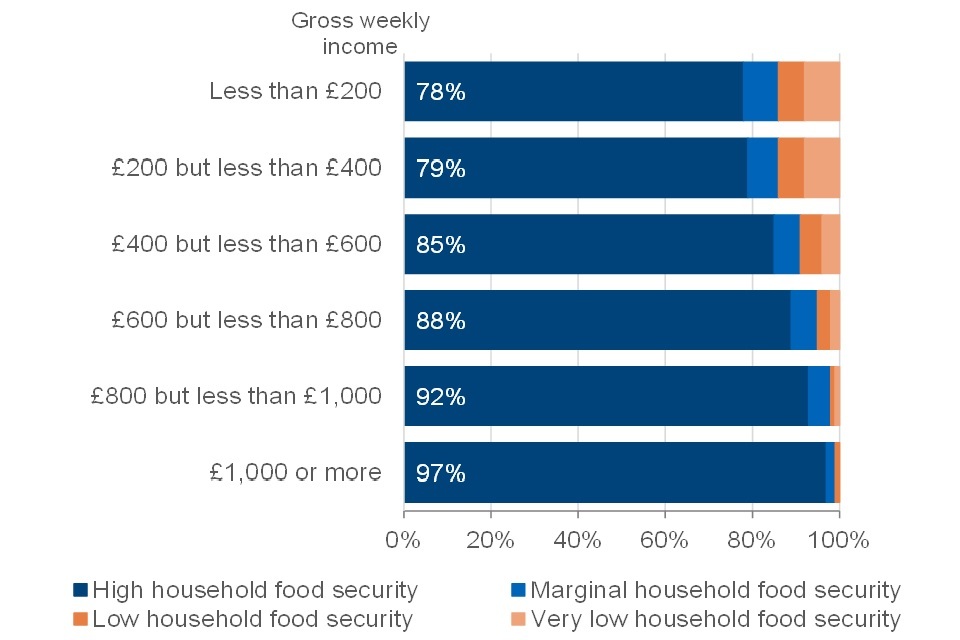
Households on higher weekly incomes were more likely to be food secure:
- households with gross incomes of less than £200 per week (7% of households) were the least likely to be food secure (78% high; 8% marginal)
- households with gross incomes of £1,000 or more per week (28% of households) were the most likely to be food secure (97% high; 2% marginal)
See table 9.8 for more data.
Age group of head of household by household food security status, 2020 to 2021, United Kingdom
Household food security was lower in households where the head is below the age of 65.
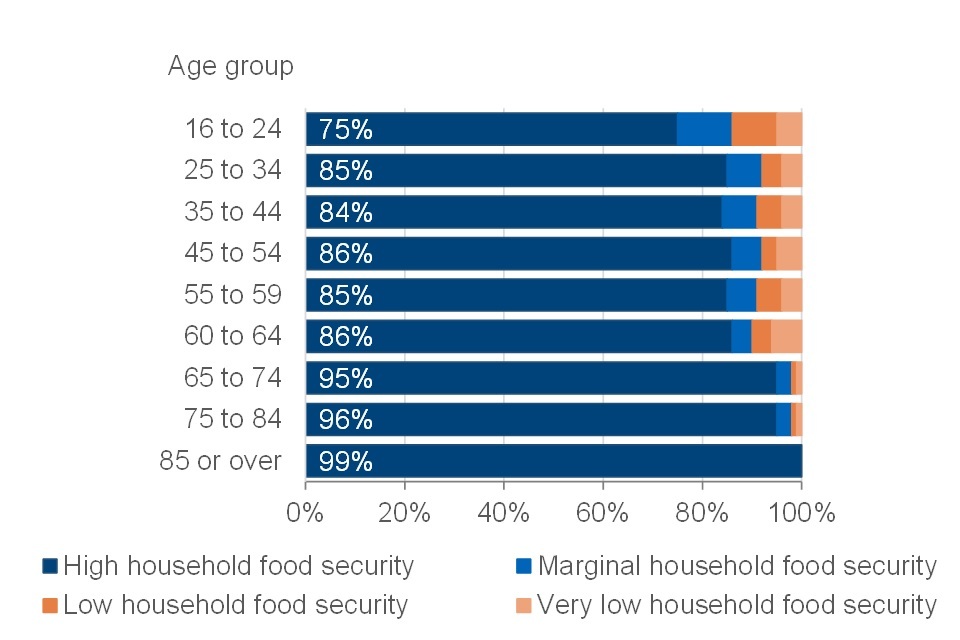
Households where the head is aged 25 to 64 display similar levels of food security. In contrast, the proportion of food secure households is greater where the head is aged 65 and above, indicating that households with a working-age head are less likely to be food secure than households with a State Pension age head.
- households where the head was aged 16 to 24 years were the least likely to be food secure (75% high; 11% marginal)
- households where the head was aged 85 and over were the most likely to be food secure (99% high)
See table 9.3 for more data.
Educational attainment of head of household by household food security status, 2020 to 2021, United Kingdom
Household food security was greater where the head of household has a higher level of qualification.
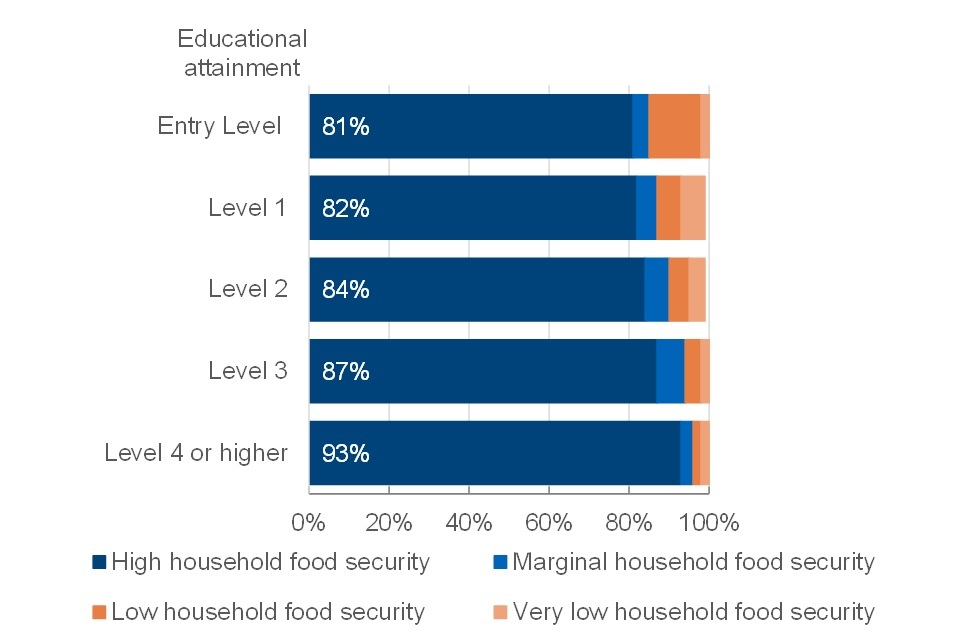
The likelihood of a household being food secure increased with the level of educational attainment:
- households where the educational attainment of the head is Entry level (such as Entry Level Awards and Entry Level Functional Skills) were the least likely to be food secure (81% high; 4% marginal)
- households where the head had a qualification of Level 4 or higher (higher education qualifications, such as degrees) were the most likely to be food secure (93% high; 3% marginal)
For information on how education levels are harmonised between Scotland and other parts of the UK, see the GSS harmonised standard on Qualifications
See table 9.5 for more data.
Ethnic group of head of household and household food security status, 2020 to 2021, United Kingdom
Household food security varied depending on the ethnic group of the head.
- households that were most likely to be food secure had an Indian head of household (92% high; 4% marginal)
- where the head of the household was White, the proportion of food insecure households was small (3% low; 3% very low), although the absolute number of these households was substantially larger than those of other ethnic groups, due to the size of the group among the population
- households that were most likely to be food insecure had a Black head of household (9% low; 12% very low)
See table 9.6 for more data.
Households by composition and household food security status, 2020 to 2021, United Kingdom
Single-adult households with children had low rates of household food security.
The household food security questions do not ask about children directly. However, the questions can give an indication of the food security status of households that children live in. There was high variability between different types of households with children:
- households with two adults and children had rates of household food security that were similar to the national average (87% high; 6% marginal)
- households with one adult and children (9% low; 10% very low) were more likely to experience food insecurity than single-adult households without children (4% low; 5% very low). They also show larger rates of food insecurity than households with children but more than one adult:
- children, two adults (4% low; 3% very low)
- children, three or more adults (4% low; 2% very low)
See table 9.2 for more data.
Households by tenure and household food security status, 2020 to 2021, United Kingdom
Households in the Social-renting sector were most likely to be food insecure.
Food security varied by tenure; households in the social renting sector (66% high; 12% marginal) and private renting sector (82% high; 7% marginal) were less likely to be food secure than all owner households (95% high; 3% marginal).
These differences were larger where the head of household was working age:
- households in the Social-renting sector and with a working-age head were the least likely to be food secure (58% high; 14% marginal)
- households in the Private-renting sector and with a working-age head were more likely to be food secure (81% high; 7% marginal)
- owned households (either owned outright or owned with a mortgage) and with a working-age head were the most likely to be food secure (94% high; 4% marginal)
See table 9.9 for more data.
11. About these statistics
The regulatory arm of the UK Statistics Authority, the Office for Statistics Regulation, has designated the Family Resources Survey as National Statistics, in accordance with the Statistics and Registration Service Act 2007 and signifying compliance with the Code of Practice for Statistics.
National Statistics status means that official statistics meet the highest standards of trustworthiness, quality and public value and comply with all aspects of the Code. The Office for Statistics Regulation has undertaken this assessment to consider whether the statistics meet the required standard.
It is DWP’s responsibility to maintain compliance with the standards expected of National Statistics. If DWP becomes concerned about whether these statistics are still meeting the appropriate standards, we will discuss any concerns with the Office for Statistics Regulation. National Statistics status can be removed at any point when the highest standards are not maintained, and reinstated when standards are restored.
Read further information about National Statistics.
DWP considers that all Family Resources Survey statistics in this publication are “Fully Comparable at level A” of the UK Countries Comparability Scale across countries.
Other National and Official Statistics
Read about other DWP statistics.
DWP announce the release dates of National and Official Statistics, in accordance with the Code.
Status and Development
These statistics underwent a full assessment against the Code of Practice for Statistics in 2011 and were confirmed as National Statistics in November 2012 by the Office for Statistics Regulation.
Since this latest review by the Office for Statistics Regulation, we have continued to comply with the Code of Practice for Statistics, and have made a number of improvements which are described in the background information and methodology section.
For the 2020 to 2021 survey year we have also made these improvements:
- we have amended our reporting of ethnic background to fully reflect that this is self-declared. Representation rates are now calculated from known declarations only and exclude ‘choose not to declare’ and ‘unknown’. To ensure meaningful representation rates for a diversity field, a minimum 60% declaration level is applied
- new questions and variables have been added to reflect changes in policy, such as benefit changes in some areas of the United Kingdom. This enables related policy analysis to be conducted
- a variety of questions required for monitoring the impact of the Coronavirus pandemic, such as questions on the Coronavirus Job Retention Scheme (CJRS) scheme were added in May and questions on the Self-Employed Income Support Scheme (SEISS), were added to the questionnaire from June onwards. Full details are provided in the FRS background information and methodology
12. Using the FRS for analysis
The Family Resources Survey is designed to be representative of all private households in the United Kingdom. Some individuals are not included, for example, students in halls of residence or residents of nursing homes.
While the data for 2020 to 2021 has undergone extensive quality assurance prior to publication, we recommend that users exercise caution when using the data for 2020 to 2021, particularly when making comparisons with previous years.
Sample design and size
The Family Resources Survey uses a stratified, clustered, random sample. This is designed to produce robust regional estimates. The data is not suitable for analysis below regional level.
The achieved sample in the 2020 to 2021 survey year was just over 10,000 households. This is materially fewer than a typical FRS year, when the achieved sample is normally between 19,000 and 20,000 households. However, it is still a relatively large sample when compared to other household surveys.
The smaller achieved sample has resulted in many more subgroups where the estimates would be liable to suppression, as the set threshold for suppression has historically been 100 observations. To enable the release of as many estimates as possible (and rather than combine several years or several categories of data), we have decided to apply a threshold of 30 observations this year. This is in broad alignment with other survey-based publications, and great care has been taken ensure that there is no risk of disclosure from this lower threshold.
Sampling Error
Results from surveys are estimates and not precise figures. In general terms, the smaller the sample size, the greater the uncertainty of the estimates. Results in this report are subject to a margin of error which can affect how changes should be interpreted, especially between groups and in the short term.
This year it has been challenging to disentangle how much of the change seen in the composition of the sample and estimates reflects genuine change and how much is due to sample bias. During the coronavirus (COVID-19) pandemic there was unprecedented change in both household circumstances and incomes which were not comparable to any previous survey period.
For example, while some of the change in disability may have been genuine, we believe a substantial portion of it was due to sample bias. This is because we are unable to explain some of the changes in the sample with reference to changes in the real world. We saw notable decreases in numbers reporting other types of impairment such as in hearing, memory or vision, compared to previous years. This was likely a consequence of the change in mode rather than a real-world reduction in prevalence.
Non-Sampling Error
Non-sampling errors are systematic inaccuracies in the sample when compared with the population. For example, people may give inaccurate responses, or certain groups of people may be less likely to respond.
Non-sampling error is minimised in the Family Resources Survey through effective and accurate sample and questionnaire design, active fieldwork management, the use of skilled and experienced interviewers and extensive quality assurance of the data.
However, it is not possible to eliminate non-sampling error completely, nor can it be easily quantified. Relative to administrative records, the Family Resources Survey is known to under-report benefit receipt.
Where to find out more
Further outputs and tables, together with a detailed background note and methodology document including a description of methodology, definitions, general guidance and alternative data sources, are available on the
Family Resources Survey home page.
A guide to the different definitions of earnings and income, with information on alternative sources of data, is available.
A guide to contrasting income and earnings statistics to help identify the most appropriate statistic, describing the source data, output data and availability, the concept being measured, its main strengths, limitations and uses.
If you would like more information on these statistics, then please visit the income and earnings interactive tool where you can filter by government department and country of interest to find relevant statistics.
The background information and methodology document provides further detail on the reliability of estimates.
Lead Statistician: M A Vaughan
ISBN: 978-1-78659-404-4