Public electric vehicle charging infrastructure statistics: 1 July 2026
Published 27 August 2026

© Crown copyright 2026
This publication is licensed under the terms of the Open Government Licence v3.0 except where otherwise stated. To view this licence, visit nationalarchives.gov.uk/doc/open-government-licence/version/3 or write to the Information Policy Team, The National Archives, Kew, London TW9 4DU, or email: psi@nationalarchives.gov.uk.
Where we have identified any third party copyright information you will need to obtain permission from the copyright holders concerned.
This publication is available at https://www.gov.uk/government/statistics/electric-vehicle-charging-infrastructure-statistics-1-july-2026/public-electric-vehicle-charging-infrastructure-statistics-1-july-2026
Visit the electric vehicle charging infrastructure statistics collection page to browse the latest available statistics for electric vehicle charging in the United Kingdom.
About this release
This release presents statistics on publicly available electric vehicle charging infrastructure in the United Kingdom.
Data is provided by individual charge point operators (CPOs) as set out in the Public Charge Point Regulations 2023 guidance and collated by Zapmap for use by the Department for Transport (DfT). The data presented in this release is correct as of 1 July 2026.
Further information can be found in the about these statistics section.
The next quarterly report is scheduled for release in November 2026.
Headline figures
As of 1 July 2026, in the United Kingdom, there were:
- 121,171 public EV chargers
- 174.9 public EV chargers per 100,000 of the population
- 28,887 public EV chargers that were rated rapid or above (50kW+)
- 41.7 public EV chargers rated rapid or above per 100,000 of the population
As of 1 January 2026, this statistical series focuses on publicly available ‘EV chargers’ (EVSE) in the United Kingdom, replacing the previous measure of ‘charging devices’. More information about the introduction of EV charger statistics can be found in the frequently asked questions document.
As of the 1st of April 2026[footnote 1], in the United Kingdom:
- there was one public EV charger for every 17 battery electric vehicles (BEVs)
More information on the ratio of public EV chargers to BEVs can be found in EVCI0401.
Chart 1: Number of public EV chargers from January 2023 and public charging devices from 2019: United Kingdom (EVCI9001)

Chart 1 is a line chart presenting the number of public EV chargers in each quarter since January 2025, and annual industry estimates since January 2023, compared to the number of public charging devices in each quarter since October 2019.
The chart shows that as of 1 July 2026:
- there were 121,171 public EV chargers
- there were 97,266 public charging devices
Chart 2: Cumulative growth of the public EV charger network per calendar year: United Kingdom, 2025 to present (EVCI0101)
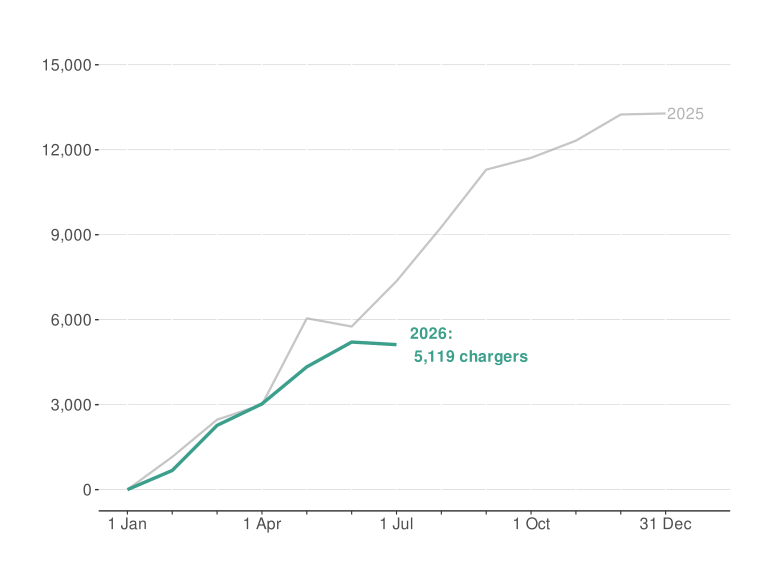
Chart 2 is a line chart showing the cumulative growth of the number of public EV chargers during each calendar year since 1 January 2025.
The chart shows that, as of 1 July 2026:
- 5,119 public EV chargers have been added to the network so far this year
- This compares to a total of 13,281 public EV chargers that were added to the network by the end of 2025
One charge point operator (CPO) removed approximately 1,270 EV chargers from their publicly available open charging data in June 2026. These were private access chargers reported improperly as public chargers in this CPO’s data feed. The 2026 trend shown in Chart 2 was affected by this.
Industry estimates provided by Zapmap indicate that:
- 24,557 EV chargers were added to the public network in 2024
- 20,662 EV chargers were added to the public network in 2023
These estimates fall outside the scope of official statistics and do not appear in tables published on the EVCI data tables page.
EV chargers by power rating
EV chargers are organised into power bands that reflect their typical use‑cases and the different charging needs often required at different public locations.
EV chargers in higher power bands can charge vehicles more quickly.
Further information about power bands can be found in the frequently asked questions document.
The power bands and their associated labels as used in these statistics are:
-
3kW to less than 8kW: standard
-
8kW to less than 50kW: standard plus
-
50kW to less than 150kW: rapid
-
150kW and above: ultra-rapid
Different power bands and descriptive labels may be used across the EV charging industry.
Chart 3: Public EV chargers by power band: United Kingdom, 1 July 2026 (EVCI0201)

Chart 3 is a doughnut chart presenting the percentage of public EV chargers in each power banding.
It shows that as of 1 July 2026:
-
49% of EV chargers were rated standard (3kW to less than 8kW)
-
27% were rated standard plus (8kW to less than 50kW)
-
12% were rated rapid (50kW to less than 150kW)
-
12% were rated ultra-rapid (150kW and above)
Geographical distribution of EV chargers
Chart 4: Total and 50kW and above (rapid or above) public EV chargers per 100,000 of the resident population, by country and region: United Kingdom, 1 July 2026 (EVCI0101)

Chart 4 is a nested bar chart comparing EV chargers per 100,000 of the resident population across United Kingdom countries and regions for both total and rapid or above EV chargers.
It shows that as of 1 July 2026:
-
regional variation is lower for rapid and above chargers than for total chargers
-
London has many more public chargers per capita than the rest of the United Kingdom, yet the second‑lowest per capita rated rapid or above, as much of its public charging infrastructure comprises standard on‑street chargers
The figures used in chart 4 can be found in Annex A.
Map 1: Public EV chargers per 100,000 of the resident population by strategic and local authorities, United Kingdom, 1 July 2026 (EVCI0102, EVCI0105, EVCI0106)

Map 1 is a map of strategic and local authorities in the United Kingdom. It compares public EV charging provision per 100,000 of the resident population of each authority.
It shows that, as of 1 July 2026:
- there was variation in public EV charger provision across all authorities
- There was typically higher than average provision in Scotland, Wales, and the Greater London Authority
Map 1 uses a mixture of geography types to provide complete coverage across the United Kingdom. England is represented by Local Transport Authorities (LTAs), which have responsibility for local transport planning and EV charging strategies. LTAs are combined authorities where these exist, the Greater London Authority for London, and upper tier local authorities (county councils and unitary authorities) in areas not covered by a combined authority. Scotland, Wales, and Northern Ireland are represented at local authority district level.
The data for Map 1 can be found in (EVCI0105) for combined authorities, (EVCI0106) for county councils and (EVCI0102) for unitary authorities.
Chart 5: Public EV chargers by rural urban classification: England and Wales, 1 July 2026 (EVCI0104)

Chart 5 is a doughnut chart comparing the percentage of EV chargers in rural and urban areas of England and Wales according to the ONS 2021 rural urban classification.
It shows that as of 1 July 2026:
-
16.7% of public EV chargers in England and Wales were located in rural areas, compared to 17.5% of the population that lives in rural areas.
-
83.3% of public EV chargers in England and Wales were located in urban areas, compared to 82.4% of the population that lives in urban areas.
EV chargers available for different journey types
EV chargers are grouped into location classifications that reflect the service they provide for various charging needs and journey types.
‘Destination’ EV chargers are located at the end of a journey or where a driver may stop for an extended period. This includes chargers in car parks and standard or standard plus chargers at hospitality premises.
‘On street’ EV chargers are typically located on residential streets and provide local public charging infrastructure.
‘En-route’ EV chargers provide charging to continue journeys. This includes chargers at motorway service areas and rapid or above chargers at hospitality premises.
‘Other’ charging devices are semi-public with some level of access restrictions such as workplace car parks and dealership forecourts.
Chart 6: Public EV chargers by location classification: United Kingdom, 1 July 2026 (EVCI0301)

Chart 6 is a doughnut chart presenting the percentage of public EV chargers in each location classification.
It shows that as of 1 July 2026:
-
52% were classed as destination EV chargers
-
33% were classed as on-street EV chargers
-
11% were classed as en-route EV chargers
-
4% were classed as other EV chargers
About these statistics
These statistics are released under the official statistics in development label. Official statistics in development are official statistics that are temporarily undergoing a development and are being tested with users, in line with the standards of trustworthiness, quality, and value in the Code of Practice for Statistics.
Please note that percentages may not always sum to 100 due to rounding.
Data tables including additional breakdowns are available on the EVCI data tables page.
Further information about these statistics is available on the electric vehicle charging infrastructure statistics information page.
Annex
Annex A: Total and 50kW and above (rapid or above) public EV chargers per 100,000 of the resident population, by country and region: United Kingdom, 1 July 2026 (EVCI0101)
| Region | EV chargers per 100,000 population | 50kW and above (rapid or above) EV chargers per 100,000 population |
|---|---|---|
| United Kingdom | 174.9 | 41.7 |
| North East | 150.2 | 37.1 |
| North West | 112.1 | 40.0 |
| Yorkshire and the Humber | 110.7 | 36.6 |
| East Midlands | 121.5 | 46.7 |
| West Midlands | 164.0 | 45.7 |
| East of England | 150.2 | 48.8 |
| London | 345.1 | 27.9 |
| South East | 159.4 | 39.7 |
| South West | 156.7 | 49.5 |
| Wales | 185.5 | 42.8 |
| Scotland | 231.6 | 59.1 |
| Northern Ireland | 60.0 | 19.3 |
-
This statistic uses data as of 1 April 2026 as data on number of vehicles for July 2026 is not yet available. Updated figures will be available in a subsequent quarterly publication following the publication of vehicle licensing data. Dates of future releases will be advertised via the DfT statistical publications schedule. More information on the ratio of EV chargers to BEVs can be found in EVCI0401. ↩