Detailed analysis of response times to fires attended by fire and rescue services: England, April 2020 to March 2021
Published 3 February 2022
Applies to England

© Crown copyright 2022
This publication is licensed under the terms of the Open Government Licence v3.0 except where otherwise stated. To view this licence, visit nationalarchives.gov.uk/doc/open-government-licence/version/3 or write to the Information Policy Team, The National Archives, Kew, London TW9 4DU, or email: psi@nationalarchives.gov.uk.
Where we have identified any third party copyright information you will need to obtain permission from the copyright holders concerned.
This publication is available at https://www.gov.uk/government/statistics/detailed-analysis-of-response-times-to-fires-england-april-2020-to-march-2021/detailed-analysis-of-response-times-to-fires-attended-by-fire-and-rescue-services-england-april-2020-to-march-2021
Frequency of release: Annual
Forthcoming releases: Home Office statistics release calendar
Home Office responsible statistician: Tom Cracknell
Press enquiries: pressoffice@homeoffice.gov.uk
Telephone: 0300 123 3535
Public enquiries: firestatistics@homeoffice.gov.uk
Since the publication of the last annual response times release, headline findings on average response times to fires by type of fire have been added to the quarterly Fire and Rescue Incident Statistics[footnote 1]. This release, therefore, provides more detailed analysis of the already published fire response times for the financial year 2020 to 2021. As well as a recap of the average response times to fires in the year ending March 2021, the release provides further analysis of response times by Fire and Rescue Authority (FRA) type, response time components, the distribution of response times by one-minute bands and response times and outcomes. The release also includes a section covering average weekly response times during periods of COVID national lockdown versus baseline figures.
Key results
As previously published, the average response time to primary fires in the year ending March 2021 was 8 minutes and 35 seconds: a decrease of eight seconds compared with the previous year. The largest component was drive time which decreased by eight seconds to 5 minutes and 38 seconds. FRSs attended 151,129 fires in the year ending March 2021, a two percent decrease compared with the previous year.
Of the 28 weeks during year ending March 2021 in which national lockdowns were in force, 14 had average response times to primary fires that were below the expected range (versus average weekly baseline figures based on the previous 5 years).

Summary of total response time trends
Total response time is the minutes and seconds elapsed from the time of call to the arrival of the first vehicle to the incident.
The following incidents are not included in response time totals:
a. Road vehicle fires, where the road vehicle was abandoned.
b. Where the location of the fire was a derelict property.
c. Where an FRS learned of the fire when it was known to have already been extinguished (known as “late calls”).
d. Where the total response time for an incident was over an hour or less than one minute (to avoid erroneous data or exceptional incidents from skewing the averages).
e. Where the sequence of events (time of call - mobilisation - vehicle mobile - arrival at scene) in an incident is not recorded in a logical sequence, either through recording error (e.g. a vehicle appears to have arrived before it left) or absence of data (null values).
To provide context for the rest of the report, as previously published, in the year ending March 2021:
-
the average total response time to primary fires (potentially more serious fires that could harm people or cause damage to property)[footnote 2] in England was 8 minutes and 35 seconds: a decrease of eight seconds since the previous year (Source: FIRE1001)
-
three types of primary fires showed a decrease in average response times (dwellings by ten seconds, other buildings by one second and road vehicles by 13 seconds), while other outdoor primary fires (by far the smallest category of primary fire) increased by 2 seconds
-
the average total response time to secondary fires (which can broadly be thought of as smaller outdoor fires, not involving people or property) in England increased by five seconds, compared with the previous year, to 9 minutes and 23 seconds
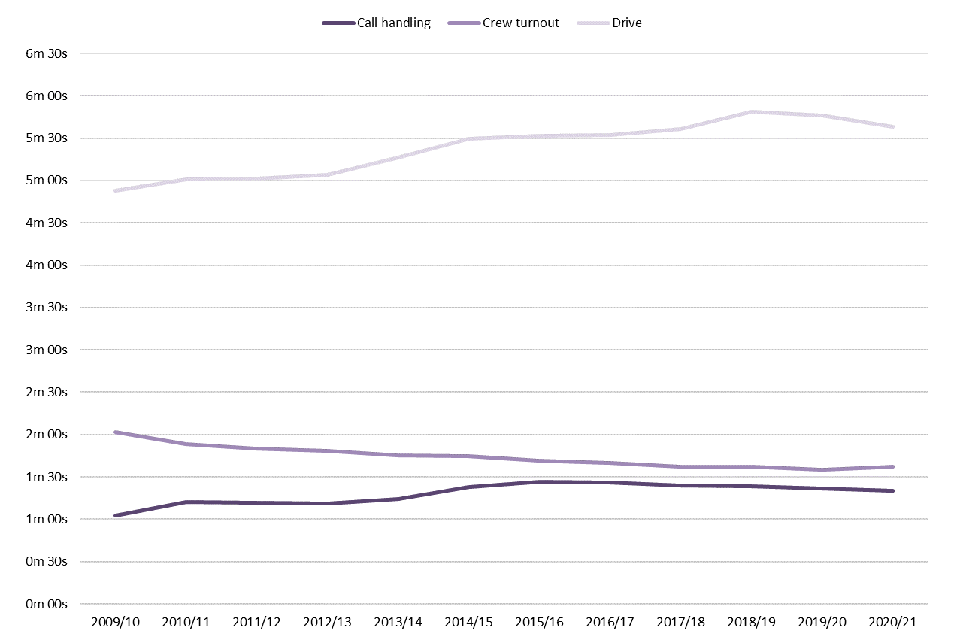
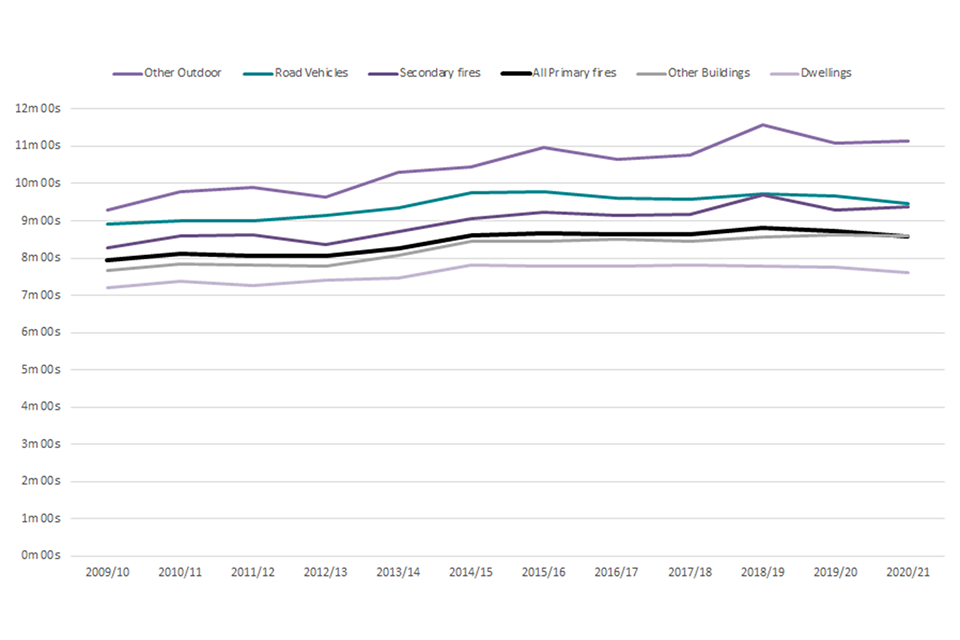
Overall, response times to fires increased gradually between year ending March 1995 and year ending March 2015, since then there has been a general plateau. The average total response time to primary fires in year ending March 2021 was 8 minutes and 35 seconds, an increase of 28 seconds over the past decade, but a decrease of five seconds in the past five years - the pattern across different types of fire was varied (see Figure 1.1).
Figure 1.1: Average total response times (minutes) by type of fire, England; year ending March 2010 to year ending March 2021
Total response times by type of Fire and Rescue Authority (FRA)
Of the 45 fire and rescue authorities (FRAs)[footnote 3], 30 showed a decrease in average total response time to primary fires between year ending March 2020 and year ending March 2021 (average decrease of 21 seconds) and 15 showed an increase (average increase of 14 seconds). Source: FIRE1001.
FRAs can be split into three rural-urban classifications (predominantly rural, significantly rural and predominantly urban)[footnote 4] and by whether they are metropolitan or non-metropolitan[footnote 5].
Table 2.1: Response times to primary fires by type of FRA with a summary of trends, England; year ending March 2020 to year ending March 2021
| Type of FRS | 2020/21 | 2019/20 | Change since 2019/20 | 2015/16 | Change since 2015/16 | 2010/11 | Change since 2010/11 |
|---|---|---|---|---|---|---|---|
| Predominately rural | 10m 28s | 10m 27s | +1 second | 10m 18s | +10 seconds | 9m 54s | +34 seconds |
| Significantly rural | 9m 45s | 9m 53s | -8 seconds | 9m 38s | +7 seconds | 8m 48s | +57 seconds |
| Predominately urban | 7m 27s | 7m 37s | -10 seconds | 7m 41s | -14 seconds | 7m 15s | +12 seconds |
| Metropolitan | 6m 57s | 7m 07s | -10 seconds | 7m 16s | -19 seconds | 7m 02s | -5 seconds |
| Non-metropolitan | 9m 39s | 9m 46s | -7 seconds | 9m 35s | +4 seconds | 8m 51s | +48 seconds |
Source: FIRE1001
Average response times to primary fires are quicker in predominantly urban areas and quicker still in the subset of predominantly urban FRAs which are metropolitan. The difference in average total response times between predominantly urban and predominantly rural FRAs has been around two to three minutes every year since year ending March 2010. All types of FRA exhibited gradual increases in average response time between year ending March 2010 and year ending March 2019 before decreasing in the last two years. This was likely due in part to the reduced traffic levels seen at various times throughout the last two years as a result of government guidance related to travel and restrictions on social activity, including three national lockdowns, in response to the coronavirus pandemic. See Figure 2.1 for further detail.
Figure 2.1: Average total response times (minutes) to primary fires by type of fire authority, England; year ending March 2010 to year ending March 2021
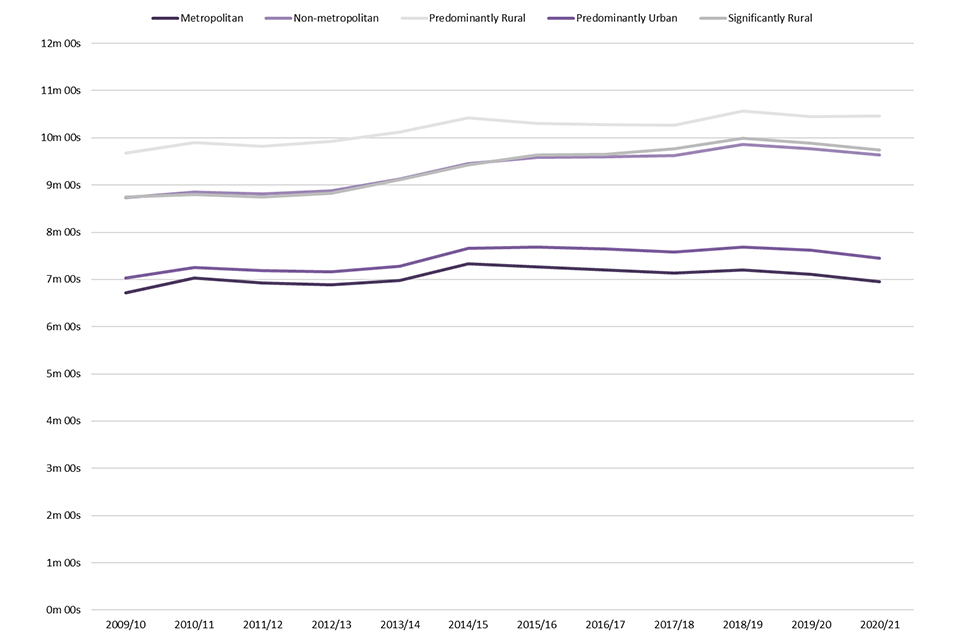
Source: FIRE1001
Response times components
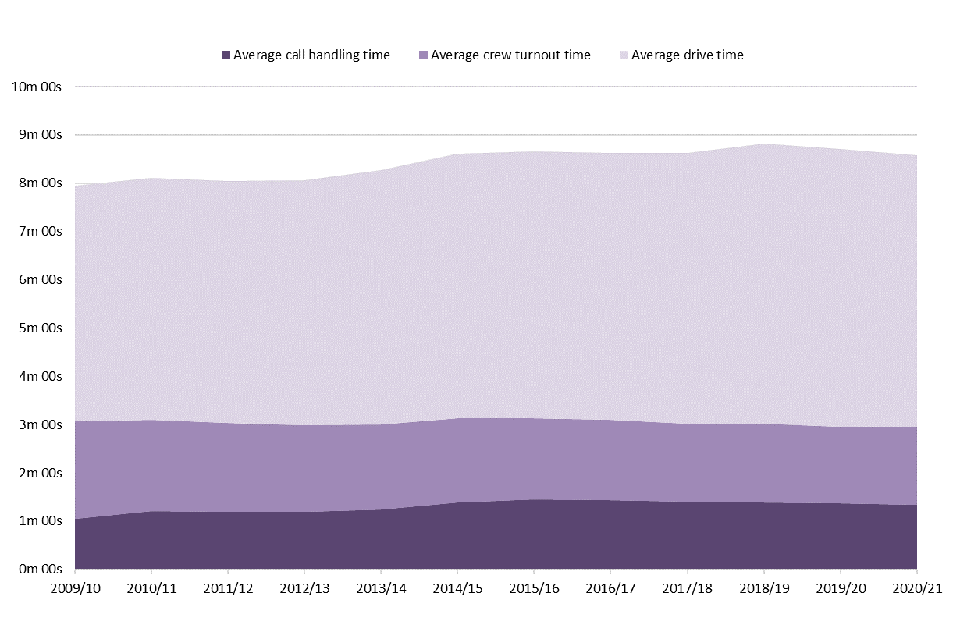
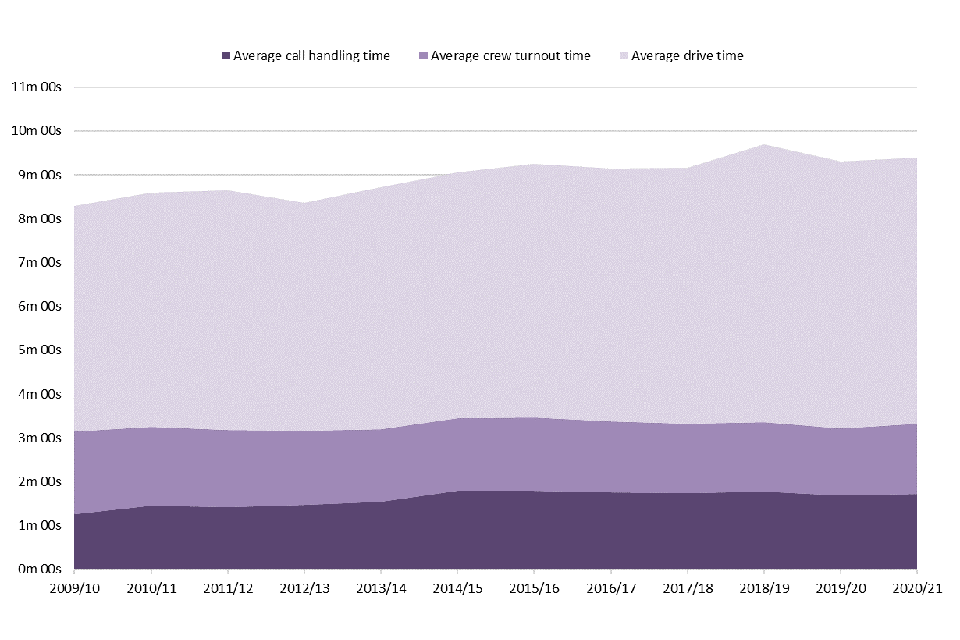
The total response time (from time of call to time of first arrival) can be divided into call handling time, crew turnout time and drive time. This is the fourth year that these breakdowns of the average response time have been published, in response to user need and to help explain which parts of the emergency response chain have changed over time. These data are drawn from the electronic IRS and so are only available from year ending March 2010 onwards (see FIRE1001).
Call handling time is the duration between the time of call and the point at which the station is alerted.
Crew turnout time is the duration between the time at which the station is alerted and the time the first vehicle departs, i.e. the time it takes for the firefighters to prepare to leave.
Drive time is the duration between the time the first vehicle leaves to the time at which the first vehicle arrives at the scene of the incident (not necessarily the same vehicle).
Key results
In year ending March 2021:
-
the average call handling time for primary fires decreased by two seconds compared with the previous year to 1 minute 20 seconds, the fifth consecutive decrease since a peak of 1 minute 27 seconds in year ending March 2016
-
the average crew turnout time for primary fires increased by two seconds compared with the previous year to 1 minute 37 seconds, this follows a period of general decrease since year ending March 2010
-
the average drive time for primary fires decreased by eight seconds compared with the previous year to 5 minutes 38 seconds, the second consecutive decrease following a period of general increase since year ending March 2010
The average call handling time for primary fires increased between year ending March 2010, the first year in which response time component data became available, and year ending March 2011 and then remained broadly stable at around 1 minute 11 seconds until year ending March 2013. There was then a period of successive increases which peaked at 1 minute 27 seconds in year ending March 2016 followed by decreases in each year since (see Figure 3.1). The average call handling time for secondary fires has followed a similar trend over the same period, although has exhibited slightly more variability in the last four years (see Figure 3.2).
The average crew turnout time for primary fires has been on a downward trend since data became available, from 2 minutes 2 seconds in year ending March 2010 to 1 minute 35 seconds in year ending March 2020. In year ending March 2021 there was a slight increase of two seconds to 1 minute 37 seconds (see Figure 3.1). The average crew turnout time for secondary fires has followed a similar trend over the same period (see Figure 3.2).
Crew turnout times for predominantly rural FRAs are typically a minute to a minute and a half longer than predominantly urban ones in each year, likely due to the higher proportion of on-call firefighters (also referred to as ‘retained duty system firefighters’) who first need to get to a station once alerted. Predominantly rural FRAs showed the greatest decrease in crew turnout time since year ending March 2013.
The average drive time to primary fires steadily increased from 4 minutes 53 seconds in year ending March 2010, the first year in which data became available, to a peak of 5 minutes 49 seconds in year ending March 2019. This was followed by a decrease of 3 seconds to 5 minutes 46 seconds in year ending March 2020 and a further decrease of 8 seconds in year ending March 2021 to 5 minutes 38 seconds (see Figure 3.1). The average drive time for secondary fires has followed a similar trend over the same period (see Figure 3.2).
Figure 3.1: Average response time (minutes) to primary fires by response time component, England; year ending March 2010 to year ending March 2021
Source: FIRE1001
Figure 3.2: Average response time (minutes) to secondary fires by response time component, England; year ending March 2010 to year ending March 2021
Source: FIRE1001
Response to dwelling fires has had the quickest times for all three of the response time components since data became available in year ending March 2010. This likely reflects the relative ease with which a street address can be communicated on the telephone and the urgency with which an FRS responds to fires with the greatest potential risk to life. Other outdoor fires, by contrast, are typically among the slowest responses in all three categories, which could reflect the difficulty of describing an outdoor location without a street address (call handling) and the difficulty of finding it once mobile (drive time).
The plateau and slight decrease in average total response time to primary fires between year ending March 2016 and year ending March 2018 (see Figure 1.1) was predominantly the result of decreases in crew turnout times in all FRA types. The decrease seen during the last two years (i.e. since year ending March 2019) was predominantly due to decreases in average drive time, which fell by 3 seconds in year ending March 2020 and 8 seconds in year ending March 2021. As previously mentioned, this was likely due in part to the reduced traffic levels seen at various times throughout the last two years as a result of government guidance related to travel and restrictions on social activity, including three national lockdowns, in response to the coronavirus pandemic.
A range of possible factors could have contributed to the general increase in average total response time to primary fires between year ending March 2011 and year ending March 2019 (see Figure 1.1). These may include changing traffic levels, ‘drive to arrive’ policies[footnote 6] and control staff typically asking more questions of the caller to better assess the risk and attendance needed. The possibility that changes to crew health and safety policies (e.g. that firefighters should dress in their personal protective equipment before boarding the appliance rather than en route in a moving vehicle) could have increased response times seems unlikely as there was a sustained reduction in crew turnout times during this period.
It should be noted that it is difficult to isolate the impact of any individual factor on response times. There may well be other factors not yet mentioned, local or national, which have an effect. Other factors that are of potential relevance here include the phenomenon of urban sprawl and new housing developments outdating the strategic positioning of fire stations.
Distribution of total response times
The previous chapters present (mean) average response times; however, many FRSs measure their performance based on the proportion of incidents attended within various target times. Fire statistics table FIRE1004 provides incident counts by one-minute bands (including 60 minutes) for primary and secondary fires.
Key results
In year ending March 2021:
-
the most common response time band for primary, dwelling, other building and secondary fires was six to seven minutes
-
43 per cent of all primary fires were responded to within seven minutes, up one percentage point compared with the previous year
-
52 per cent of dwelling fires were responded to within seven minutes, up one percentage point compared with the previous year
-
43 per cent of other building fires were responded to within seven minutes, up one percentage point compared with the previous year
-
34 per cent of secondary fires were responded to within seven minutes, no change compared with the previous year
For all fire types covered in this section (all primary fires dwelling, other building & secondary) the most frequent response time band was six to seven minutes. A greater proportion of dwelling fires were responded to within seven minutes (52%), relative to the other fire types, again likely due to the comparative ease of describing street addresses via telephone and the urgency with which FRSs respond to fires with increased risk to life or property. For both other building fires and all primary fires the proportion responded to within seven minutes was 43 per cent. A smaller proportion of secondary fires were responded to within seven minutes (34%) likely due to these incidents typically being less urgent and or occurring in more rural locations.
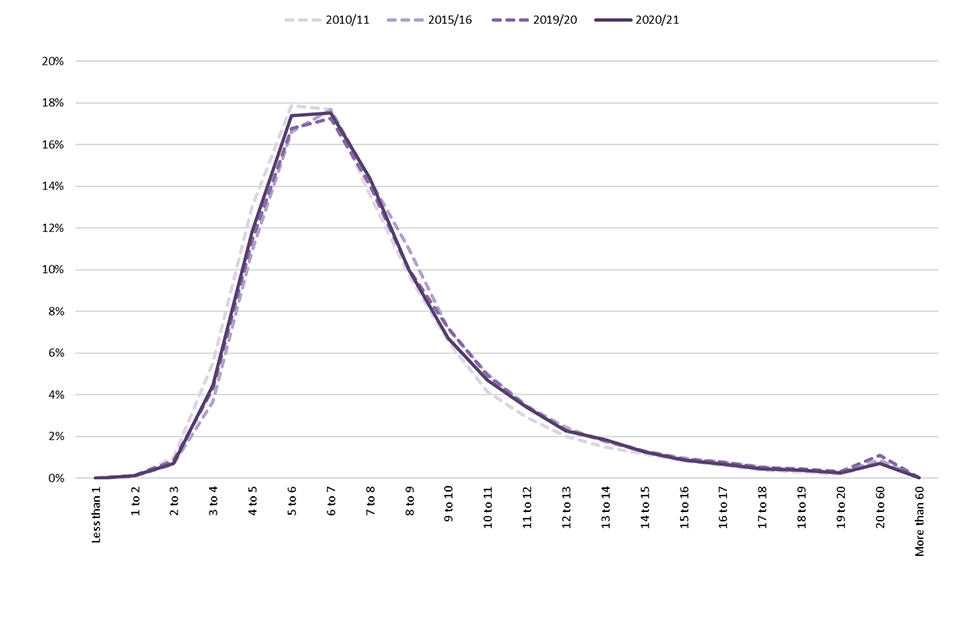
Figure 4.1: Proportion of primary fires in dwellings attended by FRSs in one-minute total response time bands, England; year ending March 2011, year ending March 2016, year ending March 2020 and year ending March 2021
Source: FIRE1004
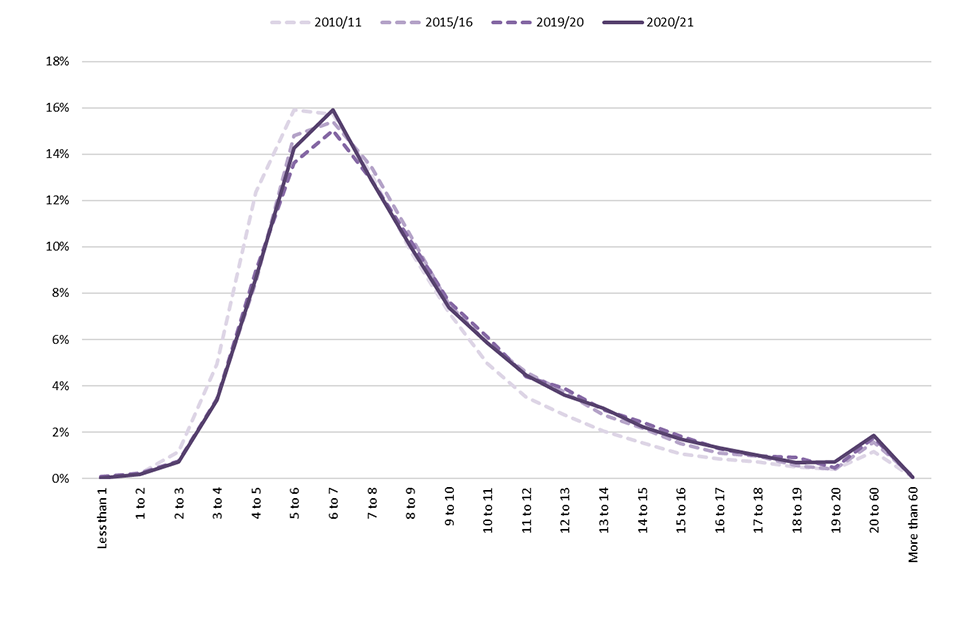
Figure 4.2: Proportion of primary fires in other buildings attended by FRSs in one-minute total response time bands, England; year ending March 2011, year ending March 2016, year ending March 2020 and year ending March 2021
Source: FIRE1004
Figures 4.1 and 4.2 show the proportional distribution of total response times by one-minute bands for primary fires in dwellings and other buildings in England.
The movement of both the year ending March 2016 curves to the right, relative to the year ending March 2011 curves, shows the general increase in the average response time to these two fire types during that period.
The minimal lateral movement of the year ending March 2020 curve for dwelling fires, relative to the year ending March 2016 curve, reflects the general plateau during that period. The year ending March 2021 curve for dwelling fires is slightly shifted to the left versus the year ending March 2020 curve due to the slight decrease in the average response time to dwelling fires during this period. Overall, the proportion of dwelling fires responded to in each time band has remained relatively stable over the last ten years.
The minimal lateral movement of both the year ending March 2020 and year ending March 2021 curves for other building fires, relative to the year ending March 2016 curve, reflects the general plateau in the average response time to this fire type during that period.
Response times and outcomes
There is no straightforward relationship between response times and the outcome of a fire. Many factors outside the control of FRSs will affect the outcome of fires including the type of fire and the time elapsed before the fire was discovered. However, assuming that slower response times may be associated with an increase in harms, this section looks at response times in relation to casualties, rescues, and areas of damage.
Key results
In year ending March 2021:
-
the average total response time to dwelling fires involving casualties and or rescues in England was 7 minutes 31 seconds, this was an eight second decrease compared with year ending March 2020 but an increase of 39 seconds since year ending March 2010
-
the average total response time to dwelling fires without casualties and or rescues was 7 minutes 37 seconds, this was a ten second decrease compared with year ending March 2020 but an increase of 23 seconds since year ending March 2010
-
the average area of fire damage to dwellings (excluding those incidents with areas of damage over 5,000m2) in England decreased from 16.2m2 in year ending March 2020 to 14.8m2 - at the same time the average response time to dwelling fires decreased by ten seconds (Source: FIRE0204 & FIRE1001)
Dwelling fires with casualties (including fatalities) and or rescues have had consistently faster average response times than dwelling fires with no casualties and or rescues (Figure 5.1). Although these comprise a relatively small number of incidents (10% of dwelling fires in the calculations since year ending March 2010 involved casualties and or rescues) so are potentially more susceptible to fluctuations in average response times, the pattern is consistent across all years in the series (between 9% and 10% in each year). This difference in response times to dwelling fires with casualties and or rescues compared with those without, is generally most strongly apparent in the drive time, which was 3 seconds faster in year ending March 2021. This suggests that while dwelling fires are responded to most quickly of all primary fire types (Table 1.1), response times appear to reduce even more for higher risk incidents which are likely to involve casualties or rescues if it has been possible to collect this information from the caller. To note, in year ending March 2021, the crew turnout time was also 3 seconds faster for dwelling fires with casualties and or rescues compared with those without - this is the first year since data became available in year ending March 2010 in which the drive time has not been the clear predominant source of the overall response time discrepancy.
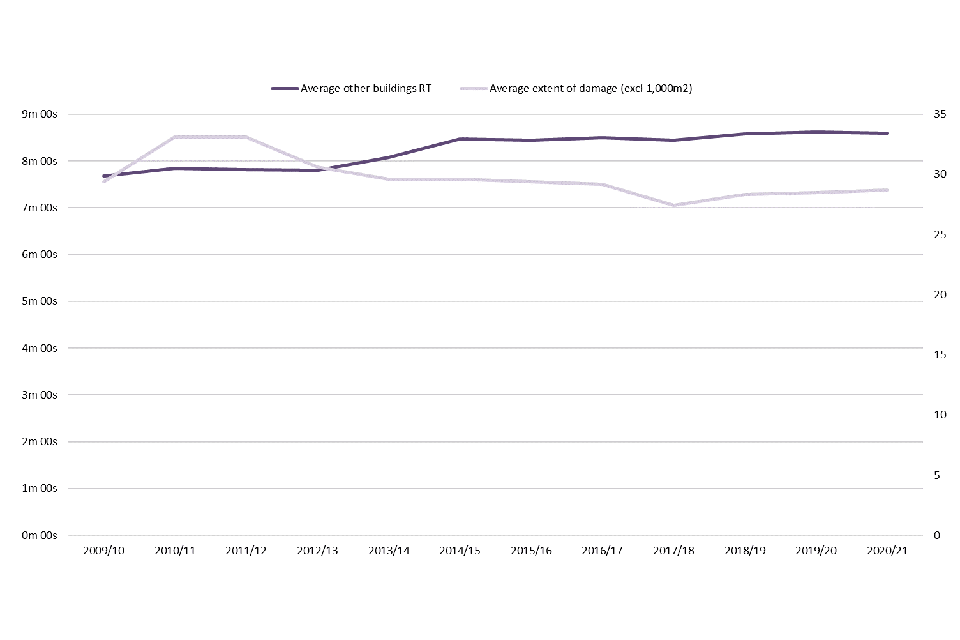
Between year ending March 2011 and year ending March 2019 average total response times generally increased, yet the average area of damage in both dwelling and ‘other building’ fires decreased (Figure 5.1, Figure 5.2). This would seem counterintuitive as it could be assumed that increased response time would have led to increased spread due to later starting of firefighter activity. However, this assumption may have been countered by improved early detection (the proportion of households with a working smoke alarm has remained high[footnote 7]), the gradual replacement of old furnishings with newer materials with improved fire resisting properties, new buildings with sprinkler systems and numerous other factors which are difficult to quantify. The last two years show a more mixed picture - response times have generally decreased, as has the average area of fire damage in dwelling fires, whereas the average area of fire damage in other buildings has marginally increased (Figure 5.1, Figure 5.2).
Figure 5.1: Average total response times (RT) to dwelling fires with and without casualties or rescues and average extent of damage (excluding 5,000+ m2) for dwelling fires, England; year ending March 2010 to year ending March 2021
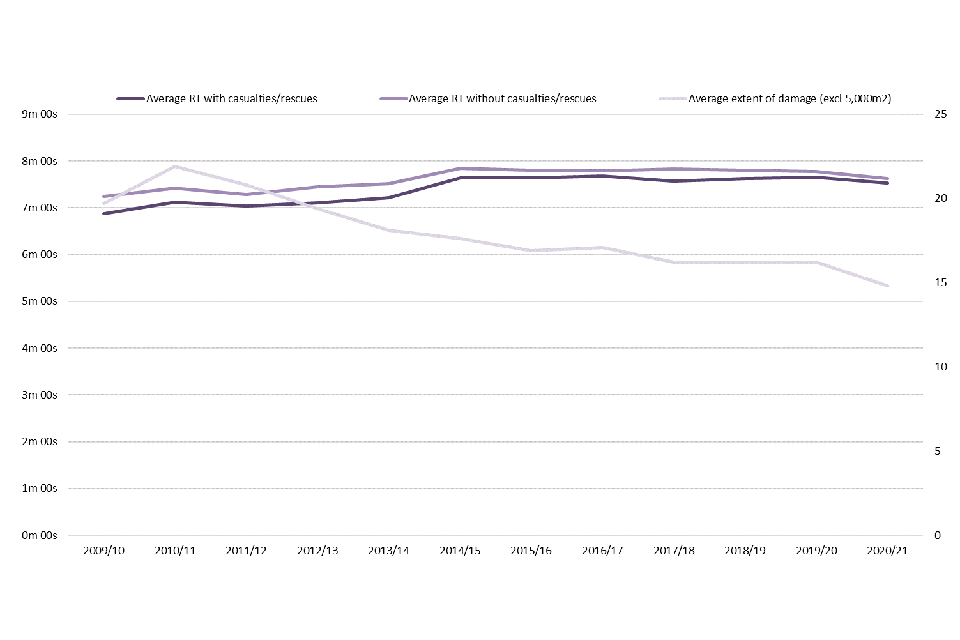
Figure 5.2: Average total response time (RT) and average extent of damage (excluding 1,000+ m2) for other building fires, England; year ending March 2010 to year ending March 2021
Fire and rescue response times during COVID-19 National Lockdowns
In response to the coronavirus (COVID-19) pandemic, the UK government introduced lockdown restrictions for several periods during year ending March 2021. These restrictions imposed strict limits on daily life, included significant restrictions on freedom of movement and a requirement by law for a range of businesses to close.
This section provides analysis of response times to primary and secondary fires attended by FRSs on a weekly basis from week commencing 29th March 2020 to week commencing 21st March 2021 compared against a baseline of the corresponding average weekly figures of the previous five years combined (year ending March 2016 to year ending March 2020)[footnote 8].
Weekly figures are highly susceptible to fluctuation and so an upper and lower range, using the mean and standard deviation of the year ending March 2016 to year ending March 2020 baseline figures, was calculated. Any figures beyond this range would fall outside of what would be expected, although these results could be explained by various factors such as bank holiday dates, the weather and not simply the lockdowns.
Figure 6.1: Average response time to primary fires, England, week commencing 29th March 2020 to week commencing 21st March 2021 compared with the year ending March 2016 to year ending March 2020 baseline
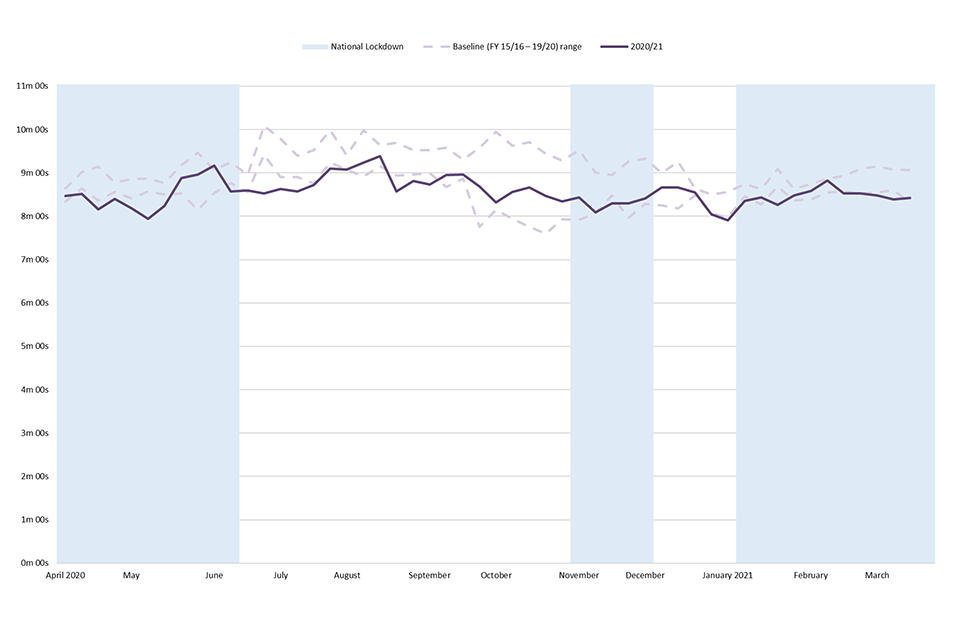
Eleven weeks of the first national lockdown are included in this analysis. In seven of these eleven weeks, there was an average response time to primary fires below what would be expected relative to the previous five-year baseline. There was one week during this period that had an average response time to primary fires that was above what would be expected. In the remaining three weeks the average response time to primary fires was within the expected range. One likely explanation of the unexpectedly low average response time to primary fires during this period is the reduced traffic levels resulting from the national lockdown.
In eight of the twelve weeks immediately following the first national lockdown the average response time to primary fires was below what would be expected. This may be due to traffic levels not immediately returning to normal levels following the lifting of restrictions.
The second national lockdown covers five weeks in our analysis. In one of these five weeks, the average response time to primary fires was below what would be expected. In the remaining four weeks the average response time to primary fires was within the expected range.
Twelve weeks of the third national lockdown are included in this analysis. In six of these twelve weeks, the average response time to primary fires was below what would be expected. In the remaining six weeks the average response time to primary fires was within the expected range. Again, this likely reflects the reduced traffic levels seen during the lockdown periods. It should be noted that the two weeks immediately preceding the third lockdown period had average response times to primary fires below the expected range - possibly indicating a voluntary change in the behaviour of citizens (i.e. reduced travel) prior to official restrictions being imposed.
Of the 28 weeks during year ending March 2021 in which national lockdowns were in force, 14 had average response times to primary fires that were below the expected range.
Figure 6.2: Average response time to secondary fires, England, week commencing 29th March 2020 to week commencing 21st March 2021 compared with the year ending March 2016 to year ending March 2020 baseline
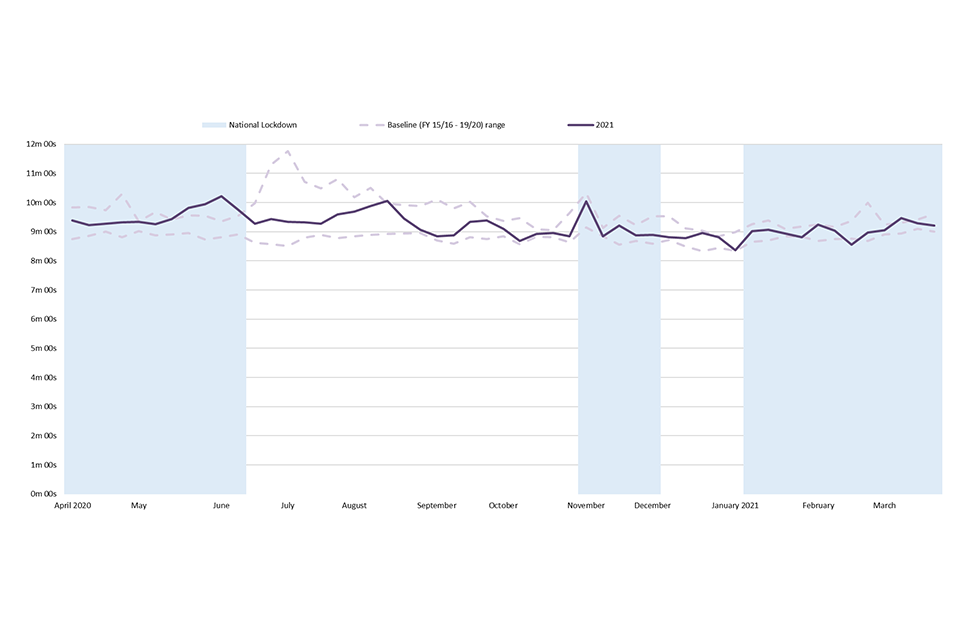
In five of the eleven weeks of the first lockdown included in this analysis, there was an average response time to secondary fires above what would be expected. The remaining seven weeks were within the expected range.
In all five weeks of the second lockdown the average response time to secondary fires was within the expected range. In the twelve weeks of the third lockdown included in this analysis, two had an average response time to secondary fires below what would be expected, one was above and the remaining nine were within the expected range.
Outside of the lockdown periods there was one week (week commencing 9 August) in which the average response time to secondary fires was above the expected range.
Other things to note regarding Figure 5.2: the large expected range in June is due to the unusually high response times to secondary fires seen in the exceptionally hot dry summer of 2018 and the peak in the expected range, and year ending March 2021 figure, at the beginning of November is likely due to the occurrence of bonfire night (5th November) during that week - which typically entails a greater number of secondary fires than normal.
Overall, the data for secondary fires does not show average response times below expected levels during the lockdown periods - as it does for primary fires. This suggests that traffic levels are less determinative of response times to secondary fires than primary fires, likely due to the former occurring in more rural locations on average.
Further information
This release contains statistics about response times to fire incidents attended by fire and rescue services (FRSs) in England. The statistics are sourced from the Home Office’s online Incident Recording System (IRS). This system allows FRSs to complete an incident form for every incident attended, be it a fire, a false alarm or a non-fire incident (also known as a Special Service incident). The online IRS was introduced in April 2009. Previously, paper forms were submitted by FRSs and an element of sampling was involved in the data compilation process.
Fire and Rescue Incident Statistics and other Home Office statistical releases are available via the Statistics at Home Office pages on the GOV.UK website.
Data tables linked to this release and all other fire statistics releases can be found on the Home Office’s Fire statistics data tables page.
Guidance for using these statistics and other fire statistics outputs, including a Quality Report, is available on the fire statistics guidance page.
The information published in this release is kept under review, taking into account the needs of users and burdens on suppliers and producers, in line with the Code of Practice for Statistics.
If you have any comments, suggestions, or enquiries, please contact the team via email using firestatistics@homeoffice.gov.uk or via the user feedback form on the fire statistics collection page.
Revisions
The IRS is a continually updated database, with FRSs adding incidents daily. The figures in this release refer to records of incidents that occurred up to and including 31 March 2021. This includes incident records that were submitted to the IRS by 27 September 2021, when a snapshot of the database was taken for the purpose of analysis. As a snapshot of the dataset was taken on 27 September 2021, the statistics published may not match those held locally by FRSs and revisions may occur in the future.
COVID-19 and the impact on the IRS
The figures presented in this release relate to incidents attended by FRSs during year ending March 2021. In response to the coronavirus pandemic, restrictions in England, Scotland and Wales started from 12 March 2020. In England, during year ending March 2021, three lockdowns which applied strict limits on daily life were imposed. A first lockdown was applied on 23 March 2020 (i.e. slightly before the start of year ending March 2021) and was eased from 10 May 2020, a second lockdown began on 5 November 2020 and ended on 2 December 2020 and the third began on 4 January 2021 and ended on 12 April 2021 (i.e. after the end of year ending March 2021). The restrictions and lockdowns are therefore captured in IRS data for year ending March 2021.
Other related publications
Home Office publish five other statistical releases covering fire and rescue services.
These include:
-
Fire and rescue incident statistics, England: provides statistics on trends in fires, casualties, false alarms, non-fire incidents and response times to fire incidents attended by fire and rescue services in England, updated quarterly
-
Detailed analysis of fires attended by fire and rescue services in England: focuses on fires attended by fire and rescue services across England, fire-related fatalities and non-fatal casualties in those fires; including analyses of the causes of fires and smoke alarms ownership and operation
-
Detailed analysis of non-fire incidents attended by fire and rescue services, England: focuses on non-fire incidents attended by fire and rescue services across England, including analysis on overall trends, fatalities and non-fatal casualties in non-fire incidents, and further detailed analysis of different categories of non-fire incidents
-
Fire and rescue workforce and pensions statistics: focuses on total workforce numbers, workforce diversity and information regarding leavers and joiners; covers both pension fund income and expenditure and firefighters’ pension schemes membership; and includes information on incidents involving attacks on firefighters
-
Fire prevention and protection statistics, England: focuses on trends in smoke alarm ownership, fire prevention and protection activities by fire and rescue services
The Department for Levelling Up, Housing and Communities also publish statistical releases on fire
These include:
-
the English Housing Survey: fire and fire safety report focuses on the extent to which the existence of fire and fire safety features vary by household and dwelling type
-
the English Housing Survey: feeling safe from fire report focuses on whether people felt safe from fire in their homes by household and dwelling type
Fire statistics are published by the other UK nations:
Scottish fire statistics and Welsh fire statistics are published based on the IRS. Fire statistics for Northern Ireland are published by the Northern Ireland Fire and Rescue Service using data from a system similar to the Incident Recording System, which means that they are not directly comparable to English, Welsh and Scottish data.
This statistical bulletin is produced to the highest professional standards and is free from political interference. It has been produced by statisticians working in accordance with the Home Office’s Statement of compliance with the Code of Practice for Official Statistics, which covers Home Office policy on revisions and other matters. The Chief Statistician reports to the National Statistician with respect to all professional statistical matters and oversees all Home Office Statistics products with respect to the Code, being responsible for their timing, content and methodology.
-
For the latest headline findings on average response times to fires by type of fire see Fire and rescue incident statistics: England, year ending June 2021, published 11 November 2021. ↩
-
For more detailed technical definitions of different types of fire, see the Fire statistics definitions document. ↩
-
Hampshire and Isle of Wight merged into a single FRS on 1st April 2021. They were separate FRSs during the period covered in this release (April 1 2020 to March 31 2021). ↩
-
As defined by the Department for Environment, Food and Rural Affairs’ 2011 Rural-Urban Classification of Local Authorities and other geographies. ↩
-
Metropolitan FRAs are a subset of those in the predominantly urban category, while non-metropolitan comprises those in predominantly rural, significantly rural and the remainder of predominantly urban FRAs. ↩
-
‘Drive to arrive’ policies require drivers to modify driving depending on risk, in order to reduce the number of incidents whilst mobile. ↩
-
See Fire prevention and protection statistics, England, April 2020 to March 2021. ↩
-
As 365 and 366 do not divide into 52 perfect weeks the analysis includes 53 ‘weeks’ in which the 1st and 53rd are slightly shorter than 7 days. ↩