DESNZ Public Attitudes Tracker: Renewable energy, Summer 2026, UK
Published 27 October 2026

© Crown copyright 2026
This publication is licensed under the terms of the Open Government Licence v3.0 except where otherwise stated. To view this licence, visit nationalarchives.gov.uk/doc/open-government-licence/version/3 or write to the Information Policy Team, The National Archives, Kew, London TW9 4DU, or email: psi@nationalarchives.gov.uk.
Where we have identified any third party copyright information you will need to obtain permission from the copyright holders concerned.
This publication is available at https://www.gov.uk/government/statistics/desnz-public-attitudes-tracker-summer-2026/desnz-public-attitudes-tracker-renewable-energy-summer-2026-uk
The DESNZ Public Attitudes Tracker is a nationally representative annual survey of adults (aged 16 and over) in the UK that tracks public awareness, attitudes, and behaviours relating to the policies of the Department for Energy Security and Net Zero (DESNZ), such as energy and climate change.
This report provides a summary of the headline findings relating to renewable energy from the Summer 2026 wave of the Tracker, which ran from 7 July to 12 August 2026.
Notes for interpretation of findings
Differences between groups are only reported where they are statistically significant at the 95% confidence level.
The annual personal income referred to in the report is a self-reported measure.
Line charts included in this report, based on a longer time series, use abbreviated season names in the x-axis (for example, Summer 2026 = Sum 2026).
The age-related findings are reported using six age groups (16-24, 25-34, 35-44, 45-54, 55-64, 65 and over). In some cases, findings across age groups have been combined to describe a general trend; for example, ‘between 78% and 88% of people aged 45 and above’ refers to the range of percentages for the three age groups 45-54, 55-64, and 65 and over.
Some of the geographical findings have fluctuated over time. These variations may, in part, be due to the base sizes in specific areas and the wide geographic area covered by regions. This also applies to other subgroup findings that have low base sizes.
Two summary self-reported measures are used in this report:
- ‘Awareness’ encompasses all respondents who said they had heard of a particular concept or technology, including those who said they knew ‘hardly anything but I’ve heard of this’, ‘a little’, ‘a fair amount’, or ‘a lot’.
- ‘Knowledge’ encompasses those who said that they knew ‘a fair amount’ or ‘a lot’ about a topic.
Support for renewable energy
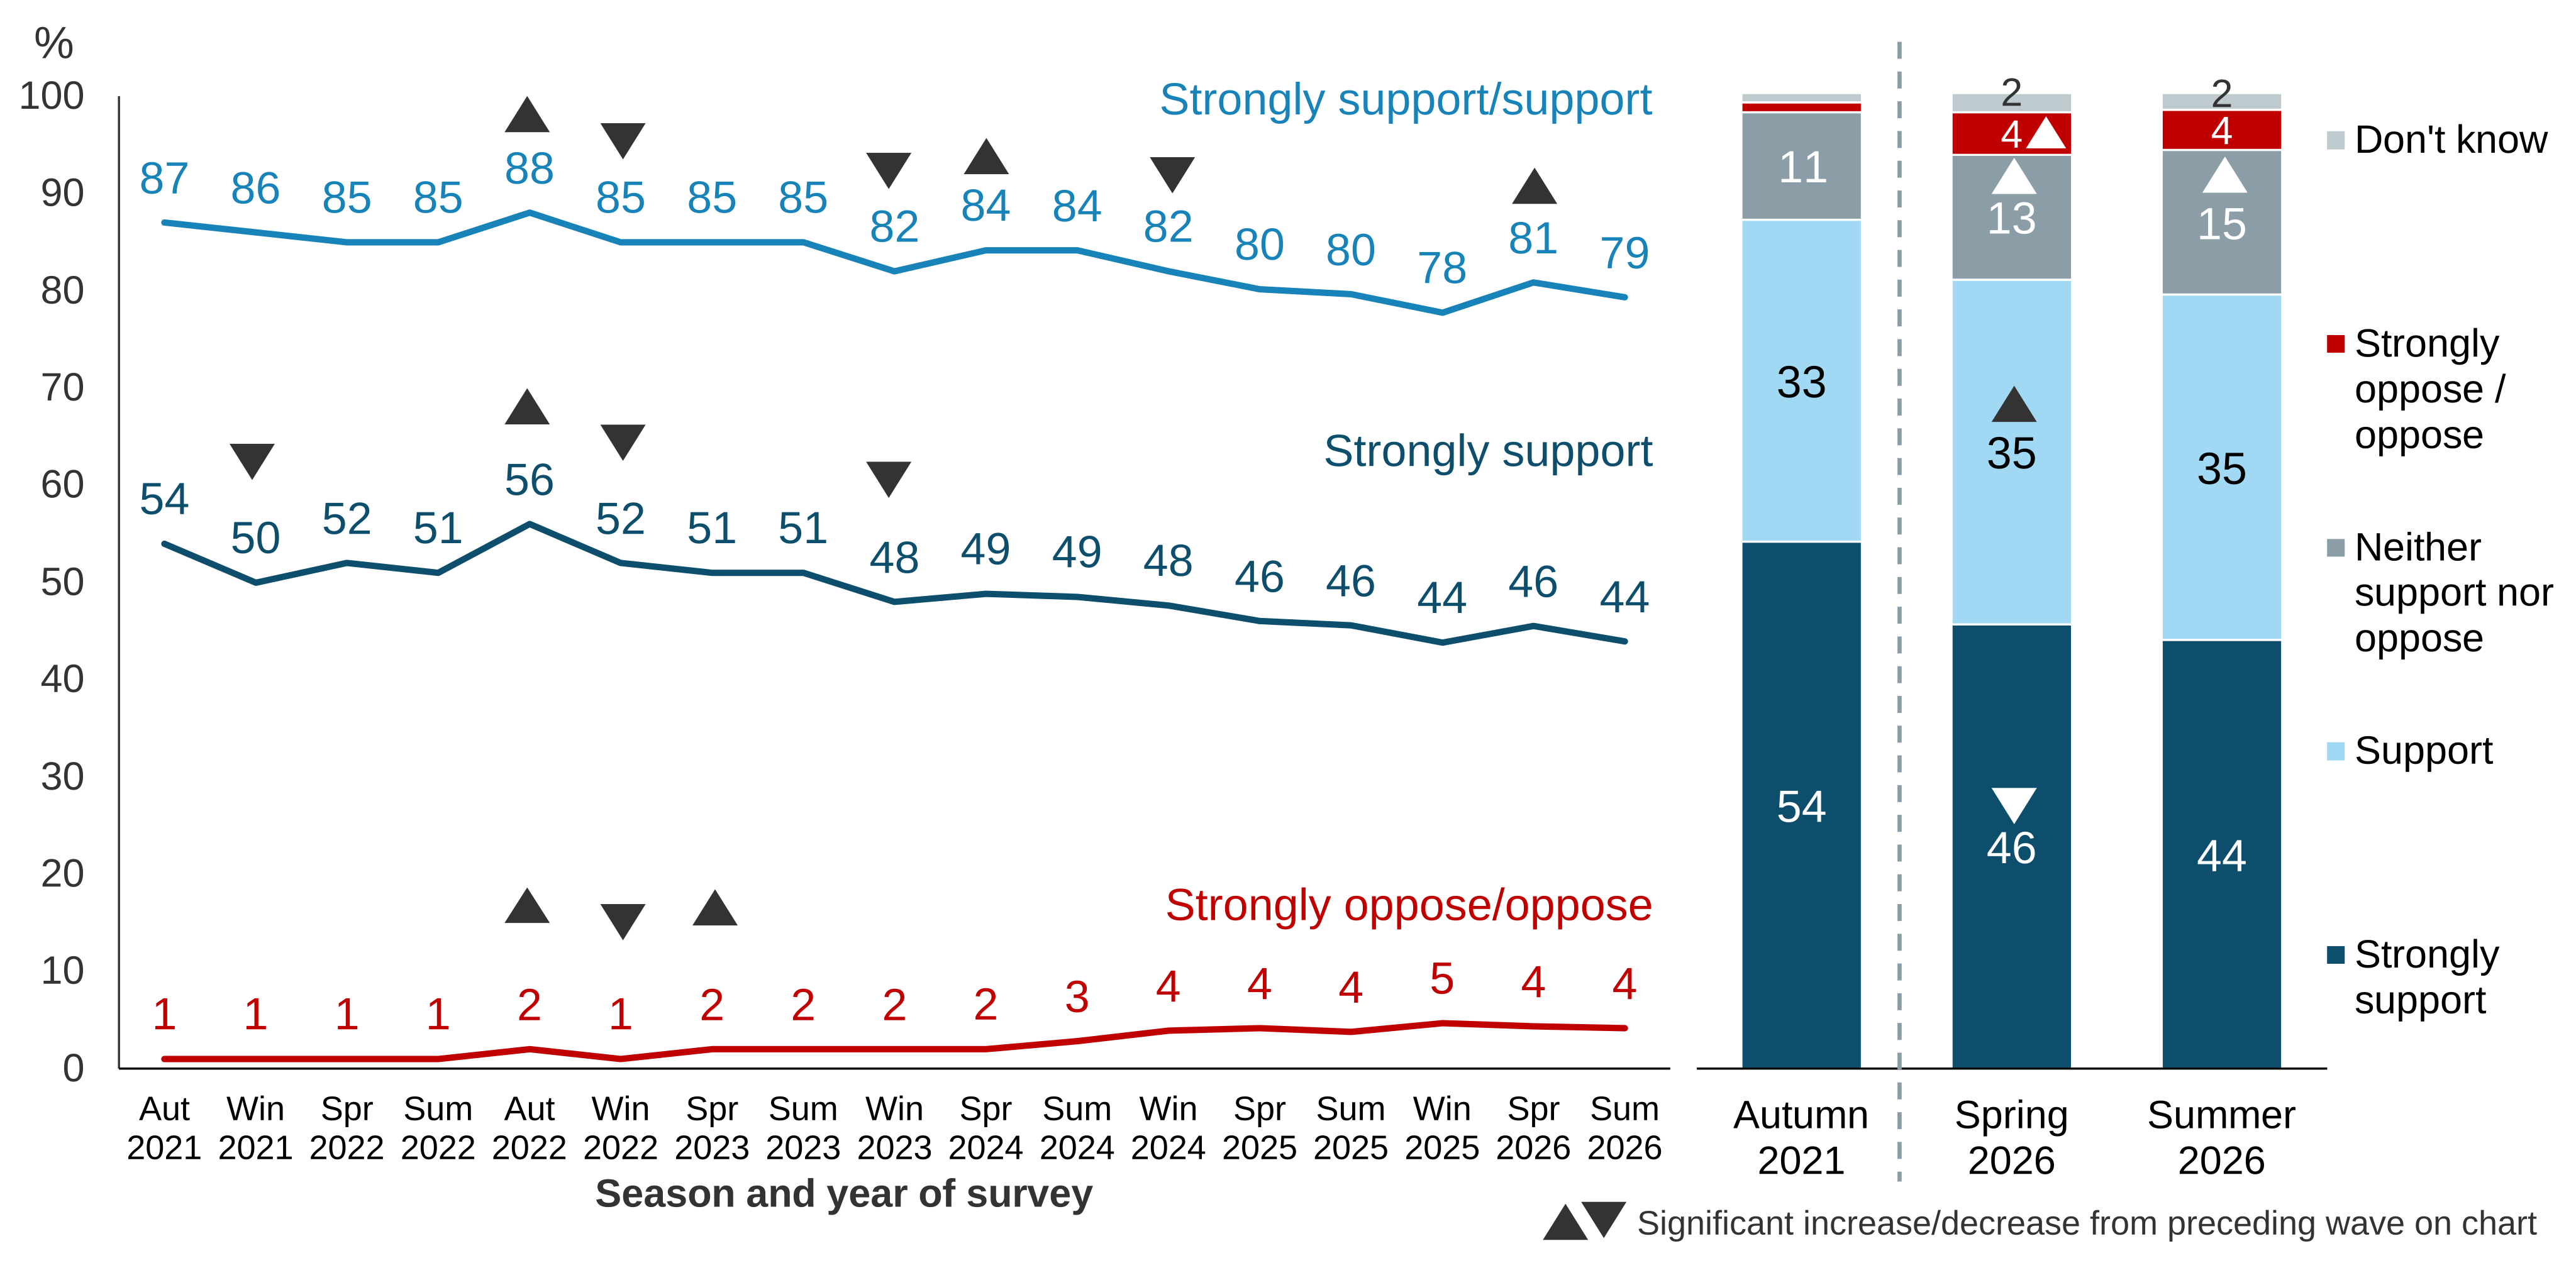
Figure 2.1 displays both the longer-term trends in overall support for renewable energy (line chart), and the detailed data on support for the most recent two waves alongside the baseline (bar chart).
In Summer 2026, overall support (support or strongly support) for the use of renewable energy such as wind power, solar energy, and biomass to provide electricity, fuel, and heat remained at around eight in ten (79%). Opposition (oppose or strongly oppose) was also unchanged since Spring 2026 at 4%.
Overall support declined over time, aside from some minor fluctuations, from 87% in Autumn 2021 to 79% in Summer 2026. In particular, strong support for renewable energy declined from 54% in Autumn 2021 to 44% in Summer 2026. The proportion of people answering ‘neither support nor oppose’ rose from 11% in Autumn 2021 to 15% in Summer 2026.
Figure 2.1: Whether support use of renewable energy (% based on all people), Autumn 2021 to Summer 2026
RENEWSUPPORT. The next question is about renewable energy. This includes a number of different forms of energy, such as wind power, solar energy and biomass. Do you support or oppose the use of renewable energy for providing our electricity, fuel and heat?
Base: All wave respondents – Autumn 2021 (5,556), Winter 2021 (3,705), Spring 2022 (4,373), Summer 2022 (4,489), Autumn 2022 (4,160), Winter 2022 (3,572), Spring 2023 (4,403), Summer 2023 (3,997), Winter 2023 (3,724), Spring 2024 (4,087), Summer 2024 (3,642), Winter 2024 (3,212), Spring 2025 (3,412), Summer 2025 (3,529), Winter 2025 (3,283), Spring 2026 (3,388), Summer 2026 (3,238) (Asked each wave).
Note: On the line chart, arrows denote a significant difference between one wave and the next. For the bar chart, significant differences are noted between Autumn 2021 and Spring 2026, and between Spring 2026 and Summer 2026.
Analysis by subgroups
Overall support (support or strongly support) for renewable energy was higher among the following subgroups:
- People in age groups under 55 (between 81% and 84%) compared with those aged 65 and over (74%).
- People who said they were very concerned about climate change (97%) or at least fairly concerned (82%) compared with those who said they were not concerned (44%).
Attitudes towards local wind farms
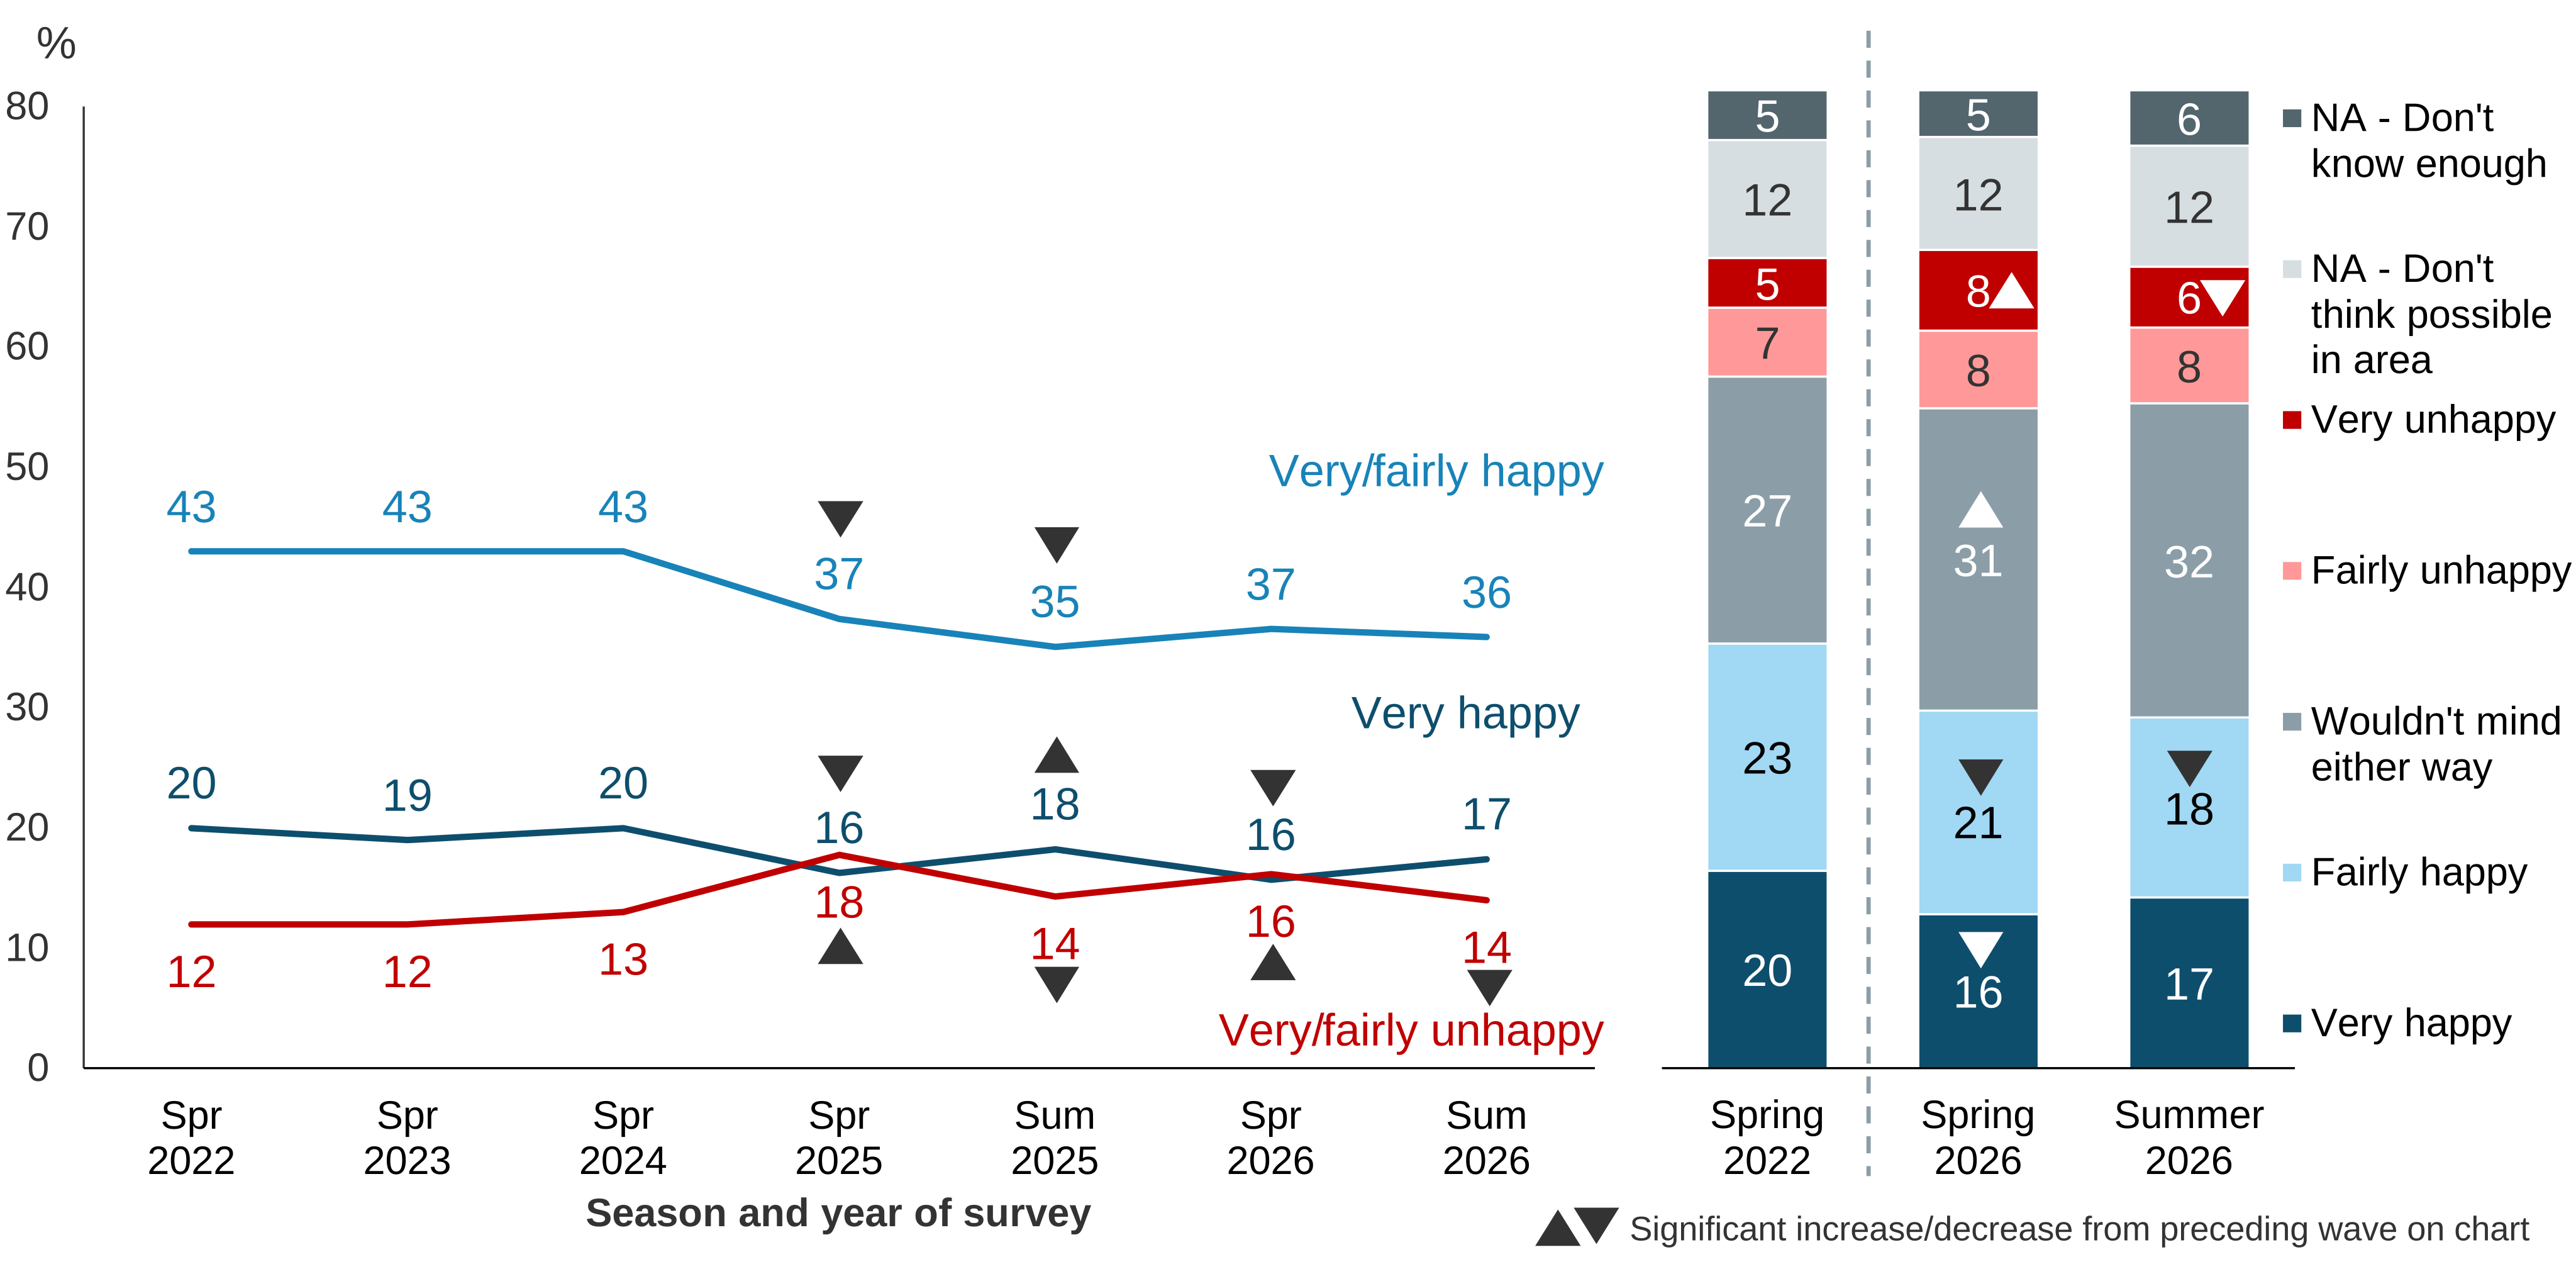
People were also asked more specifically how happy they would be for an onshore wind farm to be constructed in their local area (Figure 2.2).
In Summer 2026, overall views on local wind farm construction remained more positive than negative, with 36% reporting that they would be very or fairly happy for a wind farm to be constructed in their local area and 17% saying they would be very happy. There was a reduction in the proportion saying they would be very or fairly unhappy, down to 14% from 16% in Spring 2026.
The proportion who said they would be very or fairly happy has remained somewhat stable since Spring 2025, following a drop between Spring 2024 (43%) and Spring 2025 (37%).
Figure 2.2: Whether would be happy for an onshore wind farm to be constructed in their local area (% based on all people), Spring 2022 to 2024, Spring and Summer 2025 to 2026
WINDFARM. Now imagine that there are plans for an onshore wind farm to be constructed in your local area. How happy or unhappy would you be about this? If you already have this in your local area, answer on the basis of how you feel about this now.
Base: All wave respondents – Spring 2022 (4,361), Spring 2023 (4,398), Spring 2024 (4,076), Spring 2025 (3,409), Summer 2025 (3,520), Spring 2026 (3,385), Summer 2026 (3,236).
Note: On the line chart, the vertical scale has been reduced to 0 to 80%, and arrows denote a significant difference between one wave and the next. For the bar chart, significant differences are noted between Spring 2022 and Spring 2026, and between Spring 2026 and Summer 2026.
Analysis by subgroups
- Older people were more likely to say they would be unhappy overall, ranging between 18% and 20% for those in age groups above 54, compared with 6% of those aged under 25.
- People living in Wales were most likely to say they would be happy overall about a local wind farm (45%); in contrast overall happiness was lowest in Scotland (30%).
- Those living in London were least likely to say they would be unhappy overall with the construction of a local wind farm (8%) but were also more likely than those in all other regions to say they did not think wind farm construction would be possible in their area (27% vs 12% overall).
- Those in rural areas were more likely to say they would be unhappy overall about a local wind farm (24% compared with 12% of those in urban areas). The proportion saying they would be happy overall about a local wind farm was, however, similar (34% for those in urban areas compared with 36% for those in rural areas).
Attitudes towards local solar farms
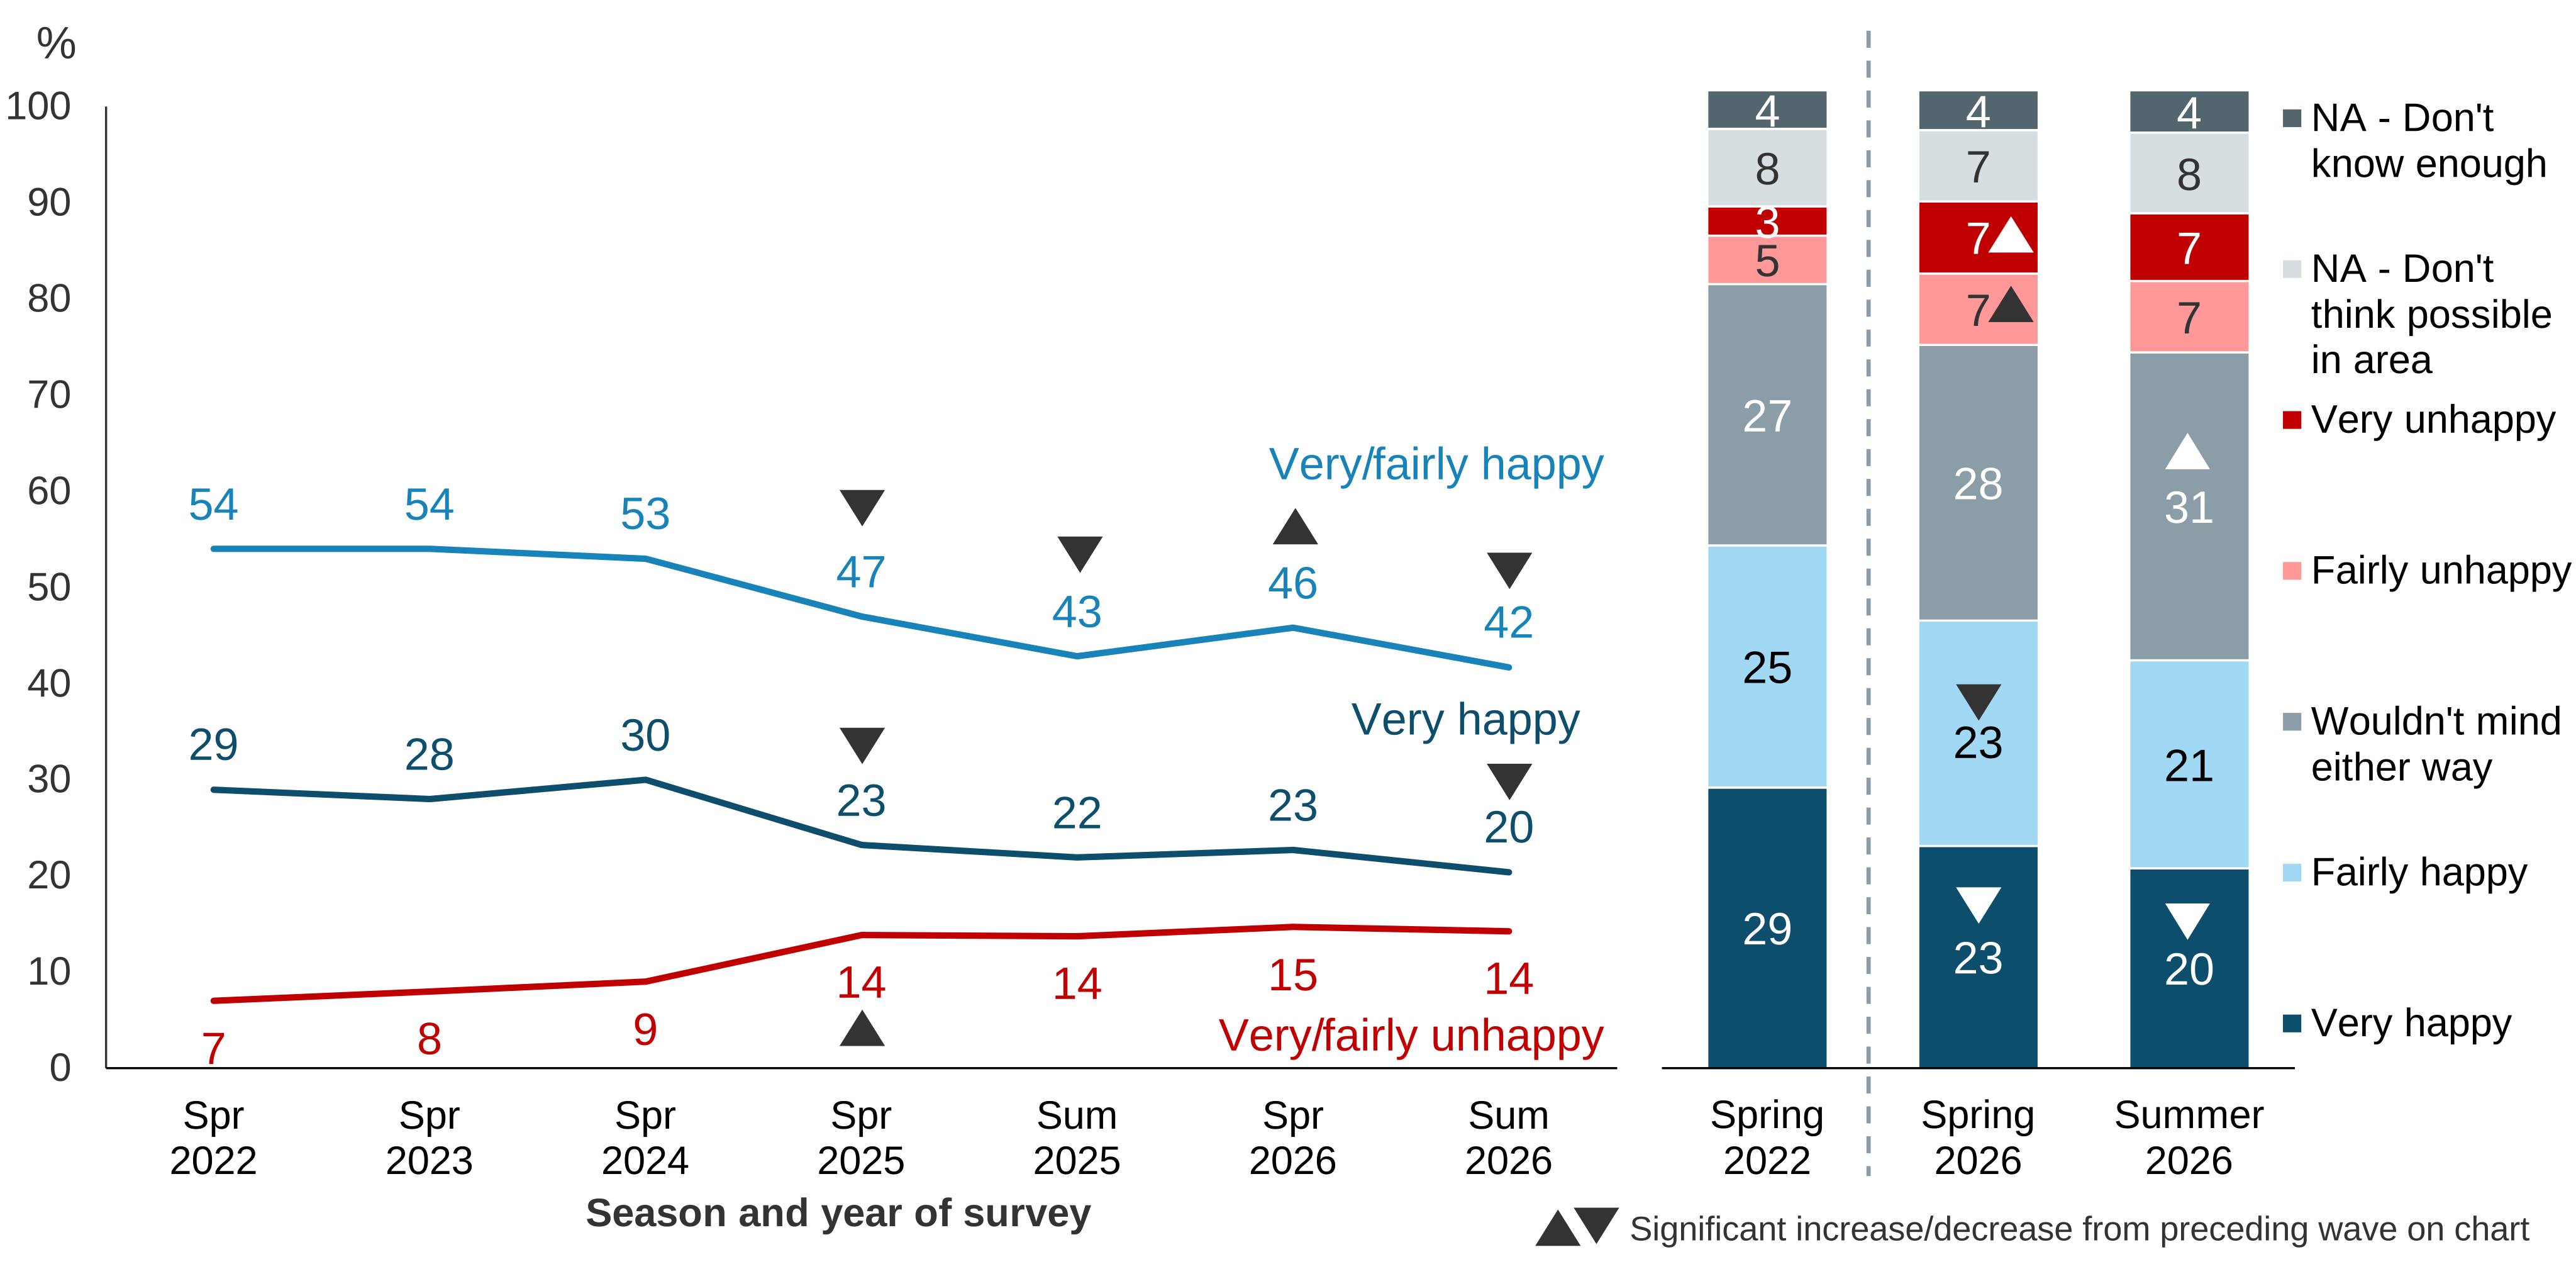
People were also asked about how happy they would be for a solar farm to be constructed in their local area (Figure 2.3). In Summer 2026 the wording of the question was simplified from asking about ‘solar panel farms’ to asking about ‘solar farms’.
Compared with happiness for a local wind farm (36%), overall happiness for a local solar farm remained higher, with 42% saying they would be very or fairly happy. This dropped from 46% in Spring 2026. The proportion who said they would be very happy about a local solar farm also dropped to 20% from 23% in Spring 2026, while 14% said they would be unhappy (very or fairly) overall.
In the longer term, similar to the pattern seen for wind farms, happiness for a local solar farm was stable between Spring 2022 (54%) and Spring 2024 (53%), followed by an overall pattern of decline to 42% in Summer 2026. In contrast, since the increase in overall unhappiness from Spring 2024 (9%) to Spring 2025 (14%), unhappiness has remained fairly stable.
Figure 2.3: Whether would be happy for a solar farm to be constructed in their local area (% based on all people), Spring 2022 to 2024, Spring and Summer 2025 to 2026
SOLARFARM. Now imagine that there are plans for a solar farm to be constructed in your local area. How happy or unhappy would you be about this? If you already have this in your local area, answer on the basis of how you feel about this now.
Base: All wave respondents – Spring 2022 (4,369), Spring 2023 (4,396), Spring 2024 (4,080), Spring 2025 (3,412), Summer 2025 (3,524), Spring 2026 (3,385), Summer 2026 (3,236).
Note: On the line chart, arrows denote a significant difference between one wave and the next. For the bar chart, significant differences are noted between Spring 2022 and Spring 2026, and between Spring 2026 and Summer 2026.
Analysis by subgroups
The proportion who said they would be happy about a local solar farm was higher among the following subgroups:
- Those in age groups below 65 (between 43% and 48%) compared with those aged 65 and over (33%).
- People living in Wales (50%); in contrast happiness was lowest in Scotland (35%), the East Midlands (36%), and Yorkshire and the Humber (38%). As was the case for wind farms, those living in London were more likely than those living elsewhere to say they did not think solar farm construction would be possible in their area (20% vs 8% overall). Similar to findings for wind farms, those in rural areas were more likely to say they would be unhappy about a local solar farm (25% vs 12% of those in urban areas). There was a smaller difference in overall happiness between those in urban (43%) and rural (36%) areas.
Benefits of renewable energy infrastructure
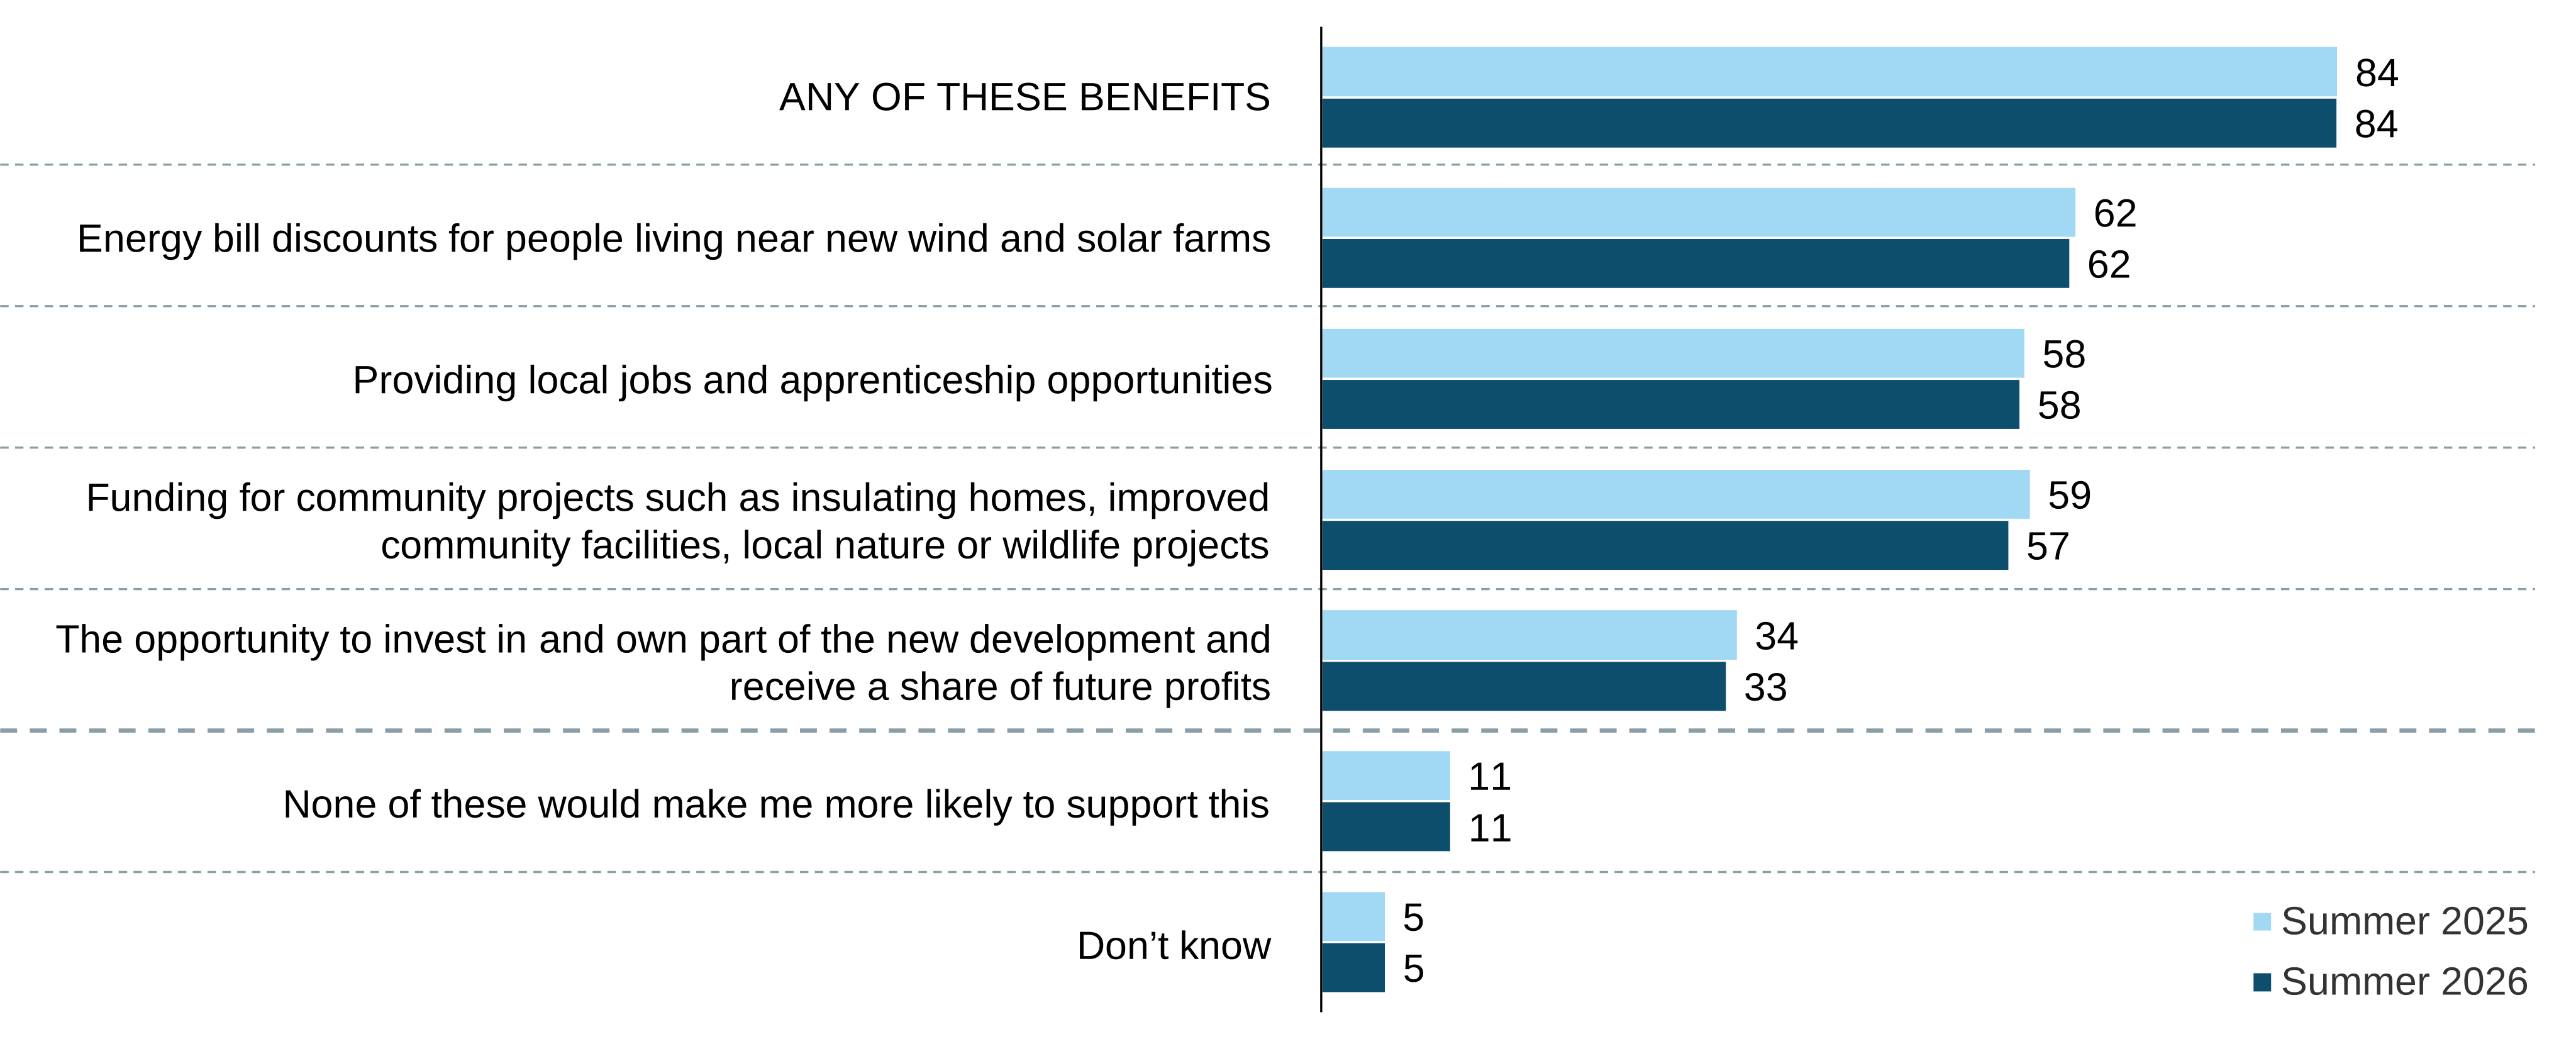
People were asked which of a list of possible benefits would make them more likely to support the construction of renewable energy infrastructure, such as solar and wind farms, in their local area. This annual question was asked for the first time in Summer 2025.
In Summer 2026, 84% of people said they would be incentivised by at least one of the listed benefits, although 11% said none of them would increase their support for local construction (Figure 2.4). Over half said that they would be incentivised by each of energy bill discounts for those living near new infrastructure (62%), provision of local jobs and apprenticeships (58%), and funding for community projects such as home insulation, community facilities, and local nature projects (57%).
The opportunity to personally invest and have a stake in the new development was less of an incentive (33%). There were no significant changes in perceived benefits since the question was first asked in Summer 2025.
Figure 2.4: What might encourage people to support construction of renewable energy infrastructure in local area (% based on all people), Summer 2025 and 2026
RENEWBENEFIT. Which, if any, of the following might make you more likely to support the construction of renewable energy infrastructure such as solar and wind farms in your local area?
Base: All wave respondents – Summer 2025 (3,518), Summer 2026 (3,232).
Analysis by subgroups
By age:
- People in age groups 45 and over were most likely to say none of the benefits would increase their support (between 13% and 17%, compared with 2% of those aged under 25).
- People aged 65 and over were least likely to be motivated by energy bill discounts (48% compared with between 56% and 72% of those in age groups under 65). Those in age groups 25 to 44 were most likely to be motivated by energy bill discounts (72%).
- People aged 65 and over were also least likely to be motivated by investment opportunities (21%), while those in age groups 25 to 44 were most likely to be motivated by this (between 42% and 46%).
By geography:
- People living in the East Midlands were most likely to say none of the benefits would make them more likely to support new local infrastructure (18% vs 11% overall), and least likely to select a number of potential benefits.
- Those in the North West were more likely than those in the East Midlands to select energy bill discounts (67% vs 56%). They were also more likely to select funding for community projects (66% vs 47%).
- Those in Yorkshire and the Humber were more likely than those in the East Midlands to select local job opportunities (62% vs 51%).
- People living in London were most motivated by the opportunity to invest in the new development (40%), while those in the North East were least likely to be motivated by this (25%).
By urban/rural:
- People living in rural areas were more likely to say none of the benefits would make them more supportive (18%) compared with those in urban areas (9%).
- Those in urban areas were more likely than those in rural areas to select each of local job opportunities (59% vs 51%) and funding for community projects (58% vs 51%).
Great British Energy
A question has been asked in each wave since Winter 2024 about Great British Energy (GBE), a government initiative set out in 2024. Respondents were provided with a brief description as follows: ‘The UK government has set up a publicly owned, clean energy company, called Great British Energy. Great British Energy will operate in all four nations of the UK’.
In Summer 2026, awareness remained stable compared with Spring 2026 at 56% (Figure 2.5). There was no significant change in levels of knowledge (knowing a lot or a fair amount) at 11% or in the proportion who said they knew a little or hardly anything (45%).
In the longer term, there has been no sustained change over time in the proportion saying they knew a lot or a fair amount. Overall awareness declined, however, from 60% in Winter 2024 to 56% in Summer 2026.
Figure 2.5: Awareness of Great British Energy (% based on all people), Winter 2024 to Summer 2026
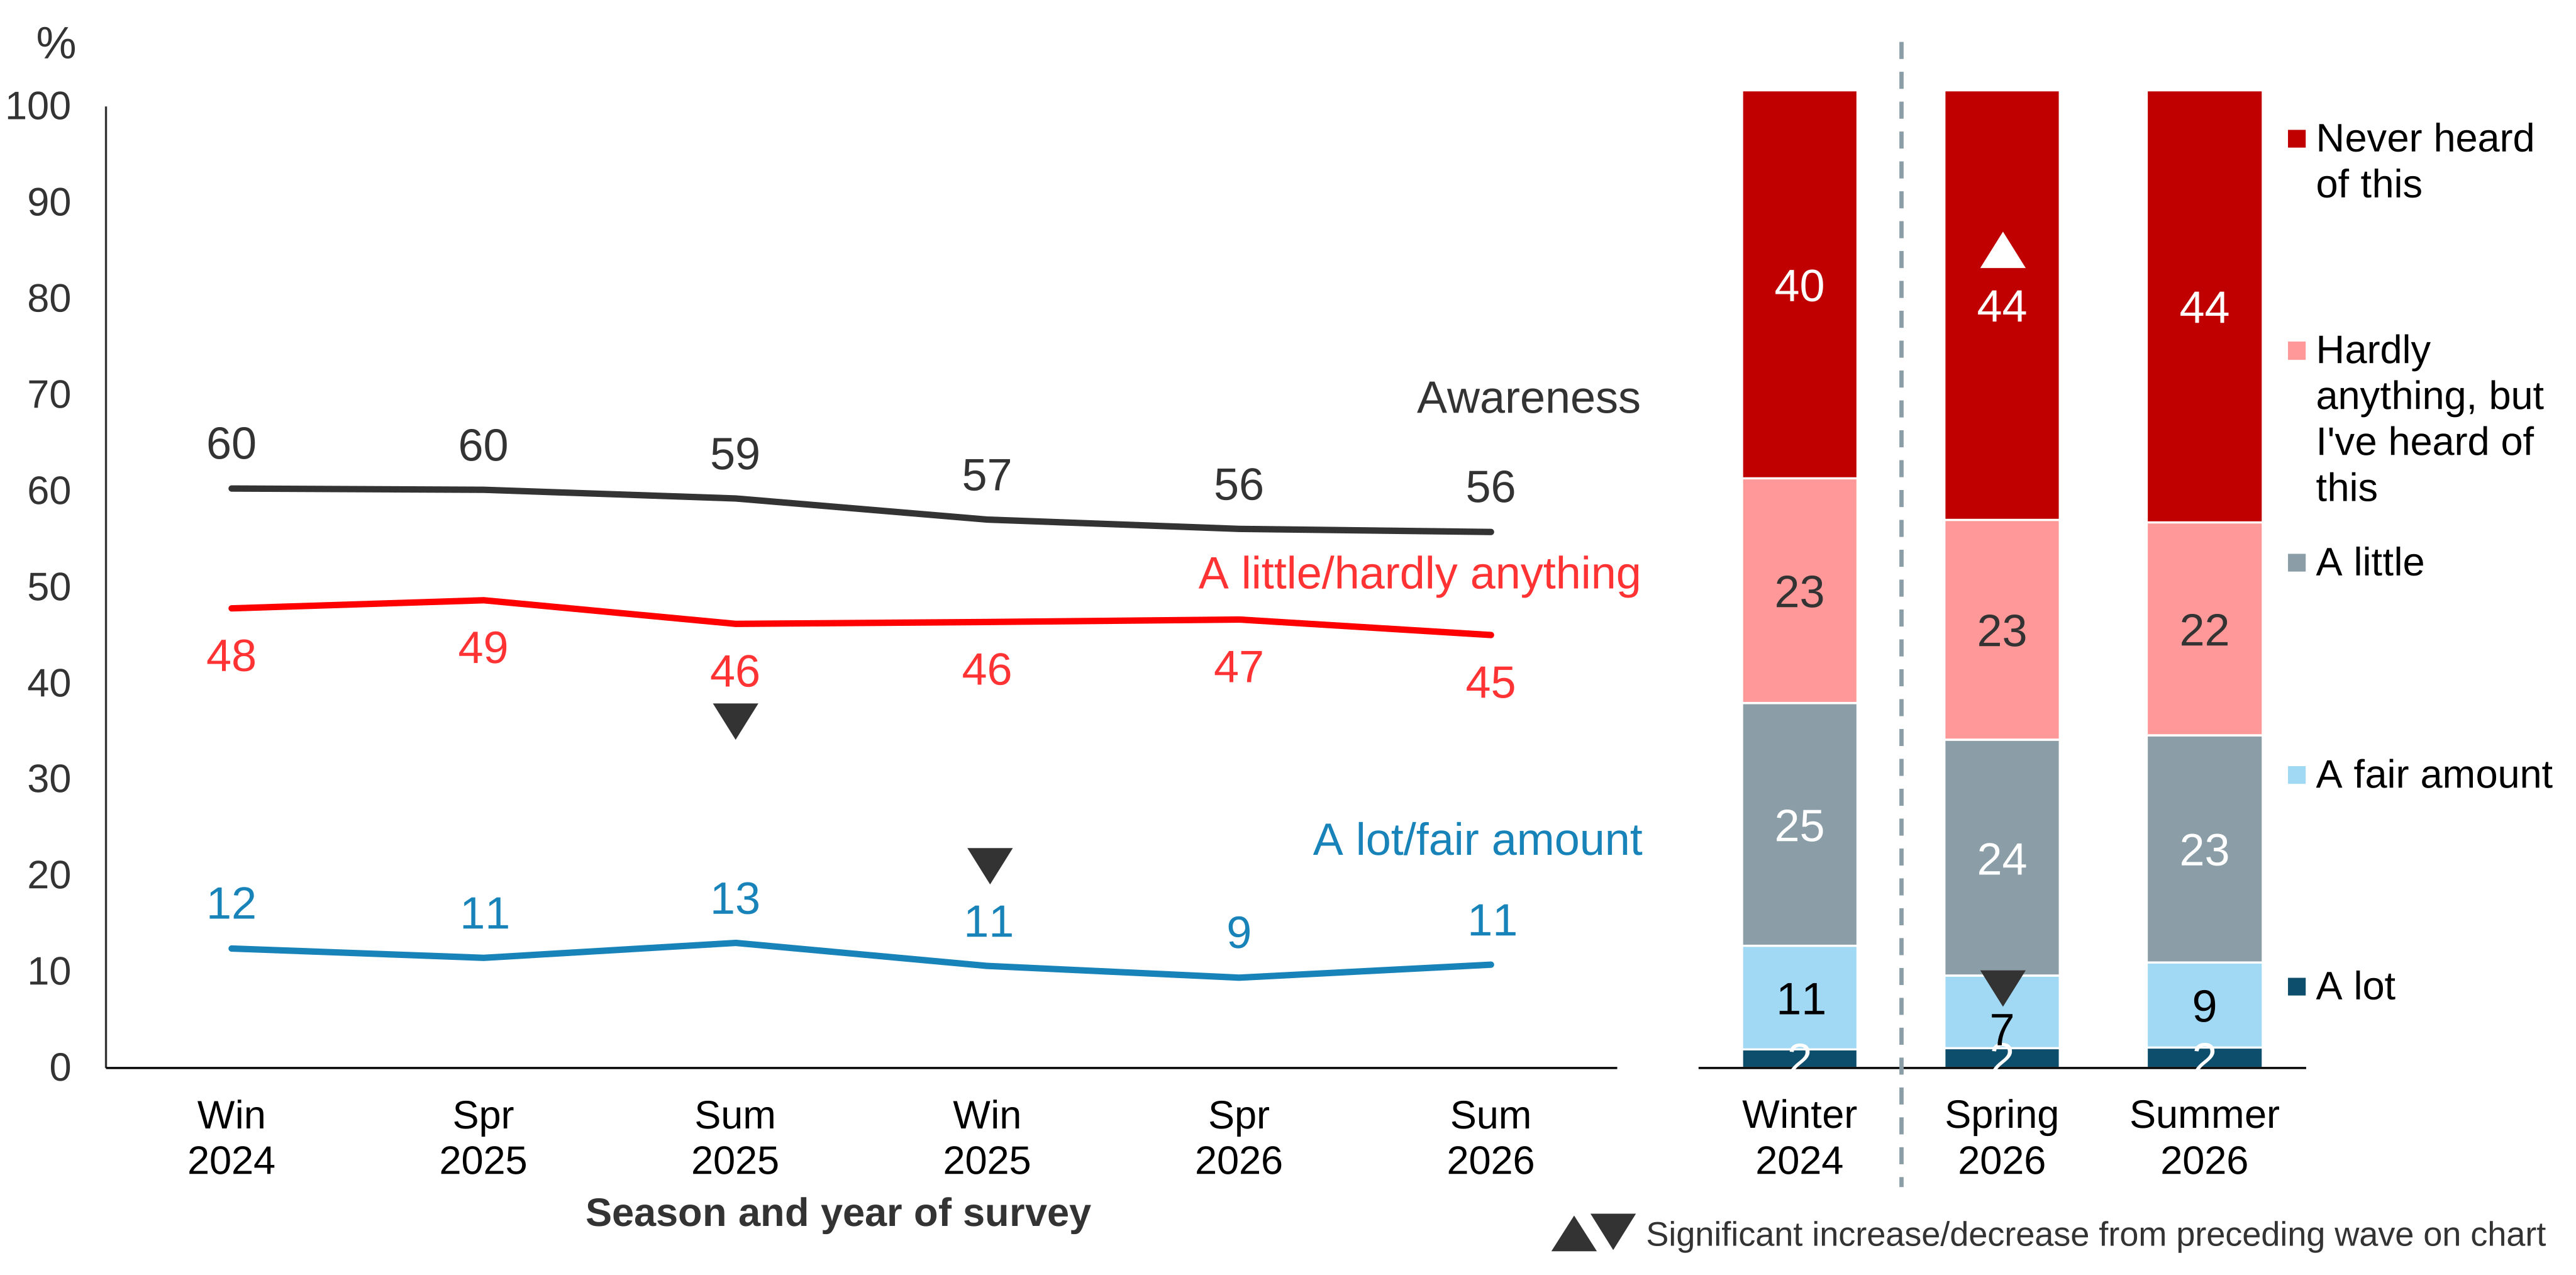
GBEKNOW. Before today, how much, if anything, did you know about Great British Energy?
Base: All wave respondents – Winter 2024 (3,212), Spring 2025 (3,409), Summer 2025 (3,530), Winter 2025 (3,281), Spring 2026 (3,387), Summer 2026 (3,241).
Note: On the line chart, arrows denote a significant difference between one wave and the next. For the bar chart, significant differences are noted between Winter 2024 and Spring 2026, and between Spring 2026 and Summer 2026.
Analysis by subgroups
Awareness of GBE was higher among the following subgroups:
- People aged under 25 (69% compared with between 51% and 58% for age groups 25 and over)
- People with a degree (61%) compared with those with no qualifications (45%).
Clean Power 2030
A question has been asked in each wave since Spring 2025 about the government’s clean power goal. Respondents were provided with a brief description as follows: ‘One of the government’s goals is to achieve Clean Power by 2030. This means generating at least 95% of electricity in Great Britain from clean sources, like wind and solar, by 2030’.
In Summer 2026, around eight in ten (82%) were aware of Clean Power 2030, stable compared with Spring 2026 (Figure 2.6). The proportion who said they knew a lot or a fair amount about this did not change significantly in Summer 2026 (30%).
In the longer term, since Spring 2025, there has been no sustained change in awareness or knowledge of Clean Power 2030. However, overall knowledge (a lot or a fair amount) remained below the peak of 33% in Summer 2025.
Figure 2.6: Awareness of Clean Power 2030 (% based on all people), Spring 2025 to Summer 2026
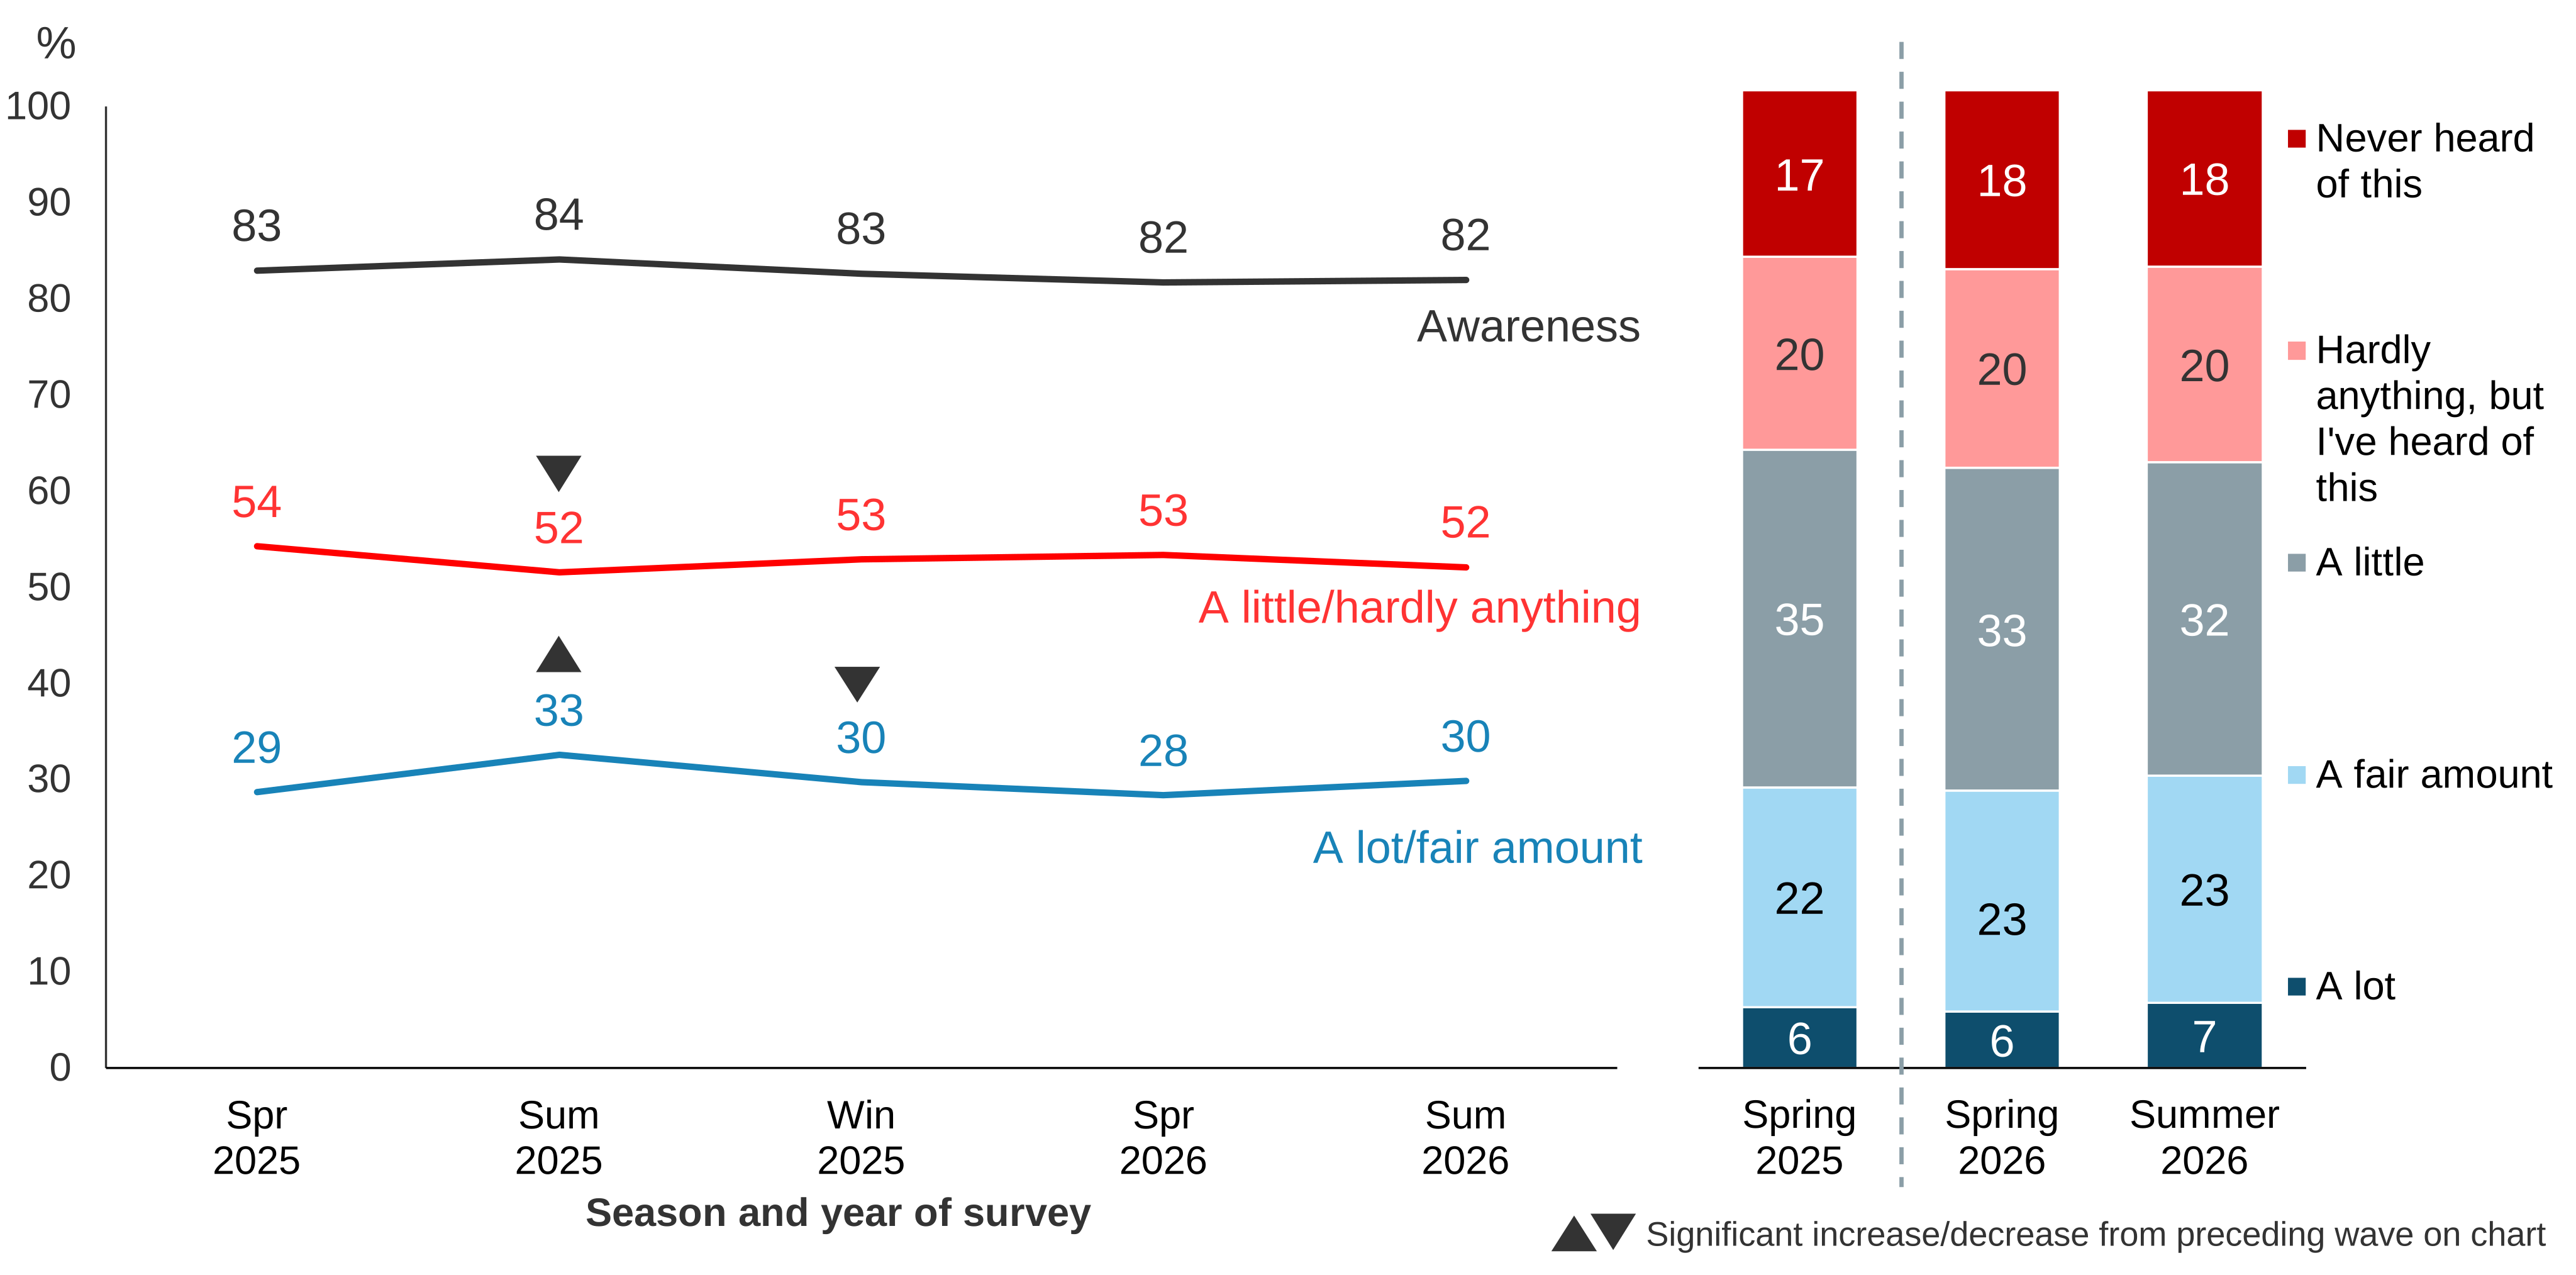
CLEANPOWER2030. Before today, how much, if anything, did you know about this?
Base: All wave respondents – Spring 2025 (3,411), Summer 2025 (3,530), Winter 2025 (3,281), Spring 2026 (3,389), Summer 2026 (3,240).
Note: On the line chart, arrows denote a significant difference between one wave and the next. For the bar chart, significant differences are noted between Spring 2025 and Spring 2026, and between Spring 2026 and Summer 2026.
Analysis by subgroups
Knowledge (a lot or a fair amount) about Clean Power 2030 was higher among the following subgroups:
- People in age groups 55 and over (between 36% and 42% compared with between 22% and 26% of those in age groups under 55).
- People with a degree (35%), compared to those with no qualifications (22%).
Further findings on renewable energy
- Support for specific types of renewable energy, see Spring 2026 report on Renewable Energy - section on ‘Support for different types of renewables’.
- Reasons for happiness or unhappiness about the construction of wind farms and solar panels in their local area, see Spring 2026 report on ‘Renewable energy’.
- Attitudes towards renewable energy, see Spring 2026 report on Renewable Energy - section on ‘Attitudes towards renewable energy’.