DESNZ Public Attitudes Tracker: Heat and energy use in the home, Summer 2026, UK
Published 27 October 2026

© Crown copyright 2026
This publication is licensed under the terms of the Open Government Licence v3.0 except where otherwise stated. To view this licence, visit nationalarchives.gov.uk/doc/open-government-licence/version/3 or write to the Information Policy Team, The National Archives, Kew, London TW9 4DU, or email: psi@nationalarchives.gov.uk.
Where we have identified any third party copyright information you will need to obtain permission from the copyright holders concerned.
This publication is available at https://www.gov.uk/government/statistics/desnz-public-attitudes-tracker-summer-2026/desnz-public-attitudes-tracker-heat-and-energy-use-in-the-home-summer-2026-uk
The DESNZ Public Attitudes Tracker is a nationally representative annual survey of adults (aged 16 and over) in the UK that tracks public awareness, attitudes, and behaviours relating to the policies of the Department for Energy Security and Net Zero (DESNZ), such as energy and climate change.
This report provides a summary of the headline findings relating to heat and energy use in the home from the Summer 2026 wave of the Tracker, which ran from 7 July to 12 August 2026.
Notes for interpretation of findings
Differences between groups are only reported where they are statistically significant at the 95% confidence level.
The annual personal income referred to in the report is a self-reported measure.
Line charts included in this report, based on a longer time series, use abbreviated season names in the x-axis (for example, Summer 2026 = Sum 2026).
The age-related findings are reported using six age groups (16-24, 25-34, 35-44, 45-54, 55-64, 65 and over). In some cases, findings across age groups have been combined to describe a general trend; for example, ‘between 78% and 88% of people aged 45 and above’ refers to the range of percentages for the three age groups 45-54, 55-64, and 65 and over.
Some of the geographical findings have fluctuated over time. These variations may, in part, be due to the base sizes in specific areas and the wide geographic area covered by regions. This also applies to other subgroup findings that have low base sizes.
Two summary self-reported measures are used in this report:
- ‘Awareness’ encompasses all respondents who said they had heard of a particular concept or technology, including those who said they knew ‘hardly anything but I’ve heard of this’, ‘a little’, ‘a fair amount’, or ‘a lot’.
- ‘Knowledge’ encompasses those who said that they knew ‘a fair amount’ or ‘a lot’ about a topic.
Awareness of heating changes to meet net zero targets
Respondents were presented with the following explanation: ‘In the lead up to 2050, the way we heat almost all of our homes and buildings will need to change in order to reach the UK government’s net zero target’.
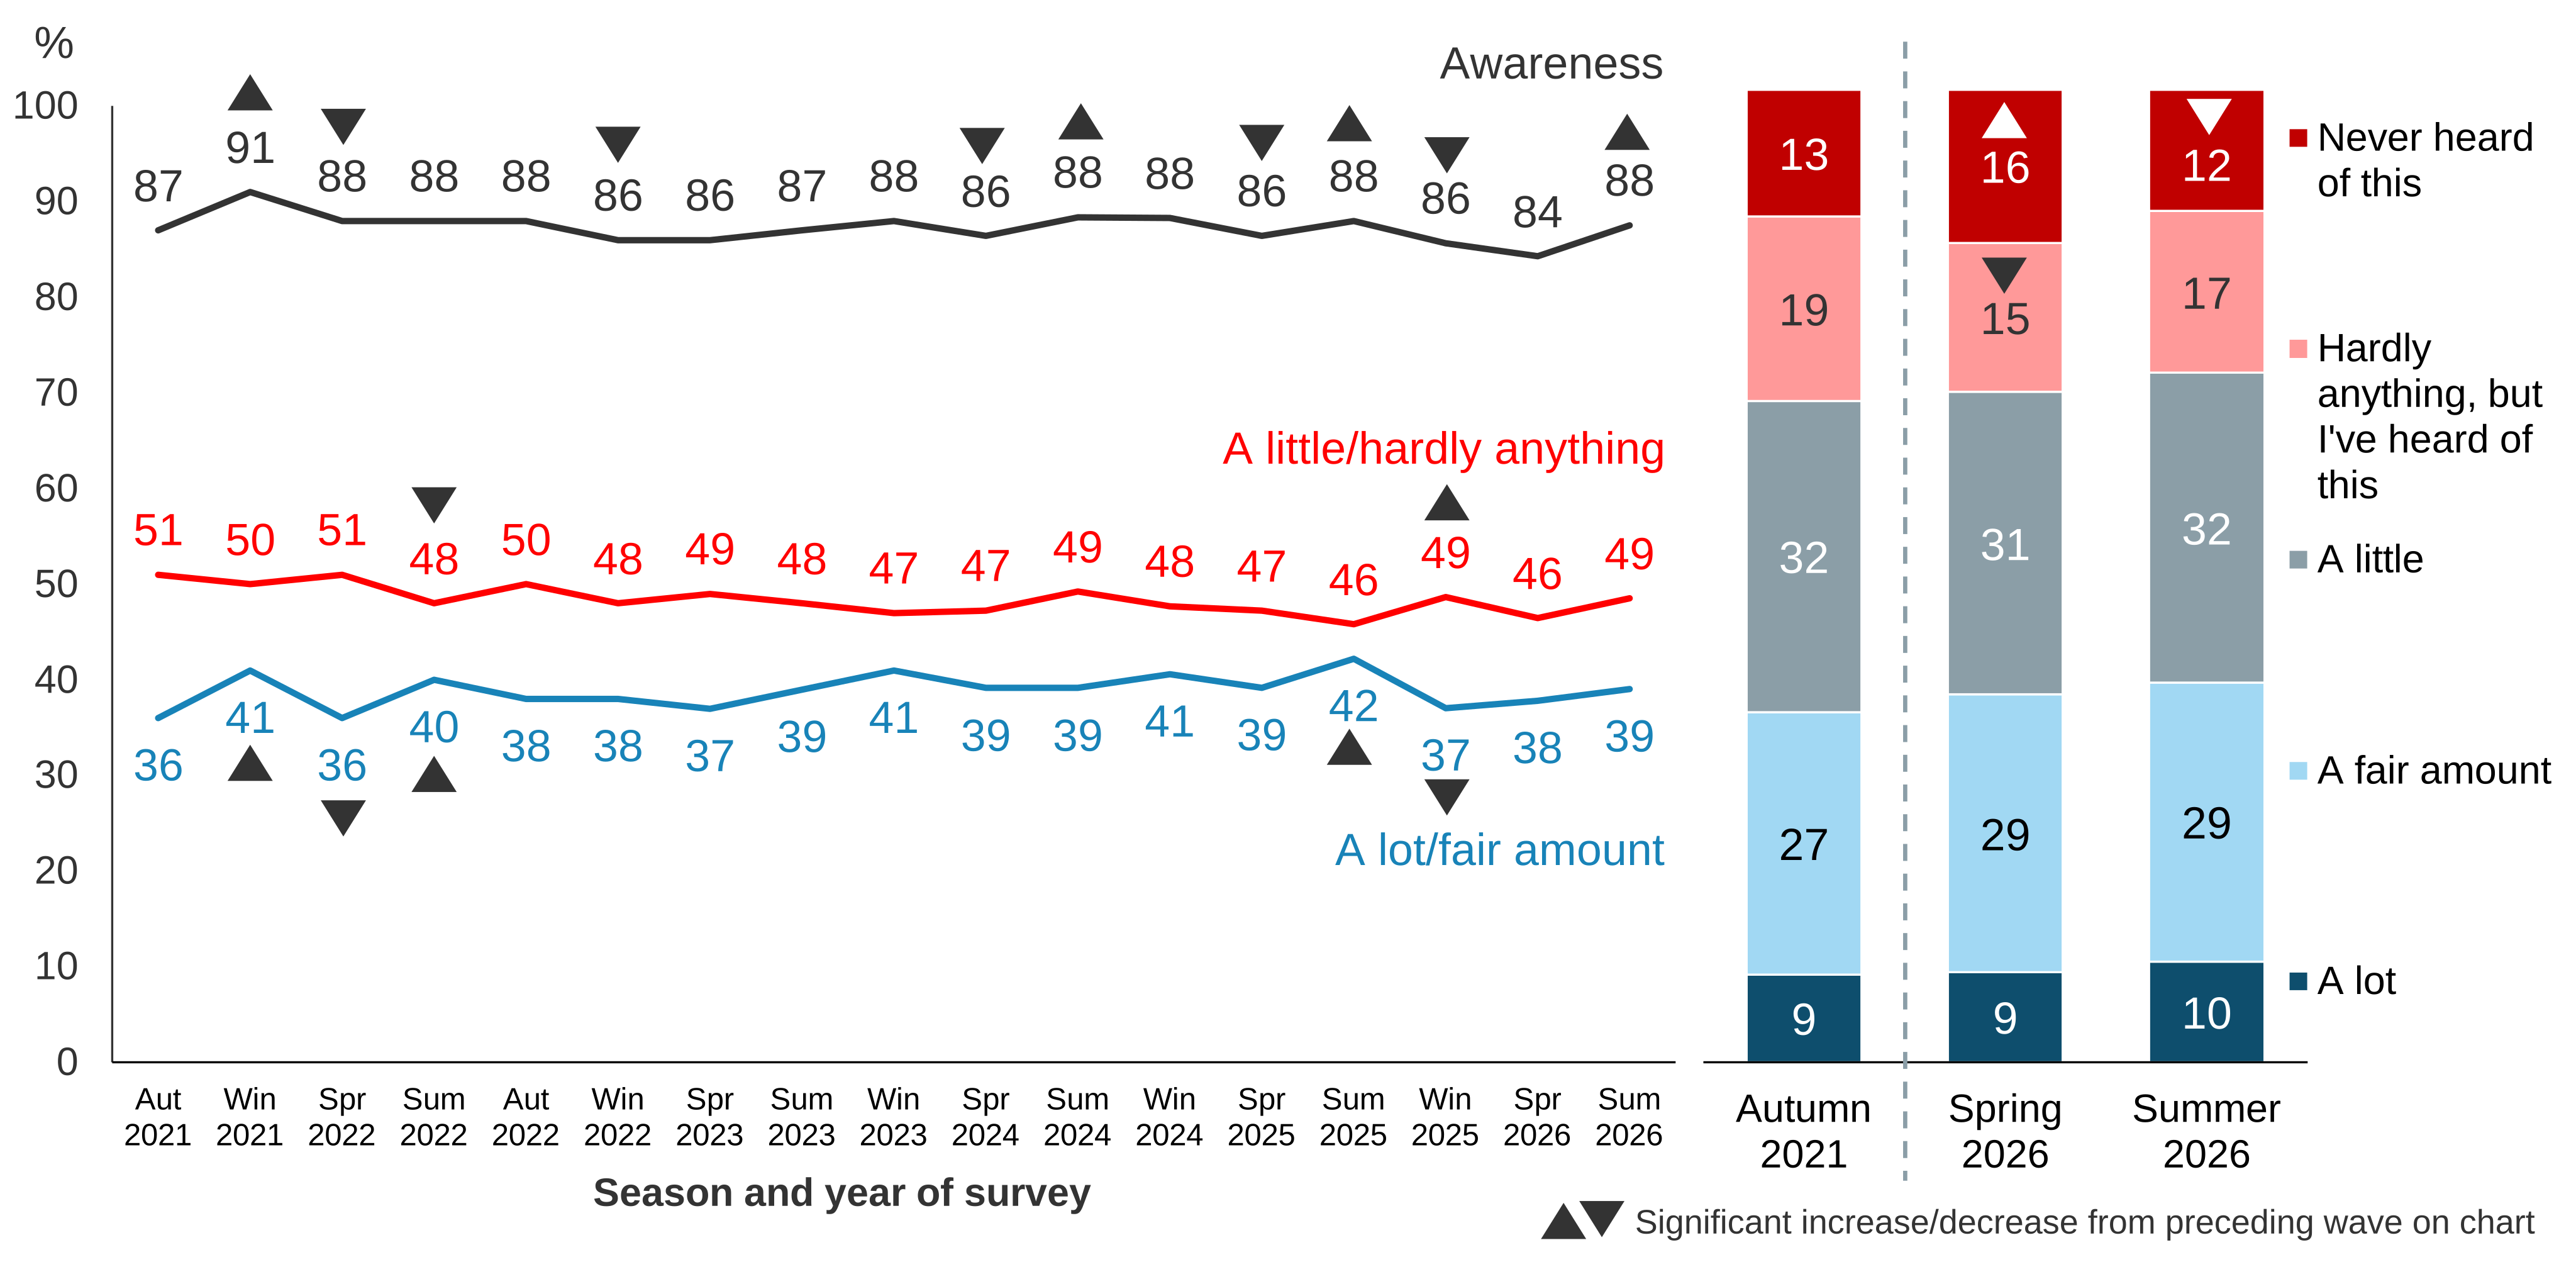
Figure 4.1 displays the longer-term trends in overall awareness (had at least heard of it) and knowledge (a lot/fair amount) of the need to change the ways our homes are heated to reach net zero (line chart). The chart also displays more detailed awareness and knowledge data for the most recent two waves alongside the baseline (bar chart).
In Summer 2026, awareness of the need to change the way homes and buildings are heated to reach net zero rose to 88% from 84% in Spring 2026. Overall knowledge (a lot or a fair amount) was stable at 39% (Figure 4.1).
Over the longer term, awareness has remained broadly stable at just below nine in ten (88% in Summer 2026), albeit with some minor fluctuations. Following fluctuations at the start of the tracking series between Autumn 2021 and Spring 2022, levels of knowledge have remained largely stable at around four in ten.
Figure 4.1: Awareness of the need to change the way homes are heated to reach net zero targets in 2050 (% based on all people), Autumn 2021 to Summer 2026
HEATHOMEKNOW. In the lead up to 2050, the way we heat almost all of our homes and buildings will need to change in order to reach the UK government’s net zero target. Before today, how much if anything did you know about this?
Base: All wave respondents – Autumn 2021 (5,552), Winter 2021 (3,705), Spring 2022 (4,374), Summer 2022 (4,489), Autumn 2022 (4,160), Winter 2022 (3,572), Spring 2023 (4,406), Summer 2023 (3,998), Winter 2023 (3,741), Spring 2024 (4,083), Summer 2024 (3,640), Winter 2024 (3,211), Spring 2025 (3,412), Summer 2025 (3,525), Winter 2025 (3,279), Spring 2026 (3,389), Summer 2026 (3,240) (Asked each wave).
Note: On the line chart, arrows denote a significant difference between one wave and the next. For the bar chart, significant differences are noted between Autumn 2021 and Spring 2026, and between Spring 2026 and Summer 2026.
Analysis by subgroups
Self-reported knowledge about the need to change the way homes are heated to reach net zero targets was higher among the following subgroups:
- People in age groups 55 and over: between 45% and 47% compared with between 32% and 35% in age groups 16 to 44.
- People living in owner-occupied homes: 45% compared with 27% for those living in rented accommodation. Knowledge was lower among social renters (21%) compared with private renters (34%).
- People who said they knew a lot or a fair amount about net zero: 69% compared with 11% of those who knew at most a little and 2% of those who were not aware of net zero.
Heat pumps
Questions about awareness of air source and ground source heat pumps and the likelihood of installing them have been asked annually in Winter waves since 2021, alongside similar questions for other types of low carbon heating. From Spring 2025, an adapted shorter version of these questions was added to allow more frequent tracking of awareness and attitudes towards air source and ground source heat pumps only. Awareness of the more complete list of all seven types of low carbon heating systems continues to be tracked annually in Winter waves.
In Summer 2026 a further question was added to assess awareness of air-to-air heat pumps. This was asked after the existing questions about air source and ground source heat pumps.
Awareness of heat pumps
A brief description of each of the three types of heat pump was provided to respondents prior to questions on awareness, as follows:
- Air source heat pumps- these extract heat from the outside air to heat your home and water.
- Ground source heat pumps - these extract heat from pipes buried in the ground to heat your home and water.
- Air-to-air heat pumps - these take heat from the outside air and blow warm air into your home using indoor fan units. Some models can also provide cooling. Unlike some other types of heat pumps (for example, air source heat pumps), they do not use radiators and only provide heating, not hot water.
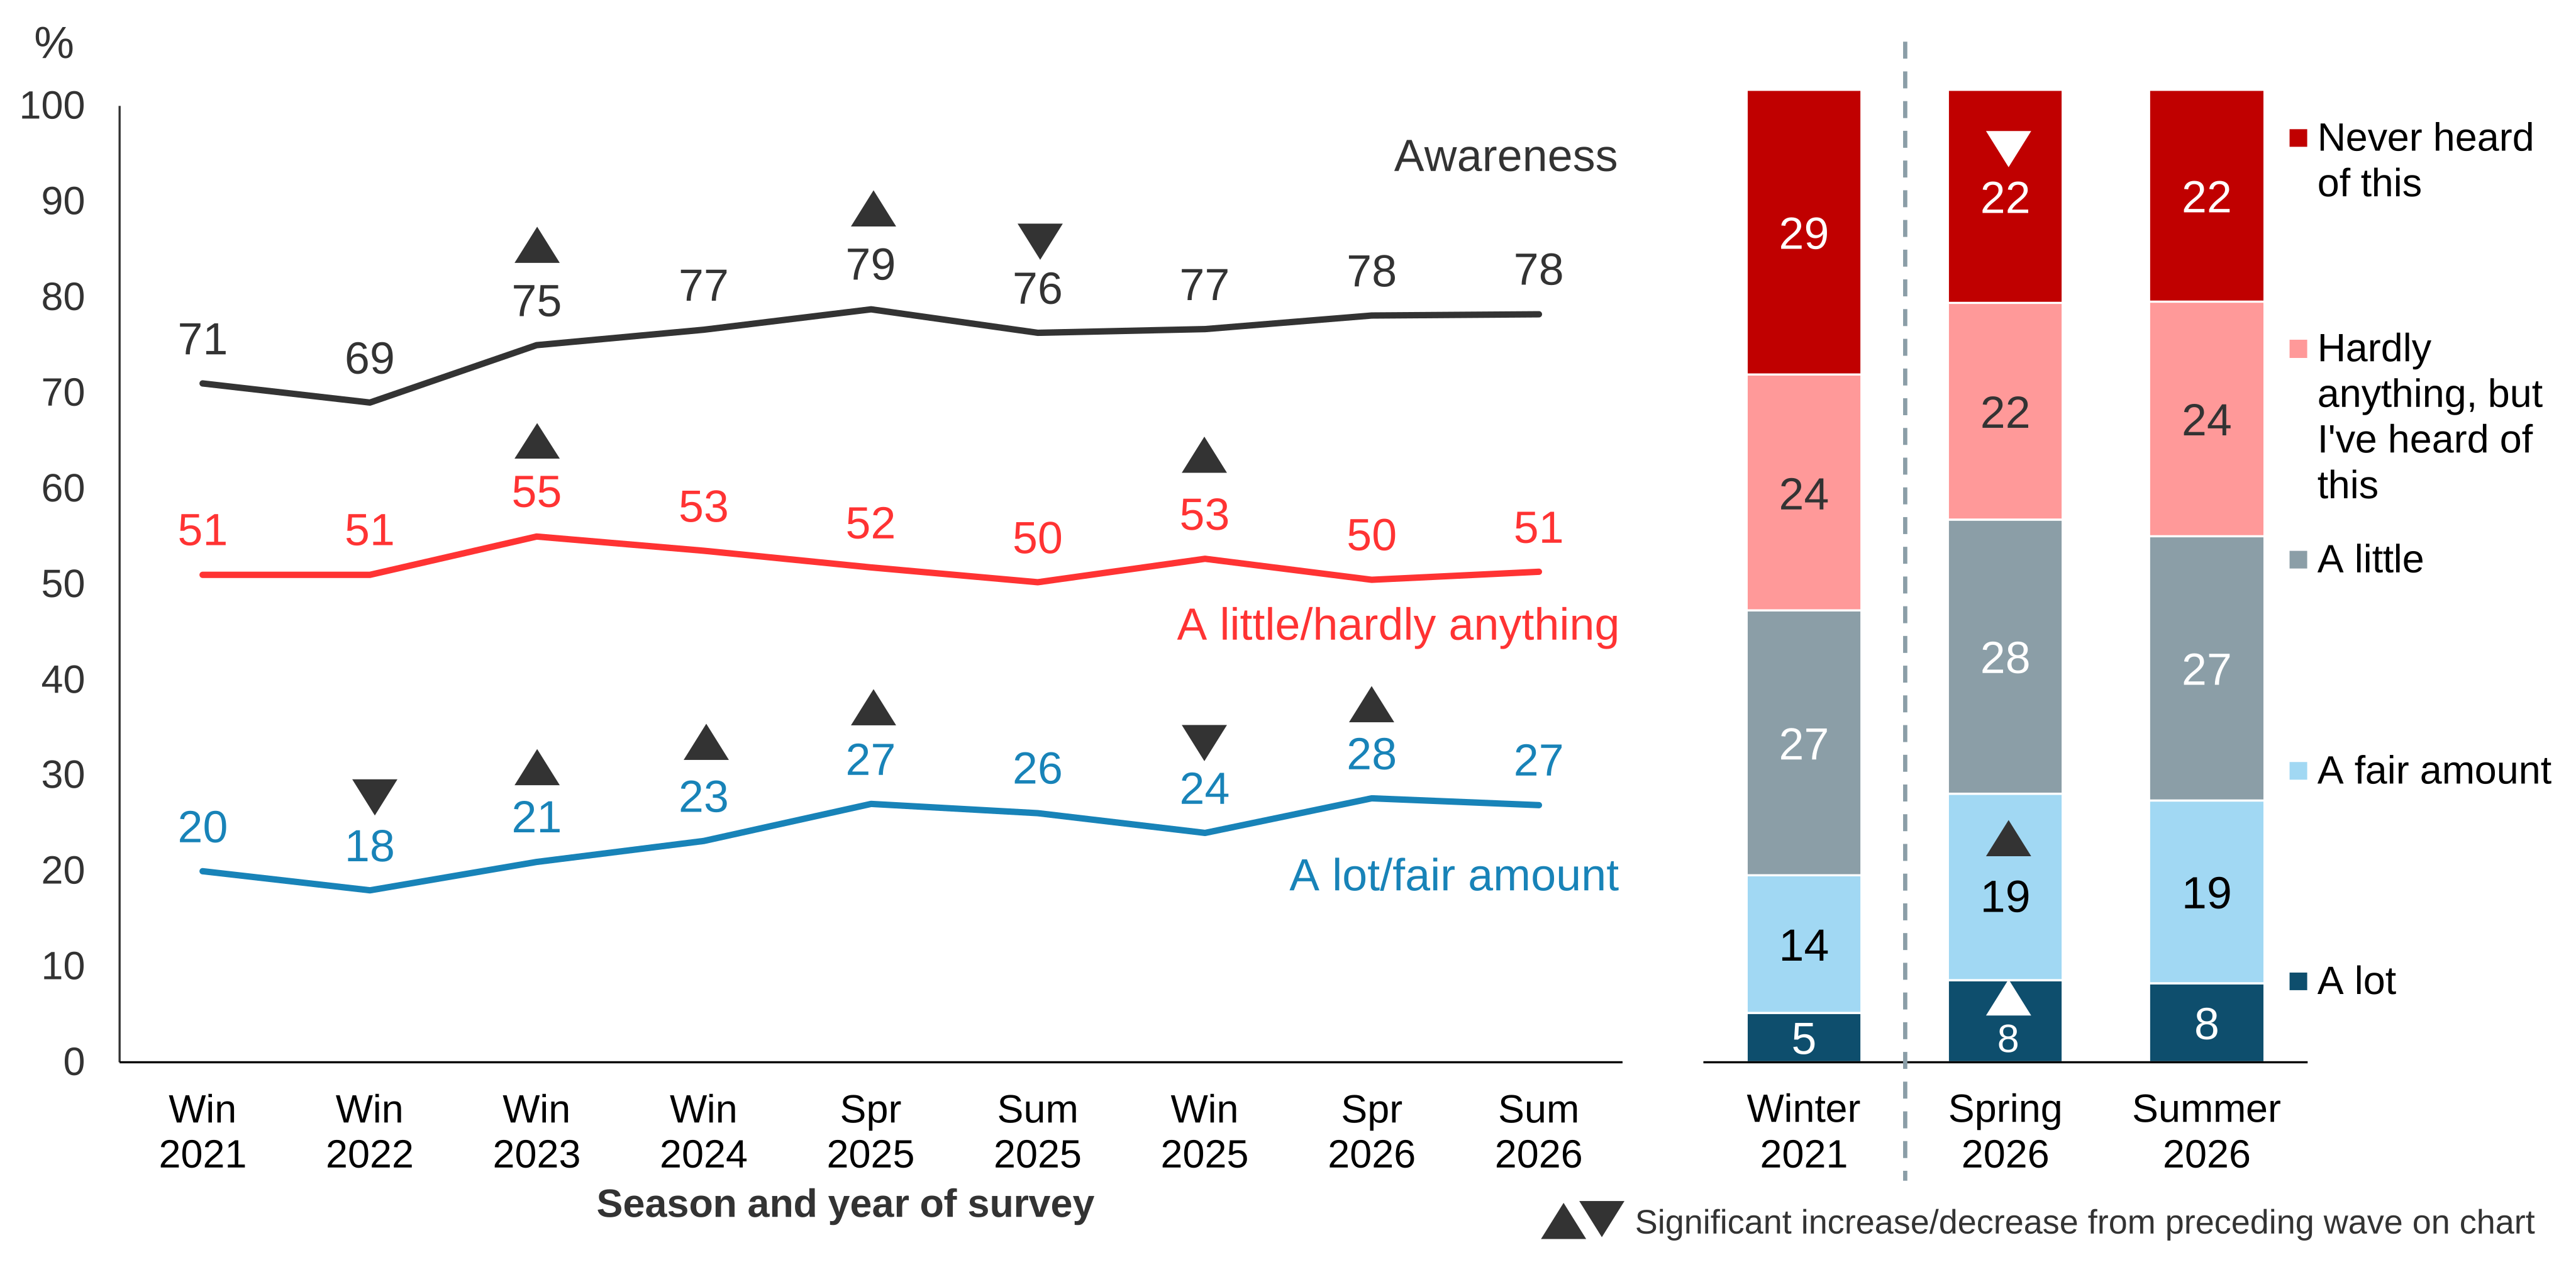
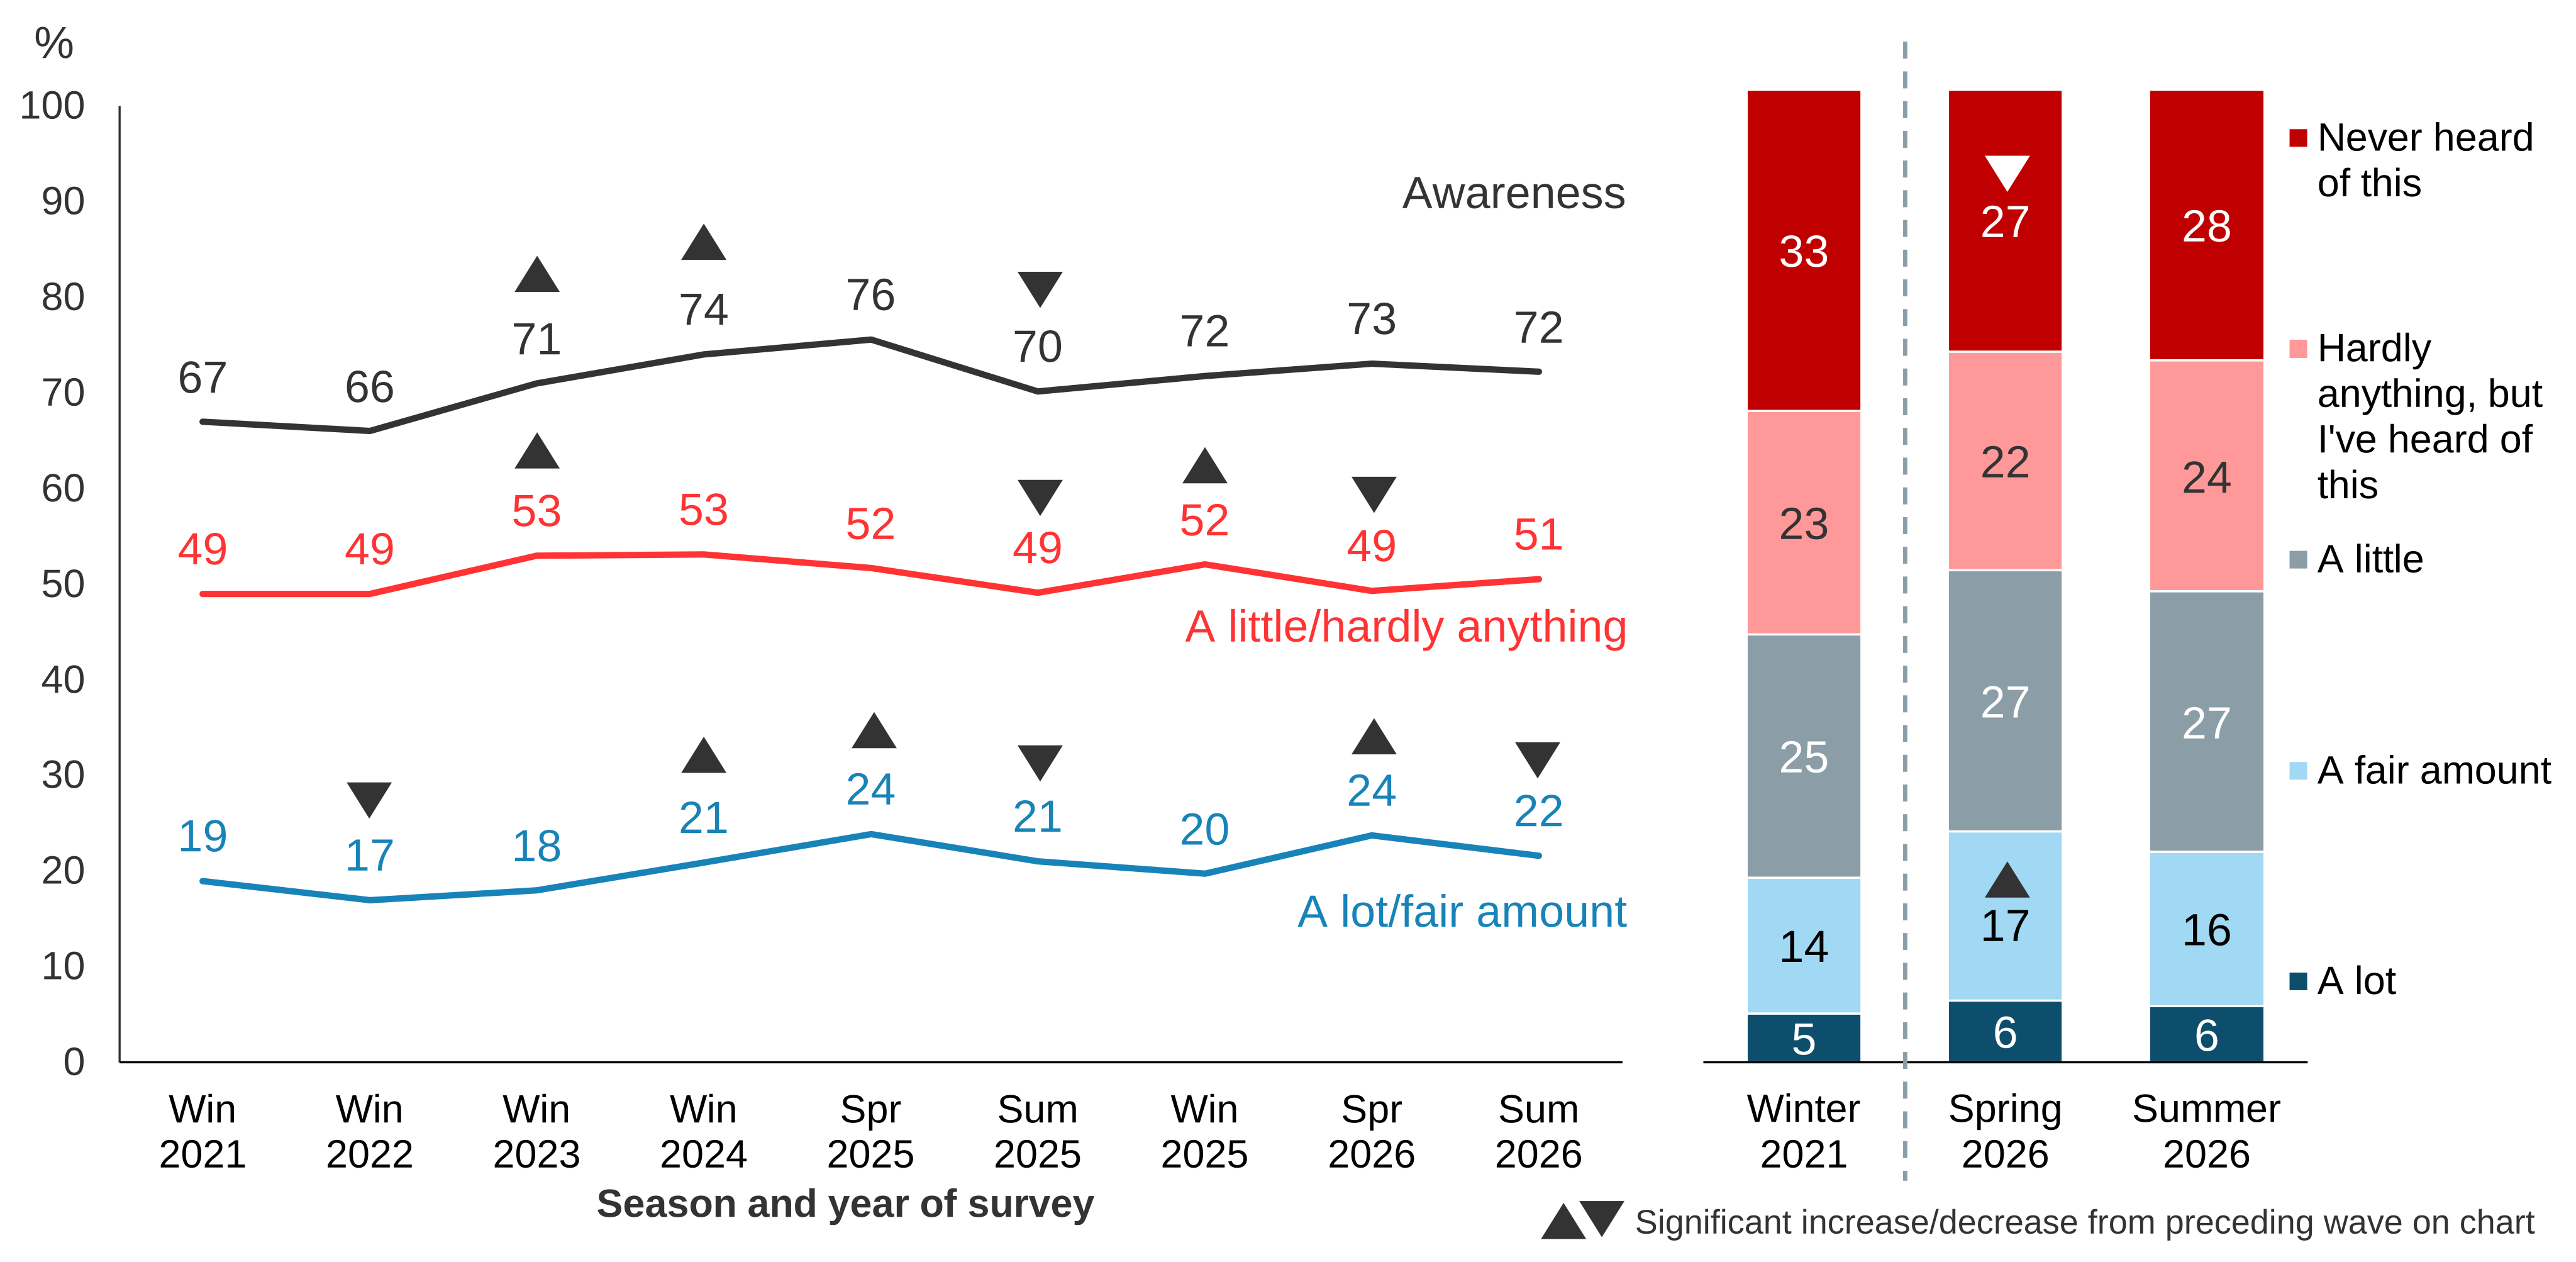
Figure 4.2 shows awareness of air source heat pumps and Figure 4.3 shows awareness of ground source heat pumps.
Awareness (78%) and knowledge (27%) of air source heat pumps remained stable between Spring and Summer 2026. Awareness of ground source heat pumps (72%) remained stable between Spring and Summer 2026, though knowledge dropped from 24% in Spring 2026 to 22% in Summer 2026.
Over the longer term, awareness and knowledge of both air source and ground source heat pumps increased between Winter 2021 and Spring 2025, with no further increase since that peak.
Figure 4.2: Knowledge about air source heat pumps (% based on all people), Winter 2021 to 2024, Spring 2025 to Summer 2026
LCHEATKNOW1. How much would you say you know about the following low carbon heating systems: air source heat pumps?
Base: All wave respondents – Winter 2021 (3,696), Winter 2022 (3,552), Winter 2023 (3,736), Winter 2024 (3,209), Spring 2025 (3,410), Summer 2025 (3,524), Winter 2025 (3,278), Spring 2026 (3,386), Summer 2026 (3,235).
Figure 4.3: Knowledge about ground source heat pumps (% based on all people), Winter 2021 to 2024, Spring 2025 to Summer 2026
LCHEATKNOW2. How much would you say you know about the following low carbon heating systems: ground source heat pumps?
Base: All wave respondents – Winter 2021 (3,693), Winter 2022 (3,560), Winter 2023 (3,729), Winter 2024 (3,211), Spring 2025 (3,406), Summer 2025 (3,516), Winter 2025 (3,276), Spring 2026 (3,380), Summer 2026 (3,232).
Note: On the line charts (Figures 4.2 and 4.3), arrows denote a significant difference between one wave and the next. For the bar charts, significant differences are noted between Winter 2021 and Spring 2026, and between Spring 2026 and Summer 2026.
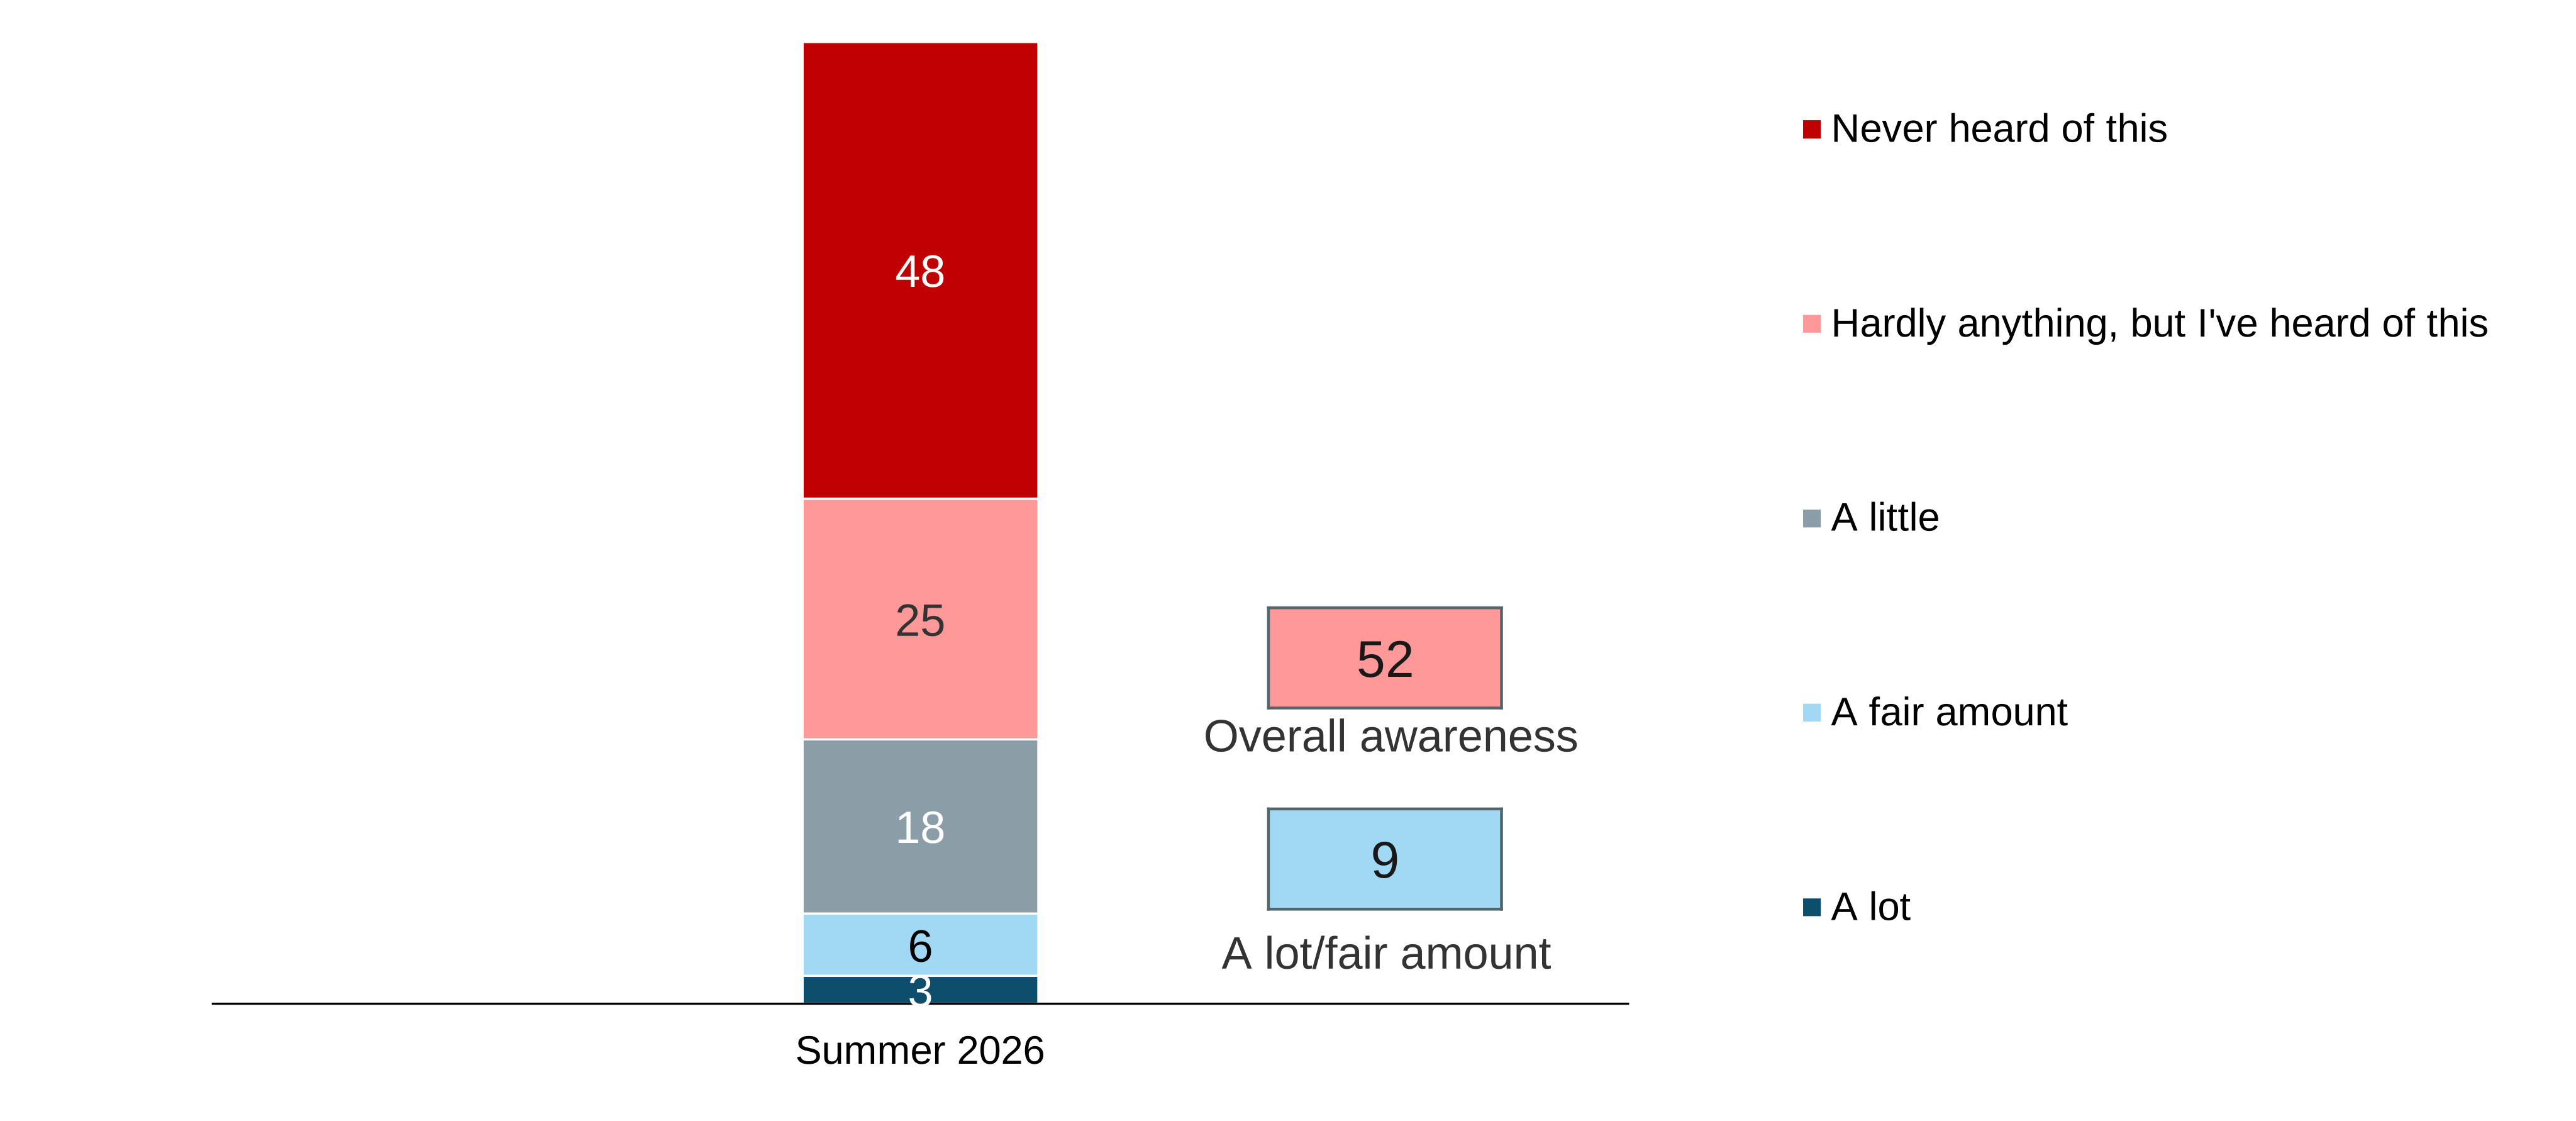
Figure 4.4 shows awareness of air-to-air heat pumps which comes from a new question in Summer 2026. Awareness of air-to-air heat pumps (52%) was considerably lower than for air source (78%) and ground source heat pumps (72%). Knowledge (a lot or a fair amount) of air-to-air heat pumps was also much lower (9% compared with 27% for air source and 22% for ground source heat pumps).
Figure 4.4: Knowledge about air-to-air heat pumps (% based on all people), Summer 2026
LCHEATKNOW9. How much would you say you know about air-to-air heat pumps?
Base: All wave respondents – Summer 2026 (3,237).
Analysis by subgroups
Awareness of different types of heat pump was higher for the following subgroups:
By age:
- People in age groups 45 and over for air source heat pumps: between 85% and 89% compared with between 59% and 68% for those in age groups 16 to 34.
- People in age groups 45 and over for ground source heat pumps: between 78% and 82% compared with between 60% and 62% for those in age groups 16 to 34.
- There was no difference by age in awareness of air-to-air heat pumps.
- Knowledge was lower for both air source and ground source heat pumps among those aged under 25 (both 12%) than among people in age groups 25 and over.
By tenure:
- For all three types of heat pump, awareness was higher among people living in owner-occupied households: air source heat pumps (85% vs 65% for those in rented households), ground source heat pumps (79% vs 59% for those in rented households), and air-to-air heat pumps (55% vs 47% for those in rented households). There were similar patterns of difference for knowledge.
By self-reported knowledge of net zero:
- For all three types of heat pump, awareness was higher for those who reported knowing a lot or a fair amount about net zero: air source heat pumps (90% vs 43% of those unaware of net zero), ground source heat pumps (88% vs 30% of those unaware of net zero), and air-to-air heat pumps (63% vs 26% of those unaware of net zero). There were similar patterns of difference for knowledge.
Likelihood of installing heat pumps
To gauge the propensity to adopt heat pumps, respondents were asked if they would consider installing an air source heat pump or a ground source heat pump[footnote 1].
In Summer 2026, around one in four people (24% for air source and 25% for ground source heat pumps) said that a decision around installing a new heating system was not theirs to make. This was mainly explained by people renting: for each type of heat pump around five in ten renters said that this was not their decision to make (54% for both air source and ground source) compared with under one in ten people in owner-occupier households (9% for both air source and ground source). Given the high rate of renters who said these questions were not applicable to them, the findings for these questions have been based only on people living in owner-occupied households.
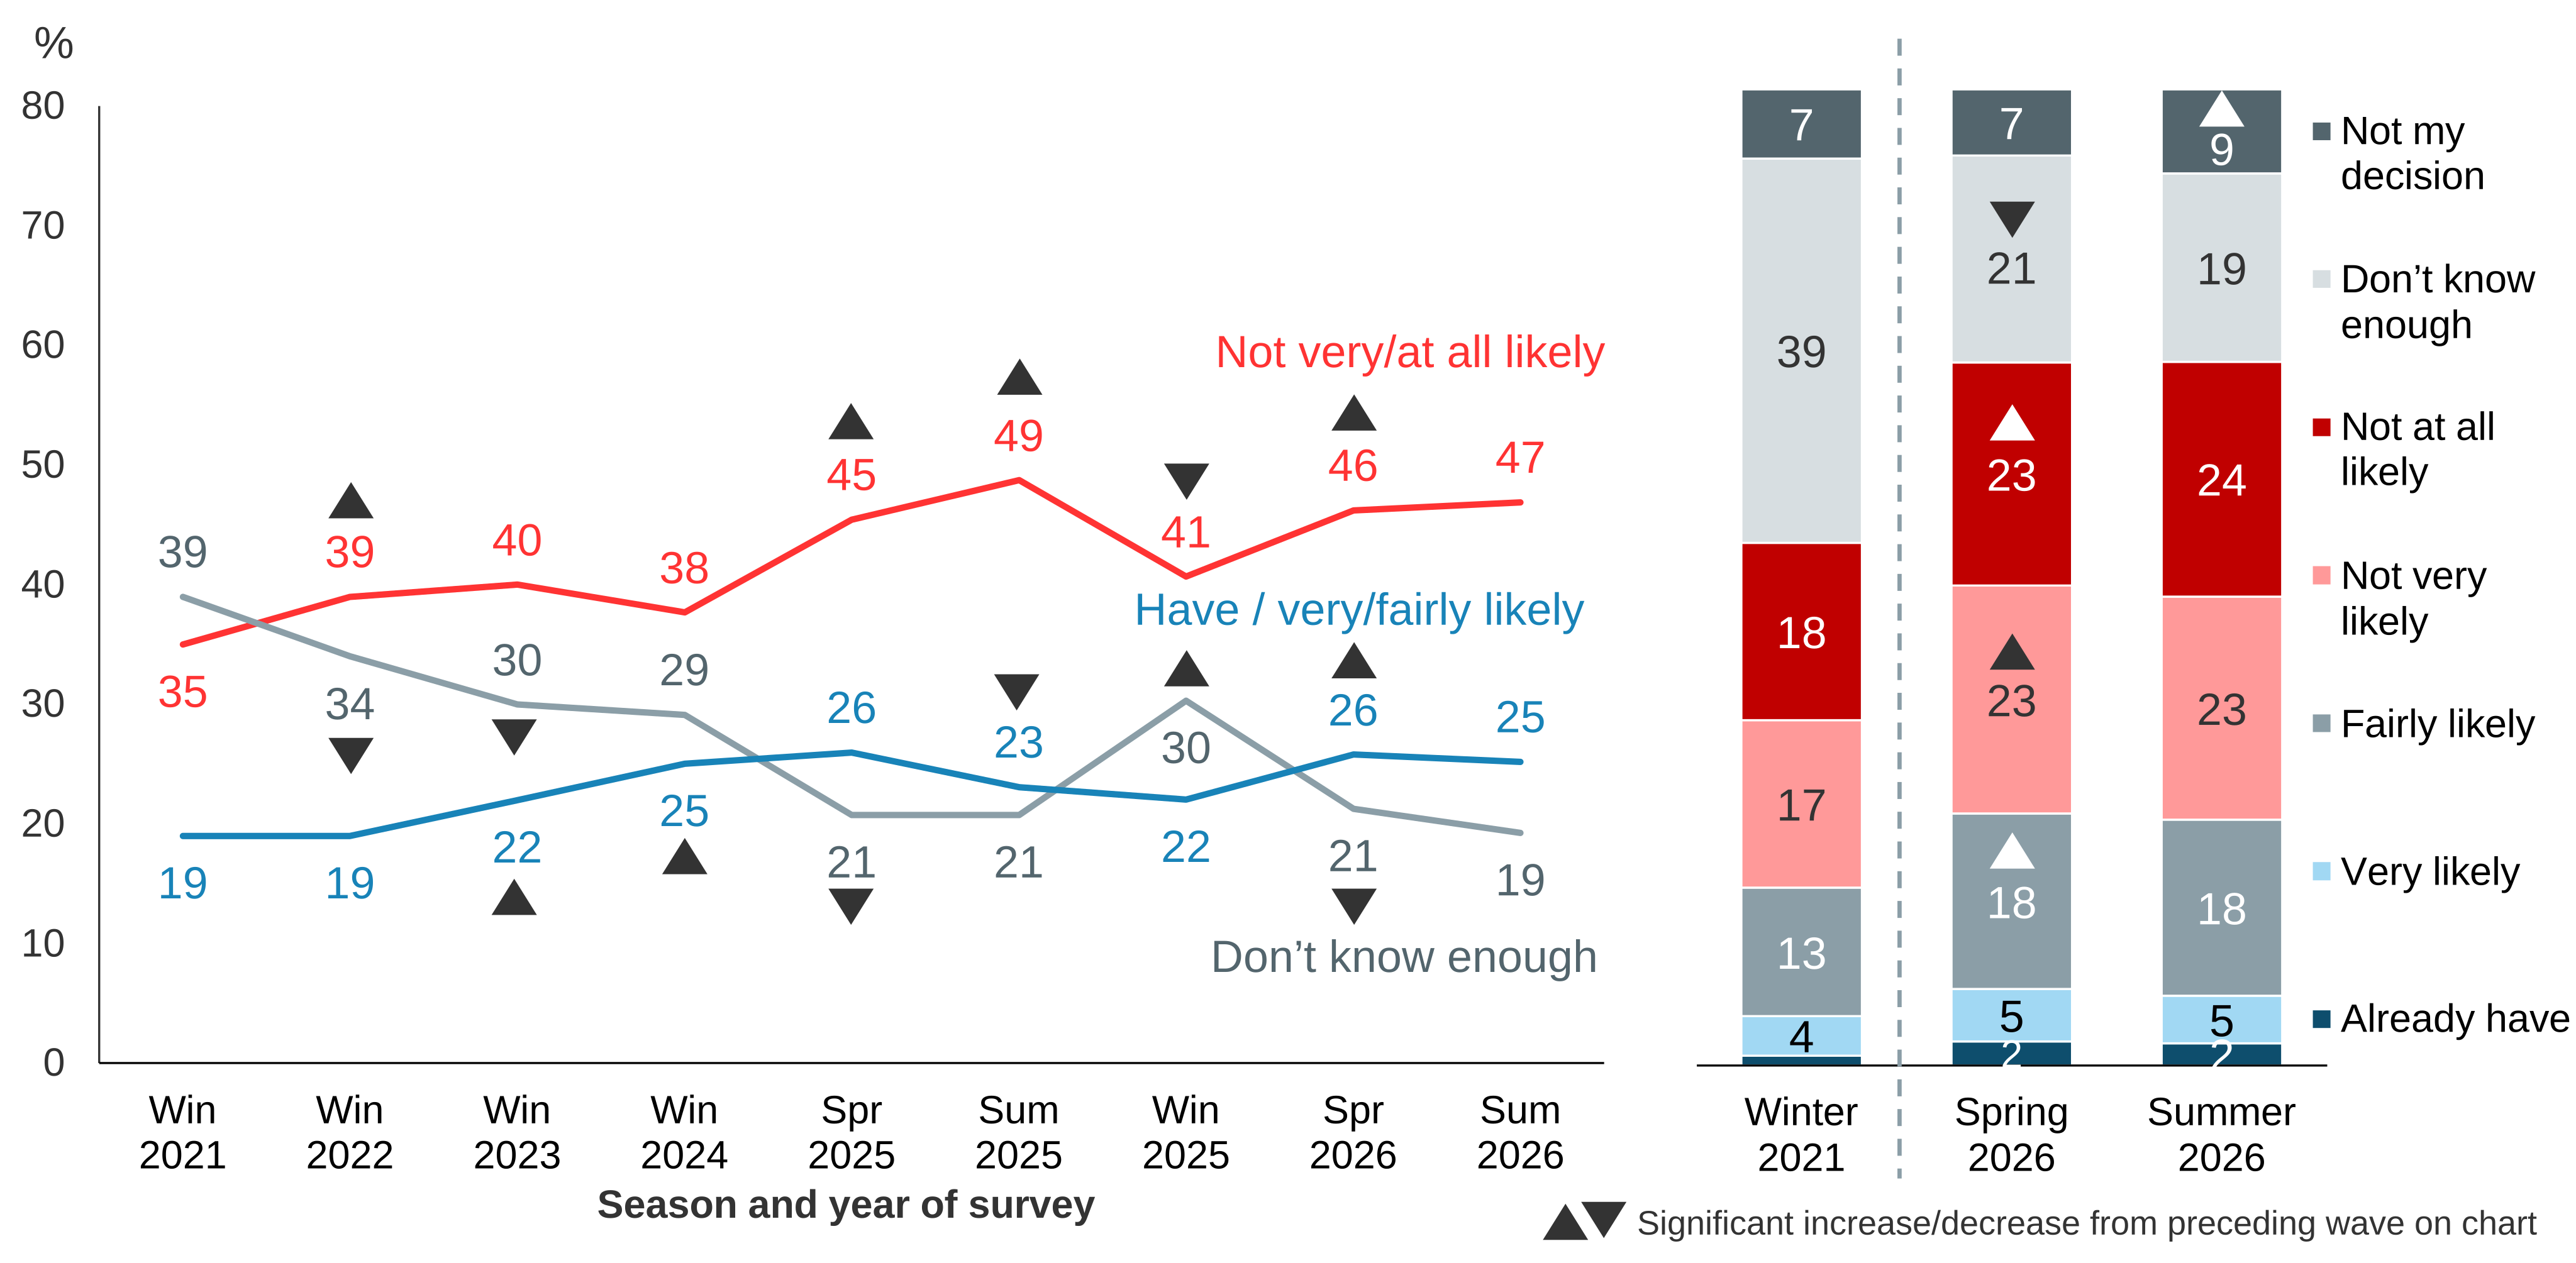
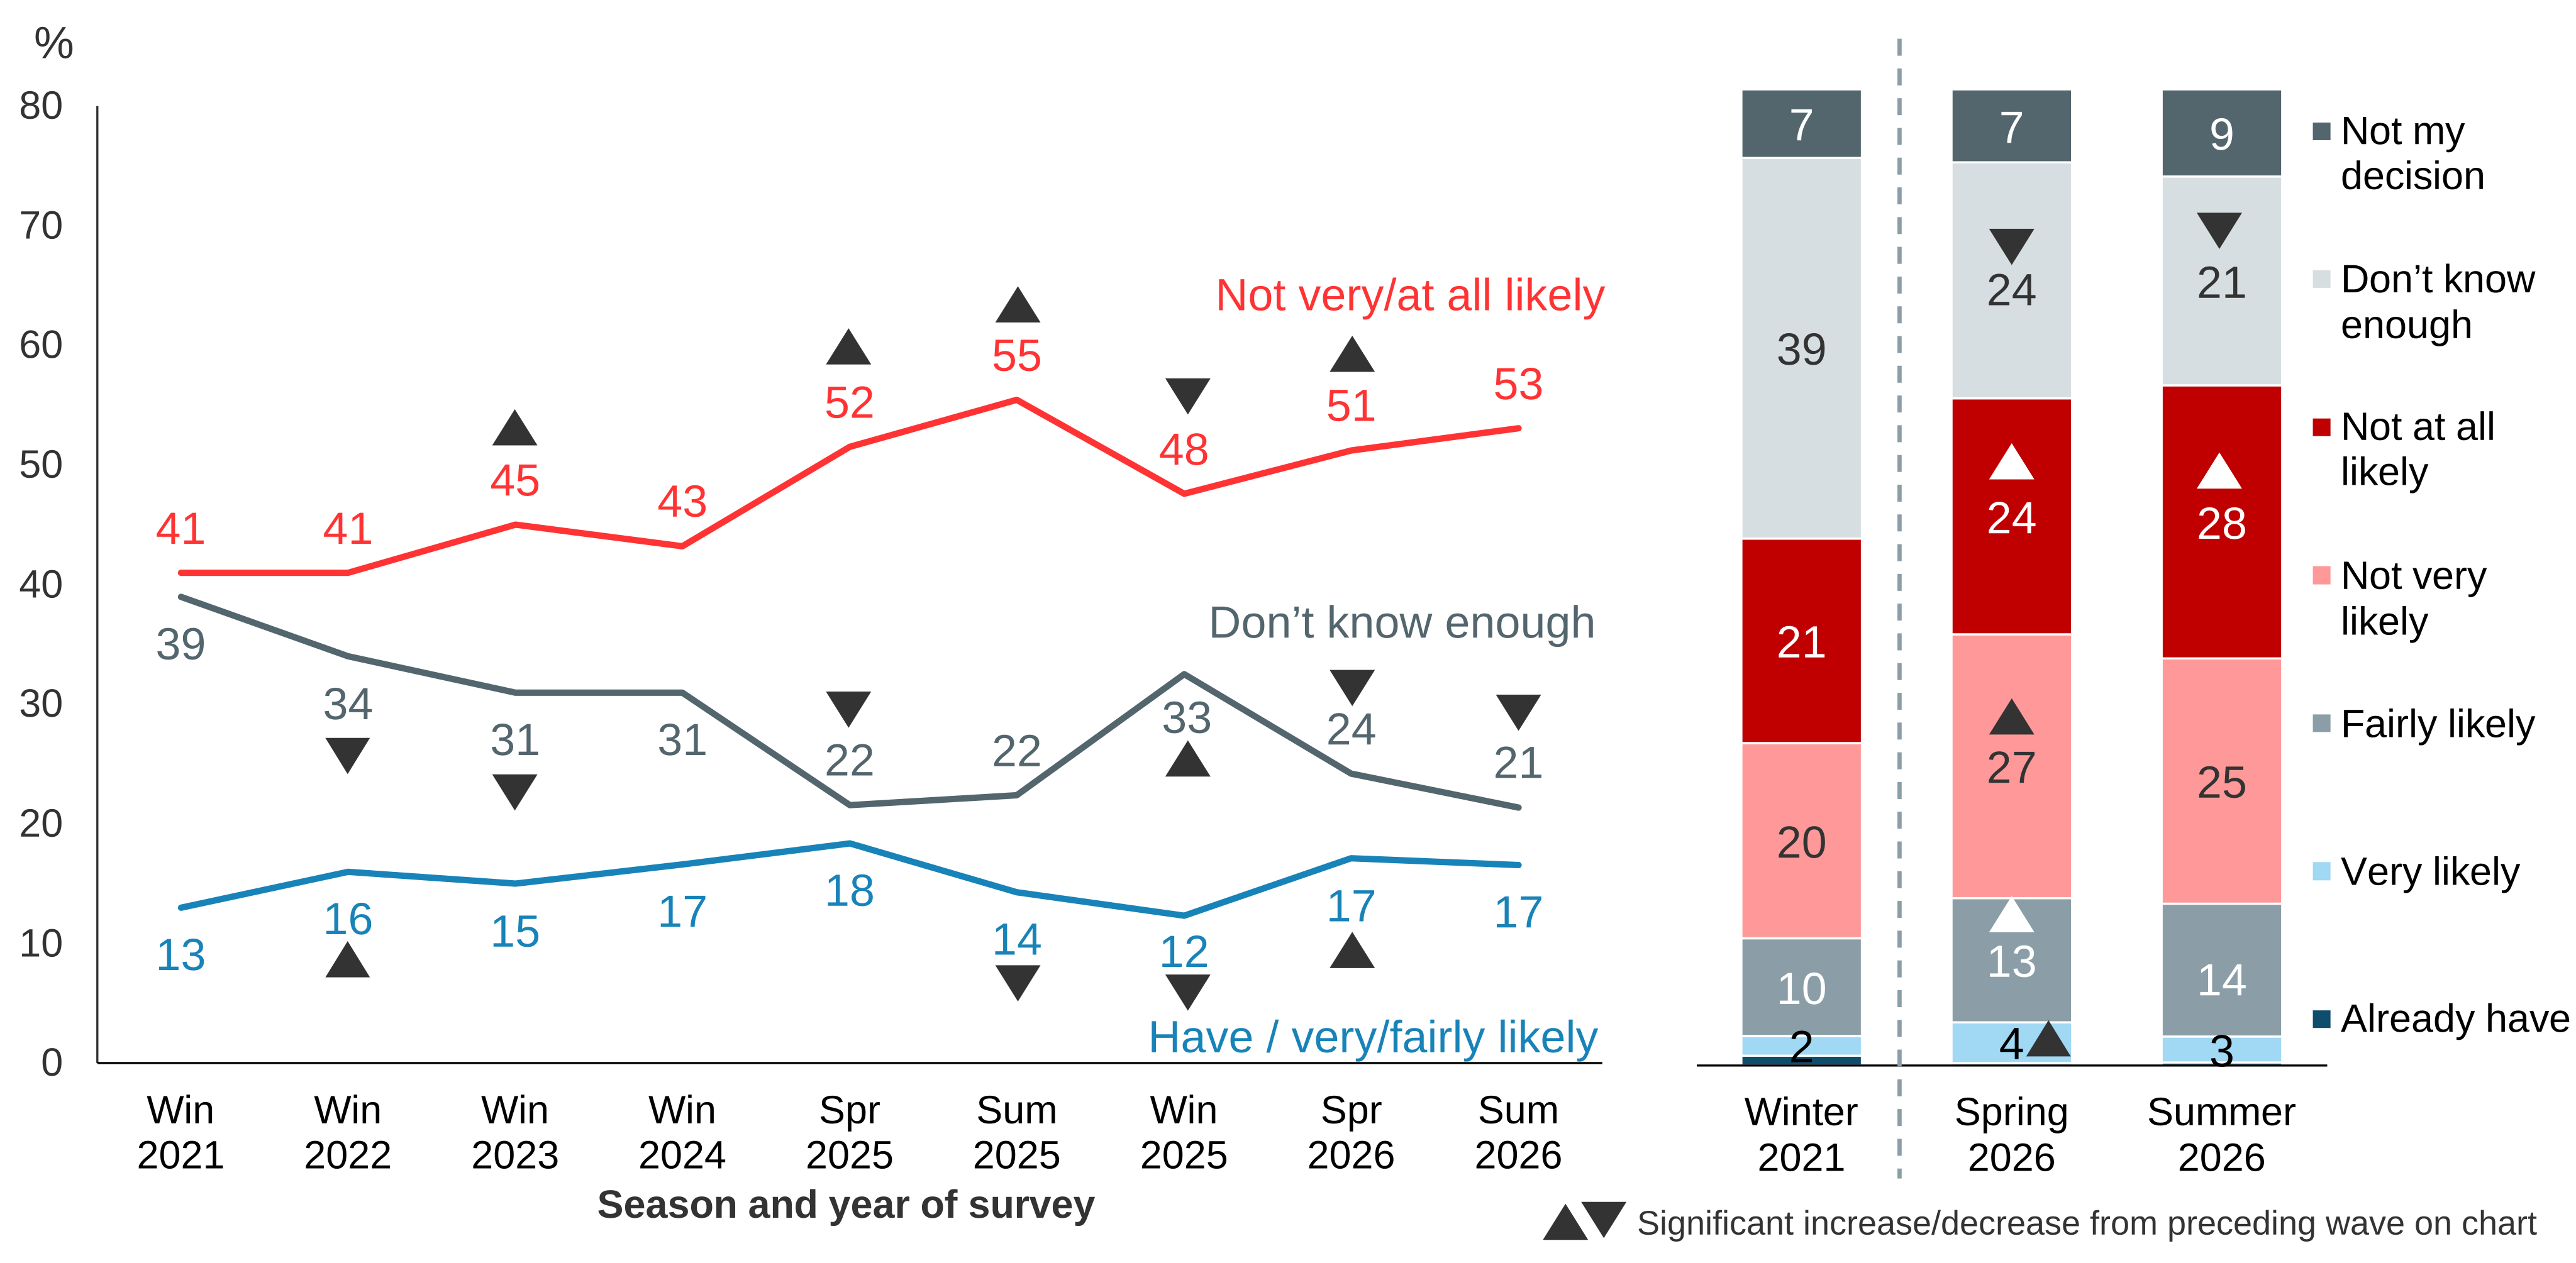
Figures 4.5 and 4.6 respectively display the likelihood of installing air source heat pumps and ground source heat pumps, rebased on all people living in owner-occupied homes. Only a very small proportion of people living in owner-occupied homes in Summer 2026 said that they had already installed one (2% for air source heat pumps and less than 1% for ground source heat pumps).
In Summer 2026, the likelihood of installation was highest for air source heat pumps, with 25% saying they were very or fairly likely to install one, or that they already had one, stable compared with Spring 2026. Fewer people said they were likely to install a ground source heat pump or already had one, but this was also stable compared with Spring 2026 at 17%.
Over the longer term, the proportion who already had a heat pump or were likely to install one increased for both types of heat pump between Winter 2021 and Summer 2026 (from 19% to 25% for air source heat pumps and from 13% to 17% for ground source heat pumps). There have been some fluctuations in recent waves, but Summer 2026 levels remained similar to those seen at the Spring 2025 peak.
Between Winter 2024 and Summer 2026, there was seasonal variation in reluctance to install both types of heat pump. Reluctance levels increased in spring and summer waves and decreased in winter waves, while the proportion who said they did not know enough to decide did the inverse. Comparing the summer waves, there was no significant change in reluctance levels between Summer 2025 and Summer 2026. However, reluctance levels remained above Winter 2021 baseline levels for both air source (47% up from 35%) and ground source (53% up from 41%) heat pumps.
Figure 4.5: Whether likely to install air source heat pumps next time they need to change (% based on people living in owner-occupied homes), Winter 2021 to 2024, Spring 2025 to Summer 2026
LCHEATINSTALL1. How likely is it that you would install each of the following heating systems in your home when you next need to change your heating system or boiler: air source heat pumps?
Base: All wave respondents living in owner-occupied homes – Winter 2021 (2,738), Winter 2022 (2,566), Winter 2023 (2,681), Winter 2024 (2,476), Spring 2025 (2,622), Summer 2025 (2,788), Winter 2025 (2,480), Spring 2026 (2,614), Summer 2026 (2,465).
Figure 4.6: Whether likely to install ground source heat pumps next time they need to change (% based on people living in owner-occupied homes), Winter 2021 to 2024, Spring 2025 to Summer 2026
LCHEATINSTALL2. How likely is it that you would install each of the following heating systems in your home when you next need to change your heating system or boiler: ground source heat pumps?
Base: All wave respondents living in owner-occupied homes – Winter 2021 (2,728), Winter 2022 (2,561), Winter 2023 (2,634), Winter 2024 (2,448), Spring 2025 (2,614), Summer 2025 (2,780), Winter 2025 (2,455), Spring 2026 (2,600), Summer 2026 (2,460).
Note: On the line charts (in Figures 4.5 and 4.6), the vertical scale has been reduced to 0 to 80%, and arrows denote a significant difference between one wave and the next. For the bar charts, significant differences are noted between Winter 2021 and Spring 2026, and between Spring 2026 and Summer 2026.
Analysis by subgroups
The following subgroup trends on likelihood of installing heat pumps are also based on people living in owner-occupied homes only. The age-related findings are based on ages 25 and above due to a low base (n=82) of owner-occupiers in the 16-24 age group.
By age:
- Those aged 65 and above were less likely than younger people to report they already had, or were likely to install, either type of heat pump:
- For air source heat pumps: 18% of those aged 65 and over compared with between 26% and 37% for those in age groups 25 to 64.
- For ground source heat pumps: 9% of those aged 65 and over compared with between 17% and 24% for those in age groups 25 to 64.
By annual personal income:
- People with a personal income of £45,000 or more were more likely to report they already had, or were likely to install, air source heat pumps: 37% compared with between 21% and 22% for those in income bands below £30,000.
- Those with a personal income of £45,000 or more were also more likely to already have or to be likely to install ground source heat pumps: 23% compared with between 15% and 16% for those in income bands below £30,000.
Attitudes towards solar panels in the home
Respondents were asked whether they were likely to consider installing solar panels in their home in the next few years. This question had been asked annually in spring but was asked additionally in Summer 2026. This means that some seasonal effect may contribute to any change this wave.
A relatively large proportion of people who rented their home (38%) said that this question was not applicable to them as it was not their decision to make. The results are, therefore, based only on people living in owner-occupied homes.
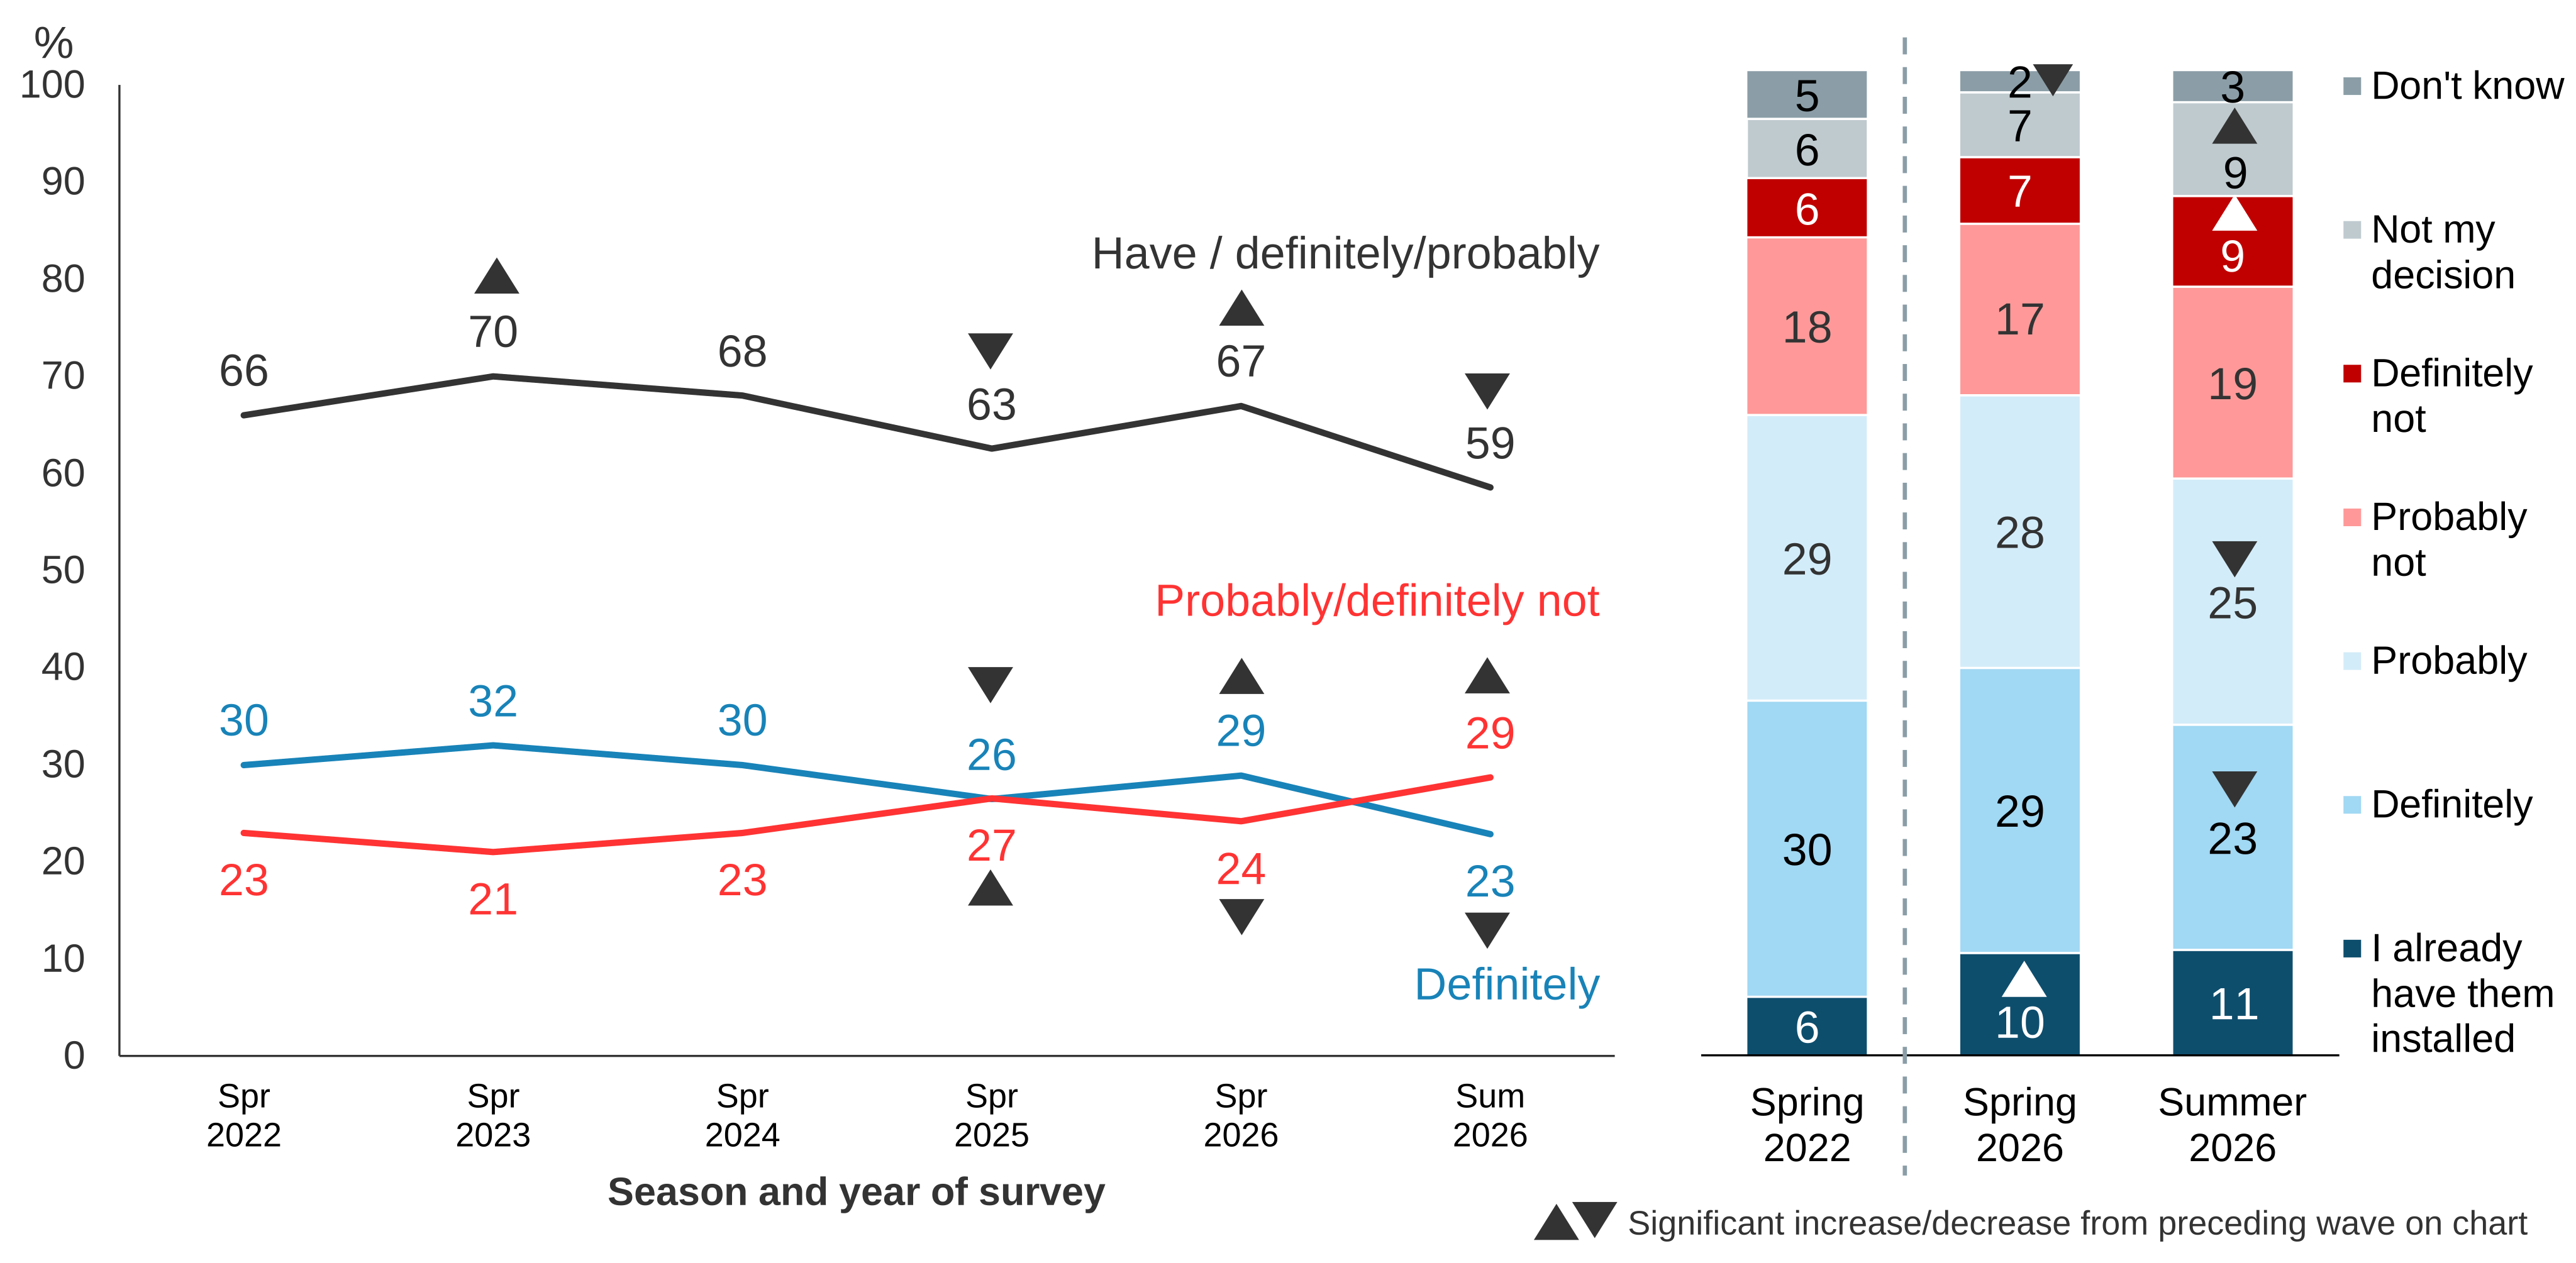
In Summer 2026, 59% of people living in owner-occupied homes said they either already had solar panels (11%) or would probably or definitely consider installing them (48%). This proportion (59%) decreased from 67% in Spring 2026 to the lowest level seen so far, though seasonal effects may have played some role in this change. The proportion who would definitely consider installing panels also decreased from 29% in Spring 2026 to 23% in Summer 2026. Correspondingly, the proportion unlikely to consider installing panels increased from 24% in Spring 2026 to 29% in Summer 2026 (Figure 4.7).
In the longer term, levels have fluctuated. The decline in Summer 2026 meant that the proportion who said they already had or would be likely to consider installing solar panels (59%) was lower than at the Spring 2022 baseline (66%). Again, this question has only previously been measured in Spring waves, so this lower level may reflect some seasonal impact, with energy needs less top of mind in summer. Data from future waves are needed to assess whether this is seasonal variation or represents a sustained decrease.
Figure 4.7: Likelihood to consider installing solar panels in the home to generate electricity (% based on people living in owner-occupied homes) Spring 2022 to 2026 and Summer 2026
SOLARHOME. Would you consider having solar panels installed in your current home to generate electricity, in the next few years?
Base: All wave respondents living in owner-occupied homes - Spring 2022 (3,285), Spring 2023 (3,239), Spring 2024 (3,175), Spring 2025 (2,631), Spring 2026 (2,618), Summer 2026 (2,466).
Note: On the line chart, arrows denote a significant difference between one wave and the next. For the bar charts, significant differences are noted between Spring 2022 and Spring 2026, and between Spring 2026 and Summer 2026.
Analysis by subgroups
The following trends are based on people living in owner-occupied homes only. The age-related findings only include ages 25 and above due to the low number (n=82) of owner-occupiers in the 16-24 age group.
The proportions who were willing to consider or had already installed solar panels were higher among the following subgroups:
- Those aged 25 to 44 (between 69% and 76%), compared with 29% of people aged 65 or over.
- Those living in a house or bungalow (61%), compared with 38% of those in a flat.
- Those with an annual personal income of £45,000 or higher (71%), compared with between 54% and 56% of those with an income below £30,000.
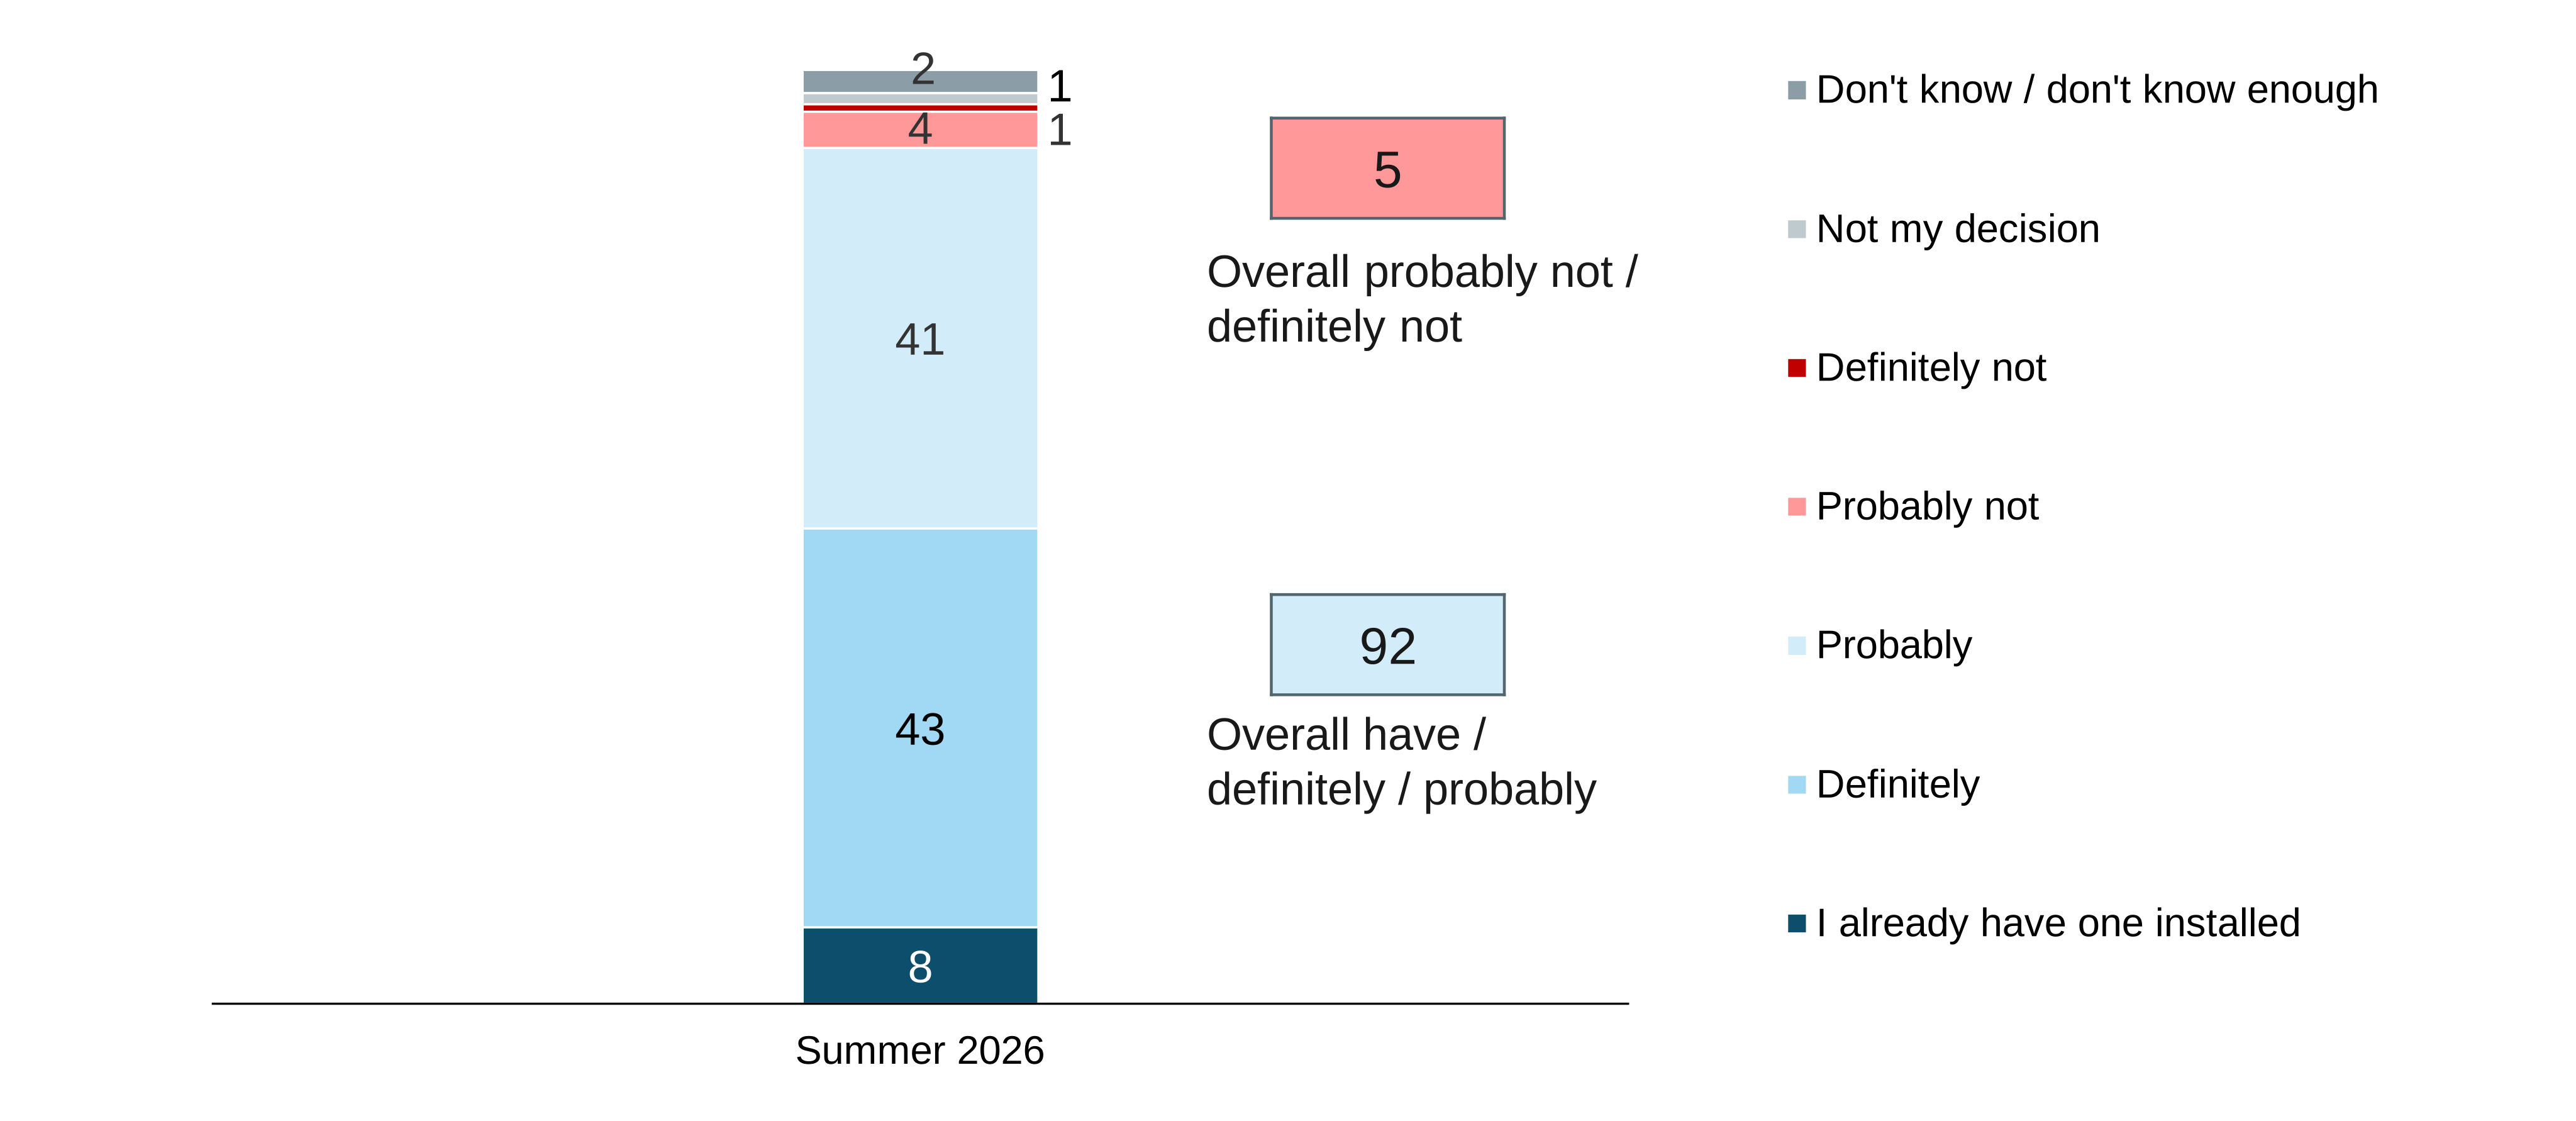
People who said they had already installed, or would definitely or probably consider installing, solar panels in their home were asked whether they would also consider installing a battery to store the electricity generated. Around nine in ten of them already had (8%) or would consider (84%) installing batteries. 43% of them said they would definitely consider installing batteries (Figure 4.8).
Figure 4.8: Likelihood to consider installing batteries in the home to store electricity generated by solar panels (% based on people living in owner-occupied homes who would consider or have solar panels) Summer 2026
SOLARBATTERY. Would you also consider installing a battery to store electricity generated by solar panels? Batteries are usually installed in garages, utility rooms or outside the home and enable unused electricity generated by solar panels to be used at a different time.
Base: All wave respondents living in owner-occupied homes who already have or would consider installing solar panels – Summer 2026 (1,430).
Further findings on heat and energy in the home
In previous waves, questions were included on other topics relating to heat and energy in the home. The latest findings relating to these topics can be found as follows:
- Awareness of, and likelihood of installing a range of different types of low carbon heating systems, and attitudes towards such systems, see Winter 2025 report on heat and energy use in the home – section on ‘Low carbon heating systems’
- Reasons for attitudes towards solar panels, and what might encourage installation in the home, see Spring 2026 report on heat and energy in the home – section on ‘Attitudes towards solar panels in the home’
- The methods used to heat and cool homes, see Winter 2025 report on heat and energy use in the home – section on ‘Heating and cooling in the home’
- Results from questions prior to Winter 2025 about the main systems used to heat and cool homes, see Winter 2024 report on heat and energy use in the home – section on ‘Heating and cooling in the home’
- Likelihood of replacing heating systems and who people would trust to provide advice about which heating system to install, see Winter 2025 report on heat and energy use in the home – section on ‘Likelihood to replace heating systems’
- Awareness of Energy Performance Certificates and EPC recommendations, and changes made as a result, see Winter 2025 report on heat and energy use in the home – section on ‘Energy Performance Certificates (EPCs)’
- Awareness of the minimum energy standards for rental properties, see Winter 2025 report on heat and energy use in the home – section on ‘Awareness of rental property standards’
- Types of insulation in the home, see Winter 2022 report on heat and energy in the home - section on ‘Insulation in the home’
-
Results throughout this section are weighted by individuals. In practice, the differences between weighting these results by individual or by household are minor and do not change the narrative of the results. ↩