Main findings: childcare providers and inspections as at 31 March 2022
Published 29 June 2022
Applies to England

© Crown copyright 2022
This publication is licensed under the terms of the Open Government Licence v3.0 except where otherwise stated. To view this licence, visit nationalarchives.gov.uk/doc/open-government-licence/version/3 or write to the Information Policy Team, The National Archives, Kew, London TW9 4DU, or email: psi@nationalarchives.gov.uk.
Where we have identified any third party copyright information you will need to obtain permission from the copyright holders concerned.
This publication is available at https://www.gov.uk/government/statistics/childcare-providers-and-inspections-as-at-31-march-2022/main-findings-childcare-providers-and-inspections-as-at-31-march-2022
This is the main findings report for the childcare providers and inspections as at 31 March 2022 release. The following are also available:
- underlying data
- methodology
- pre-release access list
Summary
This release contains:
- the number of Ofsted-registered childcare providers and places, and their most recent inspection outcomes on 31 March 2022
- the number of providers that have registered with Ofsted (joiners) and the number that have left (leavers) between 31 August 2021 and 31 March 2022
Summary of findings
Between 1 April 2021 and 31 March 2022, there was a net overall decrease of around 4,000 childcare providers, representing the largest decline since 2015–16.
The number of childcare places offered by providers on the Early Years Register (EYR) has remained broadly stable since August 2015.
Between 1 April 2021 and 31 March 2022, the least deprived areas had more of a decrease in the proportion of providers, compared with the most deprived areas (see Figure 1).
As at 31 March 2022, the proportion of childminders that were judged outstanding at their most recent inspection was 13%. A lower proportion of childminders in the most deprived areas had received an outstanding judgement.
Figure 1: Change in the number of Ofsted-registered providers between 31 March 2021 and 31 March 2022 in the most and least deprived areas in 2021–22
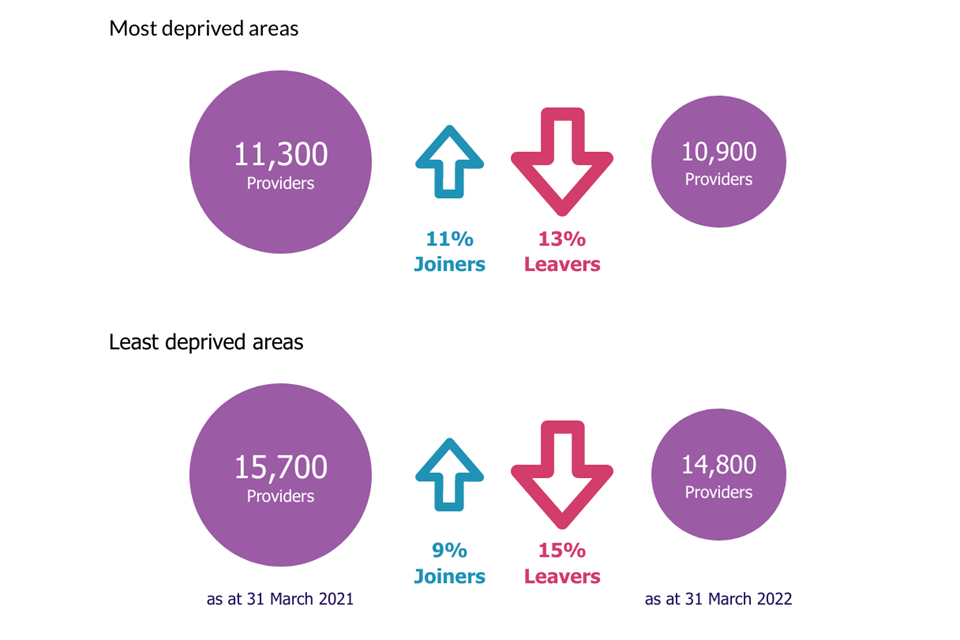
Note: numbers are rounded to the nearest 100.
View data in an accessible table format.
Introduction
The early years and childcare sector is primarily made up of private nurseries, pre-schools and childminders. There are 4 types of early years provision:
Childminders
These are people who look after a child, or children, who they are not related to, for payment or reward. The care takes place in a home that is not the child’s own. The majority of childminders register on the EYR because they look after children aged 0 to 5, but those who look after 5- to 7-year-olds need to register on the compulsory part of the Childcare Register (CCR).
Childcare on non-domestic premises
These are nurseries, pre-schools, holiday clubs and other group-based settings, usually registered on the EYR because they look after children aged 0 to 5.
Home childcarers
These are individuals who care for children aged 0 to 18 wholly or mainly in the child’s own home. They are not required to register with Ofsted, though they may choose to do so on the voluntary part of the Childcare Register (VCR).
Childcare on domestic premises
These are providers where 4 or more people look after children together in a home that is not the child’s. The majority are registered on the EYR and some are registered on the Childcare Register (CR), depending on the age of the children they look after.
Further information about provider types is available in the glossary.
Childminders have the option to register either with Ofsted or with a childminder agency. Childminder agencies are responsible for carrying out quality assurance visits to the childminders who are registered with them. There is more information about childminder agencies in the childminder agencies section of this page.
Childcare in early years is also provided in the schools sector. It is offered in state-funded schools and independent schools. For more information, see the early years provision in the schools sector section of this page.
Providers, registers and places
Number of providers
There were 68,000 childcare providers registered with Ofsted on 31 March 2022, down by 4% (3,000) since the last release in 31 August 2021.[footnote 1] Since 31 August 2015, the number of providers has fallen by 22% (19,100).
Figure 2: Childcare providers registered with Ofsted as at 31 March 2022, by provider type
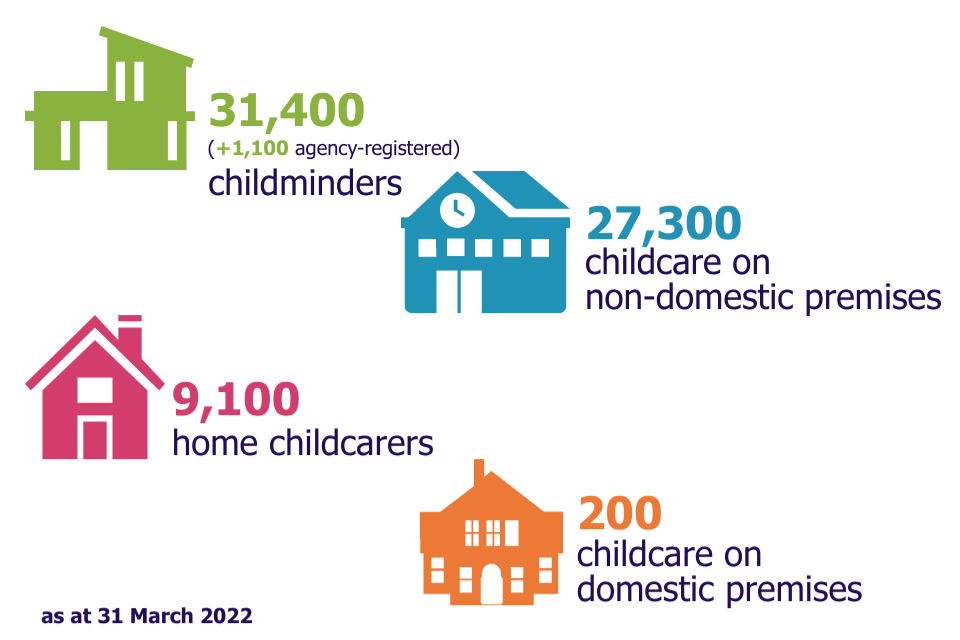
Note: numbers are rounded to the nearest 100.
View data in an accessible table format.
Childminders
There were 31,400 childminders on 31 March 2022, down by 2,300 (7%) since 31 August 2021. This continues a downward trend in number of childminders, with 16,600 (35%) fewer than on 31 August 2015.
Although the number of childminders registered with us has been falling, it is worth noting that childminders can also register with childminder agencies. Agencies vary considerably in size, from being quite small to having hundreds of childminders registered with them. As of 31 March 2022, childminder agencies reported a total of 1,100 childminders on roll. There is more information about childminder agencies in the childminder agencies section of this page.
Childcare on non-domestic premises
There were 27,300 providers on 31 March 2022, a decrease of less than 1% (87) since 31 August 2021. The number of providers has been fairly stable over time, with a drop of 1% since 31 August 2015.
Home childcarers
There were 9,100 home childcarers on 31 March 2022, a decrease of 6% (600) since 31 August 2021. Although the number of home childcarers has fluctuated over time, there are now 20% fewer than there were on 31 August 2015.
Childcare on domestic premises
There were 200 providers on 31 March 2022. The number of providers has remained broadly stable since 31 August 2015.
Joiners and leavers in the childcare sector over time
The number of active providers on our registers has been falling steadily since 2015. The decline in the number of providers is due to more providers leaving than joining the childcare sector (see Figure 3).
Figure 3: Joiners and leavers in the childcare sector, by financial year
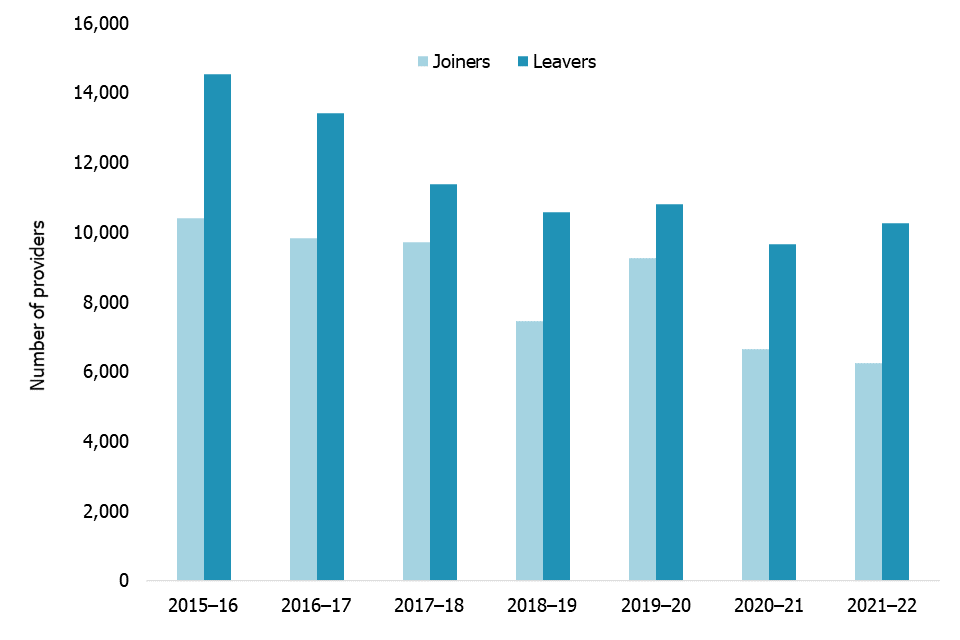
Note: most leavers are provider resignations and most joiners are new provider registrations, but some will be providers moving between the EYR and the CR.
View data in an accessible table format.
Looking at the net difference between joiners and leavers since 2015–16, the fall in overall numbers was highest in 2015–16 (4,100 providers). Between 1 April 2021 and 31 March 2022, there was a net overall decrease of around 4,000 providers, representing the largest decrease since 2015–16.
Registers
On 31 March 2022, 78% (53,200) of Ofsted-registered childcare providers were on the EYR (see Figure 4). The remaining 22% were only on the CR, which has 2 parts: the CCR and the VCR. More information about the different registers is available in the glossary.
Figure 4: Venn diagram of Ofsted-registered providers, by the different registers for childcare
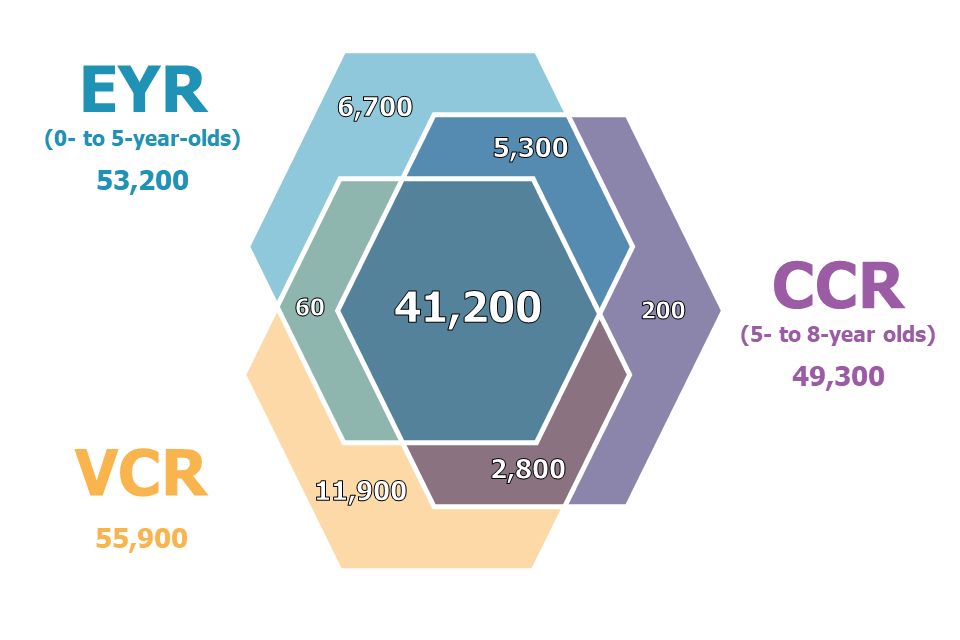
Note: numbers under 100 are rounded to the nearest 10, and numbers over 100 are rounded to the nearest 100 and may not add up.
View data in an accessible table format.
Places
Data on places is reported for the 53,200 providers registered on the EYR. A high proportion of these providers (87%) are also registered on the CCR or VCR.
When considering data on places, it is important to note that it covers all places for children up to the age of 8 in providers registered on the EYR. This data includes all EYR places for children under 5 and CCR places for 5- to 7-year-olds in these providers.
For more methodological notes on places data, see the methodology and quality report that accompanies this release.
Figure 5: Number of childcare places offered by providers on the EYR as at 31 March 2022, by provider type
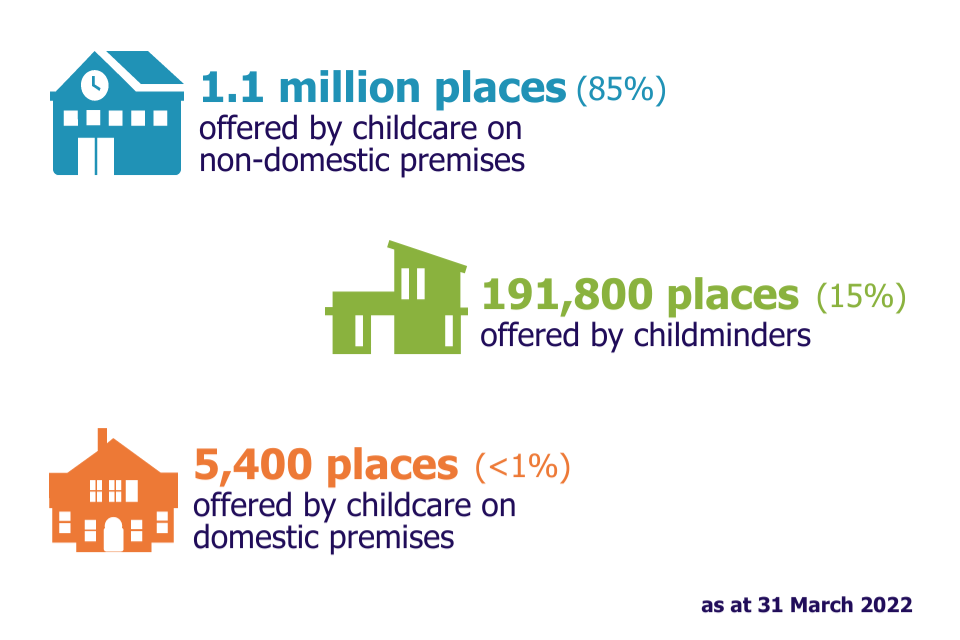
Note: places numbers of less than 1 million are rounded to the nearest 100.
Places numbers of more than 1 million are rounded to the nearest 100,000.
View data in an accessible table format.
Childcare on non-domestic premises
Providers on non-domestic premises offered 85% (1.1 million) of all childcare places, an increase of 5 percentage points since August 2015.[footnote 2] On average, each provider offered 47 places.
Childminders
Childminders offered 15% (191,800) of all places, a decrease of 5 percentage points since August 2015. The average number of places offered by childminders was between 6 and 7. This average takes into account childminders with assistants, who are permitted to offer more than 6 places.
Childcare on domestic premises
Providers on domestic premises offered less than 1% (5,400) of places. On average, each provider offered 23 places.
Figure 6: Childcare providers and places on the EYR over time, by provider type
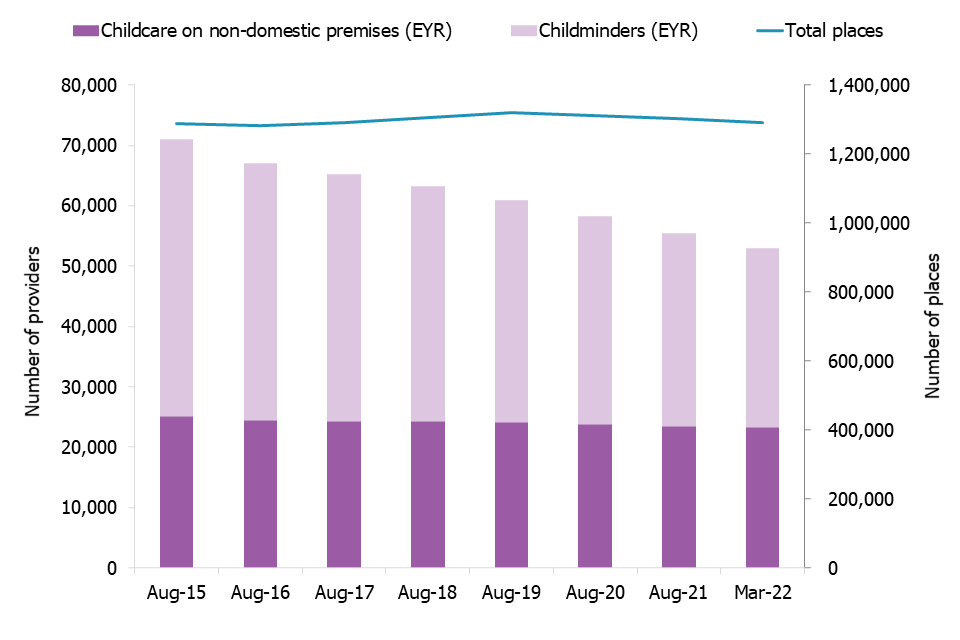
Note: places data from August 2018 onwards is recorded in an updated administrative system and therefore captures a slightly larger number of childcare places than previously.
View data in an accessible table format.
Despite decreasing numbers of childminders, the number of childcare places has remained broadly stable since August 2015 (see Figure 6). This is due to an increase in the number of places offered by each provider over time. Since August 2021, the number of childcare places has decreased by around 11,000 (1%). On 31 March 2022, there were 1.3 million childcare places offered by providers on the EYR.
Childcare provision by level of deprivation
Number of providers
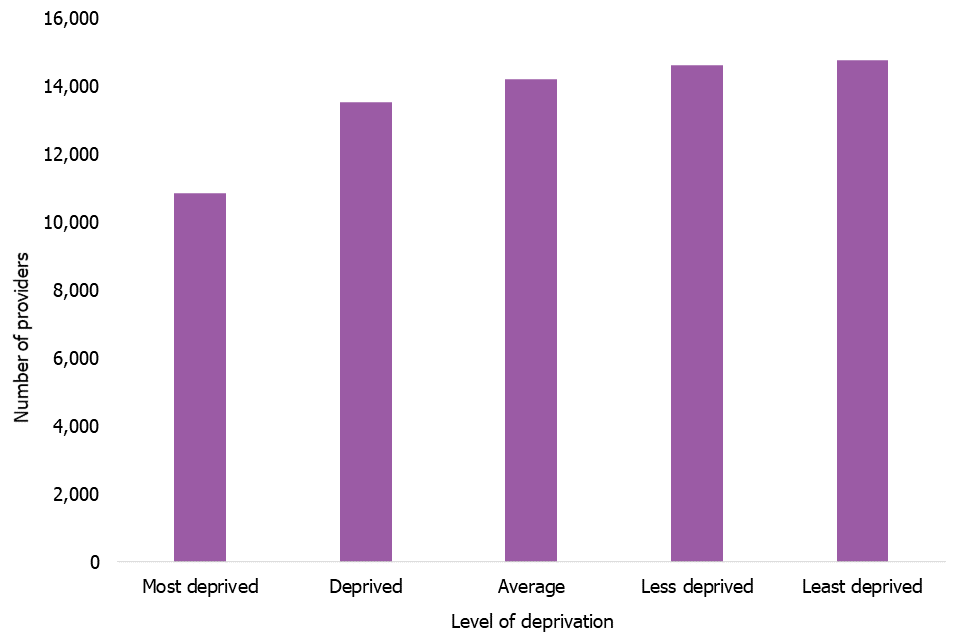
Of the 68,000 childcare providers registered with Ofsted on 31 March 2022, 10,900 (16%) were located in the most deprived areas (see Figure 7.)[footnote 3] This compares with 14,800 (22%) of providers that were in the least deprived areas, indicating that childcare providers were not evenly distributed across areas that have different levels of deprivation.
Figure 7: Childcare providers registered with Ofsted as at 31 March 2022, by level of deprivation
View data in an accessible table format.
Change in the number of providers during 2021–22
Between 1 April 2021 and 31 March 2022, there was a net overall decrease of around 4,000 providers, representing a decrease of 6% in the number registered on 1 April 2021. This was not consistent in all areas of deprivation. Providers in the less deprived areas saw more of a decrease (7%) than those in the most deprived areas (3%).
Joiners and leavers by deprivation
The highest proportion of providers joining the register was seen in providers in the most deprived areas (11%) (see Figure 8), while the lowest was in the less deprived areas (8%). The highest proportion of leavers was observed in the least deprived and less deprived areas (both 15%), while the proportion in the most deprived areas was 13%.
Figure 8: Joiners and leavers in the childcare sector between 1 April 2021 and 31 March 2022, by level of deprivation
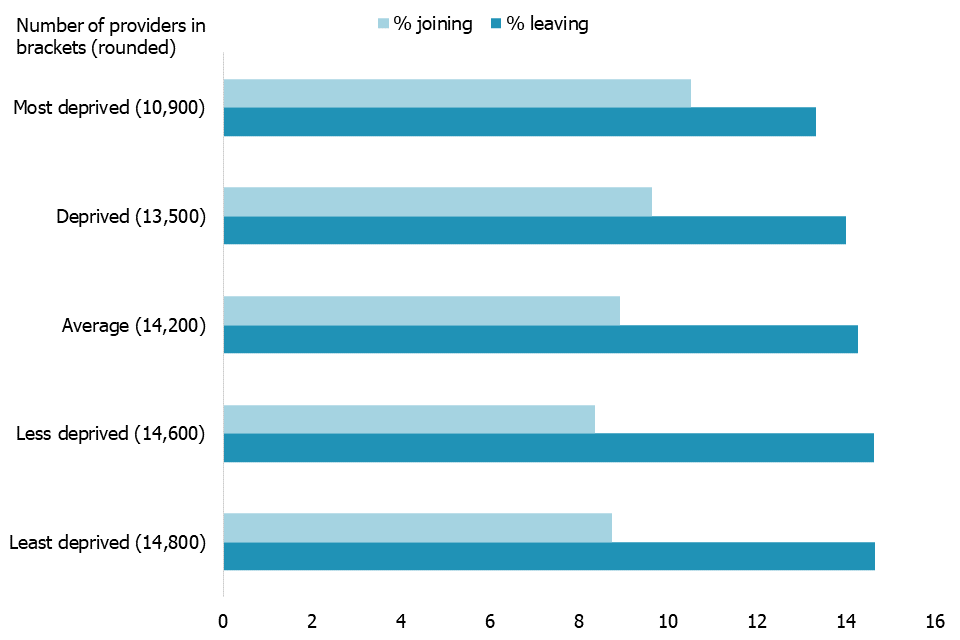
Percentage joining is calculated as the proportion of providers that were not registered as of 31 March 2021, but were registered as of 31 March 2022.
Percentage leaving is calculated as the proportion of providers that were not registered as of 31 March 2022, but were registered as of 31 March 2021.
View data in an accessible table format.
Inspections and regulatory activity
Most recent inspections of providers on the EYR
On 31 March 2022, 75% (40,000) of eligible providers on the EYR had received a full inspection.[footnote 4] At their most recent inspection, 96% of all childcare providers on the EYR were judged either good or outstanding, down by 1 percentage point since 31 August 2021. This represents a substantial increase from 31 August 2015, when the proportion of childcare providers on the EYR judged as either good or outstanding was 85% (see Figure 9).
Since August 2021, the proportion of outstanding providers has dropped by 1 percentage point to 16%, while the proportion of good providers has increased by the same amount to 81%.
Figure 9: Overall effectiveness of active early years registered providers at their most recent inspection over time
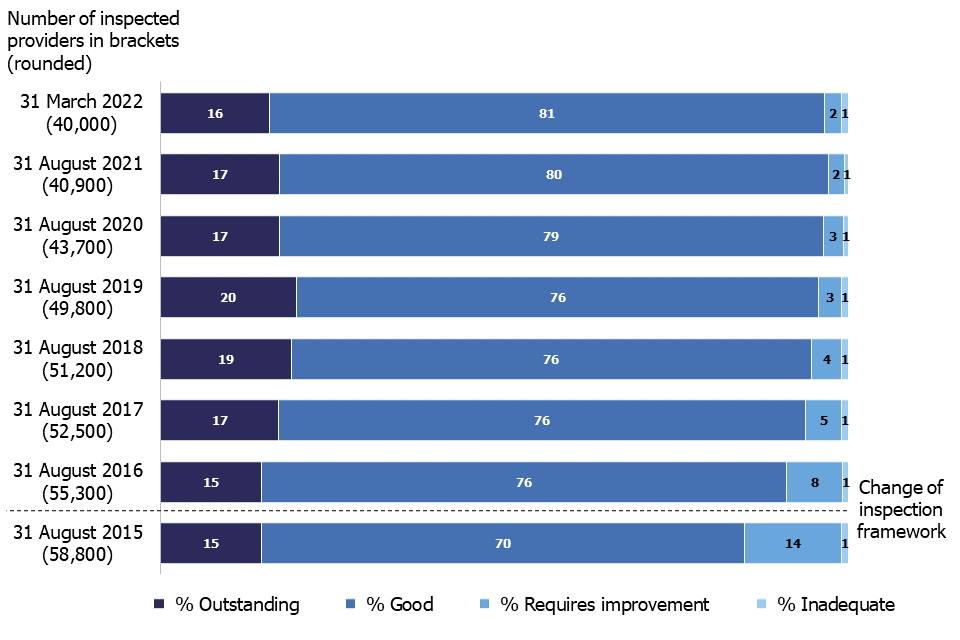
Note: numbers are rounded to the nearest 100.
View data in an accessible table format.
The quality of those leaving the sector may have contributed to the rise in the proportion of providers judged good or outstanding. Providers leaving the sector were more likely to have been judged requires improvement or inadequate at their most recent inspection than those that remained in the sector.
Of the 4,200 providers that left the EYR after August 2021, 2,600 had received a full inspection. Of these, 7% had received a judgement of requires improvement or inadequate at their most recent inspection, compared with only 3% of active providers.
Childcare on non-domestic premises
At their most recent inspection, 96% of childcare providers on non-domestic premises were judged good or outstanding, down by 2 percentage points since 31 August 2021. This was made up of 20% of providers judged outstanding and 77% of providers judged good.[footnote 5]
The proportion of childcare providers on non-domestic premises that were judged outstanding varied by deprivation area. This ranged from 16% in providers in the most deprived areas to 23% in the least deprived areas (see Figure 10).
Childminders
The proportion of childminders who were judged good or outstanding at their most recent inspection was 97%, up by 1 percentage point since August 2021. This was made up of 13% judged outstanding and 83% judged good.
The proportion of childminders varied according to each area’s level of deprivation with the lowest proportion in the least deprived areas (8%) and the highest in the most deprived areas (17%).
Figure 10: Percentage of childminders and non-domestic providers judged outstanding as at 31 March 2022, by level of deprivation
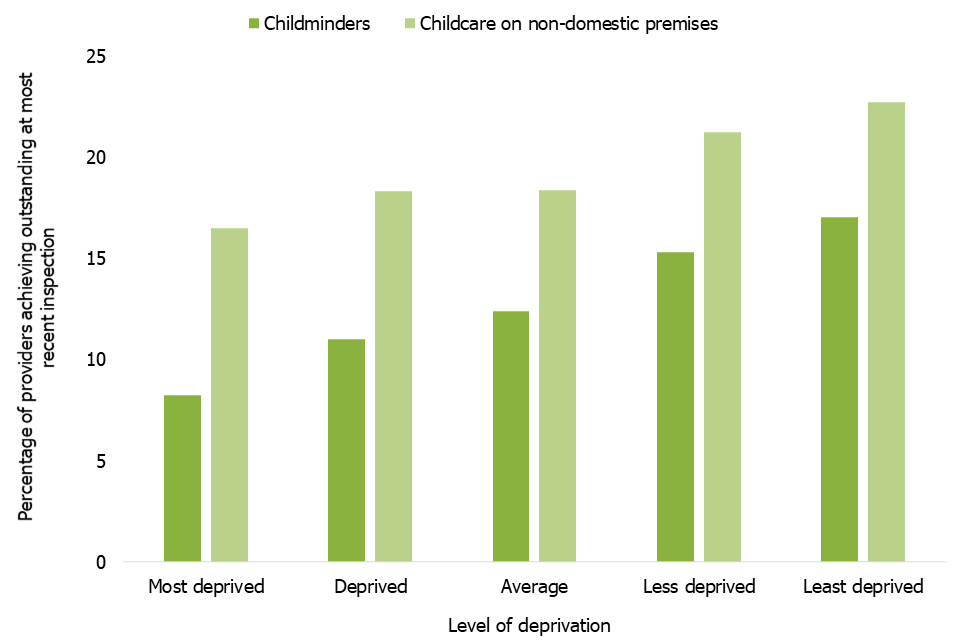
View data in an accessible table format.
Across all areas of deprivation, a higher proportion of childcare on non-domestic premises was judged outstanding compared with childminders. The differences in the proportions judged outstanding ranged from 8 percentage points in the most deprived areas where 16% of childcare on non-domestic premises are judged outstanding. Likewise, there was a 6 percentage point difference in the least deprived areas where 23% of childcare on non-domestic premises were judged outstanding.
Inspections and regulatory activity between 1 September 2021 and 31 March 2022
EYR inspections
Between 1 September 2021 and 31 March 2022, we carried out around 5,200 inspections of providers registered on the EYR. Of these, 4,300 providers had a full inspection.
Of the full inspections, 1,700 were of providers that had not yet had a first full inspection. Of these, 84% were judged good or outstanding.
The remaining 2,600 providers had previously had a full inspection. Of these, 2,100 providers received a good or outstanding grade at their previous inspection, while 500 providers were reinspected following a requires improvement or inadequate judgement. Of the providers that received a requires improvement or inadequate judgement at their previous inspection, 72% improved to good or outstanding at reinspection. Only 79% of providers that were good or outstanding at their previous inspection continued to be good or outstanding following reinspection (see Figure 11).
Figure 11: Overall effectiveness of active early years registered providers inspected between 1 September 2021 and 31 March 2022
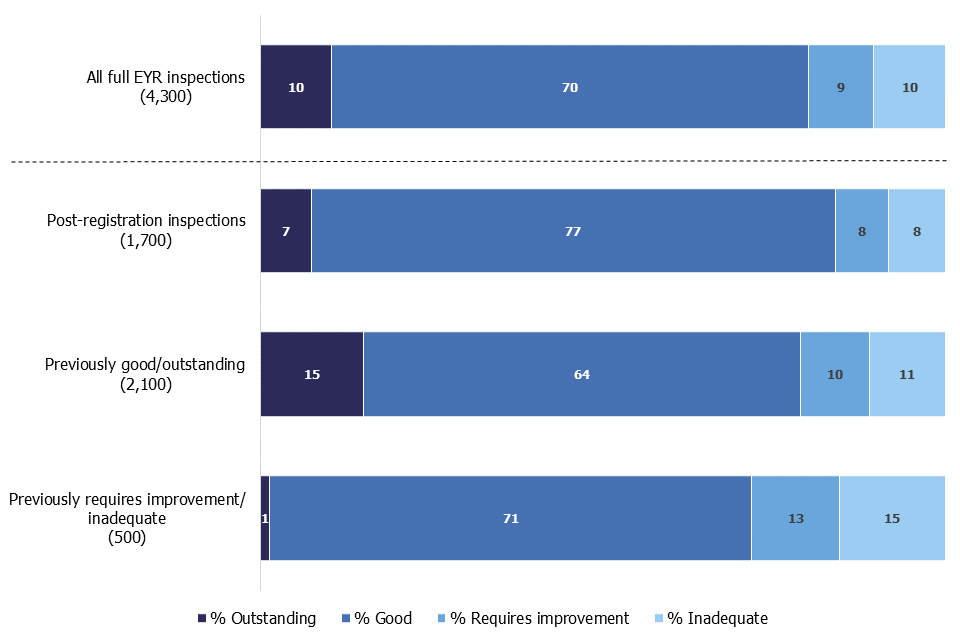
Note: numbers are rounded to the nearest 100.
View data in an accessible table format.
Childcare Register inspections
Between 1 September 2021 and 31 March 2022, we carried out around 300 CR inspections. Of these, we found that 71% met the requirements of registration. These inspections do not result in a quality (graded) judgement, but a judgement as to whether the provider has met or not met the legal requirements for registration.
Registration visits
We carried out around 1,300 registration visits during the reporting period for prospective providers intending to register on the EYR or, where there were concerns about the applicant’s suitability, on the CCR. The majority of visits were to prospective childminders on the EYR.
Regulatory visits
We carried out around 3,300 regulatory visits and telephone calls during the reporting period. Most of these visits were to childminders or childcare on non-domestic premises on the EYR (91%).
Childminder agencies
Childminder agencies were introduced in September 2014, enabling new childminders to choose to register with Ofsted directly or register with an agency. Existing childminders could also choose to deregister with Ofsted and register instead with a childminder agency. Childminder agencies are responsible for carrying out quality assurance visits to the childminders who are registered with them, with Ofsted inspecting the childminder agencies.
Childminder agencies are only eligible for inspection when they have childminders on roll. There are only 2 inspection outcomes: effective and ineffective. On 31 March 2022, 7 childminder agencies were registered with Ofsted. Of these, 5 childminder agencies reported childminders on roll, with a total of 1,100 childminders between them, and were therefore eligible for inspection. Of these 5 childminder agencies, we have inspected 3 to date and all have been judged effective.
Data for childminder agencies is available in the provider-level data file accompanying this release.
Early years provision in the schools sector
Early years provision is also provided in the schools sector and is offered in state-funded and independent schools. If nurseries within schools are only looking after children aged 2 and over, they are exempt from registration on the EYR. Nurseries looking after children aged younger than 2 are still required to register on the EYR and are therefore covered in the previous sections.
In state-funded schools, other than nursery schools, early years provision is given its own judgement as part of the overall inspection of the school. On 31 March 2022, there were around 10,800 state-funded schools with an early years judgement at their most recent school inspection. Of these, 83% were judged good or outstanding for overall effectiveness and 89% were judged to be good or outstanding for early years provision.
On 31 March 2022, there were 385 state-funded nursery schools in England. We have inspected all of these and 99% were judged to be good or outstanding at their most recent inspection. This was made up of a very large proportion (64%) of nursery schools that were judged outstanding, and 35% that were judged good.
For more information on school inspections and outcomes, refer to our statistics collection on state-funded schools inspections and outcomes.
Many independent schools also provide nursery provision. On 31 March 2022, there were 218 non-association independent schools with an early years judgement at their most recent standard inspection. Of these, 78% were judged good or outstanding for their early years provision. For more information on non-association independent schools inspections and outcomes, see our statistics on non-association independent schools.
Ofsted only inspects non-association independent schools. The Independent Schools Inspectorate inspects association independent schools.
Notes
There is an explanation about the main uses of this data, further contextual information and the arrangements for quality assurance in the methodology and quality report accompanying this release.
The methodology and quality report also provides information on the strengths and limitations of the statistics.
Revisions to previous release
The provisional data in the previous release relates to inspections that took place between 31 March 2021 and 31 August 2021 with reports published by 30 September 2021. A revised list of inspections in this period is provided in Tables 14 to 19 of the ‘Childcare providers and inspections charts and tables’ document for this release. This revised data includes 57 additional inspections that were published by 30 April 2022 (but had not been published by 30 September 2021).
We publish revisions to data in this publication in line with our revisions policy for official statistics.
Education inspection framework (EIF)
On 1 September 2019, we began inspecting under the EIF. The EIF helps to support consistency across inspections of early years and childcare providers, maintained schools, academies, non-association independent schools, and further education and skills providers in England. We evaluate the overall quality and standards of the early years provision in line with the principles and requirements of the early years foundation stage statutory framework. Inspectors judge the overall effectiveness of the early years provision, taking into account 4 judgements:
- quality of education
- behaviour and attitudes
- personal development
- effectiveness of leadership and management
We were required to inspect all providers that were on the EYR on 1 August 2016 at least once by 31 July 2020. We will normally inspect providers that have registered after this date within 30 months of registration. However, due to the impact of COVID-19, we paused our routine inspections in mid-March 2020. We started these again in May 2021 and prioritised providers:
- that had been judged less than good at their last inspection
- that had registered recently and that had not been previously inspected
- whose first inspection was overdue
- that had not inspected in the last inspection cycle due to the pause in routine inspection
Common inspection framework
Between 1 September 2015 and 31 August 2019, we carried out inspections under the common inspection framework. Inspectors judged the overall effectiveness of the early years provision, taking into account the following judgements:
- quality of teaching, learning and assessment
- personal development, behaviour and welfare
- effectiveness of leadership and management
- outcomes for children
Glossary
Definitions of terms are in our statistical glossary.
Further information
We publish the following information on the inspection of early years providers:
- early years and childcare statistics
- EIF
- framework for the regulation of provision on the childcare register
Contact for comments or feedback
If you have any comments or feedback on this publication, you should contact Anita Patel on 03000 130 914 or Anita.Patel@ofsted.gov.uk.
Acknowledgements
Thanks to the following for their contributions to this statistical release: Richard Smith, Giada Maugeri, Chris Dinham, Helen Woodley, Elisabeth Yarwood, Rebecca Wattiau, Mundeep Gill and Austen Norris.
Annex: data tables for figures
This section contains the underlying data in an accessible table format for all figures.
Data for figure 1: Change in the number of Ofsted registered providers between 31 March 2021 and 31 March 2022 in the most and least deprived areas in 2021–22
| Deprivation level | Number of providers as at 31 March 2021 | Number of providers as at 31 March 2022 | Percentage joining | Percentage leaving |
|---|---|---|---|---|
| Most deprived | 11,300 | 10,900 | 11 | 13 |
| Least deprived | 15,700 | 14,800 | 9 | 15 |
See Figure 1.
Data for figure 2: Childcare providers registered with Ofsted as at 31 March 2022, by provider type
| Provider type | Number of providers as at 31 March 2022 |
|---|---|
| Childminders | 31,400 |
| Childminder agencies | 7 (with 1,100 childminders on roll) |
| Childcare on non-domestic premises | 27,300 |
| Home childcarers | 9,100 |
| Childcare on domestic premises | 200 |
See Figure 2.
Data for figure 3: Joiners and leavers in the childcare sector, by financial year
| Academic year | Joiners | Leavers |
|---|---|---|
| 2015–16 | 10,398 | 14,545 |
| 2016–17 | 9,825 | 13,399 |
| 2017–18 | 9,707 | 11,382 |
| 2018–19 | 7,449 | 10,567 |
| 2019–20 | 9,254 | 10,788 |
| 2020–21 | 6,636 | 9,660 |
| 2021–22 | 6,237 | 10,256 |
See Figure 3.
Data for figure 4: Venn diagram of Ofsted-registered providers, by the different registers for childcare
| Register combination | Number of childcare providers by register combination |
|---|---|
| EYR, CCR and VCR | 41,200 |
| EYR and CCR | 5,300 |
| EYR and VCR | 60 |
| EYR only | 6,700 |
| CCR and VCR | 2,800 |
| CCR only | 200 |
| VCR only | 11,900 |
| All on EYR | 53,200 |
| All on CCR | 49,300 |
| All on VCR | 55,900 |
See Figure 4.
Data for figure 5: Number of childcare places offered by providers on the EYR as at 31 March 2022, by provider type
| Provider type | Places offered by providers on the EYR as at 31 March 2022 | % of all places on the EYR |
|---|---|---|
| Childcare on non-domestic premises | 1.1 million | 85 |
| Childminders | 191,800 | 15 |
| Childcare on domestic premises | 5,400 | <1 |
See Figure 5.
Data for figure 6: Childcare providers and places on the EYR over time, by provider type
| Date | Childminders on the EYR | Childcare on non-domestic premises on the EYR | Total number of childcare places offered |
|---|---|---|---|
| 31 August 2015 | 46,044 | 25,065 | 1,288,184 |
| 31 August 2016 | 42,563 | 24,483 | 1,281,604 |
| 31 August 2017 | 40,827 | 24,382 | 1,290,556 |
| 31 August 2018 | 39,013 | 24,224 | 1,304,902 |
| 31 August 2019 | 36,831 | 24,101 | 1,319,465 |
| 31 August 2020 | 34,535 | 23,801 | 1,312,215 |
| 31 August 2021 | 31,957 | 23,538 | 1,302,300 |
| 31 March 2022 | 29,619 | 23,342 | 1,291,262 |
See Figure 6.
Data for figure 7: Childcare providers registered with Ofsted as at 31 March 2022, by level of deprivation
| Level of deprivation | Number of providers |
|---|---|
| Most deprived | 10,857 |
| Deprived | 13,540 |
| Average | 14,201 |
| Less deprived | 14,619 |
| Least deprived | 14,772 |
See Figure 7.
Data for figure 8: Joiners and leavers in the childcare sector between 1 April 2021 and 31 March 2022, by level of deprivation
| Level of deprivation (number of providers in brackets) | Percentage joining | Percentage leaving |
|---|---|---|
| Most deprived (10,900) | 10.5 | 13.3 |
| Deprived (13,500) | 9.6 | 14.0 |
| Average (14,200) | 8.9 | 14.3 |
| Less deprived (14,600) | 8.4 | 14.6 |
| Least deprived (14,800) | 8.7 | 14.7 |
See Figure 8.
Data for figure 9: Overall effectiveness of active early years registered providers at their most recent inspection over time
| Date (number of providers in brackets) | % providers judged outstanding | % providers judged good | % providers judged requires improvement | % providers judged inadequate |
|---|---|---|---|---|
| 31 March 2022 (40,000) | 16 | 81 | 2 | 1 |
| 31 August 2021 (40,900) | 17 | 80 | 2 | 1 |
| 31 August 2020 (43,700) | 17 | 79 | 3 | 1 |
| 31 August 2019 (49,800) | 20 | 76 | 3 | 1 |
| 31 August 2018 (51,200) | 19 | 76 | 4 | 1 |
| 31 August 2017 (52,500) | 17 | 76 | 5 | 1 |
| 31 August 2016 (55,300) | 15 | 76 | 8 | 1 |
| 31 August 2015 (58,800) | 15 | 70 | 14 | 1 |
See Figure 9.
Data for figure 10: Percentage of childminders and non-domestic providers judged outstanding as at 31 March 2022, by level of deprivation
| Level of deprivation | % of childminders | % of childcare on non-domestic premises |
|---|---|---|
| Most deprived | 8 | 16 |
| Deprived | 11 | 18 |
| Average | 12 | 18 |
| Less deprived | 15 | 21 |
| Least deprived | 17 | 23 |
See Figure 10.
Data for figure 11: Overall effectiveness of active early years registered providers inspected between 1 September 2021 and 31 March 2022
| Inspection type (number of providers in brackets) | % providers judged outstanding | % providers judged good | % providers judged requires improvement | % providers judged inadequate |
|---|---|---|---|---|
| All full EYR inspections (4,300) | 10 | 70 | 9 | 10 |
| Post-registration inspections (1,700) | 7 | 77 | 8 | 8 |
| Previously good/outstanding (400) | 15 | 64 | 10 | 11 |
| Previously requires improvement/inadequate (500) | 1 | 71 | 13 | 15 |
See Figure 11.
-
Numbers are rounded to the nearest 100. ↩
-
Places numbers of less than 1 million are rounded to the nearest 100. ↩
-
Most deprived and least deprived areas are based on deprivation quintile, calculated from the Income Deprivation Affecting Children Index rank of all lower super output areas. This is based on the provider address, not the area where the children who attend live. ↩
-
A small proportion of providers may have only received a no-children-on-roll inspection. These are excluded from the total number of providers on the EYR that have received an inspection. We have also excluded providers that, under the EIF, are now classed as out-of-school day-care providers, but may have previously had a full EYR inspection. ↩
-
The figures do not add up due to rounding. ↩