Child and Working Tax Credits Statistics: Provisional Awards December 2020 Main Commentary
Published 26 February 2021

© Crown copyright 2021
This publication is licensed under the terms of the Open Government Licence v3.0 except where otherwise stated. To view this licence, visit nationalarchives.gov.uk/doc/open-government-licence/version/3 or write to the Information Policy Team, The National Archives, Kew, London TW9 4DU, or email: psi@nationalarchives.gov.uk.
Where we have identified any third party copyright information you will need to obtain permission from the copyright holders concerned.
This publication is available at https://www.gov.uk/government/statistics/child-and-working-tax-credits-statistics-provisional-awards-december-2020/child-and-working-tax-credits-statistics-provisional-awards-december-2020-main-commentary
Overview
These statistics focus on the number of families benefiting from Child Tax Credit (CTC) and/or Working Tax Credit (WTC) in England, Scotland, Wales and Northern Ireland as at 2nd December 2020. This publication presents a breakdown of families by their profile position, age and gender, type of family and family size as well as the number of children in benefiting families, broken down by age. It also includes statistics on families benefiting from each of the different elements of tax credits and provides information on the income used in calculating awards and the frequency of payments.
Contact details
For queries or feedback on this publication, please contact:
For press queries, please contact:
- HMRC Press Office, tel: 03000 585018
Main Headlines
As at 2nd December 2020, there were approximately:
-
1.99m families claiming Child Tax Credit (CTC) and/or Working Tax Credit (WTC). This is a fall of approximately 492,000 when compared to a year earlier.
-
3.6m children in tax credit claiming families. This is a fall of approximately 1.02m when compared to a year earlier.
Number of Families Claiming Tax Credits Since December 2009

Breakdown of Tax Credits Population

Families and Children in Each Country and English Region
Changes Since Previous Publication
Impacts of the Covid-19 Pandemic
During 2020, the Covid-19 pandemic has led to some changes in the tax credit system which may have had an impact on these statistics. As part of a number of measures to support the country, the basic element of Working Tax Credit was increased by £1,045 to £3,040 from 6 April 2020 until 5 April 2021. The amount a claimant or household has benefited depends on their circumstances, including their level of household income, how many children they are responsible for or if they are disabled. However claimants will have received an increase of up to £20 each week.
The temporary increase moved many claimants from nil to positive awards at the start of April. At the start of the pandemic, there was also a higher than usual move to Universal Credit (UC) due to unemployment impacts and a reduction in working hours. These impacts have largely offset one another. Policies were also introduced relaxing rules on WTC hours and HMRC automatically renewed tax credit claims for 2019/20 apart from those identified as very high risk. This is likely to have resulted in fewer tax credits terminations than there would have been otherwise.
HMRC Consultation on Official Statistics
HMRC launched a wide-ranging consultation on a range of statistics on 8th February 2021. This can be found here. This includes changes to a number of tax credits statistics releases including a proposal to reduce the provisional award statistics from twice yearly to annually. An annual publication would be published each summer alongside or as one publication with the Child and Working Tax Credits Finalised Award statistics. Any changes to the tax credit releases will take into account user feedback which we will respond to after the consultation.
Commentary
Section 1: Time Series
Section 1 provides statistics on the history of the tax credits system, between December 2009 and December 2020. This enables comparisons across different tax credits populations and describes how various parts of the system have changed over time.
Figure 1.1: Total Number of Families Receiving Child Tax Credit and Working Tax Credit, December 2009 to December 2020
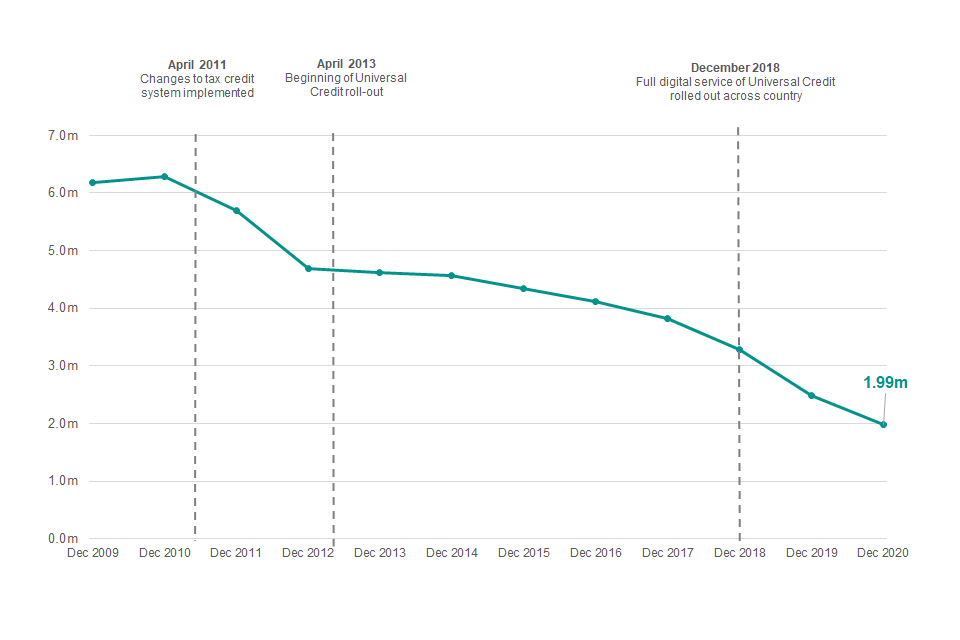
Figure 1.1 shows the total number of families claiming tax credits had remained at around 6 million until 2011. The total number of tax credit recipient families subsequently decreased as a result of policy changes announced in the June 2010 budget, the October 2010 spending review and the introduction of Universal Credit in 2013. The roll-out of Universal Credit to all areas of the country was completed on 12th December 2018, which means that from this date there were no new claims for tax credits except in a small number of circumstances. As at December 2020, the total number of families claiming tax credits was 1.99 million.
Figure 1.2: Breakdown of the Recipient Families by Type of Credits Received
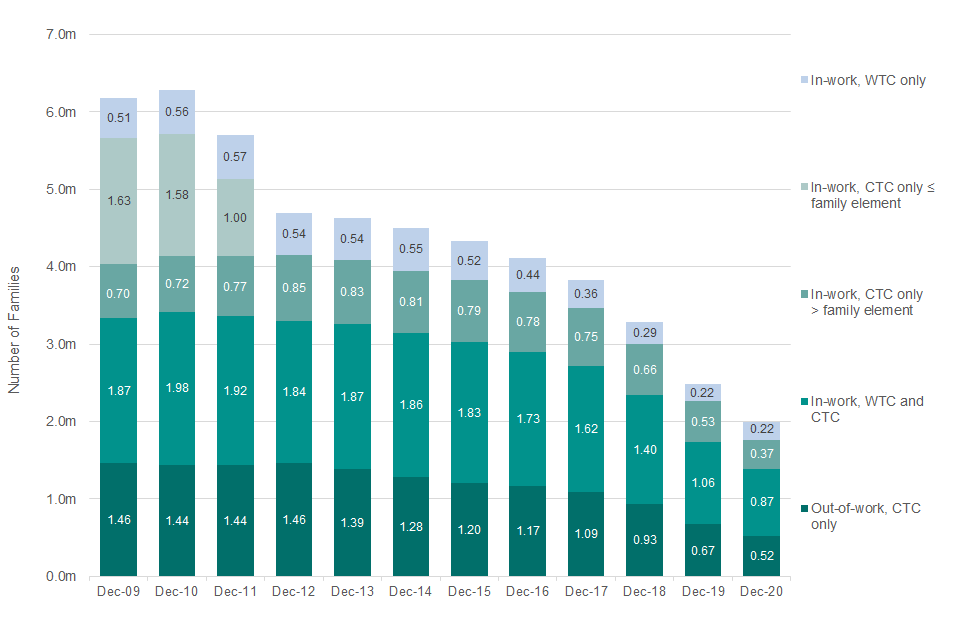
At the time of the snapshot, new claims for tax credits could only be made if claimants are in receipt of the severe disability premium or if they have received tax credits in the last month and are still eligible for them. Subsequently, all new claims for tax credits are to be stopped in February 2021 and this will be reflected in the next Provisional Awards Statistics release in Summer 2021.
Figure 1.2 breaks down the tax credits population by the credits they receive. Since April 2012, when the second income threshold was removed, there are no longer any families receiving only the Family Element, and therefore this category has been discontinued in Figure 1.2. As shown above, the largest recipient category is ‘In-work, WTC and CTC’, followed by ‘Out-of-work, receiving CTC only’.
Figure 1.3: Number of Families Claiming Working Tax Credit Only (In-Work Families With No Children) and Families Claiming the Childcare Element
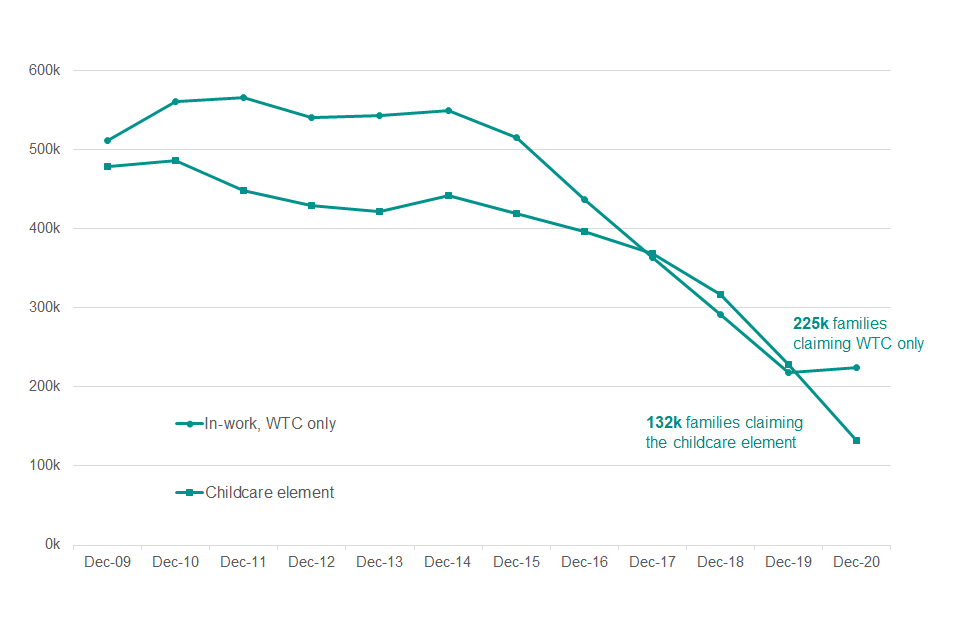
Figure 1.3 shows a small increase in the number of families claiming WTC only from December 2009, where it reached 566,000 in December 2011. It remained above 500,000 between December 2009 and December 2015, but has since decreased to 225,000 in December 2020.
Figure 1.3 also shows that the number of families benefiting from the childcare element rose to around 486,000 in December 2010. However, after this date, the number of families benefiting from the childcare element fell. The number of families benefiting began steadily decreasing from December 2014 and by December 2020, 132,000 families were benefiting from the childcare element.
The small increase in the WTC only claimants is due to the measures put in place during the Covid-19 pandemic. As part of a number of measures to support the country, the basic element of Working Tax Credit was increased by £1,045 to £3,040 from 6 April 2020 until 5 April 2021. The amount a claimant or household will benefit depends on their circumstances, including their level of household income, however a claimant will see an increase of up to £20 each week. The temporary increase in working tax credits (WTC) basic element by £20 per week moved many claimants from nil to positive awards at the start of April. More details of these measures are detailed above.
Section 2: Summary
Section 2 provides a summary on the tax credits population as at December 2020. More detailed breakdowns can be found in Sections 3 to 8.
Figure 2.1: Composition of Families Receiving Different Types of Tax Credits
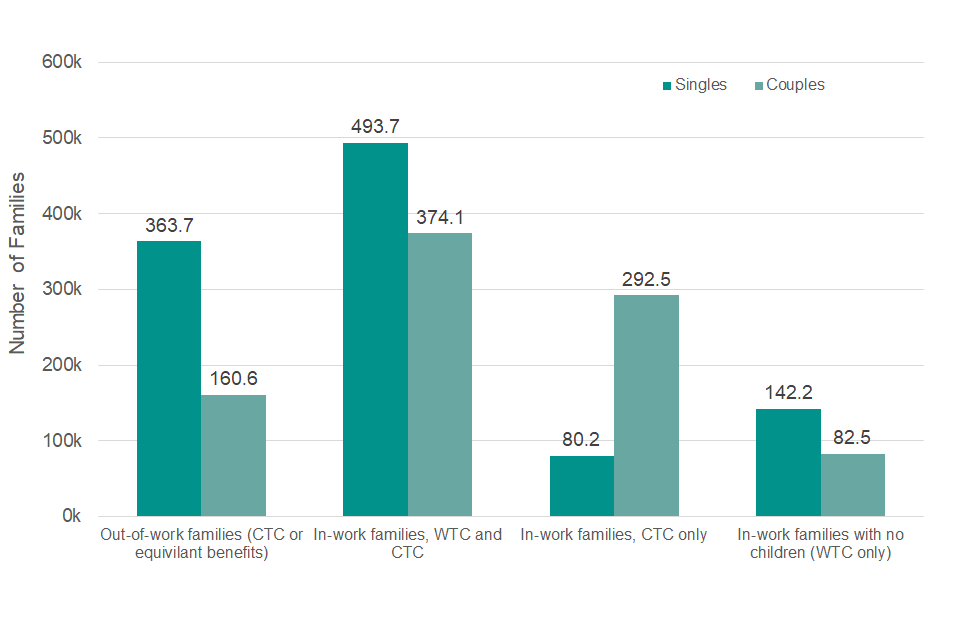
Figure 2.1 shows the majority of lone parent families with children receive either the full award of CTC (when out-of-work), or WTC and CTC (when in-work). Just under three quarters of out-of-work families receiving CTC only are lone parents. The majority of families with no children (receiving WTC only) are single recipients.
Figure 2.2: Recipient Families: Proportion of Families Receiving Each Type of Award
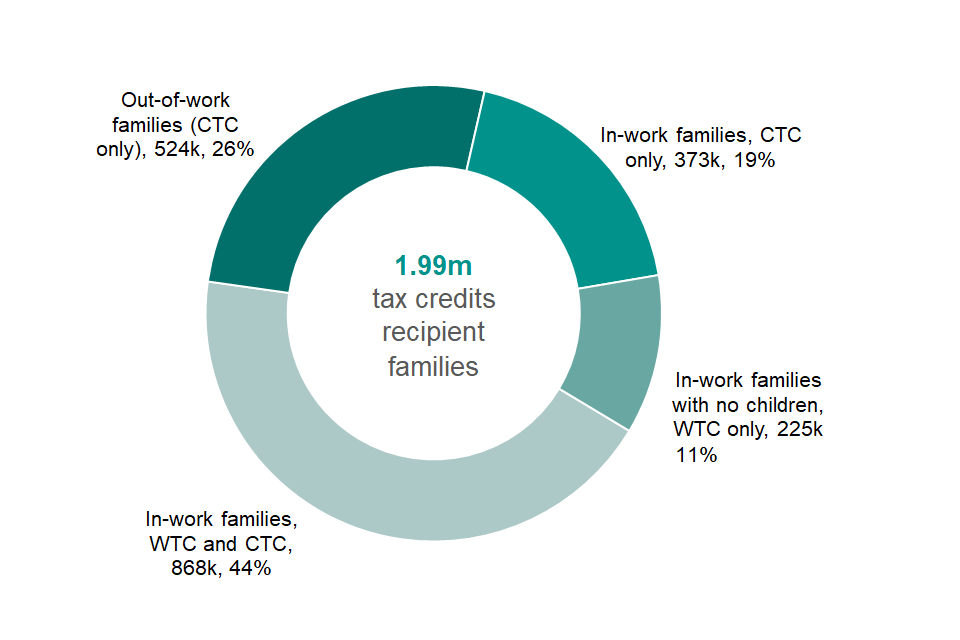
Figure 2.2 shows that 26% of families claiming tax credits are out-of-work families (less than 1% receive the family premium through DWP benefits) and in-work families make up the remaining 74%. Within this, 44% of families are claiming relatively higher value awards (WTC and CTC), 19% are claiming CTC only and the remaining 11% are in-work families with no children claiming WTC only.
Table 2.1: Recipient Families, Couples and Single Adults and Their Children (Thousands)
| Families-Singles | Families-Couples | Total Families | Number of Children in Recipient Families | |
|---|---|---|---|---|
| Out of Work Families with Children | 363.7 | 160.6 | 524.3 | 1,085.5 |
| Receiving CTC | 358.5 | 158.1 | 516.6 | 1,071.7 |
| of which maximum award [footnote 1] | 353.7 | 140.6 | 494.3 | 1,024.6 |
| of which tapered | 4.9 | 17.5 | 22.4 | 47.0 |
| Receiving equivalent in DWP benefits [footnote 2] | 5.1 | 2.6 | 7.7 | 13.8 |
| In-Work Families with Children | 573.8 | 666.6 | 1,240.4 | 2,547.5 |
| of which receiving WTC and CTC [footnote 3] | 493.7 | 374.1 | 867.8 | 1,730.4 |
| and maximum award [footnote 1] | 74.0 | 35.6 | 109.6 | 230.2 |
| and tapered | 419.7 | 338.5 | 758.2 | 1,500.3 |
| Total Receiving CTC only | 80.2 | 292.5 | 372.7 | 817.1 |
| In-Work Families with No Children(WTC only) | 142.2 | 82.5 | 224.7 | - |
| of which maximum award [footnote 1] | 31.5 | 10.2 | 41.7 | - |
| of which tapered | 110.7 | 72.3 | 183.0 | - |
| Total In-Work Families | 716.1 | 749.1 | 1,465.1 | 2,547.5 |
| All Families | 1,079.7 | 909.7 | 1,989.4 | 3,633.0 |
| With children | 937.5 | 827.2 | 1,764.7 | 3,633.0 |
| Other | 142.2 | 82.5 | 224.7 | - |
The number of children in recipient families includes all children or qualifying young people in families receiving tax credits. This may not be equal to the number of children for whom the family is receiving the child element of CTC due to the policy to provide support for a maximum of two children, affecting children born after 6 April 2017 unless they are covered by an exception.
Section 3: Age, Gender and Children in Recipient Families
Section 3 focuses on the demographic breakdown of the tax credits population, including the age and gender of adults in recipient families as well as the number and age of children in each family.
Figure 3.1: Age Breakdown of Adults Receiving Tax Credits
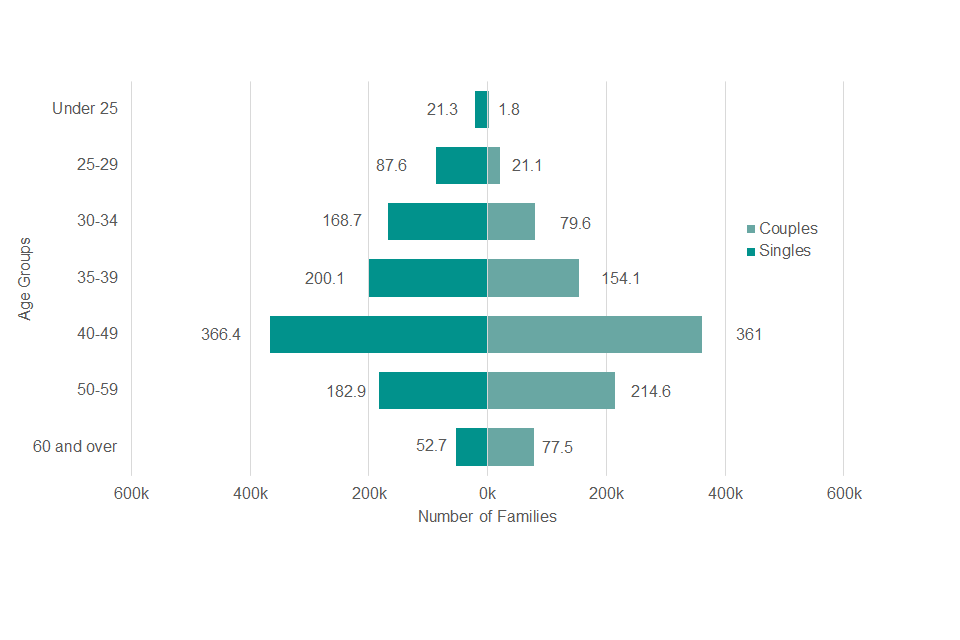
Figure 3.1 show that single parents and couples most commonly fall within the 40-49 age range. Overall, the age distribution for couples is younger than single parent families.
Figure 3.2: Number of Children in Families Receiving Child Tax Credit
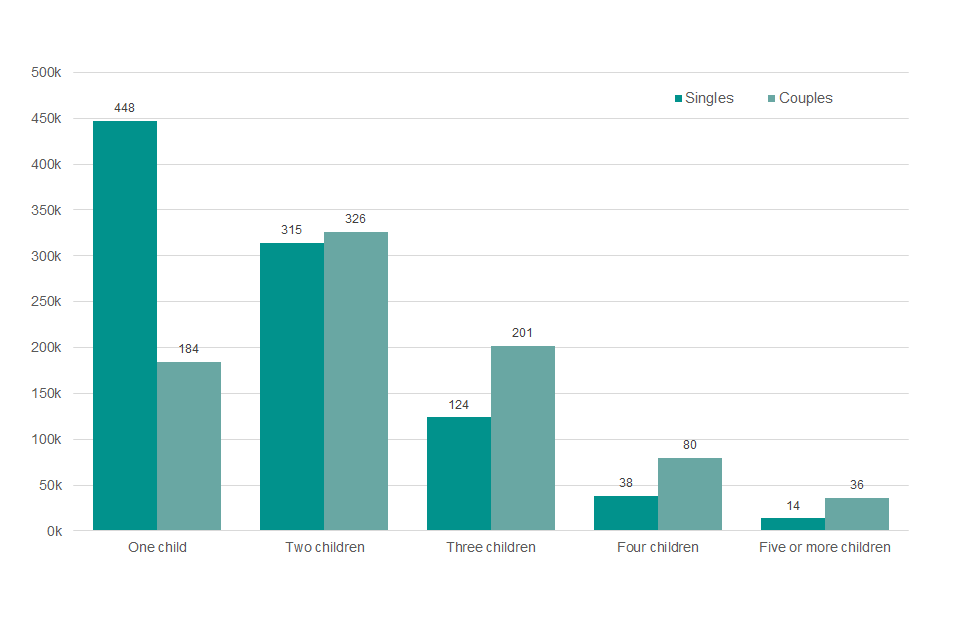
Figure 3.2 shows a majority of families receiving child tax credit had either one or two children. Couples are more likely than single adults to have larger family sizes; around 71% of one-child families have a single adult claimant whereas 64% of claims with three or more children are from couple families.
Figure 3.3: Distribution of Children by Age in Tax Credit Families
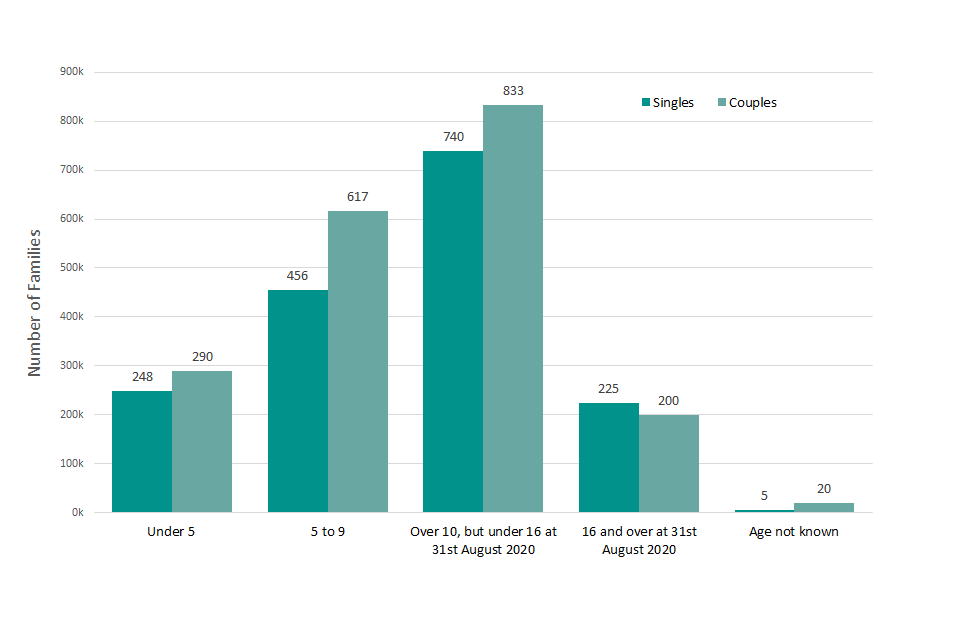
Figure 3.3 shows that single adult families have more qualifying young people aged 16 and over despite the fact that in total there are more children in families with two adults. There were 225,000 children aged 16 and over in single adult families compared to 200,000 children in couple households. Therefore in general, single parents are more likely to be claiming tax credits for older children or qualifying young people than their couple counterparts.
Figure 3.4: Gender of Tax Credits Single Families in Out-of-Work and In-Work Families
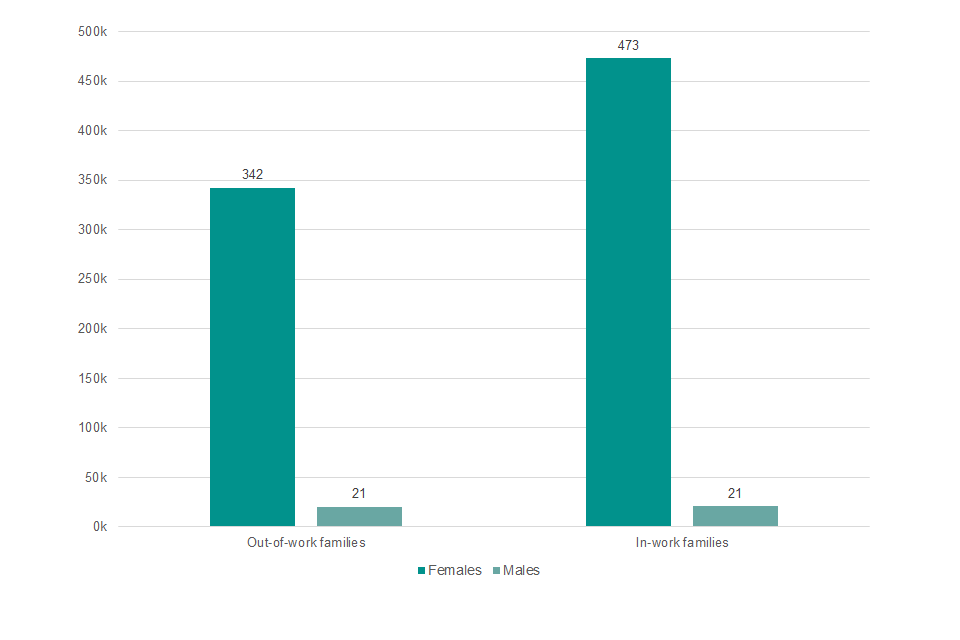
Figure 3.4 shows that females make up the majority of out-of-work (94%) and in-work (96%) single families.
Figure 3.5: Gender of Working Adult(s) in Couple Families
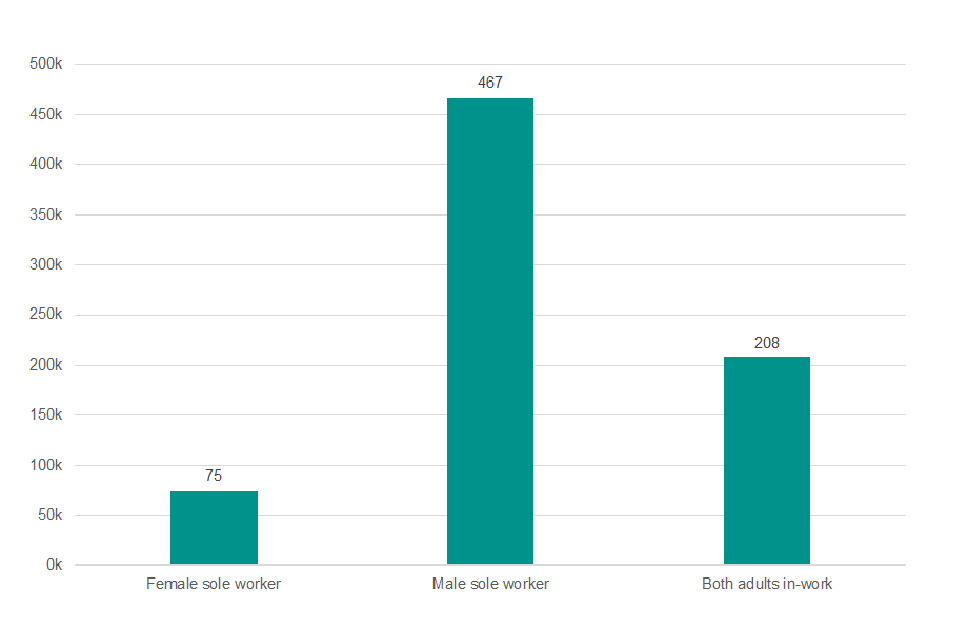
Figure 3.5 shows that in families with one sole worker, males make up the majority (86%).
Section 4: Hours Worked and Childcare of In-Work Recipient Families
Section 4 focuses on the in-work recipient families, with breakdowns of the numbers of hours worked per week and the number of families benefiting from the 30-hour element. It also covers childcare-related breakdowns such as the numbers of families benefiting from the childcare element, the hours worked per week, the age distribution of the children, and detailed breakdowns of the costs.
Figure 4.1: Weekly Hours Worked by Main Worker For In-Work Families In Receipt Of Tax Credits
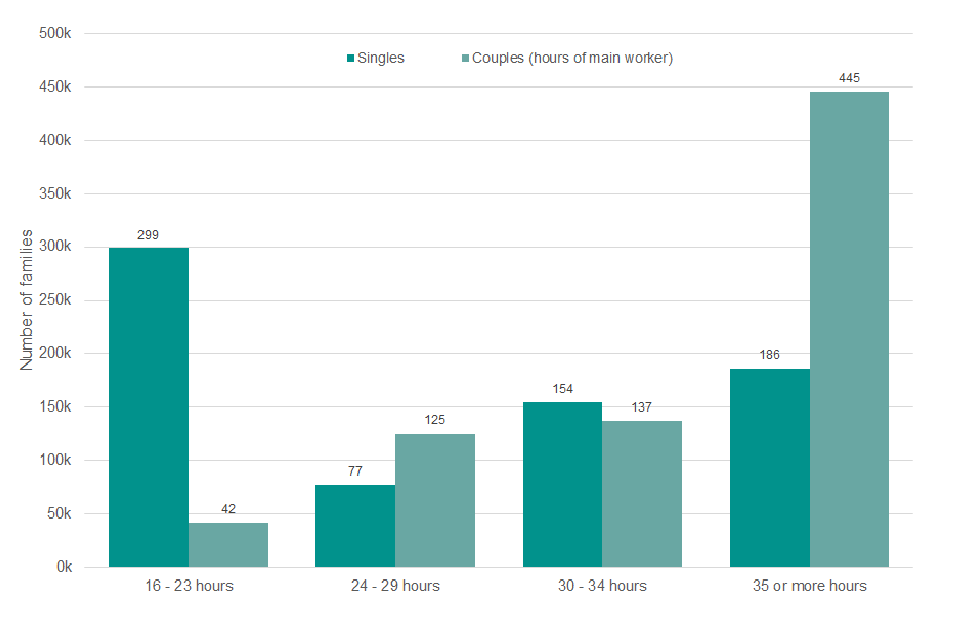
Figure 4.1 shows the number of weekly hours worked by the main worker for in-work families receiving tax credits. The majority of main workers in couples work full-time (or the equivalent of 35 hours or more per week). The majority of single parents work part-time, but there is a more even split for them across part-time and full-time work.
In addition to the 922,000 couples where the main or only worker works over 30 hours per week, 41,000 couples, whose combined hours exceed 30 per week, benefit from the 30-hour credit. In total 341,000 single families and 582,000 couples benefit from the 30-hour credit.
Figure 4.2: Eligible Childcare Costs Allowed (Per Week)
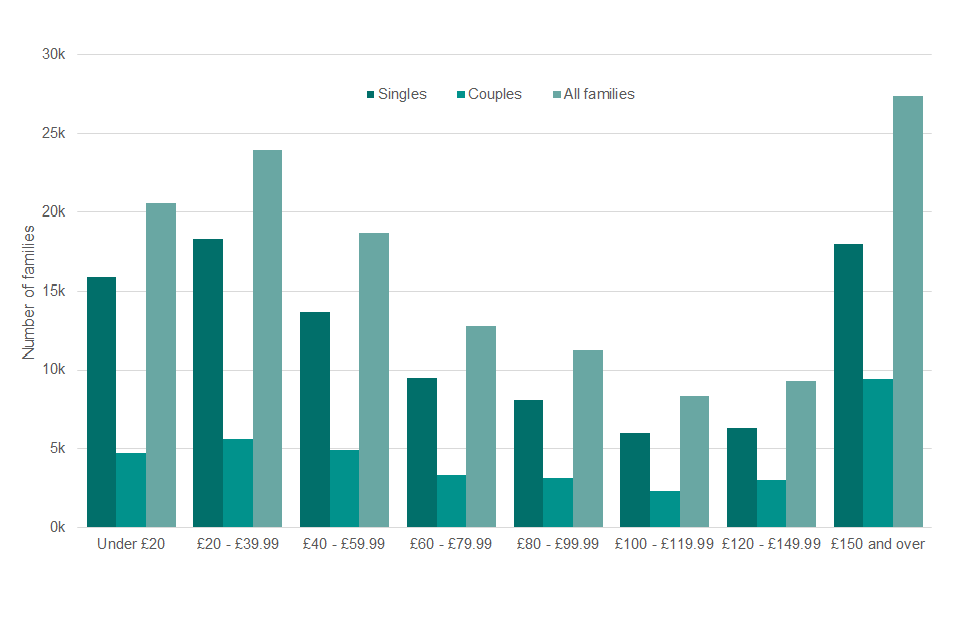
Figure 4.2 shows the average weekly support with childcare costs for single adult families, couples and for all families. The costs claimed for are split broadly across the cost bands with the largest numbers of families claiming between £20 and £39.99 per week or £150 and over per week.
Section 5: In-work Families Benefiting From Disability Elements
Section 5 focuses on families that are benefiting from the disability elements; the disabled worker element, the severely disabled adult element, the disabled child element and the severely disabled child element. There are breakdowns of the family size and the numbers of hours worked by those benefiting as well as breakdowns on overlapping disability/childcare elements.
Figure 5.1: Number of individuals benefiting from the disability elements (Thousands)
| Number of disabled workers in benefiting families | 76.7 |
| of which number of severely disabled adults in benefiting families | 39.8 |
| Number of disabled children in benefiting families | 164.3 |
| of which number of severely disabled children in benefiting families | 56.1 |
Figure 5.1 shows the number of individuals benefiting from the disability elements. Tables 5.1 to 5.4 provide more details on those in-work families benefiting from the four disability elements including the total number of disabled adults or children, the size of the benefiting families and the number of families also benefiting from other elements of tax credits.
Table 5.1: In-Work Families Benefiting From the Disabled Worker Element (Thousands)
| Singles With Children | Singles Without Children | Couples With Children | Couples Without Children | Total | |
|---|---|---|---|---|---|
| Total Families Benefiting | 13.1 | 34.6 | 17.7 | 11.4 | 76.7 |
| Total Disabled Workers | 13.1 | 34.6 | 18.2 | 12.0 | 77.8 |
| Disabled Workers in Benefiting Families | 13.1 | 34.6 | 17.8 | 11.4 | 76.7 |
| Sole worker is disabled [footnote 4] | 13.1 | 34.6 | 9.3 | 7.2 | 64.1 |
| Couples both working-one disabled | - | - | 8.0 | 3.6 | 11.6 |
| Couples both working-both disabled | - | - | 0.5 | 0.6 | 1.0 |
| Gender of Disabled Workers | |||||
| Female | 12.3 | 20.7 | 6.6 | 4.6 | 44.2 |
| Male | 0.8 | 13.8 | 11.6 | 7.3 | 33.6 |
| Ages of Disabled Workers | |||||
| Under 20 | - | - | - | - | - |
| 20-29 | 0.6 | 2.4 | 0.6 | 0.1 | 3.6 |
| 30-39 | 4.1 | 5.5 | 5.3 | 0.3 | 15.3 |
| 40-49 | 5.6 | 7.5 | 7.6 | 1.4 | 22.0 |
| 50-59 | 2.6 | 12.2 | 4.0 | 5.3 | 24.1 |
| 60 or over | 0.2 | 6.9 | 0.7 | 4.9 | 12.6 |
| Hours Worked by Disabled Workers | |||||
| 16-23 | 7.3 | 16.2 | 6.4 | 4.6 | 34.6 |
| 24-29 | 1.2 | 3.5 | 2.2 | 1.2 | 8.1 |
| 30-34 | 2.0 | 6.8 | 2.6 | 2.4 | 13.7 |
| 35-39 | 1.8 | 5.8 | 3.9 | 1.9 | 13.4 |
| 40 or more | 0.7 | 2.3 | 3.1 | 1.9 | 8.0 |
Those claiming the disabled worker element either have children and have a positive award, or have no children and have a positive WTC award. Disabled workers includes those who are severely disabled and who are also included in Table 5.3.
Table 5.2:In-Work Families Benefiting From the Disabled Child Element (Thousands)
| Singles With One Disabled Child | Singles With 2+ Disabled Children | Couples With One Disabled Child | Couples With 2+ Disabled Children | Total | |
|---|---|---|---|---|---|
| Total Families Benefiting [footnote 5] | 39.7 | 2.8 | 87.2 | 14.9 | 144.6 |
| Family Size | |||||
| One Child | 17.0 | - | 16.2 | - | 33.1 |
| Two Children | 14.4 | 1.4 | 34.9 | 5.4 | 56.0 |
| Three Children | 6.1 | 0.9 | 23.0 | 5.3 | 35.3 |
| Four Children | 1.7 | 0.3 | 8.8 | 2.7 | 13.5 |
| Five or More Children | 0.6 | 0.1 | 4.4 | 1.6 | 6.6 |
| Also with the Childcare Element | 7.0 | 0.7 | 4.5 | 0.9 | 13.2 |
| Also with the Disabled Worker Element | 1.9 | 0.2 | 3.0 | 0.7 | 5.8 |
| Number of Disabled Children in Benefiting Families | 39.7 | 5.7 | 87.2 | 31.6 | 164.3 |
Table 5.3: In-Work Families Benefiting From the Severely Disabled Adult Element (Thousands)
| Singles With Children | Singles Without Children | Couples With Children | Couples Without Children | Total With Children | Total Without Children | Total | |
|---|---|---|---|---|---|---|---|
| Total Families Benefiting [footnote 6] | 2.9 | 8.9 | 17.1 | 10.3 | 20.0 | 19.3 | 39.2 |
| Family Size | |||||||
| No Children | - | 8.9 | - | 10.3 | - | 19.3 | 19.3 |
| One Child | 1.7 | - | 6.9 | - | 8.6 | - | 8.6 |
| Two Children | 0.9 | - | 6.4 | - | 7.3 | - | 7.3 |
| Three Children | 0.2 | - | 2.6 | - | 2.8 | - | 2.8 |
| Four Children | 0.1 | - | 0.9 | - | 1.0 | - | 1.0 |
| Five or More Children | - | - | 0.3 | - | 0.3 | - | 0.3 |
| Hours Worked by Solo or Main Worker | |||||||
| 16-23 | 1.6 | 4.4 | 3.3 | 1.4 | 4.8 | 5.8 | 10.7 |
| 24-29 | 0.3 | 0.9 | 2.3 | 0.5 | 2.6 | 1.4 | 4.1 |
| 30-34 | 0.5 | 1.6 | 2.6 | 3.4 | 3.0 | 5.0 | 8.0 |
| 35-39 | 0.4 | 1.4 | 4.7 | 2.5 | 5.1 | 3.9 | 9.0 |
| 40 or more | 0.2 | 0.6 | 4.2 | 2.6 | 4.3 | 3.1 | 7.5 |
| Total Severely Disabled Adults in Benefiting Families | 2.9 | 8.9 | 17.3 | 10.7 | 20.2 | 19.6 | 39.8 |
| Also with Childcare Element | 0.6 | - | 0.9 | - | 1.5 | - | 1.5 |
| Also with Disabled Worker Element | 2.9 | 8.9 | 5.4 | 4.0 | 8.3 | 12.9 | 21.2 |
Table 5.4:In-Work Families Benefiting From the Severely Disabled Child Element (Thousands)
| Singles | Couples | Total | |||||
|---|---|---|---|---|---|---|---|
| Total Families Benefiting [footnote 7] | 13.2 | 38.8 | 52.0 | ||||
| Family Size | |||||||
| One Child | 5.4 | 6.4 | 11.8 | ||||
| Two Children | 4.7 | 15.1 | 19.9 | ||||
| Three Children | 2.3 | 10.7 | 13.0 | ||||
| Four Children | 0.6 | 4.3 | 4.9 | ||||
| Five or More Children | 0.2 | 2.2 | 2.4 | ||||
| Hours Worked by Solo or Main Worker | |||||||
| 16-23 | 7.0 | 2.6 | 9.6 | ||||
| 24-29 | 1.4 | 4.2 | 5.5 | ||||
| 30-34 | 2.3 | 5.1 | 7.4 | ||||
| 35-39 | 1.9 | 12.1 | 14.0 | ||||
| 40 or more | 0.7 | 14.8 | 15.5 | ||||
| Total Severely Disabled Children in Benefiting Families | 13.8 | 42.3 | 56.1 | ||||
| Also with Childcare Element | 2.4 | 2.1 | 4.5 | ||||
| Also with Disabled Worker Element | 0.9 | 1.5 | 2.5 |
Section 6: Annual Incomes of In-Work Recipient Families
Section 6 describes the distribution of incomes used to taper awards for families in receipt. This is also broken down further in the data tables by the type of income reported – that is, whether the award is based on the family’s income from the previous year (‘PY’ income), the family’s current year income (‘CY’ income), or whether income disregards have been applied. Please see the technical note for more details on how entitlement is calculated.
Figure 6.1: Income Used To Taper Awards: In-Work Recipient Families
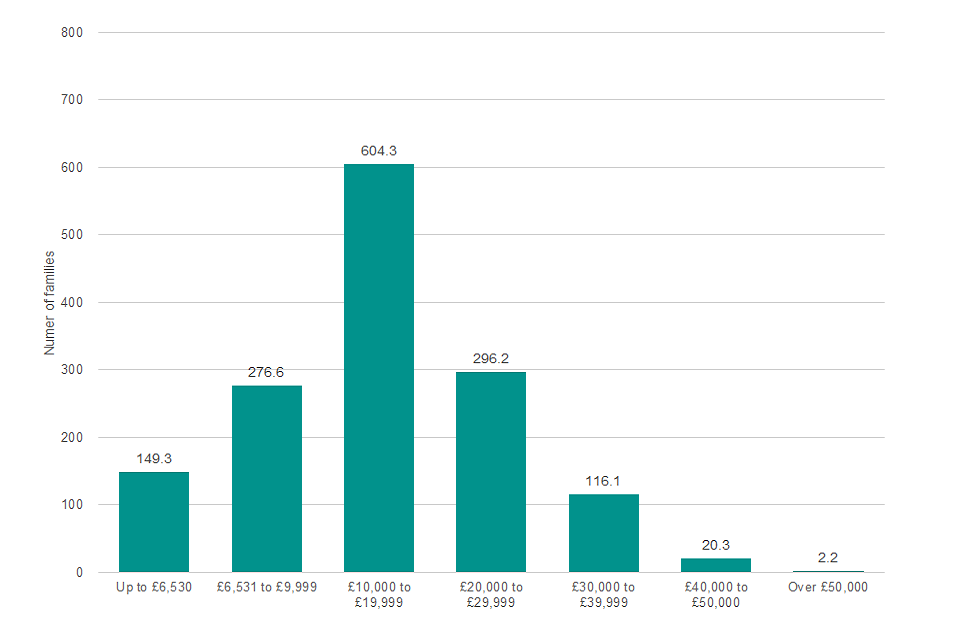
Figure 6.1 shows that the large majority of families receiving tax credits have incomes under £30,000 with the highest proportion falling within the £10,000 to £19,999 range. Awards based on an income up to £6,530 receive their maximum entitlement whereas for incomes above this amount the award is tapered (see the Child and Working Tax Credit Entitlement section for details).
Section 7: Type of Payments to In-Work Families with Children
Section 7 details the chosen payment frequency for families in receipt, broken down by family status and gender of the payee. Tax Credit recipients are able to choose whether they are paid in weekly or four-weekly intervals. Cases where the frequency of payment is unknown are not included in the graph.
Figure 7.1: Chosen Frequency of Payment: In-Work Families With Children
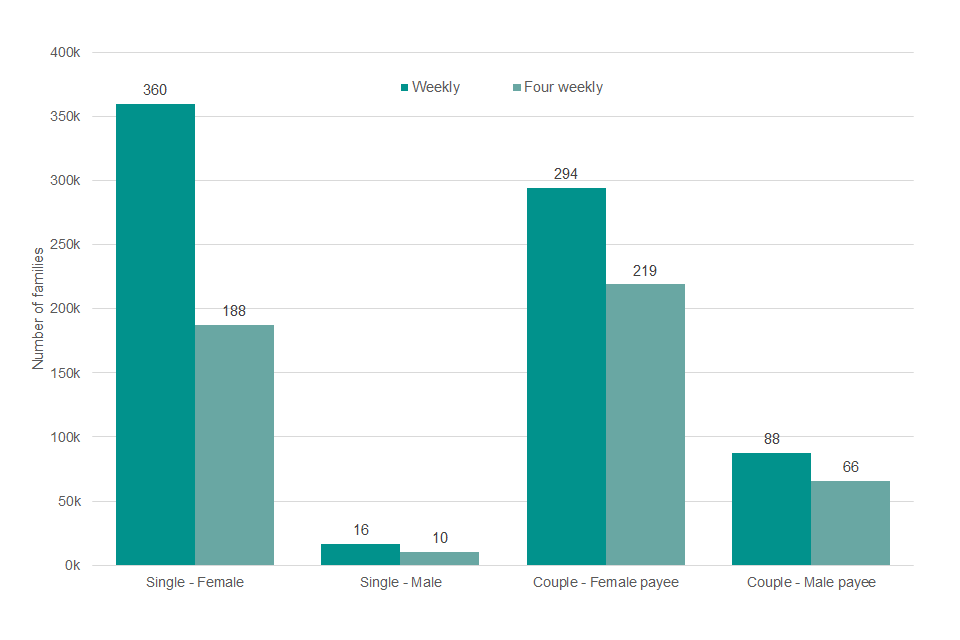
Figure 7.1 shows that families tend to choose weekly CTC payments rather than four-weekly payment cycles. The vast majority of CTC payments are paid to female claimants. Single adult families are around twice more likely to opt for weekly payments than four-weekly payments, while couples mostly opt for weekly payments, though the split is more even.
Section 8: Regional Analysis of Recipient Families
Section 8 details the numbers of families in receipt of tax credits with a regional breakdown. There are detailed breakdowns of the level of support provided in each region, the numbers of families benefiting from the childcare element as well as the disabled worker element and disabled child element.
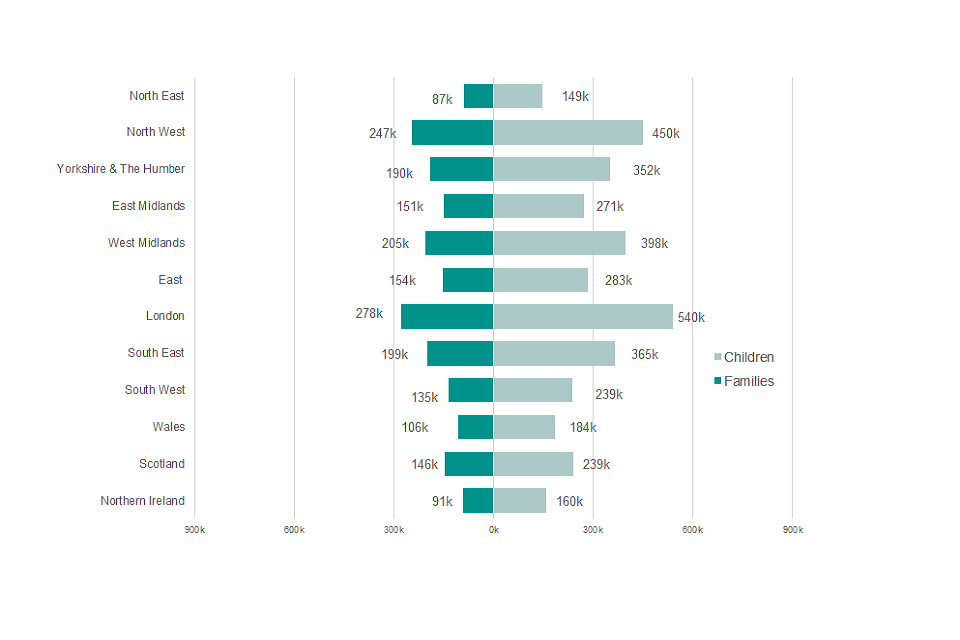
Figure 8.1: Numbers of Families Claiming Different Types of Tax Credits by Country and English Region
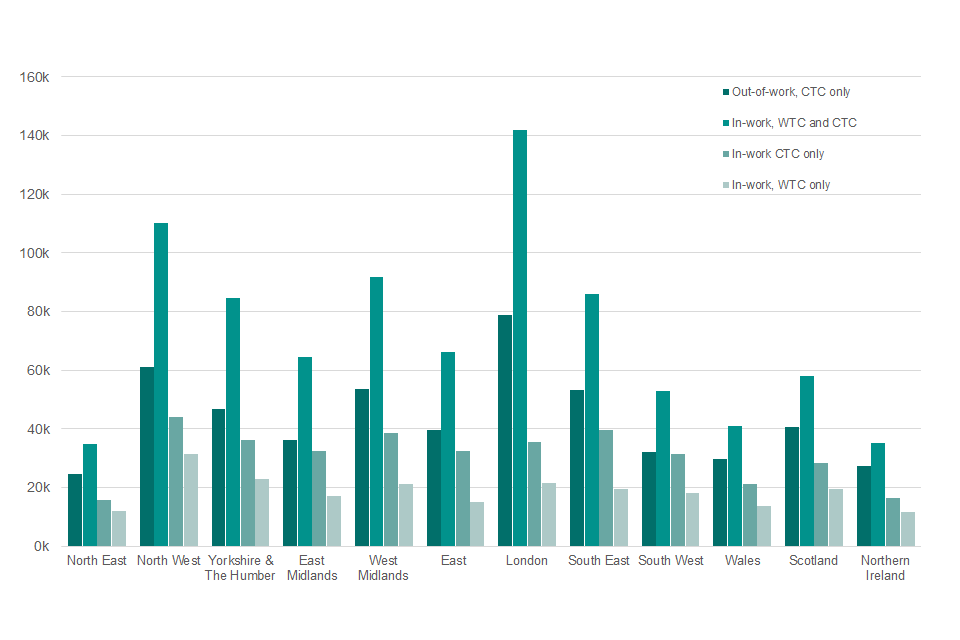
As seen in Figure 8.1, the region with the highest numbers of tax credits recipients is London, followed by the North West and the West Midlands. The region with the lowest numbers of tax credits recipients is the North East of England followed by Northern Ireland. Within the overall figures, the highest number of families on the higher awards - those receiving WTC and CTC - are from London followed by the North West. The highest number of out-of-work families in receipt are again in London followed by the North West. This takes no account of the size of the population that are eligible for tax credits so one should be careful when drawing inferences from these results.
Table 8.1: Recipient Families by Profile of Tax Credits and by Country and English Regions (Thousands)
| Country and English Region | Total Out-of-Work Families | In-Work Families With Children Receiving WTC and CTC | In-Work Families With Children Receiving CTC Only | In-Work Families With No Children Receiving WTC Only | Total In-Work Families | Total In Receipt |
|---|---|---|---|---|---|---|
| United Kingdom[footnote 8] | 524.3 | 867.8 | 372.7 | 224.7 | 1,465.1 | 1,989.4 |
| England | 426.1 | 732.9 | 306.5 | 179.7 | 1,219.0 | 1,645.1 |
| North East | 24.6 | 34.8 | 15.7 | 12.2 | 62.7 | 87.2 |
| North West | 61.0 | 110.1 | 44.2 | 31.6 | 185.8 | 246.8 |
| Yorkshire and The Humber | 46.8 | 84.5 | 36.2 | 22.9 | 143.5 | 190.4 |
| East Midlands | 36.2 | 64.6 | 32.4 | 17.3 | 114.3 | 150.5 |
| West Midlands | 53.7 | 91.8 | 38.7 | 21.3 | 151.7 | 205.4 |
| East | 39.7 | 66.3 | 32.6 | 15.0 | 113.9 | 153.6 |
| London | 78.7 | 141.9 | 35.6 | 21.6 | 199.1 | 277.8 |
| South East | 53.4 | 85.9 | 39.8 | 19.7 | 145.4 | 198.8 |
| South West | 32.0 | 53.1 | 31.4 | 18.1 | 102.6 | 134.6 |
| Wales | 29.9 | 41.0 | 21.1 | 13.6 | 75.7 | 105.6 |
| Scotland | 40.5 | 57.9 | 28.5 | 19.5 | 105.9 | 146.4 |
| Northern Ireland | 27.5 | 35.3 | 16.3 | 11.7 | 63.3 | 90.7 |
| Foreign and Not Known | 0.3 | 0.7 | 0.4 | 0.2 | 1.3 | 1.7 |
Table 8.2: Number of Children in Recipient Families, by Country and English Regions (Thousands)
| Country and English Region | Children in Out-of-Work Families | With Children Receiving WTC and CTC | With Children Receiving CTC Only | Total Children in All Tax Credit Recipient Families |
|---|---|---|---|---|
| United Kingdom[footnote 8] | 1,085.5 | 1,730.4 | 817.1 | 3,633.0 |
| England | 890.3 | 1,482.7 | 674.6 | 3,047.5 |
| North East | 50.5 | 65.0 | 33.1 | 148.6 |
| North West | 127.5 | 226.0 | 96.0 | 449.5 |
| Yorkshire and The Humber | 99.4 | 173.0 | 79.9 | 352.4 |
| East Midlands | 75.1 | 124.6 | 71.6 | 271.3 |
| West Midlands | 116.4 | 194.6 | 87.0 | 398.0 |
| East | 82.8 | 128.6 | 72.1 | 283.4 |
| London | 160.4 | 304.0 | 75.9 | 540.3 |
| South East | 111.8 | 165.4 | 88.2 | 365.3 |
| South West | 66.4 | 101.5 | 70.9 | 238.8 |
| Wales | 61.8 | 76.5 | 45.5 | 183.8 |
| Scotland | 77.5 | 102.6 | 59.2 | 239.3 |
| Northern Ireland | 55.4 | 67.3 | 36.9 | 159.6 |
| Foreign and Not Known | 0.6 | 1.4 | 0.9 | 2.9 |
A National Statistics Publication
National Statistics are produced to high professional standards as set out in the Code of Practice for Official Statistics. They undergo regular quality assurance reviews to ensure that they meet customer needs. They are produced free from any political interference.
The United Kingdom Statistics Authority has designated these statistics as National Statistics, in accordance with the Statistics and Registration Service Act 2007 and signifying compliance with the Code of Practice for Official Statistics
Designation can be broadly interpreted to mean that the statistics:
- meet identified user needs
- are well explained and readily accessible
- are produced according to sound methods
- are managed impartially and objectively in the public interest
- are produced to the highest standard, ensuring that data confidentiality has been maintained
Once statistics have been designated as National Statistics it is a statutory requirement that the Code of Practice shall continue to be observed.
For general enquiries about National Statistics, contact the National Statistics Public Enquiry Service on:
Tel: 0845 601 3034 Overseas: +44 (01633) 653 599 Minicom: 01633 812 399 E-mail: info@statistics.gov.uk Fax: 01633 652 747
Letter: Customer Contact Centre, Room 1.101, Government Buildings, Cardiff Road, Newport, South Wales, NP10 8XG.
You can find National Statistics here
National Statistics Review
A formal review of our National and Official Statistics publications was held between May and August 2011. Over 130 responses were received from a broad range of users. A report summarising the responses received has been published here
HMRC Consultation on Official Statistics
HMRC launched a wide-ranging consultation on a range of statistics on 8th February 2021. This can be found here This includes changes to a number of tax credits statistics releases including a proposal to reduce the provisional award statistics from twice yearly to annually. An annual publication would be published each summer alongside or as one publication with the Child and Working Tax Credits Finalised Award statistics. Any changes to the tax credit releases will take into account user feedback which we will respond to after the consultation.
Definitions
What Are Tax Credits?
Tax credits are a system of financial support for families based on their specific circumstances. The system, introduced in 2003, forms part of wider government policy to provide support to parents returning to work, reduce child poverty and increase financial support for families. The design of the system means that as families’ circumstances change, so does (daily) entitlement to tax credits. Tax credits are based on household circumstances and can be claimed jointly by couples or by single adults. Entitlement is based on the following factors:
- age
- income
- hours worked
- number and age of children
- childcare costs
- disabilities
For further information about who can claim please refer to the HMRC website.
Tax credits are made up of Working Tax Credit and Child Tax Credit, explained below.
Working Tax Credits (WTC)
Provide in-work support for people on low incomes, with or without children. It is available for in-work support to people who are aged at least 16 and either:
- are single, work 16 or more hours a week and are responsible for a child or young person
- are in a couple and are responsible for a child or young person where their combined weekly working hours are at least 24, with one claimant working at least 16 hours
- work 16 or more hours a week and are receiving or have recently received a qualifying sickness or disability related benefit and have a disability that puts them at a disadvantage of getting a job
- Work 16 or more hours a week and are aged 60 or over
Otherwise, it is available for people who are aged 25 and over who work 30 hours a week or more. WTC is made up of the following elements:
Basic Element: which is paid to any working person who meets the basic eligibility conditions.
Lone Parent Element: for single/lone parents
Second Adult Element: for couples
30 Hour Element: for individuals who work at least 30 hours a week, couples where one person works at least 30 hours a week or couples who have a child and work a total of 30 hours or more a week between them where one of them works at least 16 hours a week.
Disability Element: for people who work at least 16 hours a week and who have a disability that puts them at a disadvantage in getting a job and who are receiving or have recently received a qualifying sickness or disability related benefit.
Severe Disability Element: for people who are in receipt of DLA (Highest Rate Care Component), PIP (Enhanced Daily Living Component) or Attendance Allowance at the highest rate.
Childcare element: for a single parent who works at least 16 hours a week, or couples who either (i) both work at least 16 hours a week or (ii) one of them work at least 16 hours a week but the other is out of work for being in hospital or in prison and who spends money on a registered or approved childcare provider. The childcare element of WTC can support up to 70% of childcare costs up to certain maximum limits.
Further information on childcare cost support can be found here
Child Tax Credits (CTC)
Provide income-related support for children and qualifying young people aged 16-19 who are in full time, non-advanced education or approved training into a single tax credit, payable to the main carer. Families can claim CTC whether or not the adults are in work. CTC is made up of the following elements:
Family element: which is the basic element for families responsible for one or more children or qualifying young people. From 6th April 2017, this element is only payable to families with at least one child born before this date.
Child element: which is paid for each child or qualifying young person the claimant is responsible for. From 6th April 2017, this element is no longer payable in respect of third or subsequent children who were born after this date. Certain exceptions to this rule apply and are set out here
Disability element: for each child or qualifying young person the claimant is responsible for if Disability Living Allowance (DLA) or Personal Independence Payment (PIP) is payable for the child, or if the child is certified as blind or severely sight impaired.
Severe disability element: for each child or qualifying young person the claimant is responsible for if DLA (Highest Rate Care Component) or PIP (Enhanced Daily Living Component) is payable for the child.
Out-of-work benefit families: some out-of-work families with children do not receive CTC but instead receive the equivalent amount via child and related allowances in Income Support or income-based Jobseeker’s Allowance (IS/JSA). These families are included in the figures, generally together with out-of-work families receiving CTC. The vast majority of these claimants have now moved to tax credits and the remainder will be migrated either to tax credits or Universal Credit.
Tapering
Tapering is the amount of the award that will be reduced when the household income exceeds a given threshold. For example, the income threshold for claimants receiving WTC only and for combined WTC and CTC claimants is £6,530. After this threshold, the taper rate will be 41%. Tapering reduces WTC first and then CTC for claimants who receive both.
Child and Working Tax Credit Entitlement
The amount of support an eligible family can receive (known as their entitlement) varies depending on their income and their eligibility for specific tax credit elements. First, a family’s maximum possible entitlement is worked out by adding up all the different elements of CTC and WTC that they are eligible for.
A household’s actual entitlement is then determined by tapering this maximum amount according to different thresholds. As demonstrated within the diagram below, families eligible for the WTC receive the full entitlement until their annual household income reaches £6,530, after which the amount of tax credits they receive is reduced by 41 pence for each £1 they earn beyond this threshold.
If a household is out-of-work and therefore eligible for the CTC only, they will receive the full entitlement until their annual household income reaches £16,385 (2020-21). After this point, the amount of tax credits they receive is again reduced by 41 pence for each additional £1 of income beyond this threshold (note that this is not shown on the diagram below).
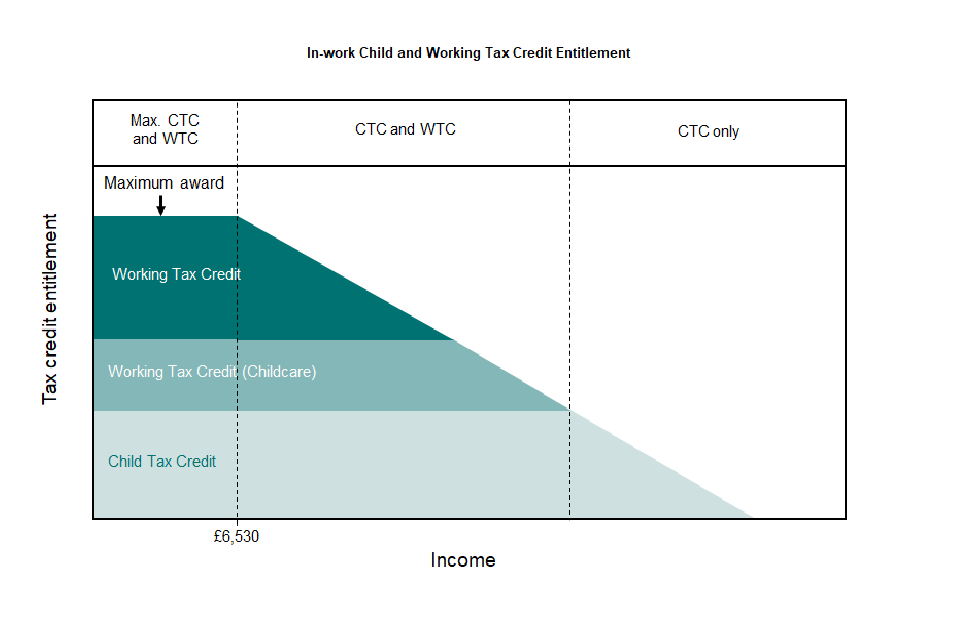
Because of the range of possible eligibilities and interactions between the elements, both the maximum award and the shape of the above award profile will be different for every family with different circumstances.
Tax credits are based on the taxable income of adults within the family. The income used to calculate the award is based on the families’ income from the previous tax year, or on their most recently reported circumstances in-year. Up to £2,500 of any change in annual income between the previous or current year is disregarded in the calculation. A family’s tax credits award is provisional until finalised at the end of the year, when it is checked against their final income for the year. This publication relates to a snapshot of tax credit support based on provisional incomes and other circumstances as reported at the date when the statistics were extracted.
About This Publication
What the Publication Tells Us
The provisional awards are based on a 10% sample of data and are currently published in winter and summer. These statistics are as close to real-time as possible and represent the picture as at the beginning of April and December.
Each release consists of two sets of tables: the main tables and the additional geographical tables. As only a sample of data is used, detailed analysis at the sub-geographical levels is not always possible. The statistics in this release include analysis at the following geographical levels:
- Country and English Region
- Local Authority (LA)
- Westminster Parliamentary Constituency
- Scottish Parliamentary Constituency
The main publication includes a Country and Region summary, with the geographical publication going to a lower level. This series has been produced bi-annually since the introduction of tax credits in April 2003.
Provisional Awards vs Finalised Awards
It is important to recognise that the finalised awards statistics are not a revision of the provisional statistics. The provisional numbers relate to the caseload position at a snapshot point in time, based on the latest family circumstances HMRC have been informed of by each family prior to that particular time. The finalised awards relate to the complete retrospective picture for the year, based on a finalised view of family incomes and circumstances. The caseload population will be different between the two publications as a result of HMRC knowing the complete finalised picture of the award.
At the start of the year, the tax credit award will be a provisional award reflecting the reported circumstances as at 6th April (the start of the tax year). Over the course of the year, a family’s circumstances may or may not change. The provisional award is updated each time a family’s circumstances change with the latest set of circumstances and a new provisional award is calculated. It is only at finalisation (usually four to nine months after the end of the tax year) that the family’s circumstances for the whole year are known and a finalised award can be calculated. As a result, the finalised award statistics are not available until around 12 months after the end of the entitlement year in question. Given this lag in availability of data, there is some value in looking at a snapshot of families’ circumstances at any given time to give some indication of the level of support one might expect to see subsequently at finalisation.
To illustrate the difference, let us look at a family that has one change of circumstance throughout the year, moving from in-work to out-of-work in January of any one year.
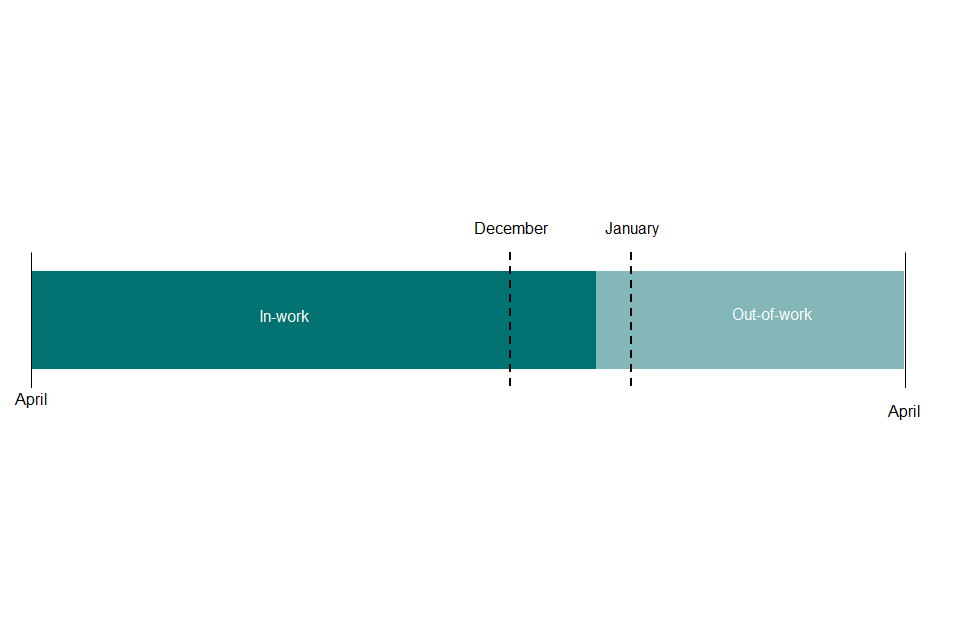
The snapshot data looking at the provisional award in April will model entitlement for the whole year on the basis that the family is in-work for the whole year (since we do not know about the move out-of-work at that time). It is not until finalisation, and thereby in the finalised award data publication, that the family’s entitlement will be modelled on the basis of 9 months in-work and 3 months out-of-work.
Therefore, the figures for provisional awards are more up to date, but are subject to retrospective change. The sizes of these changes can be seen by comparing the data for selected dates in finalised awards with data published earlier on provisional awards at the same time snapshot dates. The provisional award data classify families according to the levels of their entitlement at the reference date, modelled from data on their circumstances and their latest annual incomes reported by that date. The actual amount being received at that date can be lower, due to recovery of earlier overpayments.
Which Publication Should I Use?
Generally, if you are interested in the final end of year position, use the finalised awards data publication. If you are more concerned with getting the latest up-to-date information that may not align exactly with finalised data further down the line, use the provisional awards data. Using the finalised award data will also mean the figures will align with other published data on tax credits, such as information in HMRC’s Departmental Accounts. The latest finalised award publication can be found under Personal Tax Credits Statistics
What Information Do the Tables Contain?
CTC and WTC are claimed by individuals, or jointly by couples, whether or not they have children (described as “families” in this publication). These tables cover families who had claimed, and were eligible for, CTC (or the equivalent via benefits) or WTC at 2nd December 2020 (the “reference date”) and who were recipients at that date.
From April 2007, the tables exclude families whose modelled entitlements are tapered to zero due to their income levels. These families were originally included because they may retrospectively have positive entitlements at finalisation. However, this is no longer likely for the majority of such families. Their numbers have been swelled by families whose youngest children have left full time education, who continue to satisfy the qualifying conditions for WTC, but whose incomes are sufficient to taper the WTC entitlements to zero.
Recent Policy Changes
In the 2015 Summer Budget, the Government announced that the child element of Child Tax Credit (CTC) would be limited to two children for those born on or after 6 April 2017 unless certain exceptions apply. Prior to 6th April 2017, the child element of CTC was paid for each child or qualifying young person that the claimant (or his or her partner) was responsible for.
The change means that any family with two or more existing children do not receive any child element (worth up to £2,830 a year per child in 2019 to 2020) for children born on or after that date, subject to exceptions. The child element of Child Tax Credit continues to be paid for all children born before 6th April 2017.
In addition, any family having their first child born on or after 6th April 2017 do not receive the family element (worth up to £545 a year) of Child Tax Credit. The family element was previously paid to all families. From 6 April 2017, it is only be paid where the claimant is responsible for at least one child or qualifying young person born before 6 April 2017.
For further information, please visit Child Tax Credit Exemptions to the 2 Child Limit
Statistics related to this policy can be found here
Impacts of the Covid-19 Pandemic
In the previous release, it was noted that there would be a further increase of £1,045 per year made to the basic Working Tax Credit element as part of the Government’s response to COVID-19 and that the impact of Covid-19 on these statistics would be seen in the December 2020 data (this publication).
During 2020, the Covid-19 pandemic has led to some changes in the tax credit system which may have had an impact on these statistics. As part of a number of measures to support the country, the basic element of Working Tax Credit was increased by £1,045 to £3,040 from 6 April 2020 until 5 April 2021. The amount a claimant or household has benefited depends on their circumstances, including their level of household income, how many children they are responsible for or if they are disabled. However claimants will have received an increase of up to £20 each week. The temporary increase moved many claimants from nil to positive awards at the start of April. At the start of the pandemic, there was also a higher than usual move to Universal Credit (UC) due to unemployment impacts and a reduction in working hours. These impacts have largely offset one another. Policies were also introduced relaxing rules on WTC hours and HMRC automatically renewed tax credit claims for 2019/20 apart from those identified as very high risk. This is likely to have resulted in fewer tax credits terminations than there would have been otherwise.
Universal Credit
Universal Credit (UC) is a payment to help with living costs for those on a low income or out of work. UC was introduced in April 2013 in certain areas of North West England. Since October 2013, it has progressively been rolled out to other areas. Claimants receive a single monthly household payment, paid into a bank account in the same way as a monthly salary and support for housing costs, children and childcare costs are integrated into Universal Credit. Child Tax Credit will be replaced as Universal Credit rolls out. Due to most tax credit recipients now claiming Universal Credit instead (the full roll out of this service has commenced), there are no longer any new tax credit claims (with the exception of those claiming the family premium).
Further information about Universal Credit, including making a claim, is available online here
Statistics related to UC are available online and can be found here
Uses of These Statistics and User Engagement
Uses Of These Statistics
The statistics contained in this publication will be of interest for anyone that is looking for the latest possible data on tax credits or detailed up-to-date geographical estimates of the number of families receiving tax credits. Specifically, there are aggregate statistics on the type and level of tax credit support, broken down by categories such as family composition, family income, work status, and geographical area. It may be of interest to academics, think tanks and political parties interested in the twin aims of tax credits - eradicating child poverty and improving work incentives. Equally, it may be of interest to people considering wider questions on government support systems and/or others designing benefit systems. Finally, the geographical analyses might be of interest at the more local level, giving some indication of the level of government support in each region and local authority in the UK.
User Engagement
Bespoke analysis of tax credits data is possible although there may be a charge depending on the level of complexity and the resources required to produce. If you would like to discuss your requirements, to comment on the current publications, or for further information about the tax credits statistics please use the contact information at the end of this publication, or from the HMRC website
We are committed to improving the official statistics we publish. We want to encourage and promote user engagement, so we can improve our statistical outputs. We would welcome any views you have by email. We will undertake to review user comments on a quarterly basis and use this information to influence the development of our official statistics. We will summarise and publish user comments at regular intervals.
HMRC Consultation on Official Statistics
HMRC launched a wide-ranging consultation on a range of statistics on 8th February 2021. This can be found here. This includes changes to a number of tax credits statistics releases including a proposal to reduce the provisional award statistics from twice yearly to annually. An annual publication would be published each summer alongside or as one publication with the Child and Working Tax Credits Finalised Award statistics. Any changes to the tax credit releases will take into account user feedback which we will respond to after the consultation.
Revision Policy
This policy has been developed in accordance with the UK Statistics Authority Code of Practice for Official Statistics and Her Majesty’s Revenue and Customs Revisions Policy. UK Statistics Authority Code of Practice
There are two types of revisions:
Scheduled Revisions
This requires explanation of the handling of scheduled revisions due to the receipt of updated information in the case of each statistical publication.
Unscheduled Revisions
HMRC aims to avoid the need for unscheduled revisions to publications unless they are absolutely necessary and have put systems and processes in place to minimise the number of revisions. Where revisions is necessary due to errors in the statistical process, an explanation along with the nature and extent of revision is also provided. The statistical release and the accompanying tables will be updated and published as soon as is practical.
Disclosure Control
In line with HMRC’s Dominance and Disclosure policy, to avoid the possible disclosure of information about individuals, values have been supressed with a “-’’ entry in tables when underlying sample counts are low or zero.
Appendix A: Technical Note
Current Entitlement
There is a single claim form covering both Child and Working Tax Credit, and entitlement is calculated jointly. Awards run to the end of the tax year, and are based on the element values, thresholds, etc. shown at Appendix B.
An annual award is calculated by summing the various elements to which the family is entitled. Unless the family is receiving Income Support, income-based Jobseeker’s Allowance, income-based Employment and Support Allowance or Pension Credit (Guarantee Credit), this sum is reduced if the family’s annual income (see below) exceeds the relevant income threshold. The reduction is 41 per cent of the excess over the threshold.
For 2020 to 2021 awards, the initial calculation of a family’s entitlement is based on its relevant income in 2019 to 2020, which is reported for the final calculation of the 2019 to 2020 award or on the claim form. Relevant income comprises gross annual taxable income from social security benefits (except pensions) and from employment or self-employment, less pension contributions; plus annual income from savings, property, state and private pensions and other sources (but excluding maintenance) in excess of £300. For claims by couples, entitlement is based on their joint annual income.
Final entitlement for 2020 to 2021 is based on 2019 to 2020 income if that is more than £2,500 lower than the income in 2019 to 2020, or exceeds it by more than £2,500. However, the first £2,500 of a fall in income or the first £2,500 rise in income in 2020 to 2021 is disregarded in calculating the tax credit due for that year. The family can report an estimate of its income in 2020 to 2021 at any time, and the award will be recalculated using this income. After the end of the year, the award is finalised when the 2020 to 2021 income is known.
Change of Circumstances
A family’s circumstances (such as number of children, hours worked, childcare costs, and disabilities) can change within the year. To calculate the annual award, the year is then split into the periods between which the family’s circumstances changed. Entitlement is calculated for each period, based on the annual values shown in Appendix B but scaled down to the number of days in the period. The rate of entitlement attributed to each case for this publication is that for the period spanning the reference date.
Data Sources
The estimates in the tables for in-work families are based on data from a random sample of families with awards at the reference date, extracted from the tax credits computer system on that date.
The estimates for out-of-work families with children are based on data at 2nd December 2020. The out-of-work families receiving their child support via DWP are based on scans of the benefits systems. These identified all families with children receiving benefits at August 2008. The estimates are restricted to families that had qualifying children in Child Benefit awards as at November 2020 and were not claiming tax credits at 2nd December 2020.
Figures are subsequently calibrated to total estimates of the population made by the Department for Work and Pensions. The out-of-work families’ claimants’ size in Table 2.1 is the combination of estimate for CTC equivalent paid by DWP plus the estimate for out-of- work families receiving CTC at the extraction date based on a random sample from the HMRC core system taken at that date.
As at 2nd December 2020, families receiving equivalent support through DWP benefits account for just over 1% of the total number of out-of-work families benefiting from tax credits.
Weights were given to the sample to gross the total to derive the estimates. Details of weighting is provided in Appendix B.
Appendix B: Sampling Method and Sampling Error
The tables are based on a random sample of families receiving CTC or WTC at the reference date. The sample comprises 10 per cent of such single adults (with or without children) and 20 per cent of such couples. Each figure in the tables is derived by weighting the relevant sample cases by the inverses of these sampling fractions .
The figures in the tables are, therefore, estimates, but we know how accurate they are. For example, suppose that there are 100,000 couples with a characteristic. This number is not known, and we are to estimate it via the sample. Each couple is sampled with a chance of 0.2. Statistical theory says that there is a 95 per cent chance that the number sampled will lie between 19,752 and 20,248, and that the resulting estimate will lie between 98,760 and 101,240. At least approximately, then, where an estimate of 100,000 is derived from the sample, the true figure lies between these figures, with a 95 per cent probability. That is, the “95 per cent confidence interval” for the estimate is the estimate itself plus or minus 1,240.
The width of the confidence interval varies with the size of the estimate and the sampling fraction, as shown in the table below. For estimates that comprise a mixture of couples and single adults, the figures will lie between the two sets shown, according to the mix.

Appendix C: Annual Entitlement (£) by Tax Credit Elements and Thresholds
| 2008-09 | 2009-10 | 2010-11 | 2011-12 | 2012-13 | 2013-14 | 2014-15 | 2015-16 | 2016-17 | 2017-18 | 2018-19 | |
|---|---|---|---|---|---|---|---|---|---|---|---|
| Child Tax Credit | |||||||||||
| Family element | 545 | 545 | 545 | 545 | 545 | 545 | 545 | 545 | 545 | 545 | 545 |
| Family element, baby addition [footnote 9] | 545 | 545 | 545 | - | - | - | - | - | - | - | - |
| Child element [footnote 10] | 2,085 | 2,235 | 2,300 | 2,555 | 2,690 | 2,720 | 2,750 | 2,780 | 2,780 | 2,780 | 2,780 |
| Disabled child additional element [footnote 11] | 2,540 | 2,670 | 2,715 | 2,800 | 2,950 | 3,015 | 3,100 | 3,140 | 3,140 | 3,175 | 3,275 |
| Severely disabled child element [footnote 12] | 1,020 | 1,075 | 1,095 | 1,130 | 1,190 | 1,220 | 1,255 | 1,275 | 1,275 | 1,290 | 1,325 |
| Working Tax Credit | |||||||||||
| Basic element | 1,800 | 1,890 | 1,920 | 1,920 | 1,920 | 1,920 | 1,940 | 1,960 | 1,960 | 1,960 | 1,960 |
| Couples and lone parent element | 1,770 | 1,860 | 1,890 | 1,950 | 1,950 | 1,970 | 1,990 | 2,010 | 2,010 | 2,010 | 2,010 |
| 30 hour element [footnote 13] | 735 | 775 | 790 | 790 | 790 | 790 | 800 | 810 | 810 | 810 | 810 |
| Disabled worker element | 2,405 | 2,530 | 2,570 | 2,650 | 2,790 | 2,855 | 2,935 | 2,970 | 2,970 | 3,000 | 3,090 |
| Severely disabled adult element | 1,020 | 1,075 | 1,095 | 1,130 | 1,190 | 1,220 | 1,255 | 1,275 | 1,275 | 1,290 | 1,330 |
| 50+ return to work payment:16 but less than 30 hours per week [footnote 14] | 1,235 | 1,300 | 1,320 | 1,365 | - | - | - | - | - | - | - |
| 50+ return to work payment: at least 30 hours per week | 1,840 | 1,935 | 1,965 | 2,030 | - | - | - | - | - | - | - |
| Childcare element: Maximum eligible costs allowed (£ per week) | |||||||||||
| Eligible costs incurred for 1 child | 175 | 175 | 175 | 175 | 175 | 175 | 175 | 175 | 175 | 175 | 175 |
| Eligible costs incurred for 2+ children | 300 | 300 | 300 | 300 | 300 | 300 | 300 | 300 | 300 | 300 | 300 |
| Percentage of eligible costs covered | 80% | 80% | 80% | 70% | 70% | 70% | 70% | 70% | 70% | 70% | 70% |
| Common features | |||||||||||
| First income threshold [footnote 15] | 6,420 | 6,420 | 6,420 | 6,420 | 6,420 | 6,420 | 6,420 | 6,420 | 6,420 | 6,420 | 6,420 |
| First withdrawal rate | 39% | 39% | 39% | 41% | 41% | 41% | 41% | 41% | 41% | 41% | 41% |
| Second income threshold [footnote 16] | 50,000 | 50,000 | 50,000 | 40,000 | - | - | - | - | - | - | - |
| Second withdrawal rate | 1 in 15 | 1 in 15 | 1 in 15 | 41% | - | - | - | - | - | - | - |
| First income threshold for those entitled to Child Tax Credit only [footnote 17] | 15,575 | 16,040 | 16,190 | 15,860 | 15,860 | 15,910 | 16,010 | 16,105 | 16,105 | 16,105 | 16,105 |
| Income increase disregard [footnote 18] | 25,000 | 25,000 | 25,000 | 10,000 | 10,000 | 5,000 | 5,000 | 5,000 | 2,500 | 2,500 | 2,500 |
| Income fall disregard [footnote 18] | - | - | - | - | 2,500 | 2,500 | 2,500 | 2,500 | 2,500 | 2,500 | 2,500 |
| Minimum award payable | 26 | 26 | 26 | 26 | 26 | 26 | 26 | 26 | 26 | 26 | 26 |
-
Where the award is nor reduced through tapering, either because the family is pass ported to maximum CTC through receipt of out-of-work benefits, or because the annual income is below the relevant first threshold. See Appendix A. ↩ ↩2 ↩3
-
Not tapered. ↩
-
WTC includes almost 19,000 families (over 7,500 couples and over 11,200 singles) where the WTC entitlement is less than or equal to the childcare element and is therefore paid together with CTC. ↩
-
‘Worker’ is defined as an adult working for a minimum of 16 hours per week. ↩
-
Those with the disabled child element and with a positive award. Disabled children includes those who are severely disabled and included in Table 5.4. ↩
-
Those with the disabled child element and with a positive award. Disabled children includes those who are severely disabled and included in Table 5.4. ↩
-
Those with the severely disabled child element and with a positive award. ↩
-
Includes foreign and not known. “Foreign and not known” consists of a small proportion of recipient families and children who do not live within England, Scotland, Northern Island or Wales. They may, for instance, be a Crown servant posted overseas, or living in a British Crown Dependency. Due to the small size of this population, we combine them into one group which also consists of those whom, at the time of publication, either have a UK postcode that does not match to a Government Office Region code, or do not have a postcode in the available data. ↩ ↩2
-
Payable to families for any period during which they have one or more children aged under one. Abolished 6 April 2011. ↩
-
Payable for each child up to 31 August after their 16th birthday, and for each young person for any period in which they are aged under 20 (under 19 to 2005-06) and in full-time non-advanced education, or under 19 and in their first 20 weeks of registration with the Careers service or Connexions. ↩
-
Payable in addition to the child element for each disabled child. ↩
-
Payable in addition to the disabled child element for each severely disabled child. ↩
-
Payable for any period during which normal hours worked (for a couple, summed over the two partners) is at least 30 per week. ↩
-
Payable for each qualifying adult for the first 12 months following a return to work. Abolished 6 April 2012. ↩
-
Income is net of pension contributions, and excludes Child Benefit, Housing benefit, Council tax benefit, maintenance and the first £300 of family income other than from work or benefits. The award is reduced by the excess of income over the first threshold, multiplied by the first withdrawal rate. ↩
-
For those entitled to the Child Tax Credit, the award is reduced only down to the family element, plus the baby addition where relevant, less the excess of income over the second threshold multiplied by the second withdrawal rate. Abolished effective 6 April 2012. ↩
-
Those also receiving Income Support, income-based Jobseeker’s Allowance or Pension Credit are passported to maximum CTC with no tapering. ↩
-
Introduced from 6 April 2012, this drop in income is disregarded in the calculation of Tax Credit awards. ↩ ↩2