Child and Working Tax Credits statistics: Finalised awards, 2018-19
Updated 25 February 2021

© Crown copyright 2021
This publication is licensed under the terms of the Open Government Licence v3.0 except where otherwise stated. To view this licence, visit nationalarchives.gov.uk/doc/open-government-licence/version/3 or write to the Information Policy Team, The National Archives, Kew, London TW9 4DU, or email: psi@nationalarchives.gov.uk.
Where we have identified any third party copyright information you will need to obtain permission from the copyright holders concerned.
This publication is available at https://www.gov.uk/government/statistics/child-and-working-tax-credits-statistics-finalised-annual-awards-2018-to-2019/child-and-working-tax-credits-statistics-finalised-awards-2018-19
Media contact:
HMRC Press Office
03000 585018
Statistical contact
Boniface Yao Seworde
benefitsandcredits.analysis@hmrc.gov.uk
KAI Benefits & Credits
HM Revenue and Customs
Albert Bridge House
Manchester
M60 9AF
These statistics focus on the number of families benefiting from tax credits in England, Scotland, Wales and Northern Ireland in the 2018 to 2019 tax year. It also presents a breakdown of families by their profile position, age and gender, type of family and family size, including the families benefitting from different elements of tax credits. It also covers the number of children in benefitting families broken down by their age.
Main Headlines
In 2018-19, there were approximately:
-
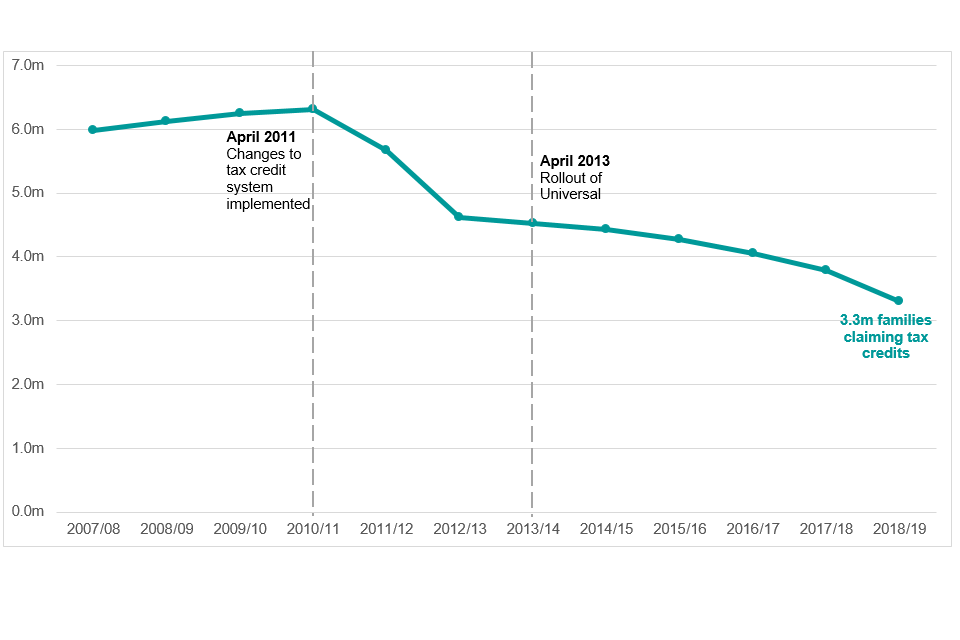
3.3m families claiming Child Tax Credit (CTC) and/or Working Tax Credit (WTC). This is a fall of approximately 485,000 when compared to a year earlier.
-
6.1m children in tax credit claiming families. This is a fall of approximately 663,000 when compared to a year earlier.
Number of families claiming tax credits since April 2007-08
Breakdown of tax credits population
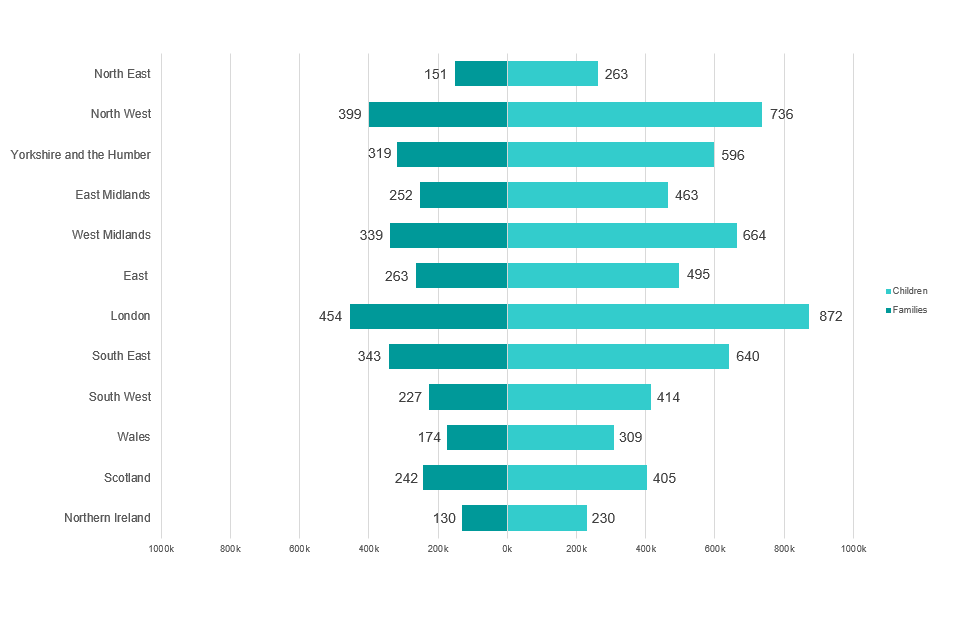
Families and children in each country or English region
1. A National Statistics Publication
National Statistics are produced to high professional standards as set out in the Code of Practice for Official Statistics. They undergo regular quality assurance reviews to ensure that they meet customer needs. They are produced free from any political interference.
The United Kingdom Statistics Authority has designated these statistics as National Statistics, in accordance with the Statistics and Registration Service Act 2007 and signifying compliance with the Code of Practice for Official Statistics. http://www.statisticsauthority.gov.uk/assessment/code-of-practice/
Designation can be broadly interpreted to mean that the statistics:
- meet identified user needs;
- are well explained and readily accessible;
- are produced according to sound methods;
- are managed impartially and objectively in the public interest;
- are produced to the highest standard, ensuring that data confidentiality has been maintained
Once statistics have been designated as National Statistics it is a statutory requirement that the Code of Practice shall continue to be observed.
For general enquiries about National Statistics, contact the National Statistics Public Enquiry Service on:
Tel: 0845 601 3034 Overseas: +44 (01633) 653 599 Minicom: 01633 812 399 E-mail: info@statistics.gov.uk Fax: 01633 652 747
Letter: Customer Contact Centre, Room 1.101, Government Buildings, Cardiff Road, Newport, South Wales, NP10 8XG.
You can also find National Statistics on the internet at www.statistics.gov.uk
2. HMRC Consultation on Official Statistics
HMRC launched a wide-ranging consultation on a range of statistics on 8th February 2021.
https://www.gov.uk/government/consultations/consultation-on-reduction-and-consolidation-of-hmrc-statistics-publications/programme-for-reducing-and-consolidating-published-official-statistics-content
This includes changes to a number of tax credits statistics releases and more details are given in the consultation. Any changes to the tax credit releases will take into account user feedback which we will respond to after the consultation .
A formal review of our National and Official Statistics publications was held between May and August 2011. Over 130 responses were received from a broad range of users. A report summarising the responses received has been published.
3. Introduction
3.1 Definitions
What are tax credits?
Tax credits are a flexible system of financial support designed to deliver support as and when a family needs it, tailored to their specific circumstances. The system, introduced in 2003, forms part of wider government policy to provide support to parents returning to work, reduce child poverty and increase financial support for families. The flexibility of the design of the system means that as families’ circumstances change, so (daily) entitlement to tax credits changes. This means tax credits can respond quickly to families’ changing circumstances providing support to those that need it most.
Tax credits are based on household circumstances and can be claimed jointly by members of a couple, or by single adults. Entitlement is based on the following factors:
- age
- income
- hours worked
- number and age of children
- childcare costs
- disabilities
For further information about who can claim please refer to the HMRC website:
https://www.gov.uk/browse/benefits/tax-credits
Tax credits are made up of:
Working Tax Credit (WTC)
Provides in-work support for people on low incomes, with or without children. It is available for in-work support to people who are aged at least 16 and:
- are single, work 16 or more hours a week and are responsible for a child or young person;
- are in a couple responsible for a child or young person where their combined weekly working hours are at least 24, with one parent working at least 16 hours;
- work 16 or more hours a week and are receiving or have recently received a qualifying sickness or disability related benefit and have a disability that puts them at a disadvantage of getting a job;
- Work 16 or more hours a week and are aged 60 or over.
Otherwise, it is available for people who are aged 25 and over who work 30 hours a week or more.
WTC is made up of the following elements:
Basic element: which is paid to any working person who meets the basic eligibility conditions.
Lone Parent element: for lone parents
Second adult element: for couples
30 hour element: for individuals who work at least 30 hours a week, couples where one person works at least 30 hours a week or couples who have a child and work a total of 30 hours or more a week between them where one of them works at least 16 hours a week.
Disability element: for people who work at least 16 hours a week and who have a disability that puts them at a disadvantage in getting a job and who are receiving or have recently received a qualifying sickness or disability related benefit.
Severe disability element: for people who are in receipt of DLA (Highest Rate Care Component), PIP (Enhanced Daily Living Component) or Attendance Allowance at the highest rate.
Childcare element: for a single parent who works at least 16 hours a week, or couples who either (i) both work at least 16 hours a week or (ii) one of them work at least 16 hours a week but the other is out of work for being in hospital or in prison and who spends money on a registered or approved childcare provider. The childcare element of WTC can support up to 70% of childcare costs up to certain maximum limits.
Further information on childcare cost support can be found from
https://www.gov.uk/government/publications/working-tax-credit-help-with-the-costs-of-childcare-wtc5
Child Tax Credit (CTC)
Provides income-related support for children and qualifying young people aged 16-19 who are in full time, non-advanced education or approved training into a single tax credit, payable to the main carer. Families can claim CTC whether or not the adults are in work. CTC is made up of the following elements:
Family element which is the basic element for families responsible for one or more children or qualifying young people.
Child element: which is paid for each child or qualifying young person the claimant is responsible for.
Disability element: for each child or qualifying young person the claimant is responsible for if Disability Living Allowance (DLA) or Personal Independence Payment (PIP) is payable for the child, or if the child is certified as blind or severely sight impaired.
Severe disability element: for each child or qualifying young person the claimant is responsible for if DLA (Highest Rate Care Component) or PIP (Enhanced Daily Living Component) is payable for the child.
Out-of-work benefit families: some out-of-work families with children do not receive CTC but instead receive the equivalent amount via child and related allowances in Income Support or income-based Jobseeker’s Allowance (IS/JSA). These families are included in the figures, generally together with out-of-work families receiving CTC. The vast majority of these claimants have now moved to tax credits and the remainder will be migrated either to tax credits or Universal Credit.
Tapering
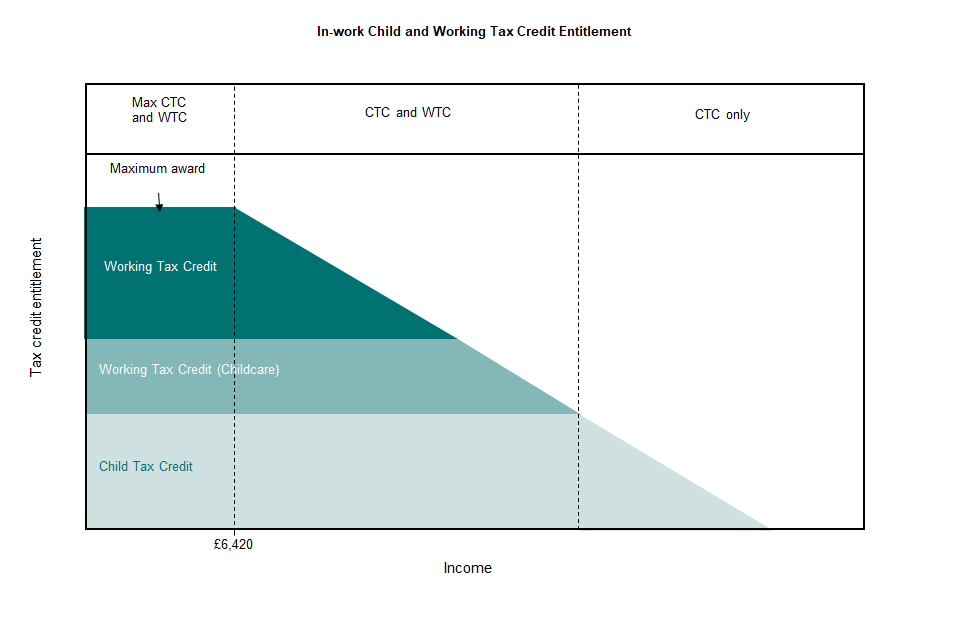
Tapering is the amount of the award that will be reduced when the household income exceeds a given threshold. For example, the income threshold for claimants receiving WTC only and for combined WTC and CTC claimants is £6,420. After this threshold, the taper rate will be 41%. Tapering reduces WTC first and then CTC for claimants who receive both.
Child and Working Tax Credit entitlement
The amount of support an eligible family can receive (known as their entitlement) varies depending on their income and their eligibility for specific tax credit elements. First, a family’s maximum possible entitlement is worked out by adding up all the different elements of CTC and WTC that they are eligible for (described on pages 2-4). A household’s actual entitlement is then determined by tapering this maximum amount according to different thresholds. As demonstrated within the diagram below, families eligible for the WTC receive the full entitlement until their annual household income reaches £6,420, after which the amount of tax credits they receive is reduced by 41 pence for each £1 they earn beyond this threshold.
If a household is out-of-work and therefore eligible for the CTC only, they will receive the full entitlement until their annual household income reaches £16,105 (2018-19). After this point, the amount of tax credits they receive is again reduced by 41 pence for each additional £1 of income beyond this threshold (note that this is not shown on the diagram below).
Because of the range of possible eligibilities and interactions between the elements, both the maximum award and the shape of the above award profile will be different for every family with different circumstances. Tax credits are based on the taxable income of adults within the family. The income used to calculate the award is based on the families’ income from the previous tax year, or on their most recently reported circumstances in-year. Up to £2,500 of any change in annual income between the previous or current year is disregarded in the calculation. A family’s tax credits award is provisional until finalised at the end of the year, when it is checked against their final income for the year. This publication relates to a snapshot of tax credit support based on provisional incomes and other circumstances as reported at the date when the statistics were extracted.
4. Technical notes
4.1 What the publication tells us
The finalised awards are published in June around one year following completion of the entitlement year in question. The delay in publication is the result of the finalisation process built into the Tax Credits system. Most families have until July 31st following the end of the entitlement year to renew their award reporting their finalised income for the year in question. However, families that report income from Self-Assessment (e.g., the self-employed) have until January 31st of the following year to finalise their income. As a result, the full picture is not known until at least February the year after the entitlement year ends and consequently publication is delayed until May.
Each release consists of four publications: the main publication, a supplementary payments publication, and the accompanying geographical publications. The statistics in this release include analysis at the following geographical levels:
- Country and English Region
- Local Authority (LA)
- Westminster Parliamentary Constituency
- Scottish Parliamentary Constituency
This series has been produced annually since the introduction of tax credits in April 2003.
4.2 Small Area Statistics
Estimates are also provided in a separate publication at Lower Super Output Area and Data Zone for England, Scotland and Wales. These statistics are available here:
https://www.gov.uk/government/collections/personal-tax-credits-statistics
The small area statistics are based on the finalised award position, but using a family’s circumstances as at 31st August rather than as an average across the year. This ensures that the statistics are directly comparable to other published small area statistics, such as Child Benefit.
4.3 Provisional awards vs finalised awards
It is important to recognise that the finalised awards statistics are not a revision of the provisional statistics. The provisional numbers relate to the caseload position at a snapshot point in time, based on the family circumstances HMRC have been informed of by each family prior to that particular time. The finalised awards relate to the complete retrospective picture for the year, based on a finalised view of family incomes and circumstances. The caseload population will be different between the two publications as a result of HMRC knowing the complete finalised picture of the award.
At the start of the year, the tax credit award will be a provisional award reflecting the reported circumstances as at 6th April (the start of the tax year). Over the course of the year, a family’s circumstances may or may not change. The provisional award is updated each time a family’s circumstances change with the latest set of circumstances and a new provisional award is calculated. It is only at finalisation (usually four to nine months after the end of the tax year) that the family’s circumstances for the whole year are known and a finalised award can be calculated. As a result, the finalised award statistics are not available until around 12 months after the end of the entitlement year in question. Given this lag in availability of data, there is some value in looking at a snapshot of families’ circumstances at any given time to give some indication of the level of support one might expect to see subsequently at finalisation.
To illustrate the difference, let us look at a family that has one change of circumstance throughout the year, moving from in-work to out-of-work in January of any one year.
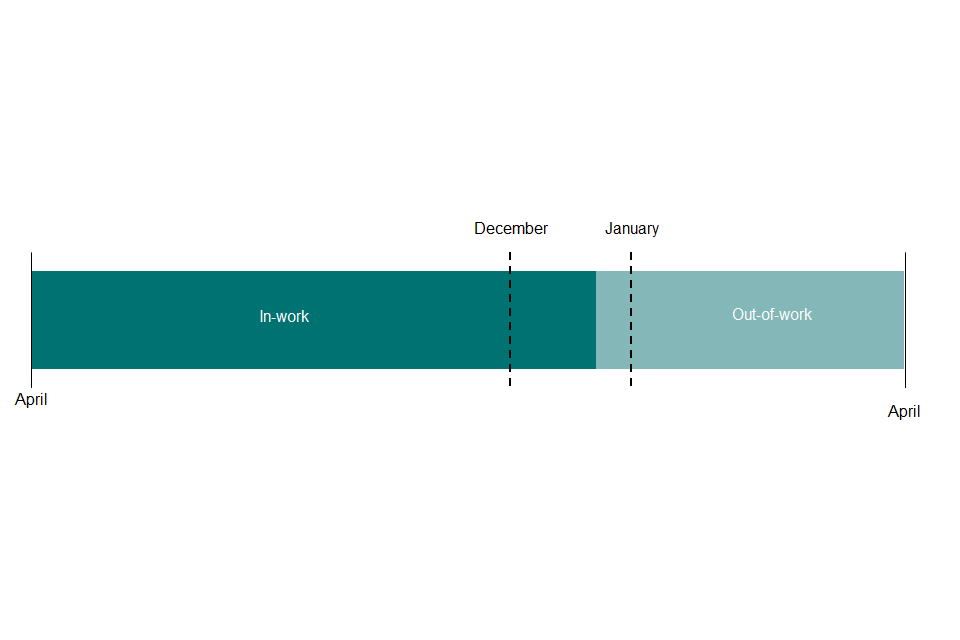
The snapshot data looking at the provisional award in December will model entitlement for the whole year on the basis that the family is in-work for the whole year (since we do not know about the move out-of-work at that time). It is not until finalisation, and thereby in the finalised award data publication, that the family’s entitlement will be modelled on the basis of 9 months in-work and 3 months out-of-work.
Therefore, the figures for provisional awards are more up to date, but are subject to retrospective change. The sizes of these changes can be seen by comparing the data for selected dates in finalised awards with data published earlier on provisional awards at the same time snapshot dates. The provisional award data classify families according to the levels of their entitlement at the reference date, modelled from data on their circumstances and their latest annual incomes reported by that date. The actual amount being received at that date can be lower, due to recovery of earlier overpayments.
4.4 Out-of-work families
A family is defined as being out-of-work at the reference date if both adults, or the single adult, does not work for at least 16 hours per week, these families can fall into two categories:
- Families administered by HMRC who are receiving their child support through CTC
- Families administered by DWP and claiming their child support through benefits
Child Tax Credit was introduced in April 2003 and any application since then falls under 1), whereas families who were receiving out-of-work benefits prior to April 2003 and remain so will fall under 2) – these cases are being migrated over to HMRC. All the tables in this publication include all out of work families, irrespective of the source of their support.
4.5 Which publication should I use?
Generally, if you are content with less timely statistics, use the finalised awards data publication. If you are more concerned with getting the latest up-to-date information that may not align exactly with finalised data further down the line, use the provisional awards data. Sticking to the finalised award data will also mean the figures will align with other published data on tax credits, such as information in HMRC’s Departmental Accounts. The latest finalised award publication can be found using the web link: https://www.gov.uk/government/collections/personal-tax-credits-statistics
4.6 What information do the tables contain?
CTC and WTC are claimed by individuals, or jointly by couples, whether or not they have children (described as “families” in this publication). These tables cover families who had claimed, and were eligible for, CTC (or the equivalent via benefits) or WTC for all or part of the 2018 to 2019 tax year.
The tables in Section 1 include both out-of-work and in-work families, and show the time series since 2003/04 of the tax credits population by profile position. Also included are the total levels of entitlement for each group. Table 1.2 provides further breakdowns of the population in terms of families, children and elements received. Section 2 provides further breakdowns of the population in the 2018 to 2019 tax year, specifically those with children, in terms of family size, level of entitlement and profile position.
Section 3 goes into further detail about the average number of families benefiting from the various individual elements of tax credits, as well as a table showing the income used to calculate the award.
4.7 Universal Credit
Universal Credit (UC) is a payment to help with living costs for those on a low income or out of work. UC was introduced in April 2013 in certain areas of North West England. Since October 2013, it has been progressively been rolled out to other areas. Claimants receive a single monthly household payment, paid into a bank account in the same way as a monthly salary and support for housing costs, children and childcare costs are integrated into Universal Credit. Child Tax Credit will be replaced as Universal Credit rolls out. At the time of producing these statistics, UC was rolled out to all areas of the country and was completed on 12th December 2018.
Further information about Universal Credit, including making a claim, is available online here: https://www.gov.uk/universal-credit
5. Uses of these statistics and user engagement
5.1 Uses of these statistics
The statistics contained in this publication will be of interest for anyone that is looking for the most comprehensive data on Tax Credits. Specifically, there are aggregate statistics on who is getting what level of tax credits support and the amount of that support, as well as breakdowns of both by various sub-categories - e.g., family composition, family income, work status, and geographical analyses. It may be of interest to academics, think tanks, political parties interested in the twin aims of Tax Credits: eradicating child poverty and improving work incentives. Equally, it may be of interest for people considering wider questions on government support systems and/or others designing benefit systems. Finally, the geographical analyses might be of interest at the more local level, giving some indication of the level of government support in each Region/Local Authority level.
5.2 User Engagement
Bespoke analysis of tax credits data is possible although there may be a charge depending on the level of complexity and the resources required to produce. If you would like to discuss your requirements, to comment on the current publications, or for further information about the tax credits statistics please use the contact information at the end of this publication, or from the HMRC website:
https://www.gov.uk/government/organisations/hm-revenue-customs/about/statistics#contact-us
We are committed to improving the official statistics we publish. We want to encourage and promote user engagement, so we can improve our statistical outputs.
We would welcome any views you have by email to the below address. We will undertake to review user comments on a quarterly basis and use this information to influence the development of our official statistics. We will summarise and publish user comments at regular intervals. benefitsandcredits.analysis@hmrc.gsi.gov.uk
6. Revision policy
This policy has been developed in accordance with the UK Statistics Authority Code of Practice for Official Statistics and Her Majesty’s Revenue and Customs Revisions Policy. The UK Statistics Authority Code of Practice can be found at https://www.gov.uk/government/uploads/system/uploads/attachment_data/file/261365/cop-confidentiality.pdf
There are two types of revisions:
6.1 Scheduled revisions
This requires explanation of the handling of scheduled revisions due to the receipt of updated information in the case of each statistical publication.
6.2 Unscheduled revision
HMRC aims to avoid the need for unscheduled revisions to publications unless they are absolutely necessary and put systems and processes in place to minimise the number of revisions. Where revisions is necessary due to errors in the statistical process, an explanation along with the nature and extent of revision is also provided. Also, the statistical release and the accompanying tables will be updated and published as soon as is practical
7. Disclosure control
To avoid the possible disclosure of information about individual families, values have been supressed when underlying sample counts are low.
8. Summary of main aggregates [footnote 1]
Based on finalised awards, the average number of benefiting families during the 11-year period to 2018-19 were:
Figures are in millions
| 2008-09 | 2009-20 | 2010-11 | 2011-12 | 2012-13 | 2013-14 | 2014-15 | 2015-16 | 2016-17 | 2017-18 | 2018-19 | |
| Total out-of-work families (all with children) | 1.43 | 1.48 | 1.46 | 1.45 | 1.48 | 1.4 | 1.31 | 1.24 | 1.19 | 1.12 | 0.97 |
| In-work families with children receiving more than the family element | 2.5 | 2.61 | 2.7 | 2.69 | - | - | - | - | - | - | - |
| In-work families with children receiving the family element or less | 1.78 | 1.67 | 1.61 | 1 | - | - | - | - | - | - | - |
| Total in-work families with children | 4.28 | 4.28 | 4.3 | 3.69 | 2.63 | 2.62 | 2.61 | 2.56 | 2.46 | 2.32 | 2.05 |
| In-work families with no children (receiving WTC only) | 0.41 | 0.48 | 0.54 | 0.54 | 0.51 | 0.51 | 0.51 | 0.48 | 0.4 | 0.34 | 0.28 |
| Total in -work families | 4.69 | 4.76 | 4.85 | 4.23 | 3.14 | 3.13 | 3.12 | 3.04 | 2.86 | 2.66 | 2.33 |
| Total number of families benefitting | 6.12 | 6.25 | 6.31 | 5.67 | 4.62 | 4.53 | 4.43 | 4.28 | 4.05 | 3.79 | 3.30 |
And of the total number of benefiting families, those whose entitlements were higher because of certain tax credits elements were:
Figures are in thousands
| 2008-09 | 2009-10 | 2010-11 | 2011-12 | 2012-13 | 2013-14 | 2014-15 | 2015-16 | 2016-17 | 2017-18 | 2018-19 | |
| Families for which entitlements were higher because of childcare element | 448 | 460 | 455 | 416 | 416 | 392 | 396 | 387 | 369 | 347 | 303 |
| Families for which entitlements were higher because of disabled worker element | 118 | 115 | 119 | 117 | 117 | 116 | 121 | 125 | 121 | 115 | 104 |
| Families for which entitlements were higher because of baby addition to family element (out-of-work families) | 164 | 167 | 165 | - | - | - | - | - | - | - | - |
| Families for which entitlements were higher because of baby addition to family element (in-work families) | 394 | 387 | 385 | - | - | - | - | - | - | - | - |
9. Commentary and figures
9.1 List of figures
Section 1 : Time series
Figure 1.1 Numbers of families receiving different amounts of tax credits
Figure 1.2 Annual Entitlement by type of tax credits received
Section 2: Summary Tables
Figure 2.1 Average number of recipient families, couples and single and their children
Figure 2.2 Average number of recipient families with children by family size, and annual and average entitlements
Figure 2.3 Average number of recipient families in each band of annual entitlement
Figure 2.4 Average annual entitlement by entitlement band
Section 3: Detailed figures
Figure 3.1 Eligible childcare costs allowed (per week)
Figure 3.2 Average number of in-work benefiting families in each band of income
9.2 Section 1: Time series
Section 1 provides statistics on the history of the tax credits system, between 2008-09 and 2018-19. This enables comparison across time, across different tax credits populations and describes how various parts of the system have changed over time.
Fig 1.1: Number of families receiving different amounts of tax credits
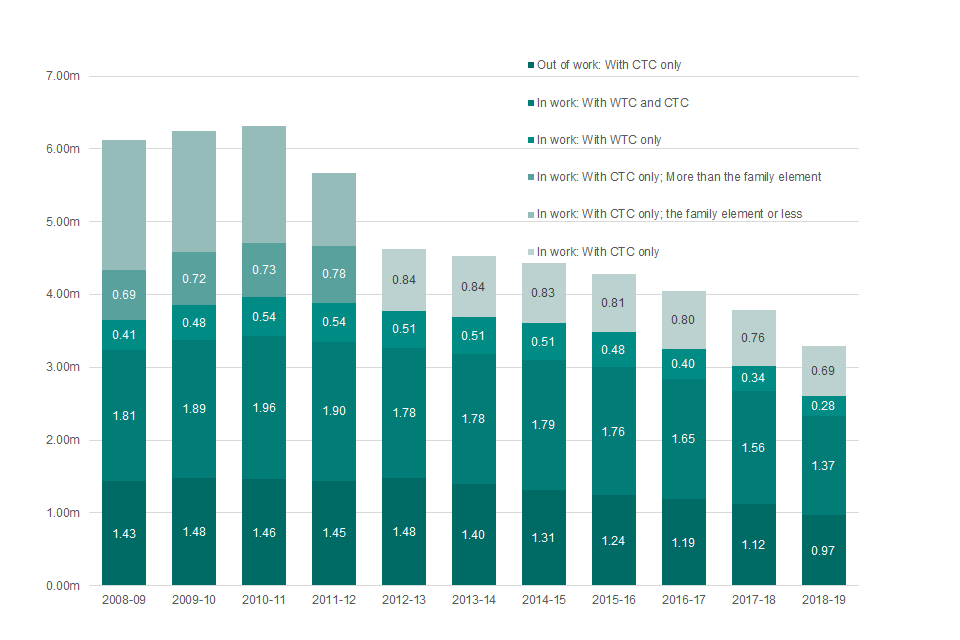
Figure 1.1 shows the total number of families claiming tax credits gradually increased and peaked in 2010-11 at 6.31 million. The total number of families claiming tax credits in subsequent years decreased as a result of policy changes announced in 2010 and the introduction of Universal Credit in 2013. The rollout of Universal Credit to all areas of the country was completed on 12th December 2018 for new claims or for people having to make a new claim due to a change of circumstance. In 2018-19, the total number of families claiming tax credits stood at 3.3 million families.
The rate of decline in the number of families receiving tax credits increased in 2018-19, largely due to the roll out of Universal Credit. From 1 January new claims for tax credits were closed except for a small number of cases [footnote 2] .
The number of in-work families claiming both Working Tax Credit (WTC) and Child Tax Credit (CTC), which are awards with a higher average entitlement, steadily increased from 2008-09 and peaked in 2010-11 at 1.96 million. Subsequent years show a fall in the number of families claiming WTC and CTC and in 2018-19 it stood at 1.37 million.
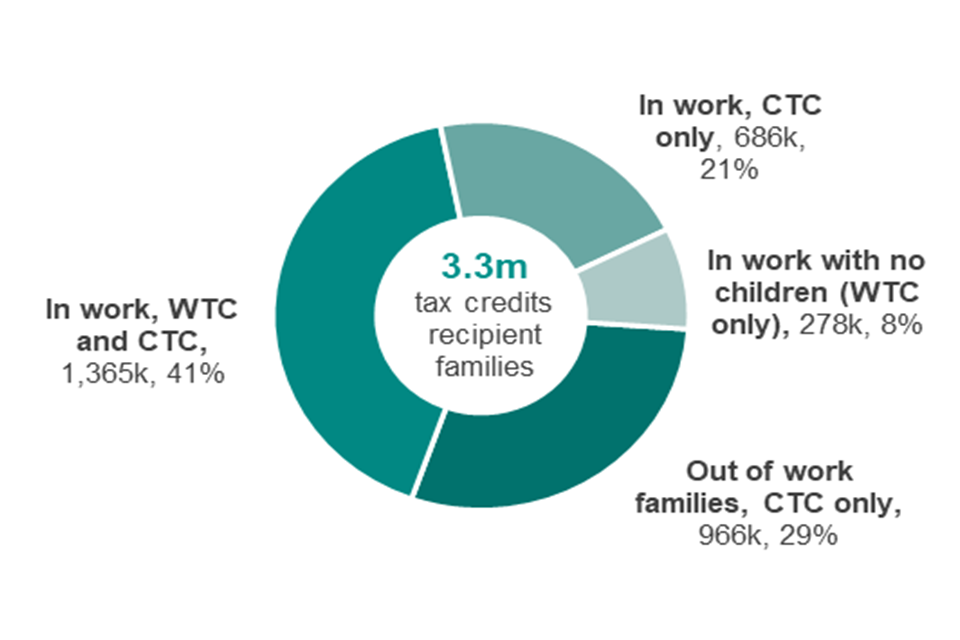
Ahead of April 2012, the family element of CTC (£545) was protected until household income reached the second income threshold. After April 2012, the removal of the second income threshold meant families previously claiming the family element of CTC were tapered at a rate of 41% for every £1 of income over the first threshold immediately after all other credits had been withdrawn. The previous categories of the CTC family element were removed and replaced by a single “CTC only” category. In 2018-19, this stood at 686,000 families.
The trend in the numbers of in-work families without children - those claiming WTC only - had increased steadily from 405,000 in 2008-09 to 540,000 in 2011-12. Since then, in-work families claiming WTC only gradually fell where it stands at 280,000 in 2018-19.
The numbers of out-of-work families claiming CTC only had shown a slow but steady decrease since 2012-13, from 1.48 million to 970,000 in 2018-19, having remained relatively
Figure 1.2: Annual entitlement by type of Tax Credit received

Figure 1.2 shows that until 2011-12 the annual entitlement to tax credits had been rising steadily, increasing from around £25.12bn in 2008-09 to £29.20bn in 2011-12. It remained relatively stable until 2015-16 where it stood at £28.37bn before falling to just over £22.66bn in 2018-19, dropping below levels not seen since 2008-09.
Out-of-work families claiming the full amount of CTC and in-work families claiming both WTC and CTC make up the largest proportion of total entitlement. From 2008-09 to 2018-19, families claiming both WTC and CTC accounted for approximately 56% (varying slightly between 55% and 57%) of the total entitlement while the entitlement of out-of-work families fluctuated slightly between 27% to 31% and stood at 29% in 2018-19.
Section 2 : Summary
Section 2 summarises the main characteristics of tax credits population in 2018-19 at the while Section 3 gives a more detailed breakdown.
Figure 2.1: Composition of families receiving different types of tax credits

Figure 2.1 shows that the majority of lone parent families with children receive either the full award of CTC (when out-of-work) or WTC and CTC (when in-work). In 2018-19, there were 151,000 in-work lone parent families claiming CTC only. The pattern for couples is less clear with the largest grouping receiving the WTC and CTC award followed by those receiving CTC only. A majority (67%) of families with no children (claiming WTC only) are single recipients.
Figure 2.2: Recipient families: proportion of families receiving each type of award

Figure 2.2 shows that 29% of families claiming tax credits are out-of-work, leaving in-work families to account for the remaining 71%. Of the in-work families, 41% claim the higher value awards (WTC and CTC), 21% claim CTC only and the remaining 8%, with no children, claim WTC only.
Figure 2.3 Number of children in families receiving tax credits
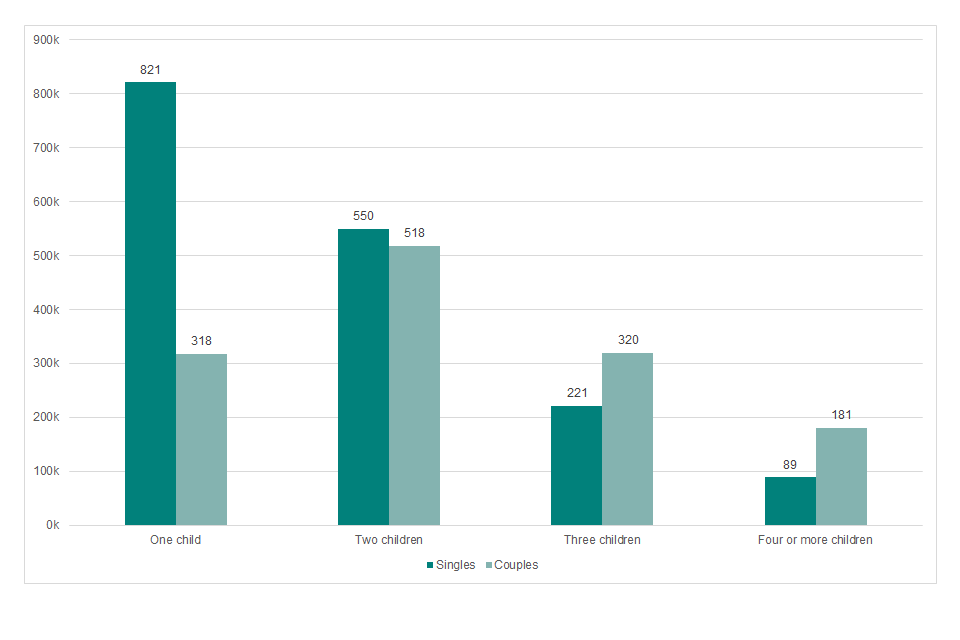
Figure 2.3 shows that the majority of families with children are made up of either one or two children with single parent families more likely to have one child than couples do. Couples are more likely to have larger family sizes. Out of approximately 270,000 families with four or more children, 67% are couples.
Figure 2.4 Average annual entitlement, by entitlement band
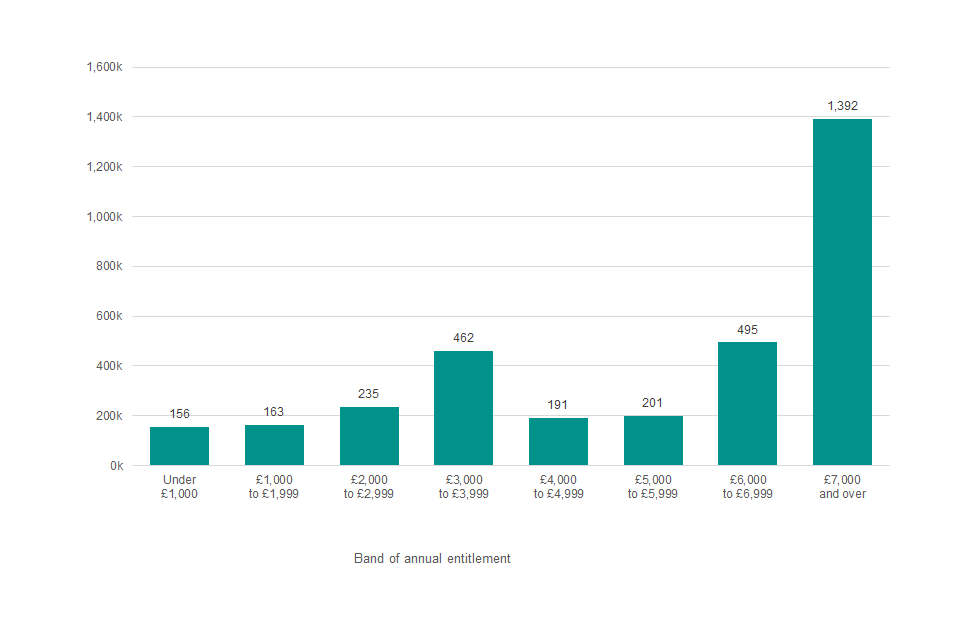
Figure 2.4 shows that the largest proportion of families’ (42%) entitlement are of the value of £7,000 and over, followed by families with an entitlement between £6,000 to £6,999 (15%).
Section 3: Detailed figures
Section 3 focuses on detailed breakdowns of the tax credits population. It reports the numbers of families entitled to specific elements within tax credits and gives more detailed information on levels of income.
Figure 3.1: Childcare costs (per week)
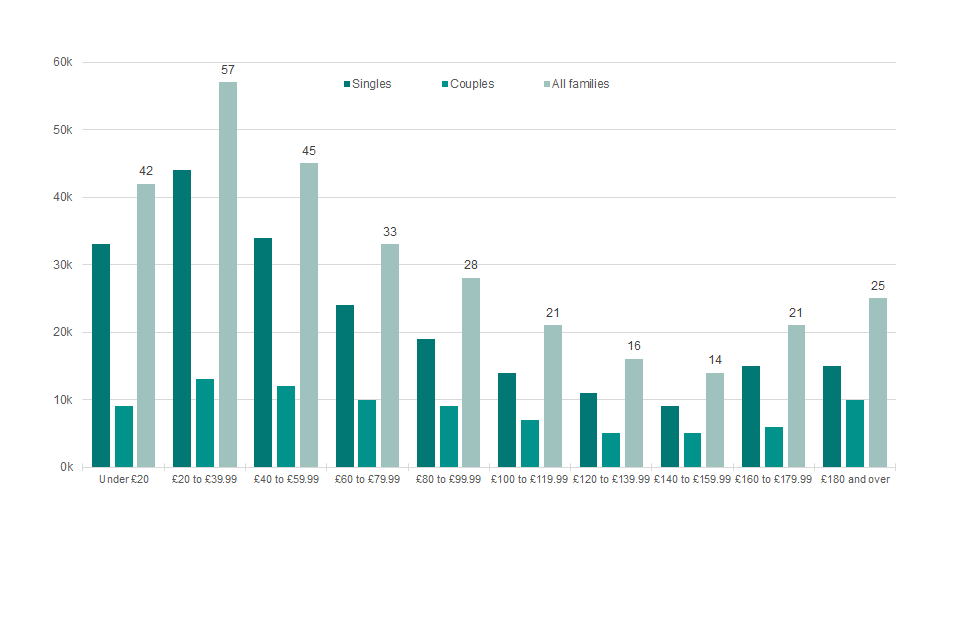
Figure 3.1 shows the average weekly support with childcare costs for single parent families, couples and across all families. The costs are broadly split across the cost bands for each of the categories, reflecting the range hours of childcare claimed. The largest category for both lone-parents and couples is £20 to £39.99, although the costs for couples are spread more evenly across the categories.
3.2 Average number of in-work benefiting families in each band of income

Figure 3.2 shows the average number of families benefitting from Tax Credit in each band of income up to £50,000. Broadly speaking, the higher the income used to taper the award, the fewer the numbers of families in receipt - reflecting the targeted approach to financial support inbuilt in the Tax Credits system.
10. Appendix A: Technical Note
10.1 Using finalised awards data
The figures for 2018-19 in the tables are mostly derived from a scan of the tax credits computer system taken in early April 2019. For each award, the scan contained a record for each sub-period of the year for which the family’s circumstances (adult partners, hours worked, number of children, childcare costs, disabilities) remained unchanged. For each such sub-period, the scan revealed the various elements for which the family qualified for the period, and the daily monetary value of the childcare element. It also revealed the values of the 2017-18 and 2018-19 incomes for each award.
For each award, and for each sub-period, the daily rate of entitlement was then modelled by summing the various element values to which the family was entitled and tapering the total away using the income data [footnote 3] . The modelled daily entitlement was then used to establish where on the plateau - taper profile the family fell for that period. A small number (under 1 per cent) of tax credits awards were not included in the scan.
For each case covered by the scan, and for each sub-period, it was possible to compare the modelled entitlement with that held on the computer system. For all but about 0.1 per cent of cases the discrepancy was at most 2p per day.
The scan did not cover out of work families who received their child support via Income Support or income-based Jobseeker’s Allowance (IS-JSA) rather than CTC. A scan of such families at August 2008 was obtained from the Department for Work and Pensions. This contained sufficient information to distinguish single parents from couples. The number and ages of the children were obtained from the Child Benefit records for these families who were still receiving their child support through IS-JSA at August 2017. The level of entitlement at August 2017 was modelled using this information, which however could not include the disabled child or severely disabled child premium. To produce annual averages to be added to the annual CTC averages, the August 2017 aggregates were scaled by a factor needed to produce a separately-estimated overall average for the year. The annualised August 2017 entitlements were also scaled to agree with the separately known total of expenditure via benefits for these families.
10.2 Interpreting annual entitlement
The calculation of the annual entitlement for an award also yields a value of the entitlement for each day of the year. This can vary within the year as the family’s circumstances vary. In addition, awards can end during the year (for example, as couples separate, or as families cease to satisfy the qualifying conditions listed above), and other awards start during the year. The tables show annual average numbers of benefiting families with particular characteristics that is, the average taken over all days in the year.
Their aggregate annual entitlement (in £ million) is the sum, taken over all days in the year, of the daily entitlements of families with these characteristics on the day. Their average annualised entitlement (in £) is 365 times the average, taken over all days in the year, of the aggregate daily entitlement of these families.
10.3 Current entitlement
There is a single claim form covering both Child and Working Tax Credits, and entitlement is calculated jointly. Awards run to the end of the tax year, and are based on the element values, thresholds, etc shown at Appendix B.
An annual award is calculated by summing the various elements to which the family is entitled. Unless the family is receiving Income Support, income-based Jobseeker’s Allowance or Pension Credit, this sum is reduced if the family’s annual income (see below) exceeds the relevant first income threshold. The reduction is 41 per cent of the excess over the threshold.
10.4 Civil Partnerships
Couples in civil partnerships can claim tax credits as couples. Such couples are included as normal in the tables showing families according to the gender of the main earner, or of the recipient of CTC.
10.5 Revisions Policy
Our policy, for all tax credit statistics, is that once the publication has been published, there will be no revisions of the data. In exceptional circumstances where further work identifies errors in the publication then a revision will be made, with an accompanying explanation on the HMRC website.
11. Appendix B:Annual entitlement (£) by tax credit elements and thresholds:
| 2008-09 | 2009-10 | 2010-11 | 2011-12 | 2012-13 | 2013-14 | 2014-15 | 2015-16 | 2016-17 | 2017-18 | 2018-19 | ||
|---|---|---|---|---|---|---|---|---|---|---|---|---|
| Child Tax Credit | ||||||||||||
| Family element | 545 | 545 | 545 | 545 | 545 | 545 | 545 | 545 | 545 | 545 | 545 | 545 |
| Family element, baby addition [footnote 4] | 545 | 545 | 545 | - | - | - | - | - | - | - | - | - |
| Child element [footnote 5] | 2,085 | 2,235 | 2,300 | 2,555 | 2,690 | 2,720 | 2,750 | 2,780 | 2,780 | 2,780 | 2,780 | |
| Disabled child additional element [footnote 6] | 2,540 | 2,670 | 2,715 | 2,800 | 2,950 | 3,015 | 3,100 | 3,140 | 3,140 | 3,175 | 3,275 | 3,275 |
| Severely disabled child element [footnote 7] | 1,020 | 1,075 | 1,095 | 1,130 | 1,190 | 1,220 | 1,255 | 1,275 | 1,275 | 1,290 | 1,325 | 1,325 |
| Working Tax Credit | ||||||||||||
| Basic element | 1,800 | 1,890 | 1,920 | 1,920 | 1,920 | 1,920 | 1,940 | 1,960 | 1,960 | 1,960 | 1,960 | 1,960 |
| Couples and lone parent element | 1,770 | 1,860 | 1,890 | 1,950 | 1,950 | 1,970 | 1,990 | 2,010 | 2,010 | 2,010 | 2,010 | 2,010 |
| 30 hour element | 735 | 775 | 790 | 790 | 790 | 790 | 800 | 810 | 810 | 810 | 810 | 810 |
| Disabled worker element | 2,405 | 2,530 | 2,570 | 2,650 | 2,790 | 2,855 | 2,935 | 2,970 | 2,970 | 3,000 | 3,090 | 3,090 |
| Severely disabled adult element | 1,020 | 1,075 | 1,095 | 1,130 | 1,190 | 1,220 | 1,255 | 1,275 | 1,275 | 1,290 | 1,330 | 1,330 |
| 50+ return to work payment:16 but less than 30 hours per week [footnote 8] | 1,235 | 1,300 | 1,320 | 1,365 | - | - | - | - | - | - | - | - |
| 50+ return to work payment: at least 30 hours per week [footnote 8] | 1,840 | 1,935 | 1,965 | 2,030 | - | - | - | - | - | - | - | - |
| Childcare element: Maximum eligible costs allowed (£ per week) | ||||||||||||
| Eligible costs incurred for 1 child | 175 | 175 | 175 | 175 | 175 | 175 | 175 | 175 | 175 | 175 | 175 | 175 |
| Eligible costs incurred for 2+ children | 300 | 300 | 300 | 300 | 300 | 300 | 300 | 300 | 300 | 300 | 300 | 300 |
| Percentage of eligible costs covered | 80% | 80% | 80% | 70% | 70% | 70% | 70% | 70% | 70% | 70% | 70% | 70% |
| Common features | ||||||||||||
| First income threshold [footnote 9] | 6,420 | 6,420 | 6,420 | 6,420 | 6,420 | 6,420 | 6,420 | 6,420 | 6,420 | 6,420 | 6,420 | 6,420 |
| First withdrawal rate | 39% | 39% | 39% | 41% | 41% | 41% | 41% | 41% | 41% | 41% | 41% | 41% |
| Second income threshold [footnote 10] | 50,000 | 50,000 | 50,000 | 40,000 | - | - | - | - | - | - | - | - |
| Second withdrawal rate | 1 in 15 | 1 in 15 | 1 in 15 | 41% | - | - | - | - | - | - | - | - |
| First income threshold for those entitled to Child Tax Credit only [footnote 11] | 15,575 | 16,040 | 16,190 | 15,860 | 15,860 | 15,910 | 16,010 | 16,105 | 16,105 | 16,105 | 16,105 | 16,105 |
| Income increase disregard [footnote 12] | 25,000 | 25,000 | 25,000 | 10,000 | 10,000 | 5,000 | 5,000 | 5,000 | 2,500 | 2,500 | 2,500 | 2,500 |
| Income fall disregard [footnote 12] | - | - | - | - | 2,500 | 2,500 | 2,500 | 2,500 | 2,500 | 2,500 | 2,500 | 2,500 |
| Minimum award payable | 26 | 26 | 26 | 26 | 26 | 26 | 26 | 26 | 26 | 26 | 26 | 26 |
-
Figures are taken from excel worksheet (main aggregates tab). Figures are rounded separately, which can lead to the components as shown not summing to the total. ↩
-
New claims for tax credits are restricted to families in receipt of the severe disability premium or received it in the last month. ↩
-
In accordance with the tax credits system, the income used to taper the award was the 2018-19 income, if that was lower than £2,500 above the 2017-18 income then 2017-18 income will be lowered by £2,500; if the 2018-19 income was less than the 2017-18 income by more than £2,500 then the 2017-18 will be enhanced by £2,500. ↩
-
Payable to families for any period during which they have one or more children aged under 1. Abolished 6 April 2011. ↩
-
Payable for each child up to 31 August after their 16th birthday, and for each young person for any period in which they are aged under 20 (under 19 to 2005-06) and in full-time non-advanced education, or under 19 and in their first 20 weeks of registration with the Careers service or Connexions. ↩
-
Payable in addition to the child element for each disabled child. ↩
-
Payable in addition to the disabled child element for each severely disabled child. ↩
-
Payable for any period during which normal hours worked (for a couple, summed over the two partners) is at least 30 per week. ↩ ↩2
-
Payable for each qualifying adult for the first 12 months following a return to work. Abolished 6 April 2012. ↩
-
Income is net of pension contributions, and excludes Child Benefit, Housing benefit, Council tax benefit, maintenance and the first £300 of family income other than from work or benefits. The award is reduced by the excess of income over the first threshold, multiplied by the first withdrawal rate. ↩
-
Those also receiving Income Support, income-based Jobseeker’s Allowance or Pension Credit are passported to maximum CTC with no tapering. ↩
-
Introduced from 6 April 2012, this drop in income is disregarded in the calculation of Tax Credit awards. ↩ ↩2