Cancer registration statistics, England: final release, 2018
Published 29 May 2020

© Crown copyright 2020
This publication is licensed under the terms of the Open Government Licence v3.0 except where otherwise stated. To view this licence, visit nationalarchives.gov.uk/doc/open-government-licence/version/3 or write to the Information Policy Team, The National Archives, Kew, London TW9 4DU, or email: psi@nationalarchives.gov.uk.
Where we have identified any third party copyright information you will need to obtain permission from the copyright holders concerned.
This publication is available at https://www.gov.uk/government/statistics/cancer-registration-statistics-england-2018-final-release/cancer-registration-statistics-england-final-release-2018
1. Main points
The number of new malignant cancer diagnoses in England continued to increase from 309,453 new cases in 2017 to 320,395 new cases in 2018, excluding non-melanoma skin cancers (NMSC). This means, that on average, 878 cancers were diagnosed each day in 2018.
There were more cancers diagnosed in men (167,281) than women (153,114).
Due to the ‘Fry and Turnbull effect’, prostate cancer was the most commonly diagnosed cancer in 2018, with 49,810 new diagnoses, which is 7,985 more registrations than in 2017.
The majority (98%) of cancer registrations were registered in 24 sites of the body. Prostate, breast, lung and colorectal cancers account for more than 50% of all new malignant diagnoses.
The North East had the highest rate of cancer incidence at 653 cases per 100,000 people, while London had the lowest rate at 583 cases per 100,000 people.
For the 9 cancers selected to be presented in this bulletin, the proportion diagnosed at stages 1 and 2 ranged from 22% of pancreas cancer in men to 91% of melanoma of skin in women.
2. Cancer registration statistics
2.1 Cancer diagnoses continue to increase
In 2018, there was a continued increase in the number of malignant cancer diagnoses in England, from 309,453 new cases in 2017 (as at April 2020) to 320,395 new cancer diagnoses in 2018, excluding NMSC.
Unless otherwise stated, the numbers and rates presented in this bulletin for “all cancers” refer to malignant cancers, excluding NMSC (see Section 4.3 for more detail).
As in previous years, more cancers were diagnosed in males (167,281) than females (153,114).
The majority (98%) of newly diagnosed cancers were registered in 24 sites of the body. Just over half (54%) of all registrations were breast, prostate, lung or colorectal cancer.
Figure 1 shows the number of cases diagnosed by the 24 common cancer sites. More detailed breakdowns by cancer sites and age are available in the data tables.
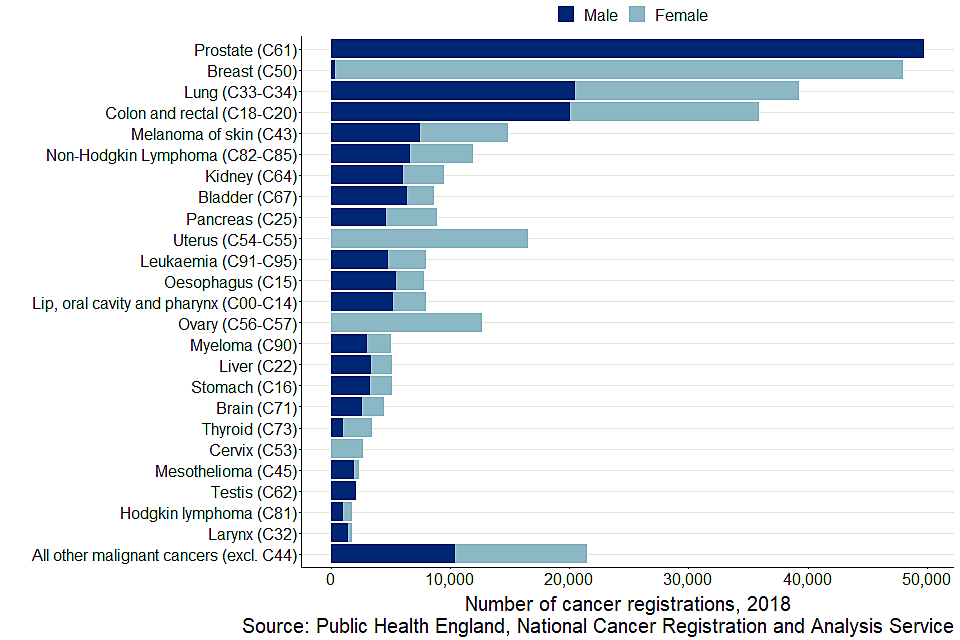
Figure 1: Number of cancer registrations by 24 common sites and sex, England 2018
Notes:
-
The International Classification of Diseases 10th Revision (ICD-10) was used to classify cancer sites. Non-melanoma skin cancers (ICD-10 C44) were excluded.
-
All ages combined.
Prostate cancer was the most commonly diagnosed cancer in 2018 (49,810). This was 7,985 more registrations than that made in 2017. This is the first year that prostate cancer surpassed breast cancer as the most commonly diagnosed cancer (Figure 1). This is due to the Fry and Turnbull effect, which raised awareness about symptoms of prostate cancer.
In 2018, there were 1,786 more registrations of female breast cancer than in 2017.
The difference between males and females in the number of all malignant cancers diagnosed increased from 7,905 cases in 2017 to 14,168 cases in 2018.
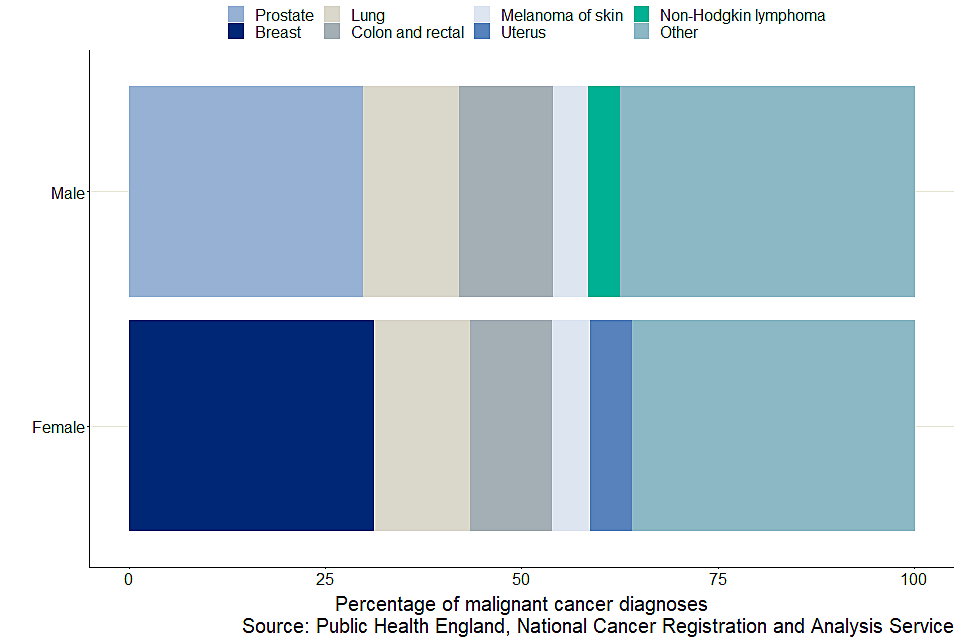
Figure 2: Most common cancers diagnosed by sex, England, 2018
Notes:
-
Non-Hodgkin lymphoma for females and breast cancer for males are not in the 5 most common cancers by sex. As such they are included within all other cancers.
-
All ages combined.
The 5 most commonly diagnosed cancers for males and females account for the majority of all cancers diagnosed for males (62%) and females (64%) (Figure 2).
For males, prostate cancer continues to be the most commonly diagnosed cancer, accounting for 30% of all male cancer diagnoses. For females, breast cancer continues to be the most commonly diagnosed cancer, accounting for 31% of all female cancer diagnoses.
Lung and colorectal cancers, and melanoma of skin are common cancers for both males and females. Cancer of the uterus is also a common cancer in females, with 8,255 diagnoses, while non-Hodgkin lymphoma is a common cancer in males, with 6,627 diagnoses.
2.2 The 3 most common cancers vary by sex and age group
In 2018, the 3 most common cancers diagnosed in England varied by sex and age group.
In children aged 0 to 14 years, the most commonly diagnosed cancers were leukaemia and brain cancer (in males and females), non-Hodgkin lymphoma (males only) and kidney cancer (females only). In males, these 3 cancers accounted for 61% of all cancers registered in children 0 to 14 years; and in females, their respective top 3 cancers accounted for 55% of all cancers registered (Figures 3 and 4).
Prostate cancer was the most commonly diagnosed cancer in adult males aged 45 years and over, while for adult males aged 15 to 44 years, testicular cancer was the most commonly diagnosed (Figure 3).
Breast cancer was the most commonly diagnosed cancer in all adult females (aged 15 years and over), accounting for 50% of cases diagnosed in those aged 45 to 54 years, and gradually decreasing to 22% of cases in those aged 75 years and over (Figure 4).
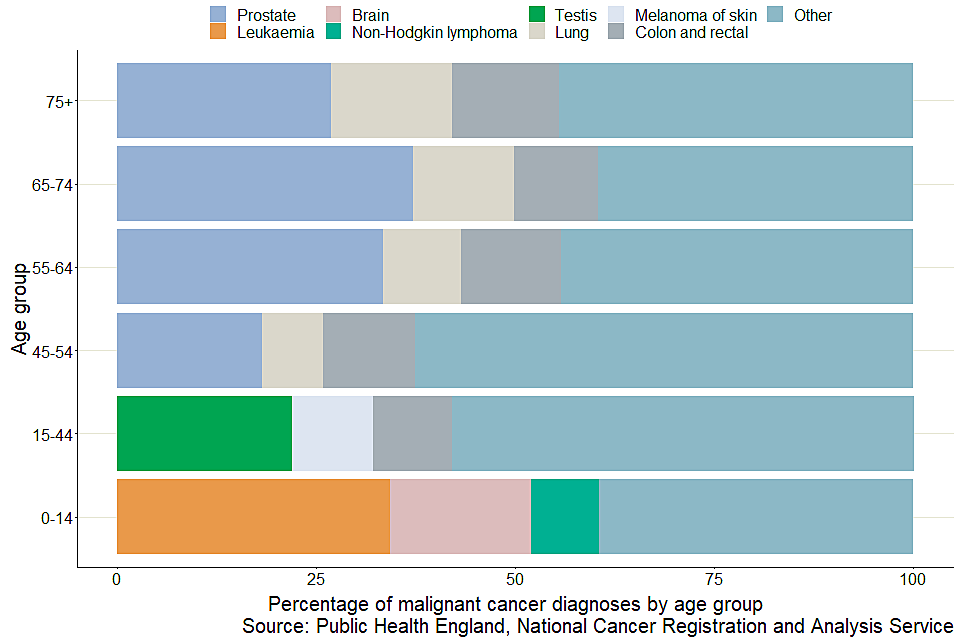
Figure 3: Three most common cancers for males, by age group, England, 2018

Figure 4: Three most common cancers for females by age group, England, 2018
2.3 Age-specific rates increased with age
In 2018, the rates of cancer incidence generally increased with age for both males and females (Figure 5).
The age-specific rate of cancer was higher in females aged between 25 and 54 years than in males of the same ages. Between these ages, the age-specific rate of cancer incidence in females is about double the rate of males (Figure 5).
However, from age 55 onwards, the age-specific cancer incidence in males surpassed that in females; for those aged 70 years and over, the rates in males were between 1.5 and 1.7 times higher than in females.
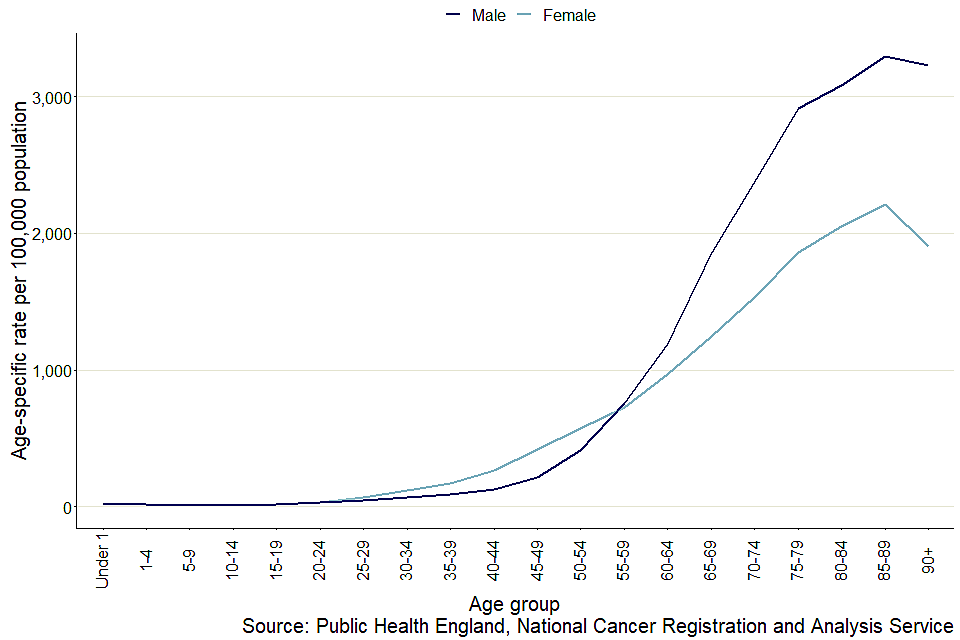
Figure 5: Age-specific cancer incidence rate, by sex, England, 2018
Notes:
- All age-specific rates of cancer incidence refer to all malignant cancers, excluding NMSC.
2.4 Age-standardised incidence rates varied by sex over the decade
Over the last decade, the age-standardised cancer incidence rate for females has increased from 531 per 100,000 people in 2009 to 545 per 100,000 people in 2018. The cancers that drove this increase were breast cancer, which had an increase in rate of 9 per 100,000 people, followed by lung cancer and melanoma of skin, both with an increase in rate of 6 per 100,000 people. In contrast, for males, the age-standardised cancer incidence rates were very similar with 688 per 100,000 people in 2009 and 687 per 100,000 people in 2018.
For both males and females, the age-standardised cancer incidence rates decreased from their peaks in 2013 (709 per 100,000 people and 556 per 100,000 people, respectively) to 2017, from where both sexes then saw increases in their rates in 2018. For females, the increase was small, while for males, the increase was larger (Figure 6).

Figure 6: Age-standardised incidence rates, by sex, England, 2009 to 2018
Notes:
-
All age-standardised rates of cancer incidence across time refer to all malignant cancers, excluding NMSC.
-
All ages combined.
2.5 North East had the highest rate of cancer incidence while London had the lowest
In 2018, for all cancers diagnosed, there was geographical variation in the age-sex-standardised rate of cancer incidence across England.
The North East had the highest age-sex standardised rate of cancer incidence at 653 per 100,000 people, while London had the lowest rate at 583 per 100,000 people.
In 2018, the age-sex-standardised incidence rates also varied across regions by cancer site. Specific examples of cancer sites where the age-sex-standardised rates varied across England include:
- lung cancer, with the highest rate seen in the North East at 101 per 100,000 people compared with the lowest in the South West at 64 per 100,000 people
- melanoma of skin, with the highest rate seen in the North East at 37 per 100,000 people compared with the lowest in London at 18 per 100,000 people
- colorectal cancer, with the highest rate seen in the North East and North West, with both at 74 cases per 100,000 people compared with the lowest in London at 62 cases per 100,000 people
- oesophagus cancer, with the highest rate seen in the North West, East Midlands and West Midlands, all at 18 per 100,000 people, compared with the lowest in London at 11 per 100,000 people
- stomach cancer, with the highest rate seen in the North East at 13 per 100,000 people compared with the lowest in the South East at 8 per 100,000 people
- cervix cancer, with the highest rate seen in the North West and East Midlands, both at 12 per 100,000 people compared with the lowest in London at 7 per 100,000 people
- prostate cancer, with the highest rate seen in the South East at 228 per 100,000 people compared with the lowest in the North West, at 171 per 100,000 people
2.6 Stage at diagnosis varied for the 5 most commonly diagnosed cancers in men and women
Stage at diagnosis of cancer is an important factor that affects cancer outcomes. Earlier diagnosis, that is, usually when cancers are diagnosed at stages 1 and 2 as opposed to stages 3 and 4, is associated with better prognosis on average.
For the first time, this bulletin is including a summary of stage at diagnosis for 9 common cancers, 5 of which were identified as the most commonly diagnosed cancers in men and women (see Section 2.1). The cancers included are:
- bladder
- breast
- colon and rectal
- lung
- pancreas
- prostate
- melanoma of skin
- non-Hodgkin lymphoma
- uterus
The 9 cancers presented here are a snapshot summary of patients diagnosed in 2018. Please send any feedback on the usefulness of this inclusion to ncrasenquiries@phe.gov.uk. The Case-mix adjusted percentage of cancers diagnosed at stages 1 and 2 by CCG in England contains information on stage at diagnosis for 21 cancers sites for individuals diagnosed from 2013 to 2018.
It is also important to note that not all cancers have a staging system, for example, brain cancer does not currently have a staging system.
Figure 7 shows the percentage of cancer registration diagnosis at stages 1 and 2, and stages 3 and 4, for males and females.
Of the 9 cancers examined, the percentage diagnosed at stages 1 and 2 varied by site and sex. This ranged from 22% of pancreas cancer diagnosed at stages 1 and 2 in men to 91% of melanoma of skin diagnosed at stages 1 and 2 in women (Figure 7). These percentages are of cancers with complete staging data, which was between 80% to 90% of the cases registered.

Figure 7: Percentage of cancers diagnosed, by stage and sex, England, 2018
Notes:
-
Cancers that were ‘Unstageable’ and ‘Missing’ were excluded from the cancer cases presented. ‘Unstageable’ are cancers that do not currently have a staging system and ‘Missing’ are cases where there was not enough information to complete staging. For a complete breakdown of all stages (stages 1 and 2, stages 3 and 4, Unstageable and Missing), see the data tables.
-
All ages combined.
In 2018, of the cases where stage data were complete, melanoma of skin had the highest percentage diagnosed at stages 1 and 2 for both male (87%) and female (91%). Female breast cancer also had a high proportion of cases diagnosed at stages 1 and 2, at 86%.
A greater percentage of uterus cancer was diagnosed at stages 1 and 2 (81%) compared with only 55% of prostate cancer diagnosed at stages 1 and 2 (Figure 7).
Pancreas cancer had the lowest percentage diagnosed at stages 1 and 2 for both male (22%) and female (23%). Other cancers that also had small percentages of cases diagnosed at stages 1 and 2 were lung cancer and non-Hodgkin lymphoma, although these percentages varied by sex:
-
for lung cancer, 26% of cases in males were diagnosed at stages 1 and 2 compared with 32% of cases in females
-
for non-Hodgkin lymphoma, 29% of cases in males were diagnosed at stages 1 and 2 compared with 32% of cases in females
For colon and rectal cancer, both males and females had 44% of cases diagnosed at stages 1 and 2 (Figure 7).
3. Things you need to know about this release
3.1 What’s included in this bulletin
The counts and rates of cancer registration are designated as National Statistics. National Statistics are a subset of Official Statistics, which have been certified by the UK Statistics Authority as compliant with its code of practice for statistics.
This bulletin reports on newly-diagnosed malignant primary neoplasms (cancer tumours) registered in the 2018 calendar year and does not include secondary tumours. Counts and rates are presented for England and the 9 Government Office Regions, as well as by sex and age groups from under 1 to 90 years and older.
Cancer registrations in England can take up to 5 years after the end of a given calendar year to reach 100% completeness, due to the continuing accrual of late registrations. Further changes may still occur after 5 years following later diagnostic testing. However, these late changes are uncommon.
Also, note that the numbers and figures published in this bulletin differ from the data published in the January 2020 preliminary release of the cancer incidences. This is because the January 2020 release was based on provisional data, while the data used in this bulletin is final for 2018, as at April 2020.
For this release, refreshed data for 2014 to 2017 were processed and a time series going back to 1995 is also included in the data tables. Few changes or additional diagnoses are added before the most recent 5 years of data, so refreshes were done on the last 5 years only.
Care should be taken when making comparisons between the historic and latest available data.
It is also important to note the following about the cancer registrations included in this bulletin:
- only malignant neoplasms (cancers as described by the World Health Organization (WHO) International Classification of Diseases: ICD-10 codes C00 to C97, excluding C44) have been included in this bulletin. However, the data tables contain in-situ neoplasms, benign neoplasms and neoplasms of uncertain or unknown behaviour for completeness
- incidence cases of cancer are counted for each separate primary tumour; one person may be diagnosed with more than one primary tumour and would then appear twice in the incidence statistics; the progressions or recurrence of previous cancer are not counted as new incidence cases
- unless stated otherwise, analysis in this bulletin excludes cancer registrations of non-melanoma skin cancers (NMSC) (see Section 4.3 for more detail)
3.2 What’s changed in this release
This bulletin includes a cross-sectional summary of stage at diagnosis for 9 common cancers (bladder, breast, colon and rectal, non-Hodgkin lymphoma, lung, melanoma, pancreas, prostate and uterus). Feedback on the usefulness of the inclusion of stage at diagnosis is welcome, please send all comments to ncrasenquiries@phe.gov.uk. The Case-mix adjusted percentage of cancers diagnosed at stages 1 and 2 by CCG in England contains information on stage at diagnosis for 21 cancer sites for individuals diagnosed from 2013 to 2018.
The data tables that accompany this bulletin now also include confidence intervals for all age-specific, non-standardised and age-standardised rates, as a measure of uncertainty.
Due to the ongoing effects of COVID-19, the 2018 mortality counts and rates for cancer in England are unable to be included in this release. The mortality section will be supplemented once cancer mortality data can be accessed.
3.3 Reported measures
Cancer incidence rate (age-specific and non-standardised)
The non-standardised cancer incidence rate is the number of new cancer registrations in a specific population during a particular time period per 100,000 people. It is calculated using the following equation:
(total number of cancer registrations)/(total population) x 100,000
This release also includes age-specific cancer incidence rates; and incidence rates for International Classification for Diseases (ICD-10) codes C00 to C97 and D00 to D48 (excluding D04, D10 to D31, D34 to D35.1, and D35.5 to D36). These can all be found in the data tables.
Age-standardised cancer incidence rate
Age-standardised cancer incidence rate is a weighted average of the age-specific cancer incidence rates, where the weights used age-specific proportions of a standardised population European Standard Population 2013 (ESP). Standardising cancer incidence rates with the ESP accounts for the differing age structure of different populations. This means that geographical and time comparisons of the rates can be made.
Age-sex-standardised rates have been used to standardise the population for an even sex split in addition to using the ESP structure.
4. Cancer registration data, quality and methodology
4.1 Data collection
Cancer registration is the systematic collection of data about cancer and tumour diseases. In England, this data collection is managed by the National Disease Registration Service (NDRS) in Public Health England (PHE). Every year, the NDRS collects information on over 300,000 cases of cancer, including patient details, as well as detailed data about the type of cancer, how advanced it is and the treatment the patient receives.
Data are submitted to the NDRS from a range of healthcare providers and other services (for example, histopathology and haematology services, radiotherapy departments, screening services and general practitioners). The National Cancer Registration and Analysis Service (NCRAS), which is a part of NDRS, then uses these multiple sources to build a comprehensive picture of cancer incidence in England, as well as other detailed analysis and interpretations covering the entire cancer pathway on all patients in England. For more information, please see the Data Resource Profile for NCRAS.
The quality and accuracy of the data are validated and processed to ensure that they are consistent and to a high standard. Once all the expected records for any one incidence year have been received and validated, NCRAS takes a snapshot of the dataset, which provides a single, consistent source of cancer registrations. Cancer incidence for 2018 was created from a snapshot taken in April 2020, for the period January to December 2018. The snapshot will vary year on year due to the dynamic nature of registration data:
- new cancer cases will be registered which can include new ‘late’ registrations after cancer incidence has been published for that year
- cancer records can be amended, for example, site code of a record can be modified when more accurate information becomes available
- cancer records can be cancelled (although this is uncommon)
4.2 Historic data
The gap between the diagnosis counts that were first published for a registration year and the most recent cancer incidence figures has varied considerably over time. Over the 44-year period reported, differences between what has previously been published and the current number of registrations (refreshed in 2019) for each year average less than 5%.
4.3 Data quality and methodology
The figures for numbers and rates of ‘all cancer’ in this release refer to all malignant neoplasms which include International Classification of Diseases: ICD-10 codes of C00 to C97, excluding non-melanoma skin cancer (ICD-10 C44).
Although NMSC is very common, the available figures are known to be underestimates and unreliable for comparison purposes. This is because previously there has been variation in the policies and practices for recording it. However, for completeness, rates and counts of NMSC have been included in the data tables.
Some numbers and figures published in this bulletin will differ to the data published in the January 2020 preliminary release of cancer incidence. This is because the January 2020 release was based on provisional data.
In the finalisation process for the 2018 diagnosis year, the following significant changes have been made:
-
Late registrations (increase in volume) or revisions (change of cancer site) of declared malignant neoplasms (excluding NMSC). These were proportionally spread across most tumour types, with the largest changes occurring in the most common cancers.
-
The addition of late registrations of NMSC, in situ cervix and urinary tumours and urinary tumours of uncertain behaviour.
These changes may have occurred due to a technical error in processing the data. This has now been corrected with appropriate checks added to the registration database.
Any regional differences in benign, uncertain and unknown neoplasms should be interpreted with caution. There is known historical variation in the way these tumours were recorded across the country.
The last 5 years of cancer registrations are more likely to be subject to change as data are refreshed in future releases. As most changes will occur within the latest 5 years, any commentary based on the last few years is less reliable. Commentaries relating to less than the last 5 years are meant as current observations of the data and should not be taken as long-term estimates on cancer trends.
The Cancer registration statistics Quality and Methodology Information report contains important information on:
- the strengths and limitations of the data and how it compares with related data
- uses and users of the data
- how the output was created
- the quality of the output including the accuracy of the data
5. Policy context
Users of cancer registration statistics include government organisations, health policy-makers, cancer charities, academics and researchers, cancer registries, the general public and the media.
Cancer registration statistics are used to:
- measure the occurrence of cancer within the population of England; used alongside cancer prevalence, mortality and survival, policy-makers can determine the overall burden of cancer, which can inform cancer policies and programmes
- inform cancer research
- feed into cancer information such as leaflets, web pages and campaigns to raise cancer awareness
- produce National Statistics on cancer survival (in conjunction with mortality data), which is used to support policy on prevention and treatment; as well as to monitor a number of cancer performance indicators
- brief government ministers and respond to parliamentary questions
- provide bespoke, aggregated tables in response to customer enquiries
6. Links to related statistics
Other statistics related to cancer are available:
The Case-mix adjusted percentage of cancers diagnosed at stages 1 and 2 by CCG in England contains information on stage at diagnosis for 21 cancer sites for individuals diagnosed from 2013 to 2018.
The Cancer survival in England Statistical bulletins provide estimates of adult cancer survival for common cancer types. Survival by stage at diagnosis is estimated where possible. This publication also provides cancer survival estimates for children diagnosed with cancer. All output is for England only, with no regional reporting.
The Geographic patterns of cancer survival in England bulletin provides estimates of adult cancer survival for common cancer types, by the regional geographies of Cancer Alliances (CAs) and Sustainability and Transformation Partnerships (STPs)
The Index of cancer survival for Clinical Commissioning Groups (CCGs) in England bulletin presents cancer survival for CCGs, CAs, STPs and England. Separate estimates for breast, colorectal and lung cancers are published.
Cancer incidence statistics across the UK can be accessed from the following individual cancer registries:
Welsh Cancer Intelligence Surveillance Unit wcu.stats@wales.nhs.uk
PHScotland nss.isdcancerstats@nhs.net
Northern Ireland Cancer Registry nicr@qub.ac.uk
PHE, the Office for National Statistics and these other cancer registries (including the National Cancer Registry Ireland, along with specialist registries and cancer charities) are members of the UK and Ireland Association of Cancer Registries (UKIACR), which aims to promote and develop cancer registration in England, Wales, Scotland, the Republic of Ireland and Northern Ireland.
The UKIACR specifically provides a:
- focus for national initiatives in cancer registration
- coherent voice for representation of cancer registries in the UK and Ireland
- channel for liaison between registries and for agreeing policy on matters connected with cancer registration
- framework to facilitate the operation of special-interest groups and regional registries
- means of stimulating the development of cancer registration, information procedures and practices, and research based on cancer registry data
UK-wide statistics on cancer incidence can also be accessed through Cancer Research UK.
7. Authors
Responsible statistician: Dian Xu
Production team: Dian Xu; John Broggio; Sophie Finnigan; Marta Emmett; Bhavisha Hirani; Roger Hill; and Kwok Wong.
For queries relating to this bulletin, contact ncrasenquiries@phe.gov.uk
8. Acknowledgements
This work uses data that has been provided by patients and collected by the NHS as part of their care and support. The data is collated, maintained and quality assured by the NCRAS, which is part of PHE.