Geographical patterns of cancer survival in England: adults diagnosed 2013 to 2017 and followed up to 2018
Published 25 March 2020

© Crown copyright 2020
This publication is licensed under the terms of the Open Government Licence v3.0 except where otherwise stated. To view this licence, visit nationalarchives.gov.uk/doc/open-government-licence/version/3 or write to the Information Policy Team, The National Archives, Kew, London TW9 4DU, or email: psi@nationalarchives.gov.uk.
Where we have identified any third party copyright information you will need to obtain permission from the copyright holders concerned.
This publication is available at https://www.gov.uk/government/statistics/geographic-patterns-of-cancer-survival-in-england-adults-diagnosed-2013-to-2017-and-followed-up-to-2018/geographical-patterns-of-cancer-survival-in-england-adults-diagnosed-2013-to-2017-and-followed-up-to-2018
1. Main points
-
In England as a whole, 1-year survival improved between 2006 to 2010 and 2013 to 2017 for both men and women, except for bladder cancer.
-
For Cancer Alliances (CAs), the difference between the minimum and maximum 1-year survival estimates varies from 1.3 percentage points for melanoma cancer (persons) to 11.0 percentage points for stomach cancer (persons).
-
The difference between the minimum and maximum 1-year survival estimates for Sustainability and Transformation Partnerships (STPs) varies from 2.4 percentage points for breast (women) and prostate (men) cancers to 17.6 percentage points for cervical cancer (women).
2. Geographical patterns of cancer survival
2.1 England
The estimates for England are the same as the estimates published in the cancer survival in England bulletin. The cancer survival in England publication provides 1-year and 5-year survival estimates for adults diagnosed with one of 29 common cancers in England.
This sub-national survival bulletin includes trend analysis to assess geographical improvements over time. Trends in cancer survival are estimated as the change in net survival over 8, 5-year aggregated diagnosis periods between 2006 to 2010 and 2013 to 2017.
In England, 1-year survival improved between 2006 to 2010 and 2013 to 2017 for all cancers and both sexes except for bladder cancer. The largest improvement was 1.4% on average per year for lung cancer in women. There was a small reduction in 1-year bladder cancer survival in both men (0.2%) and women (0.3%), this continues the observed decreasing trend noted in the previous publication.
A possible reason for this decrease is that during some of the periods under observation, there have been worldwide shortages of the therapeutic treatment Bacille Calmette-Guérin (BCG) used to treat higher risk bladder cancer patients diagnosed at an early stage of disease progression. About 1 in 5 of all bladder cancer patients may benefit from the use of this vaccine. This may explain the contrast between the decreasing trend for 1-year bladder cancer survival and improvements in cancer sites other than bladder.
For 5-year survival estimates, there was an average increase in net survival over the period between 2006 to 2010 and 2013 to 2017 in all cancer sites reported in this bulletin, except for the following sites:
- bladder cancer (men, women and persons)
- colon cancer (men, women and persons)
2.2 Cancer Alliances show significant improvements in cancer survival
Survival estimates for 1- and 5-years have been calculated for all 20 CAs. Cancer sites are included if 1-year age-standardised survival estimates are available for at least 75% of Alliances for either men or women; estimates for persons are presented if estimates are presented for both men and women.
Figure 1 shows the minimum and maximum 1-year net survival estimates for each cancer site and CA, including the national estimate for England. Across CAs, the range of 1-year survival estimates varies from 1.3 percentage points for melanoma to 11.6 percentage points for anus cancer.
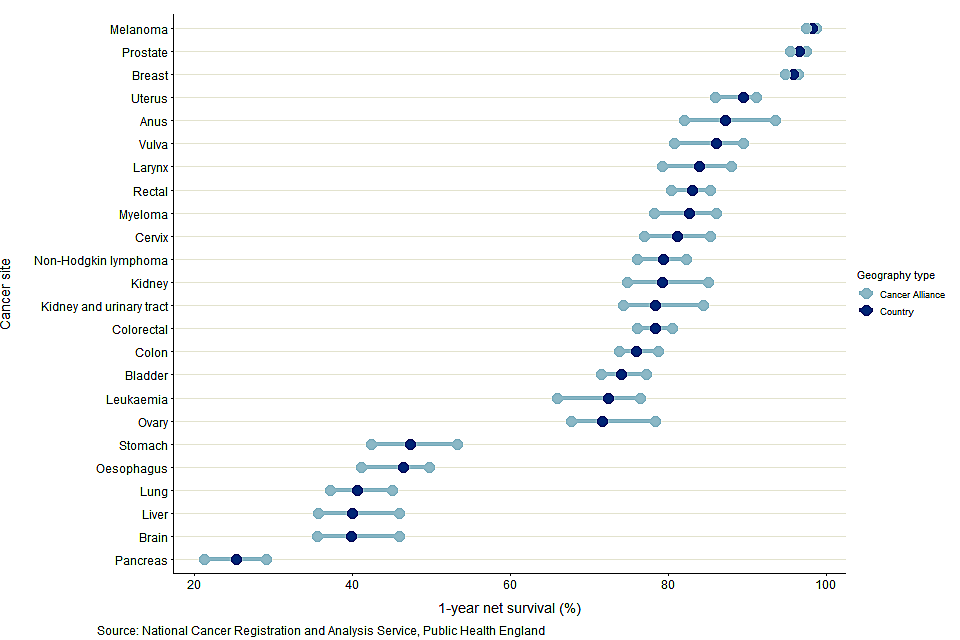
Figure 1: age-standardised 1-year net cancer survival (%) for adults diagnosed in the period 2013 to 2017 and followed up to 2018, and the range of survival estimates for Cancer Alliances: England, by cancer site.
Notes:
- Survival estimates were age-standardised using a standard set of age-specific weights.
-
Survival estimates presented are for all persons except for:
a) sex-specific cancers (cervix, ovary, uterus and vulva for women and prostate for men)
b) larynx and liver cancers are presented only for men because robust estimates were not obtained for 75% of CAs for women
c) anus and breast cancers are presented only for women because robust estimates were not obtained for 75% of CAs for men - The International Classification of Diseases 10th Revision (ICD-10) was used to classify cancer sites.
Across all CAs, the range in 1-year survival estimates is narrowest for melanoma cancer, with the difference between the minimum and maximum being 1.3 percentage points.
The largest range in 1-year survival estimates is for anus cancer in women, with a range of 11.6 percentage points between the lowest (82.0% for Lancashire and South Cumbria CA) and highest (93.6% for West Yorkshire and Harrogate CA). The largest range for persons is for stomach cancer with a range of 11.0 percentage points between the lowest (42.4% for Kent and Medway CA) and highest (53.3% for South East London CA).
Across the 24 cancer sites, the Alliance with the largest difference in 1-year survival estimates was Lancashire and South Cumbria CA, a difference of 76.6 percentage points from 21.3% for pancreas cancer to 97.9% for melanoma.
These differences are driven by variation in pancreas cancer survival estimates, as these 2 Alliances had the lowest and highest, respectively, pancreas cancer survival estimates.
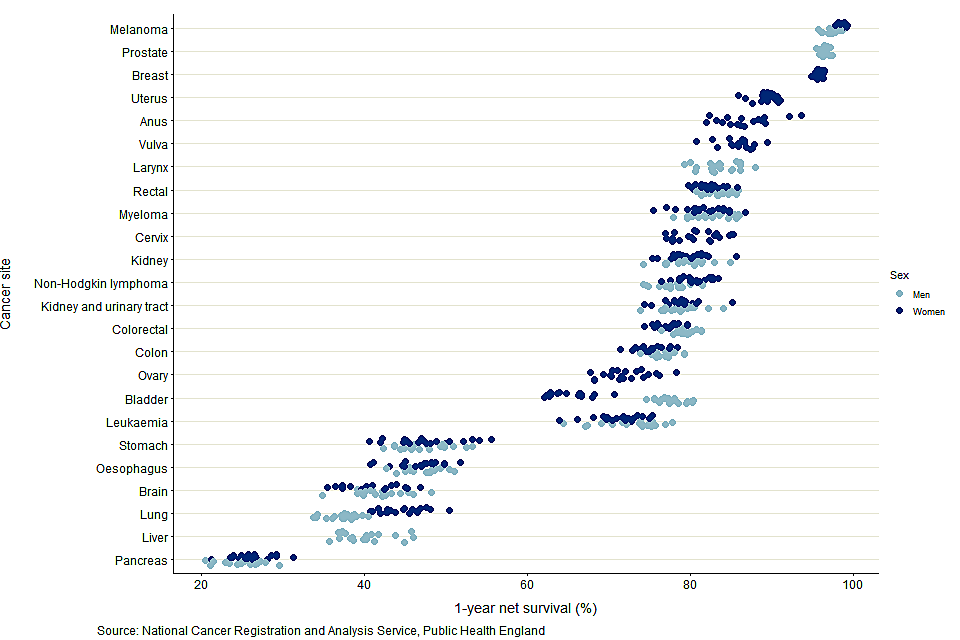
Figure 2: age-standardised 1-year net survival (%) for adults diagnosed in the period 2013 to 2017 and followed up to 2018: 24 common cancers, by sex for selected Cancer Alliances.
Notes:
- Survival estimates were age-standardised using a standard set of age-specific weights.
- Survival estimates presented are for men and women except for:
a) Sex-specific cancers (cervix, ovary, uterus and vulva for women and prostate for men)
b) Larynx and liver cancers are presented only for men because robust estimates were not obtained for 75% of CAs for women
c) Anus and breast cancers are presented only for women because robust estimates were not obtained for 75% of CAs for men - The International Classification of Diseases 10th Revision (ICD-10) was used to classify cancer sites.
An interactive version of this chart is available, where users can highlight the CA of interest.
Pancreas cancer had the lowest 1-year survival in all Alliances (Figure 2). Cancer survival in men is typically lower than survival in women, most noticeably in lung cancer. Only for bladder cancer was survival in women significantly lower than in men, reflecting the national cancer survival estimates.
For 5-year survival, robust age-standardised estimates could not be obtained for most cancer sites and most CAs. It was only possible to provide age-standardised estimates for all CAs in breast cancer (women) and prostate cancer (men).
Between 2006 to 2010 and 2013 to 2017, 245 significant trends were seen for 1-year survival estimates of 14 cancer sites in the 13 CAs for which a back series exists. Of these significant trends, 235 (or 96%) were positive trends, meaning there were statistically significant improvements in survival over the period. These were evenly spread across the 13 CAs and most cancer sites. However, there were 10 significant negative trends observed, of which 7 came from bladder cancer, broadly reflecting the national findings on cancer survival.
2.3 Sustainability and Transformation Partnerships
Sustainability and Transformation Partnerships are partnerships between NHS organisations and local councils to improve health and care in practical ways. STPs are, on average, the smallest geographical areas in this publication and so fewer age-standardised estimates can be presented. There is more volatility and uncertainty in their estimates because of the smaller populations.
The range of 1-year survival estimates was larger than 10 percentage points in STPs for the following cancer sites:
- bladder
- brain
- cervix
- kidney
- kidney and urinary tract
- leukaemia
- liver
- lung
- oesophagus
- ovary
- stomach
The other cancer sites have a narrower range of survival estimates, particularly for melanoma, prostate and breast cancer (Figure 3). Across STPs, the range of 1-year survival estimates varies from 2.4 percentage points for breast cancer to 17.7 percentage points for cervix cancer.
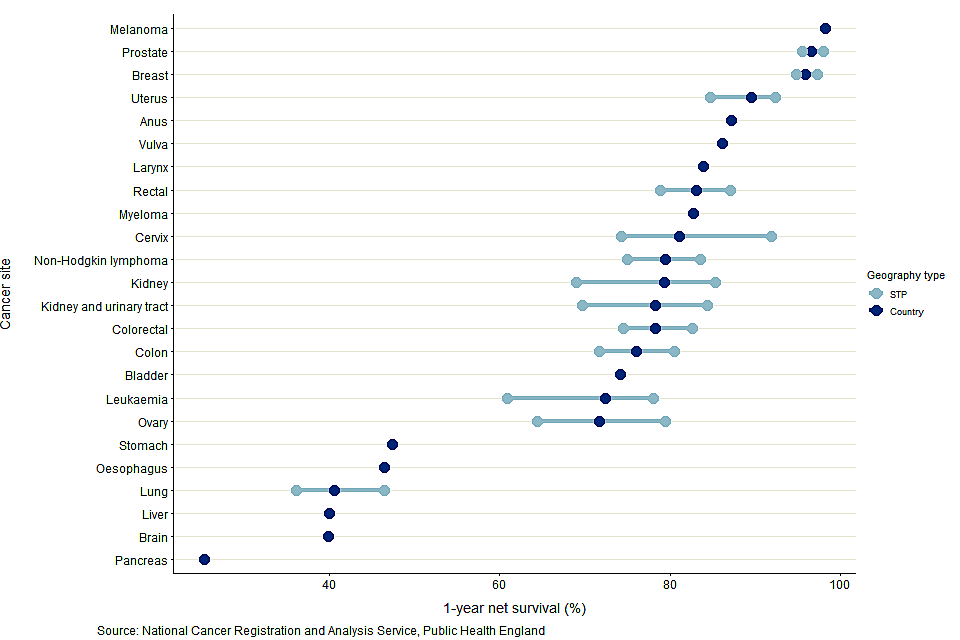
Figure 3: age-standardised 1-year net cancer survival (%) for adults diagnosed in the period 2013 to 2017 and followed up to 2018, and the range of survival estimates for Sustainability and Transformation Partnerships: England, by cancer site
Notes:
- This chart uses age-standardised survival estimates; individual STPs were not included in this chart if robust age-standardised estimates for them were not available.
- Survival estimates were age-standardised using a standard set of age-specific weights.
- Survival estimates presented are for all persons except for sex-specific cancers (cervix, ovary, uterus and vulva for women and prostate for men); larynx which is presented only for men because robust estimates were not obtained for 75% of CAs for women or breast which is presented only for women because robust estimates were not obtained for 75% of CAs for men.
- The International Classification of Diseases 10th Revision (ICD-10) was used to classify cancer sites.
- Cancer sites are included if there are enough age-standardised estimates available for STPs. A combination of site and sex is presented for all geographies if age-standardised 1-year survival estimates can be produced for at least 75% of STPs.
An interactive version of Figure 3 is available and used to explore the variation by STP in age-standardised 1-year net cancer survival estimates for adults diagnosed between 2013 and 2017.
Figure 4 shows how 1-year survival varies by STP in England for colorectal cancer. An interactive version is available and used to explore variation by cancer site and geographical area. The interactive version also displays 1-year survival estimates for the other sub-national health geographies in this publication (NHS Regions and CAs).
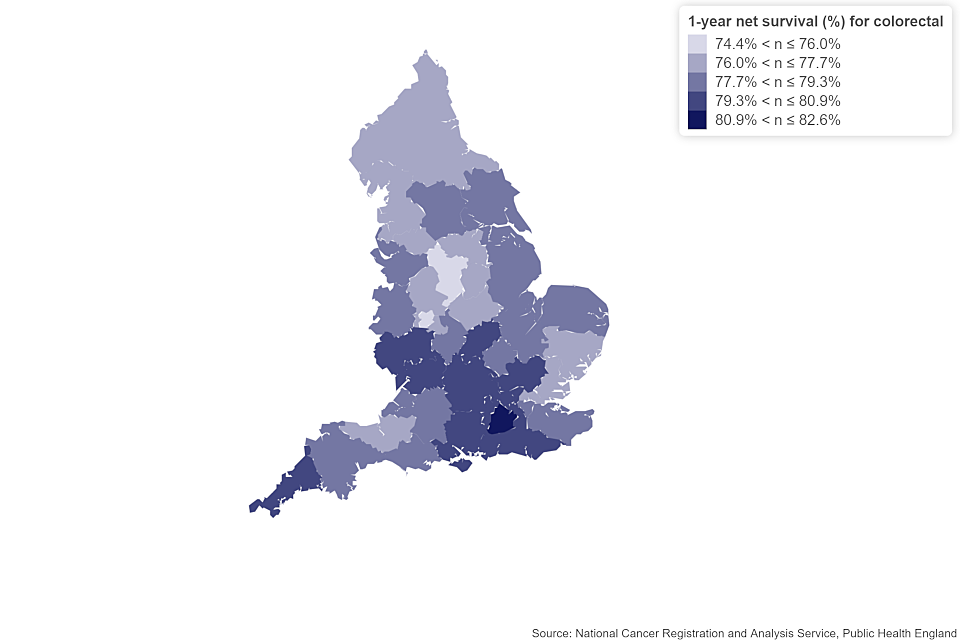
Figure 4: age-standardised 1-year net colorectal cancer survival estimates for adults in England diagnosed between 2013 and 2017 and followed up to 2018, by STP.
Notes:
- This map presents age-standardised survival estimates.
- Survival estimates were age-standardised using a standard set of age-specific weights.
- Adults aged 15 to 99 years for all persons.
- The International Classification of Diseases 10th Revision (ICD-10) was used to classify cancer sites.
Between 2006 to 2010 and 2013 to 2017, 549 significant trends were seen for 1-year survival estimates of 14 cancer sites in the 42 STPs for which a back series exists. Of these significant trends, 520 (or 95%) were positive trends, meaning there were statistically significant improvements in survival over the period. These were evenly spread across the 42 STPs and most cancer sites. However, there were 29 significant negative trends observed, 16 of which came from bladder cancer, broadly reflecting the national findings on cancer survival.
Estimates of 5-year survival for STPs are provided in the data tables where they are deemed to be robust. However, a full comparison of these estimates is not reported due to the suppression of many estimates.
2.4 NHS Regions
England has 7 NHS regions:
- North East and Yorkshire
- North West
- Midlands
- East of England
- London
- South East
- South West
As these regions contain larger populations than CAs and STPs, variation in survival estimates is smaller.
For both 1-year and 5-year survival, the North East and Yorkshire, North West, Midlands and East of England tend to have lower estimates; conversely, the South West and the South East tend to have higher estimates.
Data for these regions are available in the data tables.
3. Things you need to know about this release
3.1 What’s included in this bulletin
These cancer survival estimates are designated as National Statistics. National Statistics are a subset of official statistics, which have been certified by the UK Statistics Authority as compliant with its code of practice for statistics.
This bulletin provides 1-year and 5-year net survival estimates for 24 common cancers. The estimates are for adults (aged 15 to 99 years) diagnosed between 2013 and 2017 in England. Estimates are presented for men and women, and persons. Patients were followed up for at least 1 whole calendar year (up to 31 December 2018).
The 24 cancer sites represent 89% of new diagnoses (excluding non-melanoma skin cancer) diagnosed in England in 2017.
Estimates are presented for England and for the following 3 sub-national geographical levels of organisation of the NHS in England:
- 7 NHS regions
- 20 CAs (average population of 2.9 million)
- 42 STPs (average population of 1.3 million)
This sub-national analysis focuses on these areas, which are leading the local delivery of the improved cancer outcomes set out in Achieving world-class cancer outcomes: A Strategy for England 2015 to 2020. Further details of these health geographies can be found in the Quality and Methodology Information report.
Public Health England (PHE) currently produces 3 cancer survival publications with the Office for National Statistics (ONS). The article Cancer statistics explained: different data sources and when they should be used summarises the purpose of each publication and when it is most appropriate to use each publication.
3.2 What’s changed in this release
This bulletin includes 10 additional cancer sites as compared to the previous publication (Geographic patterns of cancer survival in England: adults diagnosed 2012 to 2016 and followed up to 2017).
There was also a change in the methodology to calculate the trends. Each cohort is now formed from 5 diagnosis years instead of a single diagnosis year. This change reduces volatility in the survival estimates for subnational geographies and is now consistent with the calculations used in the ONS’s Cancer survival in England.
Trends are calculated for cancer sites and geographies which have been published in this ONS series for the diagnosis years between 2006 to 2010 and 2013 to 2017.
Where geographies have changed boundaries, directly comparable estimates for earlier time periods do not exist for the new geographical areas. For this reason, trends for these geographies are not presented in this publication.
3.3 How to interpret these statistics
These subnational cancer survival estimates are based on net survival, which is calculated by comparing the survival of cancer patients with that of the general population. Estimates are age-standardised to adjust for changes in the age profile of cancer patients over time and differences between geographical areas. All survival estimates are presented with confidence intervals to reflect the degree of uncertainty for each estimate.
Prostate cancer
The introduction of the Prostate-Specific Antigen (PSA) test during the 1990s increased the diagnosis of asymptomatic prostate cancers. Men diagnosed with prostate cancer in this way have higher survival than other men diagnosed with prostate cancer. There is continuing geographic variation in the usage of these tests, which will contribute to the geographical variation of survival estimated in prostate cancer.
Age-specific survival estimates are available for every combination of cancer site, geographical area and sex when they pass robustness tests. Age-standardised estimates are provided when all the age-specific estimates pass those tests.
4. Links to other related statistics
In common with all the other cancer survival bulletins, this publication is based on the data summarised in the Cancer registration statistics, England statistical bulletin.
Estimates for England are the same as those presented in Cancer survival in England; combining diagnoses from across England allows for survival estimates to be presented for 29 cancer sites in total, 5 more than in this publication.
Users interested in survival estimates by cancer site and subnational geographies should use this publication.
Estimates for CAs and STPs are also presented in the Index of cancer survival for Clinical Commissioning Groups in England for breast, colorectal and lung cancers and an index of all cancers combined.
The index bulletin uses a different methodology to this publication. This means results presented here are not directly comparable with those from the Index. The main use for the Index of cancer survival in other geographies is the calculation of an all-cancer estimate of survival for small health geographies.
The ONS estimates on childhood cancer survival for children aged (0 to 14 years) diagnosed with cancer in England also uses a different methodology to the other survival publications because of the different ages covered by each publication. The results presented here are not directly comparable with those of the childhood cancer survival publication.
More information on the contents and uses of these publications can be found in the article Cancer statistics explained: different data sources and when they should be used. Statistics on cancer around the UK are produced in:
- Scotland by the Scottish Cancer Registry
- Wales by the Welsh Cancer Intelligence and Surveillance Unit
- Northern Ireland by the Northern Ireland Cancer Registry
5. Quality and methodology
The cancer survival quality and methodology information report contains important information on:
- the strengths and limitations of the data and how it compares with related data
- uses and users of the data
- how the output was created
- the quality of the output including the accuracy of the data
A more detailed examination of the data can be found in investigation of the administrative data sources used in the production of cancer survival statistics for England.
6. Authors
Responsible statistician: Marta Emmett
Production team: Marta Emmett; Bhavisha Hirani; Carolynn Gildea; Dian Xu; John Broggio; Kwok Wong; Roger Hill; Sophie Finnigan.
For queries relating to this bulletin contact ncrasenquiries@phe.gov.uk.
7. Acknowledgements
Data for this work is based on patient-level information collected by the NHS, as part of the care and support of cancer patients. The data is collated, maintained and quality assured by the National Cancer Registration and Analysis Service, PHE.