Benefit cap: number of households capped to February 2023
Published 20 June 2023
Applies to England, Scotland and Wales

© Crown copyright 2023
This publication is licensed under the terms of the Open Government Licence v3.0 except where otherwise stated. To view this licence, visit nationalarchives.gov.uk/doc/open-government-licence/version/3 or write to the Information Policy Team, The National Archives, Kew, London TW9 4DU, or email: psi@nationalarchives.gov.uk.
Where we have identified any third party copyright information you will need to obtain permission from the copyright holders concerned.
This publication is available at https://www.gov.uk/government/statistics/benefit-cap-number-of-households-capped-to-february-2023/benefit-cap-number-of-households-capped-to-february-2023
The latest release of these statistics can be found in the collection of benefit cap statistics.
The benefit cap is a limit on the total amount of benefit that most working age people can get.
The amount of benefit a household receives is reduced to ensure claimants do not receive more than the cap limit. The benefit cap can be applied through either:
-
Universal Credit (UC)
-
Housing Benefit (HB)
The benefit cap was introduced in April 2013. It was initially applied to HB and subsequently to UC, as UC was gradually rolled out. UC replaces 6 means-tested benefits including HB.
Since December 2018, UC has been available across Great Britain (GB) to people applying for means-tested social security support. However, a small number of the population may still apply for HB. Read about who can get HB. DWP is in the process of moving all legacy benefit claimants to Universal Credit.
This release covers data to February 2023 which reflects the benefit cap levels in place from November 2016 to March 2023. The benefit cap levels were increased from April 2023, but these will not be reflected in these statistics until the next release covering data to May 2023. The benefit cap levels relevant in this release are:
-
£20,000 per year (or £13,400 for single adults with no children) nationally
-
£23,000 per year (£15,410 for single adults with no children) in Greater London
Figures within this release have been rounded in line with our rounding policy. Figures may not sum due to rounding.
Full data including all historic data is available on Stat-Xplore.
1. Main stories
The main stories are:
-
around 114,000 households had their benefit capped at February 2023:
- 104,000 households were capped on UC at February 2023
- 9,600 households were capped on HB at February 2023
- the total number of capped households has increased by 3% (2,900) in the latest quarter to February 2023, when compared to the previous quarter (November 2022):
- volumes of UC capped households have increased by 4% (4,200) in the quarter to February 2023 since the previous quarter
- volumes of HB capped households have continued to fall, with a 13% (1,400) decrease in the quarter to February 2023 since the previous quarter
-
1.8% of working age households claiming HB or UC had their benefits capped at February 2023, which is the same proportion as at November 2022
- the weekly average cap amount was £50 at February 2023 which is the same as the figure at November 2022
The number of households that flowed on and off the cap between November 2022 and February 2023
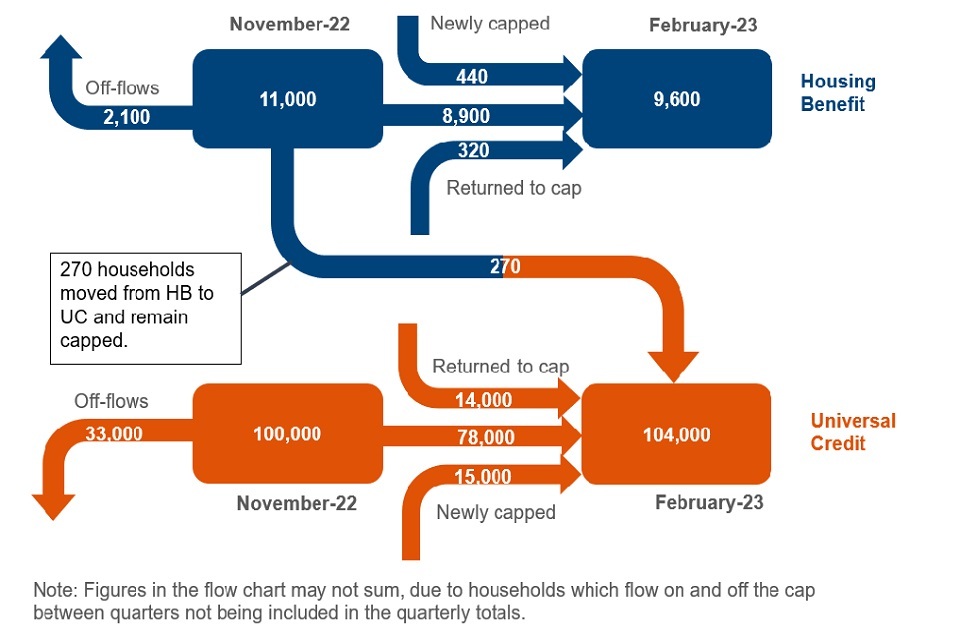
Source: DWP Universal Credit Quarterly Statistics and DWP Housing Benefit Caseload Statistics.
In the latest quarter for households capped on HB:
-
the number of households that had their HB capped decreased by 13% from November 2022 (11,000) to February 2023 (9,600)
-
8,900 households remained capped on HB at February 2023
-
2,100 households off-flowed from the benefit cap, which means no longer on the benefit cap (between November 2022 and January 2023):
- of the 2,100 off-flows, 45% (950 households) were no longer claiming HB. Of the households no longer claiming HB, 76% (730) are now claiming UC
-
270 households moved from HB to UC and continued to be capped (between November 2022 and January 2023)
-
440 households were newly capped, which means they were on the HB benefit cap caseload for the first time (between November 2022 and January 2023):
- of the 440 newly capped HB households, 100 were also off-flows within the same time-period (November 2022 and January 2023)
-
320 households returned to the HB cap that had been capped prior to, but not at, November 2022
In the latest quarter for households capped on UC:
-
the number of households that had their UC capped at February 2023 was 104,000, which is 4,200 more than at November 2022
-
78,000 remained capped at February 2023
-
there were 33,000 off-flows (between November 2022 and January 2023)
-
270 households moved from HB to UC and continued to be capped (between November 2022 and January 2023). In this case it is not the first time the household was on the benefit cap, rather the first time it was capped under UC
-
15,000 were newly capped (between November 2022 and January 2023)
-
14,000 returned to the UC cap that had been capped prior to, but not at, November 2022
Around 15,000 households (14,600 newly capped and 270 that have moved from the HB cap) flowed on to the UC cap. Of these, 5,000 also flowed off the cap within the same time period (between November 2022 and January 2023).
Note: On-flow and off-flow figures relate to different time periods.
2. The number of capped households in GB
At February 2023, around 114,000 households had their benefits capped in GB:
-
104,000 were capped on UC
-
9,600 were capped on HB
The total number of capped households has increased by 3% (2,900) when compared to the previous quarter (November 2022):
-
the number of households capped under UC has increased by 4% (4,200 households) compared to last quarter
-
the number of households capped under HB has continued to decrease, with a 13% (1,400 households) decrease compared to last quarter
The total number of capped households on UC has increased by 4% from November 2022 to February 2023
Monthly number of UC and HB capped households from April 2013 to February 2023
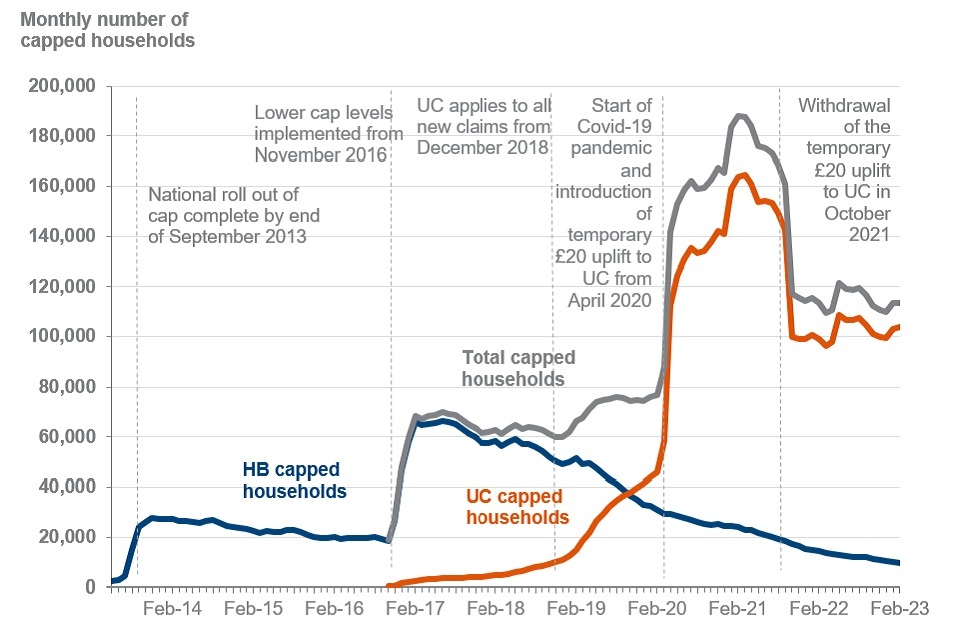
Source: Benefit Cap HB point in time caseload and UC point in time caseload statistics to February 2023, Stat Xplore
UC came into the scope of the benefit cap in October 2016 and capped households claiming UC steadily increased from 350 households (October 2016) to 11,000 households when UC was fully rolled out in December 2018. Up until this point, the changes to the overall capped caseload were driven by HB capped households which reached 67,000 households in June 2017, following the change to current cap levels. The HB capped caseload remained stable until August 2017 (65,000 households) when it started to slowly decrease.
Following the completion of GB-wide roll out of UC in December 2018, the households capped on UC increased due to:
-
the majority of new claimants no longer being able to apply for legacy benefits, only UC
-
HB claimants moving onto UC
The UC capped caseload overtook the HB capped caseload in October 2019, with 36,000 HB households capped and 38,000 UC households capped. Since then, HB capped households have continued to steadily decrease to 9,600 households at February 2023.
Between March 2020 and April 2020, at the onset of the COVID-19 pandemic, the UC capped caseload increased by 92%, from 58,000 households to 110,000 households. From April 2020 until March 2021 the number of households capped on UC increased to a peak of 160,000.
The number of households capped on UC decreased sharply from March 2021 to the quarter to November 2021, with a 40% (66,000 households) decrease to 99,000 households. This coincided with the withdrawal of the temporary £20 uplift which ended on the 6 October 2021.
Since November 2021, the monthly number of households capped under UC has remained relatively stable, fluctuating between 96,000 and 110,000 households. The latest quarter (February 2023) has seen a 4% increase (4,200 households) when compared to last quarter (November 2022).
15,000 households (UC and HB) were newly capped in the latest quarter.
The number of newly capped households has decreased at February 2023 for the second consecutive quarter
Quarterly number of newly capped UC and HB households from April 2013 to January 2023
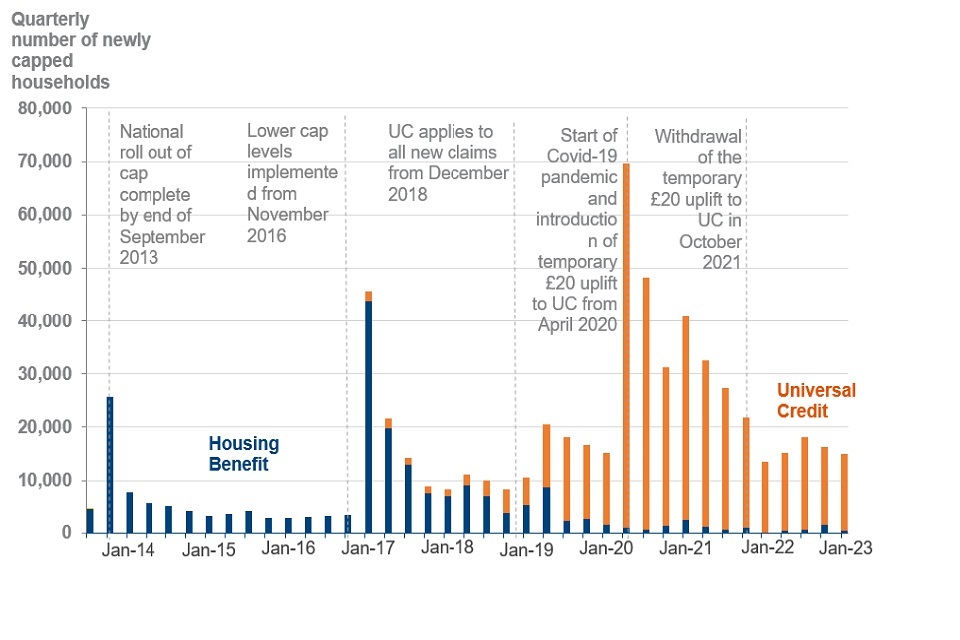
Source: Benefit Cap HB cumulative and UC cumulative caseload statistics to January 2023, Stat-Xplore
15,000 households had their benefits capped for the first time this quarter (November 2022 to January 2023). This is 7% (1,200) fewer households than last quarter (August 2022 to October 2022), when 16,000 households had their benefits capped for the first time.
Note: Newly capped households are those that have their benefits capped for the very first time. For UC, this excludes off-flows from the HB cap who then immediately become capped under UC. Figures may refer to different time periods.
The quarterly number of off-flows from the UC cap has continued to increase for the fourth consecutive quarter
Timeseries of number of households that have flowed off the UC and HB cap from November 2013 to February 2023
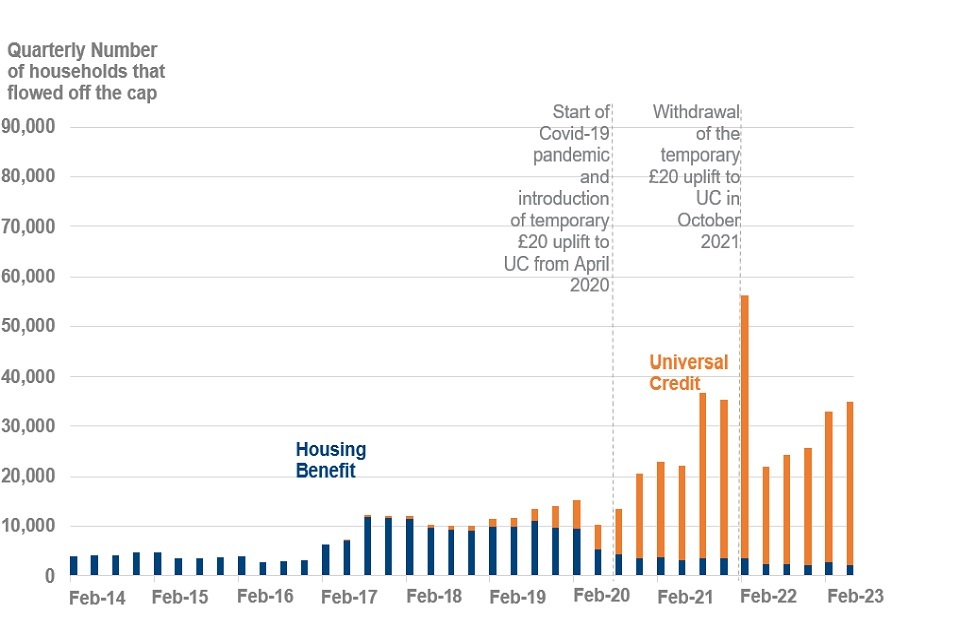
Source: Benefit Cap HB cumulative and UC cumulative caseload statistics to January 2023, Stat-Xplore
In the quarter to February 2023, 33,000 households left the UC cap. Of these off-flows, 15% (5,000 households) were also on-flows during this quarter. This means that these households had their UC capped for the first time and left the cap during this quarter.
The number of quarterly off-flows from UC steadily increased to 5,600 at the quarter ending November 2019. The increase has been greater since the quarter ending February 2020, with the largest number of households that have left the UC benefit cap observed at November 2021 (52,000) which coincides with the withdrawal of the temporary £20 uplift to UC in October 2021. At February 2023, the number of quarterly off-flows from UC has increased to 33,000 households when compared to November 2022 (30,000 households)
In the most recent quarter, (off-flows from November 2022 to January 2023), 10% (3,200) of UC households that flowed off the cap, left the cap due to having earnings at, or over, the earnings threshold of £658 per assessment period (from 12 April 2022). This compares to 10% (3,000) of UC households that left due to earning over the earnings threshold in the quarter to November 2022.
The earnings exemption threshold is subject to change each financial year. The earnings exemption threshold is £658 for the Financial Year Ending (FYE) 2023. Details of previous exemption threshold levels can be found in background information and methodology document.
Off-flow outcomes are shown as at the end of the quarter in which a household moved off the benefit cap, meaning the outcomes are fixed at that point, unless a household is capped again at a later date. More detail on the way off-flow outcomes are determined is included in the background information and methodology document.
In the most recent quarter (off-flows from November 2022 to January 2023), 2,100 households left the HB cap. Of the 2,100 off-flows, 45% (950 households) were no longer claiming HB. Of these, 76% (730) of households no longer claiming HB are now claiming UC.
Of the households which flowed off the HB cap in the latest quarter, 8% (160 households) left the HB cap with an open WTC claim. This compares to 240 households (9%) that left the HB cap with an open WTC claim last quarter (November 2022).
Since December 2018, WTC has been replaced by UC with only a small number of the population able to apply for WTC, see the eligibility criteria and further information about WTC.
3. Characteristics of capped households
86% of households (HB and UC) that are currently capped include children.
At February 2023, 86% (97,000) of total capped households that had their benefits capped included children. In UC, 85% (89,000) of capped households included children and in HB, 86% (8,300) of capped households included children.
Of the households including children, capped at February 2023:
-
91% (88,000) had between 1 and 4 children
-
9% (8,700) had 5 or more children
UC capped households have fewer children per household than HB capped households
Proportion of UC and HB capped households by number of children at February 2023
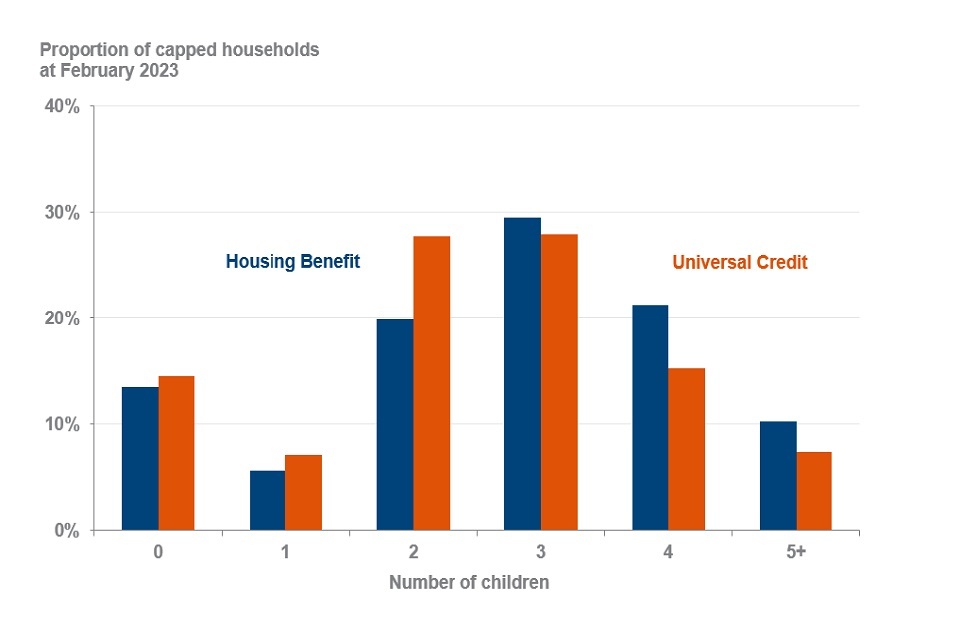
Source: Benefit Cap HB point in time caseload and UC point in time caseload statistics to February 2023, Stat Xplore
Child Benefit (CHB) and Child Tax Credit (CTC) are legacy benefits which can be claimed alongside HB. UC claimants can get CHB and, where applicable, receive the UC child element instead of CTC.
CHB, CTC and UC are all in scope for the benefit cap, so households in receipt of these benefits or elements are more likely to exceed the cap limit and be capped if they are not exempt.
70% of households that have their benefits capped are single-parent families.
The majority of households capped continues to be single parents with children
Proportion of capped households by household type from February 2019 to February 2023
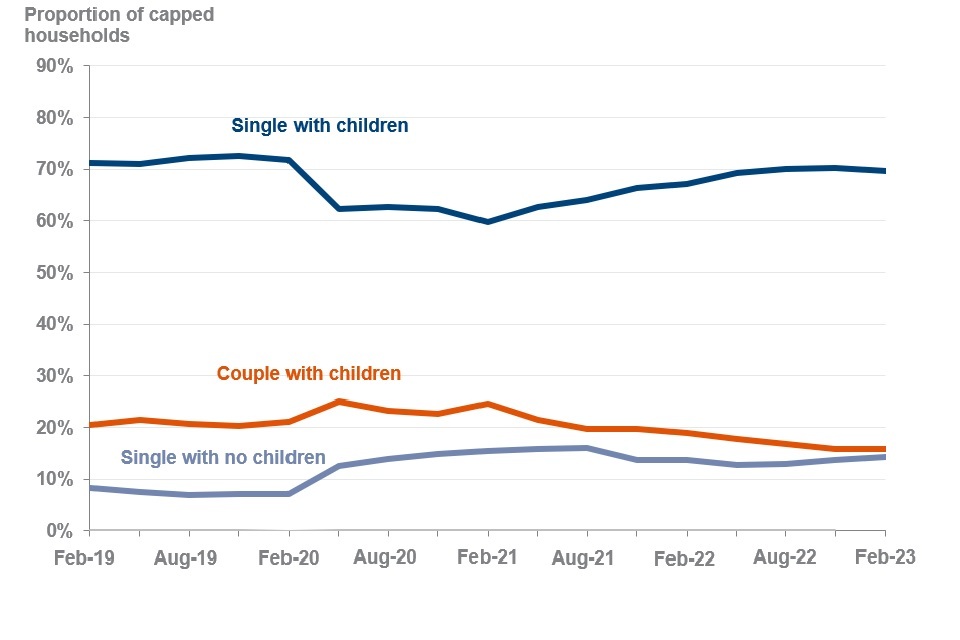
Source: Benefit Cap HB point in time caseload and UC point in time caseload statistics to February 2023, Stat Xplore
At the start of the COVID-19 pandemic, there was a change in the characteristics of households capped on UC and HB, however, trends are now showing similar characteristics to those seen prior to the COVID-19 pandemic:
-
at February 2023, 70% (79,000) of households that had their benefits capped were single-parent families, which is the same proportion as at November 2022. Since February 2021, there was a continuous increase from 60%, quarter on quarter to 70% at August 2022. Since then, the figure has remained stable
-
single-person households with no children steadily decreased from 16% at August 2021 to 13% at May 2022. After May 2022 the figure started to increase and at February 2023, it stands at 14% (16,000)
-
households of couples with children has gradually decreased from 25% at February 2021 to 16% (18,000) at February 2023
-
households of couples with no children account for a negligible amount of the total capped caseload, continuously accounting for 0.1% since May 2020
Just over half of all single-parent capped households have a youngest child under the age of 5 at February 2023
Number of capped UC and HB single parent households (thousands) by age of youngest child at February 2023
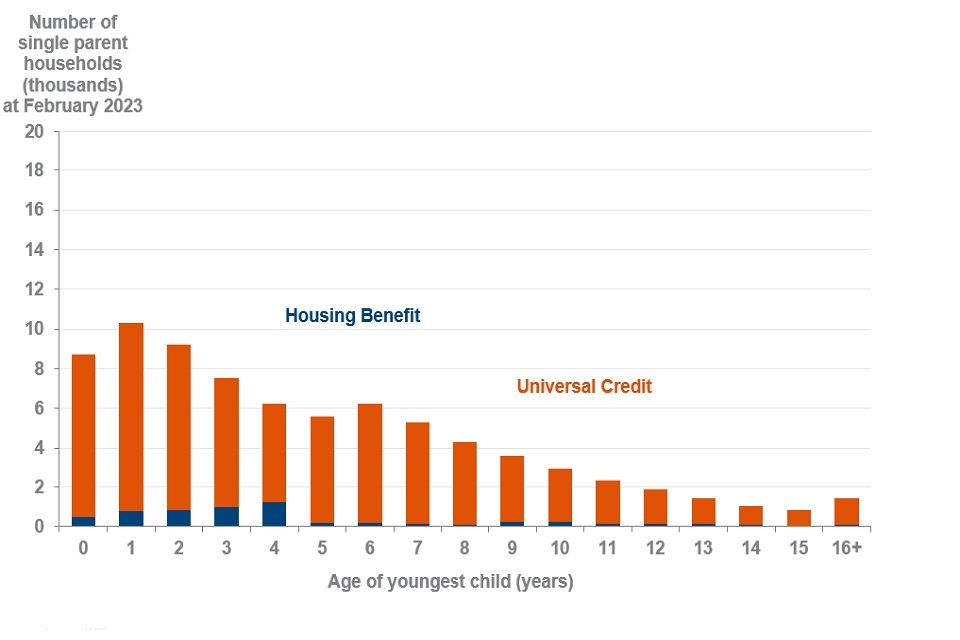
Source: DWP Universal Credit Quarterly Statistics, DWP Housing Benefit Caseload Statistics, HMRC child benefit data, Benefit Cap HB point in time caseload statistics to February 2023
At February 2023, 53% (42,000) of single-parent capped households have at least one child aged under 5 years, including 24% (19,000) with a child aged under 2 years.
The proportion of households claiming benefits that have their benefit capped was 1.8% at February 2023, which is the same as at last quarter (November 2022).
The proportion of UC claiming households that are capped is greatest in the English Local Authorities, especially in the south of England
Proportion of UC households capped at Local Authority level at February 2023
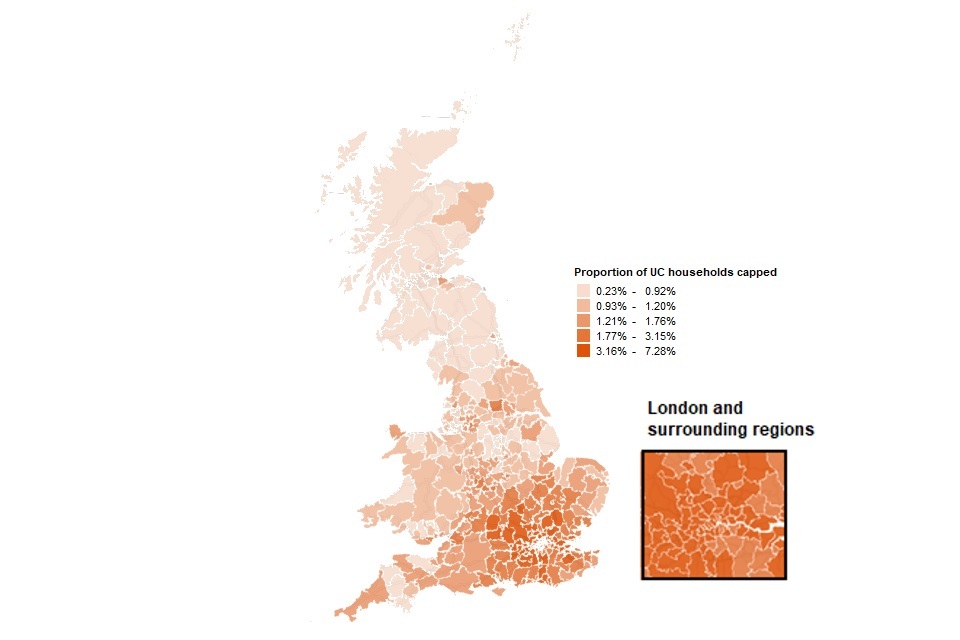
Source: DWP Universal Credit Quarterly Statistics and Benefit Cap UC point in time caseload statistics at February 2023, Stat-Xplore
Note: LAs which are shaded grey in the above maps could be due to several factors such as data being sparse and/or missing.
The proportion of households claiming UC that had their benefits capped at February 2023 was 2.1%, which is an increase from 2.0% at the previous quarter (November 2022). The London region continues to have the highest proportion of UC households affected by the benefit cap, with 4.5% capped at February 2023, an increase from 4.3% at November 2022.
Of the 10 Local Authorities (LAs) with the highest proportion of UC households having their benefits capped at February 2023, 7 of them are in the London region, and 3 are in the South East region. Of the 10 LAs with the highest proportion of UC households having their benefits capped, 8 were also in the top 10 LAs at November 2022
At February 2023, Scotland remains the region with the lowest proportion of UC households capped at 0.8%, which is an increase from 0.7% at November 2022.
The proportion of HB claiming households that are capped is greatest in English LAs
Proportion of HB households capped at Local Authority level at February 2023
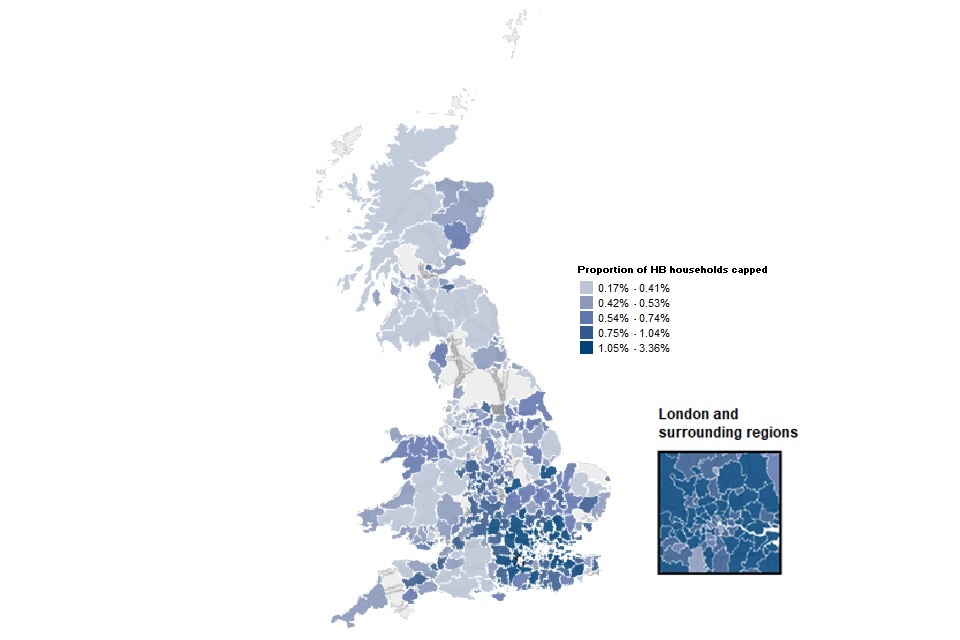
Source: DWP Housing Benefit Caseload Statistics and Benefit Cap HB point in time caseload statistics at February 2023, Stat-Xplore
Note: LAs which are shaded grey in the above maps could be due to several factors such as data being sparse and/or missing.
0.7% of households claiming HB had their benefits capped at February 2023, which is a decrease from 0.8% at last quarter (November 2022). The London region continues to have the highest proportion of HB households affected by the benefit cap, with 1.2% of households capped at February 2023, which is the same as last quarter.
At February 2023, Scotland remains the region with the lowest proportion of HB households capped at 0.3%, a slight decrease from 0.4% at November 2022.
4. The financial impact of being capped
Households had their benefits capped by an average of £50 per week at February 2023.
The weekly average (mean) amount capped at February 2023 was £50 (when combining HB and UC) which is the same as at last quarter.
The average weekly amount capped for UC and HB both remain at the same level at February 2023
Weekly capped amount for UC and HB households from February 2019 to February 2023
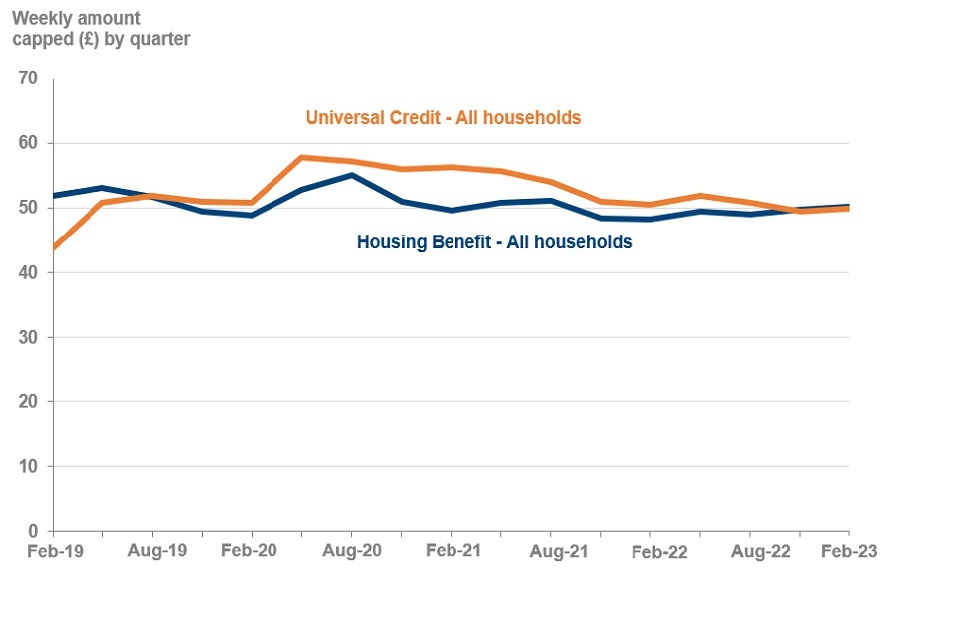
Source: DWP Universal Credit Quarterly Statistics and DWP Housing Benefit Caseload Statistics
The average amount that UC households are capped by is £216 per assessment period at February 2023. This is the equivalent of £50 per week. This is a slight increase from £214 per assessment period, or £50 per week, at November 2022.
The average weekly amount that HB households are capped by is £50 at February 2023 which is the same as at November 2022.
Note: UC is assessed and paid monthly and the benefit cap is applied to the full UC award. For these statistics, a weekly cap equivalent has been calculated for UC households by dividing the amount a household has been capped by in an assessment period (which lasts one month) by 4.33.
The difference in average cap amounts across the two benefits may be affected by the differences in their caseload compositions and the different entitlement conditions across the benefits. The UC cap caseload contains a larger proportion of single people and smaller families, affecting the average amount by which households are capped.
The benefit cap is applied to the full UC award not just to housing costs. Therefore, direct comparisons of cap amounts across HB and UC should not be made.
Proportion of UC capped households at February 2023
At February 2023:
-
63% (65,000) of households that had their UC capped were capped by the equivalent of £50 or less per week
-
24% (25,000) were capped by the equivalent of £50.01 to £100 per week
-
8% (8,400) were capped by the equivalent of £100.01 to £150 per week
-
3% (3,100) were capped by the equivalent of £150.01 to £200 per week
-
2% (1,900) were capped by the equivalent of more than £200 a week, including 0.3% (340) capped by the equivalent of more than £300 per week
5. About these statistics
Disruption to Housing Benefit data
An interruption in the supply of data from Gloucester City Council has affected Housing Benefit statistics from December 2021. Data problems are unlikely to be fixed for the foreseeable future, and until then HB statistics that cover Gloucester will be derived from earlier data. This means estimates for South West and Gloucester on Stat-Xplore will deteriorate in their quality and accuracy.
Housing benefit data covering the periods November 2020 to July 2021 were impacted by an interruption in the supply of data from Hackney Borough council. Hackney Borough Council have now resumed the supply of Housing Benefit data to DWP. Data from August 2021 is based on their most recent return. However, it should be noted that recovery work in Hackney is still ongoing, and therefore the statistics for the latest periods should be handled with caution.
Please note caveats and warnings in the accompanying ODS tables and Stat-Xplore where they appear.
Release schedule
The statistics are published quarterly in March, June, September, and December and are sourced from data originally collected via administrative systems.
Next release: 19 September 2023 (number of households capped to May 2023)
Status of these statistics
National, Official and Experimental Statistics are produced in accordance with the Statistics and Registration Service Act 2007 and the Code of Practice for Statistics (the Code).
This release contains Official and Experimental Statistics on the number of households that have had their benefits capped since the cap was introduced (in April 2013) to February 2023:
-
the HB statistics and data in this release are Official Statistics
-
the UC statistics and data in this release are Official Statistics that are Experimental. This is due to the ongoing development of the data systems that are used to support Universal Credit
The statistics are compiled following the standards of trustworthiness, quality, and public value set out within the Code.
Rounding
Volumes and amounts have been rounded as detailed below. Percentages are calculated using numbers prior to rounding and rounded to the nearest whole percentage point.
| Range | Rounded to the nearest |
|---|---|
| 0 to 1,000 | 10 |
| 1,001 to 10,000 | 100 |
| 10,001 to 100,000 | 1,000 |
| 100,001 to 1,000,000 | 10,000 |
| 1,000,001 to 10,000,000 | 100,000 |
| 10,000,001 to 100,000,000 | 1,000,000 |
Data sources
Note, the Universal Credit statistics throughout this release refer to Universal Credit Full Service (UCFS) only. This is especially important to remember when looking at time series data.
Figures relating to households with their UC capped are subject to retrospection. All UC historic figures in these statistics have been updated as at February 2023. For more information, see the Background Information and Methodology document. The timeseries detailing weekly cap amount does not include retrospection.
The proportion capped figures have been calculated using HB and UC household figures obtained from Stat-Xplore. The total number of HB and UC capped households have been divided by the total number of households on HB and UC respectively to obtain these figures.
Data period
Figures relating to on-flows, newly capped and off-flows refer to the time period November 2022 and January 2023. Figures relating to remaining capped or returning to the cap refer to the time period November 2022 and February 2023. The difference is due to the methodology used to obtain outcome at off-flow (including households that flow from the HB cap to the UC cap), as it is not possible to obtain outcome data for February 2023, at February 2023.
Where to find out more
Use Stat-Xplore to create your own tables and further breakdowns of these statistics.
Read older releases of these statistics.
Read Background Information about these statistics.
Read statistics for households who have their benefits capped in Northern Ireland.
Read statistics on HB caseload.
Read statistics on UC.
Read statistics on Local Authorities’ use of Discretionary Housing Payment funds.
Read more information on the benefit cap.
6. User Engagement
Contact us for statistical enquiries and publication feedback only please.
Producer: Michael Hatton and Navneet Rai
Lead Statistician: James Gray
DWP Press Office: 0115 965 8781
ISBN: 978-1-78659-526-3