Work Choice impact evaluation
Updated 16 April 2025
Applies to England, Scotland and Wales

© Crown copyright 2025
This publication is licensed under the terms of the Open Government Licence v3.0 except where otherwise stated. To view this licence, visit nationalarchives.gov.uk/doc/open-government-licence/version/3 or write to the Information Policy Team, The National Archives, Kew, London TW9 4DU, or email: psi@nationalarchives.gov.uk.
Where we have identified any third party copyright information you will need to obtain permission from the copyright holders concerned.
This publication is available at https://www.gov.uk/government/publications/work-choice-impact-evaluation/work-choice-impact-evaluation
DWP ad hoc research report no. 110
A report of research carried out by the Department for Work and Pensions.
Crown copyright 2025.
You may re-use this information (not including logos) free of charge in any format or medium, under the terms of the Open Government Licence. View this licence or write to the Information Policy Team, The National Archives, Kew, London TW9 4DU, or email psi@nationalarchives.gov.uk.
If you would like to know more about DWP research, email socialresearch@dwp.gov.uk.
First published February 2025.
ISBN 978-1-78659-804-2
Views expressed in this report are not necessarily those of the Department for Work and Pensions or any other government department.
Summary
Work Choice provided specialist employment support to disabled people. This report assesses the impact of Work Choice on the labour market and benefit outcomes of participants and presents a cost-benefit analysis of Work Choice.
Executive Summary
This report estimates the impact and cost-effectiveness of Work Choice.
Work Choice was a voluntary employment programme for people with disability barriers to employment, and people at risk of losing their job as a result of their disability, for whom other DWP provision was not suitable. DWP contracted external providers to deliver Work Choice. Providers offered both work entry support to help participants find and obtain employment, and in-work support to help participants progress and develop in work.
Work Choice was introduced across England, Scotland, and Wales in October 2010. The final referrals to Work Choice occurred in February 2018 and Work Choice support ended in March 2019.
This report provides estimates of the impact of Work Choice using Propensity Score Matching (PSM). The labour market outcomes of 144,838 Work Choice participants are compared against a carefully constructed comparison group of non-participants. The results presented might be subject to some degree of over or underestimation of the programme’s impacts. This depends on the extent to which the analysis controls for any selection effects whereby Work Choice participants may systematically differ from non-participants.
Due to contractual changes impacts are estimated separately for those referred to Work Choice between October 2010 and October 2015, under pre 2015 contract terms (early cohort), and those referred between April 2015 and February 2018 under 2015 or 2017 contract terms (later cohort). Labour market outcomes for the early cohort can be observed for eight years following referral, which is considerably longer than for most DWP employment programme evaluations.
Eight years after referral to Work Choice early cohort participants had a payrolled employment rate 10.9 percentage points (pp) higher than the comparison group, and had spent, on average, 337 more days in payrolled employment (11.5pp) over that time. Early cohort participants were also 7.3 pp less likely to be receiving looking for work or low-income benefits than the comparison group, and had spent, on average, 215 fewer days receiving a looking for work/low-income benefit (-7.4pp) over that time.
Similar results were found for the later cohort. Four years after referral to Work Choice later cohort participants had a payrolled employment rate 11.4 pp higher than the comparison group and had spent 179 more days in payrolled employment (12.3pp) over that time. Participants were also 7.5 pp less likely to be receiving looking for work/low-income benefits than the comparison group, and had spent, on average, 106 fewer receiving a looking for work/low-income benefit (-7.3pp) over that time.
In addition, Work Choice reduced the likelihood of individuals being neither in payrolled employment nor receiving looking for work/low-income benefits. Eight years after referral to Work Choice early cohort participants were 2.6 pp less likely to be neither in employment nor receiving looking for work/low-income benefits than the comparison group, and had spent, on average, 101 fewer days in this state (-3.5pp) over that time. Four years after referral to Work Choice, later cohort participants were 2.3 pp less likely to be neither in employment nor receiving looking for work/low-income benefits than the comparison group, and had spent, on average, 45 fewer days in this state (-3.1pp) over that time.
Analysis of participants referred between October 2010 and March 2012 suggests that the above impacts will persist longer than the eight years assessed for the early cohort.
At an estimated cost of £4,590 per participant, cost benefit analysis based on the estimated impacts shows that, per £1 of cost, the returns from Work Choice were:
- For the participant: £2.19, with a range of £2.07 to £2.36
- For DWP: £0.99, with a range of £0.73 to £1.25
- For the Exchequer: £1.67, with a range of £1.31 to £2.02
- For society: £2.98, with a range of £2.36 to £3.39
Acknowledgements
We would like to thank Professor Richard Dorsett of the University of Westminster for his considered and thoughtful advice on the analysis.
We also thank Simon Marlow and Diane Hume for their insight and guidance, and Ali McAuley and James Lind for their previous work on Work Choice.
Author details
Beth Atkinson, Operational Research Analyst at the Department for Work and Pensions
Connor Lowe, Economist at the Department for Work and Pensions
Glossary
| Term | Meaning |
|---|---|
| BCR | Benefit cost ratio |
| Caliper | The maximum distance between propensity scores acceptable for a match |
| CBA | Cost benefit analysis |
| Common support | The overlap in matched treatment and comparison group observations based on their propensity scores. |
| Comparison Group | Carefully selected subset of the comparison pool, selected to have characteristics as similar as possible, to act as a counterfactual |
| Confidence interval | A 95% confidence interval is a range within which the true population would fall for 95% of the times the sample was repeated. For example, for a 95% confidence interval, the true (unknown) value of the estimate would be expected to lie within it 19 times out of 20 |
| DEA | Disability Employment Adviser |
| DLA | Disability Living Allowance |
| DWP | Department for Work and Pensions |
| ESA | Employment Support Allowance |
| HMRC | HM Revenue and Customs |
| IB | Incapacity Benefit |
| IS | Income Support |
| JCP | Jobcentre Plus |
| JSA | Jobseeker’s Allowance |
| NHS | National Health Service |
| OBR | Office for Budget Responsibility |
| ONS | Office for National Statistics |
| Payrolled employment | Employment paid via the HM Revenue and Customs (HMRC) Pay As You Earn (PAYE) system. This excludes self-employment and a small number of employees. |
| Participant Group | The group of individuals who participated in the programme being evaluated |
| PIP | Personal Independence Payment |
| PRaP | Provider Referrals and Payments system |
| Propensity Score | The probability that an individual with a given set of characteristics has some chosen attribute, for example, participates in an intervention |
| PSM | Propensity Score Matching. A statistical technique in which individuals are identified as statistically similar to each other based on a set of characteristics |
| QALY | Quality-adjusted life years |
| SCBA | The DWP Social Cost Benefit Analysis model |
| SDA | Severe Disablement Allowance |
| SMD | Standardised Mean Difference. A statistic which indicates how different the treatment and comparison groups are across characteristics at various stages of the propensity score matching procedure. |
| SRO | Statutory Referral Organisation. Must be an organisation that has been commissioned by, or has a formal contract or agreement with, an agent of a statutory body. Specifically, they must act on behalf of a Local Authority, the National Health Service (or in Wales, Local Health Boards and in Scotland Health Boards, or a Local Education Authority |
| TA | Training Allowance |
| UC | Universal Credit |
1. Work Choice policy and design
1.1 Policy background
Prior to Work Choice DWP offered support to disabled people seeking work through WORKSTEP and Work Preparation. WORKSTEP was an employment programme providing support to disabled people facing complex barriers to obtaining and keeping a job. It included a supported placement scheme that paid wage subsidies to employers who hired disabled people and subsidised the wages of workers in sheltered workshops and factories. Work Preparation was an individually tailored programme that helped disabled people prepare for work.
In response to an evaluation of WORKSTEP (Purvis, Lowrey, and Dobb, 2006), the Department for Work and Pensions (DWP) conducted a review of disability employment support, and a public consultation proposing reform of the existing disability employment provision.
The Green Paper ‘No one written off: Reforming welfare to reward responsibility’ (Department for Work and Pensions, 2008a), and the White Paper ‘Raising expectations and increasing support: Reforming welfare for the future’ (Department for Work and Pensions, 2008b) led to the replacement of WORKSTEP and Work Preparation with Work Choice.
Work Choice aimed to bring together the best elements of these programmes into a single programme. In line with the approach of providing support in kind to employers rather than a direct financial subsidy, the Job Introduction Scheme, which paid employers a weekly grant towards the cost of employing a disabled person for the first six weeks of their employment, was also discontinued.
Shortly after the introduction of Work Choice the findings of the Sayce review into disability employment support were published in ‘Getting in, staying in and getting on’ (Sayce, 2011).The Government subsequently published ‘Disability Employment Support: Fulfilling Potential’ (Department for Work and Pensions, 2012a).
1.2 Work Choice participants
Participation in Work Choice was voluntary. Eligibility rules were broad; participants must have been of working age, resident in England, Scotland, or Wales, and disabled as defined by the Equality Act 2010. The rules also allowed an individual to participate in the programme multiple times, subject to individual suitability tests for each spell.
Suitability was determined through assessment of individual circumstances by Jobcentre Plus (JCP) Work Coaches and Disability Employment Advisers (DEAs). Suitable candidates for Work Choice met all the following criteria:
- experienced complex work-related support needs arising primarily from disability
- had in work requirements which could not immediately be overcome through workplace adjustments required under the Equality Act 2010 and/or by Access to Work support
- needed support in work as well as help with finding work
-
could not be more appropriately helped through other DWP programmes
- following initial support were expected to be able to work for a minimum of 16 hours per week.
Work Choice had three customer groups, supporting both unemployed and employed customers:
- Transition: Participants of the predecessor programmes WORKSTEP and Work Preparation. These people migrated to Work Choice support in contract Year 1. They were typically in supported employment at the point of migration.
- New Flow: Participants with severe and complex disability related barriers to work. Most of this group were receiving a looking for work/low-income benefit, but this was not a requirement. 86% of this group were out of work at the point of referral.
- Retention: Employed participants at risk of falling out of work without the support of the programme. For example, if an employee became newly disabled or their existing disability changed in a way that put their prospects of continued employment at risk.
Of the 246,000 starts on Work Choice, 211,000 (86%) were from the new flow group, and 35,000 (14%) were from the transition or retention groups.
Only new flow participants in receipt of a looking for work/low-income benefit were considered for inclusion in this analysis. DWP holds the data required for this analysis for benefit recipients. DWP does not hold up to date data for all individuals not receiving looking for work/low-income benefits at referral. Most people in the transition and retention groups were in work at the point of referral to Work Choice, and therefore less likely to be receiving a looking for work/low-income benefit.
1.3 The routes to Work Choice participation
The different groups of participants had different routes into Work Choice.
When Work Choice superseded WORKSTEP in October 2010, all WORKSTEP participants were invited to transfer to the new programme (including people in supported businesses in subsidised places). Those who chose continued support were termed ‘transition’ customers and were migrated to Work Choice.
Retention customers found Work Choice through similar routes to new flow participants, but from a starting position of wanting support to retain their existing job rather than to find and enter employment. For transition and retention customers we expect a different set of participation considerations and decisions to the new flow volunteers who are the focus of this analysis.
For new flow participants the route to participation had two stages:
- Referral to Work Choice
- Starting on Work Choice
The main route to Work Choice was through JCP Work Coaches or DEAs, but potential participants could also be introduced by specialist Statutory Referral Organisations (SROs) such as social services and secondary mental health services. Where SRO introductions occurred, Jobcentre staff undertook suitability assessments and made referrals to employment provision.
Referral to a Work Choice provider was the outcome of decisions made by both the individual and Work Coach/DEA, and either could propose participation in the programme. Following consultation with individuals about what kind of support, if any, would be appropriate, Work Coaches/DEAs decided whether to refer them to Work Choice. Work Coaches/DEAs considered multiple factors including client eligibility, suitability, distance from the labour market, motivation, and the availability of other provision. This decision process differed between individual Work Coaches/DEAs (Purvis and others, 2013). Potential participants also made their own decision on whether to agree to a referral.
Once referred using the Provider Referrals and Payments (PRaP) IT system volunteers met with the Work Choice provider. These meetings were expected to take place within ten working days of referral. At this meeting, if both parties were content, the referral was registered as a ‘start’ on the PRaP system, and the individual was considered to have started Work Choice provision as a participant.
78% of referrals resulted in a start on Work Choice. 19% of referrals resulted in a provider meeting but no start. Non-participation identified at the provider meeting was registered as ‘did not start’ on the referral record, but data doesn’t capture whether this was customer or provider driven non-participation. Although forbidden within provider guidance, the 2013 research (Purvis and others, 2013) showed that some potential participants were deemed to be unsuitable and rejected by the provider. Providers reported that the main reasons they thought some volunteers were unsuitable were motivation and distance from the labour market, i.e., that they did not wish to find work or that they were unlikely to be supported into work within the time-limits of Work Choice. Guidance allowed for providers to reject potential participants where their provision had reached capacity but there are no records of this occurring.
1% of referrals did not result in an initial provider meeting. These were logged on PRaP as ‘did not attend’. These individuals may have changed circumstances post-referral but pre-meeting, such as a worsening health condition, a move into employment, or other life changes that reversed the initial decision to volunteer. Participation decisions may have also been indirectly influenced by provider behaviour. For example, the length of time from referral to provider meeting is partly determined by provider business processes such as caseworker availability, premises, location, and booking systems. This affects when the initial meeting takes place. The longer the waiting period the higher the likelihood that an individual’s circumstances change, which could affect their participation decision.
The remaining 2% of referrals resulted in non-participation because the referred individuals could not be contacted by the provider.
1.4 Work Choice support
Work Choice support had three stages:
-
Module one (work entry support): Individuals received help with personal and job skills, and work-related advice including; vocational guidance, job-search support, job application support, labour market advice e.g., Better Off In Work calculations and assistance with tax credit applications, brokerage between employers and participants, Access to Work support, and support for participants wanting to enter self-employment. For most participants six months in module one was considered adequate. If providers believed a participant would benefit from extra time up to twelve months in module one was allowed.
Participation in Work Choice ended if participants did not find employment during module one or moved directly into employment not supported by the Work Choice provider (‘unsupported employment’). If they moved into employment/self-employment of 16 hours or more a week directly supported by the Work Choice provider (‘supported employment’) they entered modules two or three depending on the support required. -
Module two (short/medium-term in-work support): Under supported employment the Work Choice provider kept in regular contact with the employed participant, and regularly reviewed development plans with the participant and employer to check necessary support was in place and that participants were progressing and developing in their job. Providers ensured that, for at least eight hours per month, participants were engaged in activity that would aid progression towards unsupported employment within two years. Support was tailored to individuals. Examples of support included mentoring, job coaching, assistance with Access to Work applications, advising on workplace adjustments, problem solving in response to issues arising, and sourcing suitable training (Purvis and others, 2013). The maximum duration of module two was two years. If a participant entered unsupported employment during module two their Work Choice participation ended.
-
Module three (Longer term in-work support): Providers ensured that, for at least four hours per month, participants were engaged in activity aimed at developing their full potential at work. Module three had no durational limit and participants could move between modules two and three as required. If a participant entered unsupported employment during module three their Work Choice participation ended.
From April 2017 modules two and three were combined into a single ‘In Work Support’ module. All in-work participants received help and intensive support towards reaching the goal of sustained unsupported employment. Provider support ended after two years in the combined ‘In Work Support’ module. The design of Work Choice is described in detail in the provider guidance (Department for Work and Pensions, 2011 and 2017).
Within this modular structure providers had flexibility in their support offer, and Work Choice support can be described as ‘black box’.
Participants could remain on Work Choice for only a few months if they found unsupported employment quickly, or, prior to April 2017, they could remain on Work Choice indefinitely if they remained in long term supported employment. However, most participant journeys lasted less than a year.
The participants included in this analysis all started Work Choice in module one (work entry support).
DWP contracted external providers to deliver Work Choice across 28 geographic areas known as ‘Contract Package Areas’ (CPAs). These primary providers managed supply chains of subcontracted providers to deliver the service. Over the life of the programme eight prime providers delivered Work Choice services.
Initially, one of the prime providers, Remploy, delivered Work Choice as a non-departmental government body, operating as a company limited by guarantee, and directly funded by DWP under Grant in Aid arrangements. In April 2015 grant funding arrangements ended. Remploy continued to deliver Work Choice as a commercial entity through a contracted prime provider model identical to other providers.
At launch, in all but two delivery areas participants could choose between Remploy and one of the other eight prime providers delivering Work Choice. However, in the 2013 research (Purvis and others, 2013) it was found that participants would often ask for advice from their Work Coach/DEA. When giving advice DEAs considered geographical location, particular support needs, type of work sought and previous knowledge of provider delivery standards.
1.5 Provider payment model
Contracted providers were paid by DWP through a structured funding model. Payments were primarily made through service fees, but providers also received payment by results outcome fees when individual participants achieved specific employment-duration based outcomes.
There were two payment by results outcomes. First, a 13-week short-duration outcome where eligible employment included either supported employment or unsupported employment. Secondly, a longer-duration outcome fee was paid if participants undertook 26 weeks of unsupported employment within a 30-week period, beginning on the first day of unsupported work. Time in supported employment was excluded from the longer-duration outcome definition.
Contract changes introduced in 2015 and 2017 made modifications to the delivery model and cost structure of Work Choice. These should be considered when interpreting the impact estimates and cost-benefit analysis. Work Choice had three commercial phases of delivery with different cost structures. Minor service offer changes were also introduced in each phase:
- 2010-15 contracts – Remploy, grant in aid funded, and seven prime providers funded through a service fees and payment by results model, with a ratio of 7 to 3 between elements.
- 2015-17 contract extension – Remploy commercialisation in April 2015, contract changes for seven prime providers introduced in October 2015. Funding was split equally between service fees and payment by results. The short duration outcome definition changed from ‘employment expected to last 13 weeks’ to ‘employment that has lasted 13 weeks’.
- 2017 contract extensions – contracts delivering in England and Wales extended to 2019 with the same funding model, but overall contract value reduced by around 20%. Referrals ended in February 2018. Participants were supported until March 2018, and outcomes could be claimed by providers until October 2019. Contracts delivering in Scotland took on no new participants but continued to support existing caseloads until October 2018.
Service delivery changes combined modules two and three into a single ‘In Work Support’ module. Prior to the 2017 contract extensions, Work Choice was European Social Fund (ESF) match funded[footnote 1].
1.6 Take up of Work Choice
Over 316,000 referrals to Work Choice were made between 2010 and 2018, and 245,700 starts were recorded from 194,800 participants.[footnote 2] 19% of participants started on Work Choice more than once, resulting in more starts than individual participants. On average there were 1.26 starts per participant.
In the first two months of the provision a large flow of transition WORKSTEP and Work Preparation participants migrated on to Work Choice. Following this there were on average 2,000 referrals per month across the remainder of provision.
1.7 Work Choice contractual performance
Commercial management of Work Choice was centred on minimum performance levels. These represented the minimum acceptable performance of each provider based on the number of individuals within any given cohort expected to achieve short-duration and longer-duration outcomes (see section 1.6 ‘Provider payment model’). Targets were agreed with providers and differed between providers. The overall expectation was that 39% of starts would result in a short-duration outcome, and 25% in a longer-duration outcome.
Performance fell below this expectation; 35% of Work Choice starts achieved a short-duration outcome and 23% achieved a longer-duration outcome. However, it is important to note that this is a measure of success against a commercial expectation, not a measure of the impact of the programme. To obtain an estimate of the impact on labour market outcomes, participants are compared to a counterfactual group of non-participants.
For further information on contractual outcomes achieved see the Work Choice statistics (Department for Work and Pensions, 2020).
1.8 Previous analysis of Work Choice
Two qualitative evaluations of Work Choice have been published. Thompson and others (2011) evaluated the transition process, the impact of transition on participants, and the early operation of Work Choice. Purvis and others (2013) examined factors which influenced access to the programme, participant profiles and the commissioning of Work Choice, and explored what works in specialist disability employment provision.
2. Evaluation methodology and sample selection
The impact of Work Choice is defined as the outcomes that participants achieved under Work Choice, minus the outcomes that would have occurred had they not participated.
The outcomes of Work Choice participants can be directly observed from data on benefit receipt held by DWP, and employment information from HM Revenue and Customs’ (HMRC) PAYE system. However, it is impossible to know what outcomes participants would have achieved if they had not participated (the counterfactual). To estimate impact, it is therefore necessary to form a credible estimate of what these outcomes would have been. Provided the approach to estimating counterfactual outcomes is sound, any difference between counterfactual estimates and observed participant outcomes can be attributed to the impact of the Work Choice.
The best method for estimating impacts is usually believed to be a randomised controlled trial (RCT) where a proportion of volunteers are assigned to a control group instead of the ‘treatment’ assessed (e.g. Work Choice). A well-constructed randomly assigned control group enables a robust counterfactual to be inferred, as the only difference between the treated individuals and the control group is the treatment.
Work Choice was not delivered with an RCT. Instead, a comparison group of non-participants is used to estimate the counterfactual. Outcomes for this group are compared to participants’ outcomes to estimate the impact of Work Choice.
A good comparison group of non-participants will be as similar as possible to the participant group, ideally with the only difference being participation in Work Choice. However, as described in ‘1.3 The routes to Work Choice participation’, Work Choice participation is the outcome of decisions made by the individual, the work coach/DEA and potentially the contracted provider. It is likely that individuals who participate will be, on average, different from those who do not. The ways in which these groups differ may include factors which influence the outcomes being measured. Indeed, we compared characteristics of participants and non-participants included in this analysis and found such differences (see 2.4 ‘Comparing participants and the comparison pool’). Differences between participant and non-participant groups introduce bias into the impact estimate when calculated as the difference between participant and non-participant outcomes.
Propensity score matching (PSM) is used to attempt to control for factors that influence whether someone participated in Work Choice. In PSM a comparison group is constructed by matching participants to similar individuals from a pool of non-participants. This PSM approach is consistent with the approach taken in a number of previous DWP impact assessments of labour market initiatives, for example for Work Experience (Haigh and Woods, 2016) and evaluations conducted by the DWP Employment Data Lab.
Under PSM propensity scores for participants and individuals in the comparison pool are calculated. These represent their likelihood of participating in Work Choice given a set of observed characteristics. Participants are then matched to non-participants with the same, or similar, propensity score to create the matched comparison group. Rosenbaum and Rubin (1983) showed that matching participants to non-participants with similar propensity scores can remove differences between these two groups in the variables included in the propensity score calculation.
The credibility of matching is dependent on the ‘Conditional Independence Assumption’ (CIA). That is, all important influences on participation and outcomes are controlled for, and we can assume that without Work Choice participation the participant and non-participant group would have had the same outcomes. If all important influences on participation and outcomes are included in the estimation of propensity scores, comparing the outcomes of participants and matched non-participants provides an unbiased estimate of programme impact. Any differences in outcomes between the groups can be attributed to Work Choice, and not compositional differences between groups.
However, some differences between participants and non-participants are not directly observable. Therefore, it is assumed that that by controlling for sufficient observed characteristics that the full range of factors, both observed and unobserved, that are likely to affect whether an individual participates in Work Choice can be controlled for.
To reduce the risk of residual, uncontrolled, bias we have restricted the comparison pool to those who were referred to Work Choice but did not start. These individuals should be more similar to participants than those never referred. Furthermore, DWP has rich and detailed data which can be linked to those referred to Work Choice (see ‘Appendix A: Data Sources’), improving the likelihood of satisfying the conditional independence assumption. See section ‘4 Caveats and limitations’ for further discussion of the CIA and potential sources of bias in this analysis.
Contractual changes were made to the provider payment model in 2015 (see ‘1.6 Provider payment model’). This may have affected the outcomes and impacts of Work Choice. The impact of Work Choice is therefore estimated separately for participants before (the ‘early cohort’) and after this change (the ‘later cohort’).
2.1 Outcomes measured
The impact of work choice on the following outcomes is analysed:
1. Payrolled employment:
a) Whether in payrolled employment (employment paid via the HMRC PAYE system)
b) Days spent in payrolled employment
To reflect that some people in work may also be in receipt of looking for work/low-income benefits the in payrolled employment outcome is further split into:
c) In payrolled employment and receiving a looking for work/low-income benefit
d) In payrolled employment and not receiving a looking for work/low-income benefit
2. Looking for work/low-income benefits:
a) Whether receiving looking for work/low-income benefits
b) Days spent receiving looking for work/low-income benefits
Further divided by:
c) JSA or UC with Searching for Work conditionality
d) Other looking for work/low-income benefits
Receiving a looking for work/low-income benefit indicates an individual is actively searching for work, and is defined as receiving one of the following:
- Jobseeker’s Allowance (JSA)
- Income Support (IS)
- Employment and Support Allowance (ESA)
- Incapacity Benefit (IB)
- Severe Disablement Allowance (SDA)
- Training Allowance (TA)
- Universal Credit (UC) excluding the ‘Working – No Requirements’ conditionality group (i.e., excluding individuals with individual or household earnings over the level at which mandatory work-related activities apply)
3. ‘Neither’ (not in payrolled employment nor receiving looking for work/low-income benefits)
a) Whether in the ‘neither’ outcome
b) Days spent in the ‘neither’ outcome
We do not know the status of people in the ‘neither’ outcome group. While it could include, among others, individuals moving into self-employment and not receiving looking for work/low-income benefits, or individuals still looking for work but with no access to looking for work/low-income benefits, it most likely captures individuals who have, by choice or otherwise, temporarily, or permanently, left the labour market.
2.1.1 Rollout of Universal Credit
Universal Credit is replacing six benefits, commonly referred to as ‘legacy benefits’:
- Income-based JSA
- Income-related ESA
- Income Support
- Working Tax Credit
- Child Tax Credit
- Housing Benefit
UC rollout began in 2013, initially in a small number of Jobcentres for eligible households in specific circumstances. By the end of 2018 UC was available to all eligible households across Great Britain. By April 2023 over 5.5 million people were receiving UC but there remained people receiving legacy benefits.
The analysis here spans the time from when only legacy benefits existed through to the UC rollout period to April 2023. This change in the benefits system and the gradual roll out of UC complicates the looking for work/low-income benefit outcome measure. The proportion of each group receiving a looking for work/low-income benefit may change over time simply due to UC rollout and the difference in eligibility rules between UC and legacy benefits.
The design of UC explicitly allows claimants to engage in employment activity whilst still being in receipt of the benefit, whereas JSA was designed to be an out of work benefit. UC claimants do not automatically move off UC when working over a certain number of hours as JSA claimants do. UC places claimants into conditionality groups which determine the amount and type of work-related activity that an individual is required to do to remain eligible for the benefit. Lower levels of conditionality mean fewer work-related requirements. In order of lowest to highest levels of conditionality, the groups are as follows:
- Working – no requirements
- No work requirements
- Planning for work
- Preparing for work
- Working – with requirements
- Searching for work
UC conditionality groups do not map directly on to legacy benefit types. For the purposes of this analysis, the following approximations have been made:
- Jobseeker’s Allowance to Universal Credit searching for work.
- All other legacy looking for work/low-income benefits to; Universal Credit planning for work, preparing for work, working – with requirements, and no work requirements.
The impact of Work Choice is estimated on the above two groups of benefits in addition to the overall impact on looking for work/low-income benefits.
2.2 Participant selection
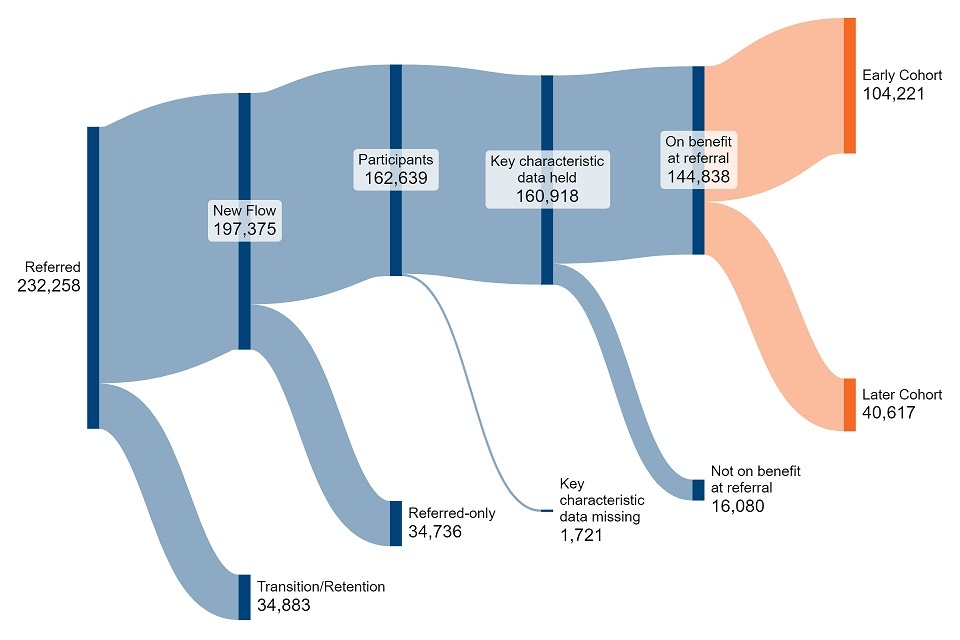
Referrals to Work Choice were identified using the DWP Provider Referral and Payments (PRaP) dataset, which captures all referrals to contracted provision. 232,258 referred individuals were identified. 197,375 (85%) of these were from the new flow group. Of these 162,639 started Work Choice.
New flow group participants who met both the following criteria were included in this analysis:
- Have a record on DWP’s Labour Market System (LMS), the main course of personal characteristics data used in this analysis (see ‘Appendix A: Data Sources’)
- Were receiving a looking for work/low-income benefit at the point of referral
1,721 participants (1.1%) were excluded because they did not have a record on the LMS. A further 16,080 participants (9.9%) were excluded because they were not receiving a looking for work/low-income benefit at the point of referral.
The resulting group of 144,838 participants was then split into an ‘early cohort’; those referred under the 2010 contract terms, and a ‘later cohort’; those referred under the 2015 or 2017 contract extension terms. The early participant cohort has 104,221 individuals referred between October 2010 and October 2015. The later participant cohort has 40,617 individuals referred between April 2015 and February 2018.[footnote 3]
Where participants had multiple referrals, the earliest referral leading to a start was selected for inclusion in the analysis and used as the date from which to track outcomes. 6.9% (7,191) of early cohort participants and 8.8% (3,584) of later cohort participants had at least one prior referral that did not result in Work Choice participation.[footnote 4]
Figure 2‑1 illustrates the exclusion of individuals from the pool of all referred individuals to form the two participant cohorts included in this analysis.
Figure 2‑1: Selection of participant cohorts from all referred individuals.
2.3 Selection of a referred-only group
The comparison pool comprised individuals who had been referred to Work Choice but did not start. People in this group have undergone the same selection into referral as people who ultimately participated in Work Choice. They were eligible for Work Choice, volunteered, and a work coach or DEA agreed that they were a suitable candidate. People in this referred-only group should be more like Work Choice participants than people never referred. For this reason, they were chosen as the preferred comparison group (for more information on the consideration of a never referred comparison group see ‘Appendix F: A never referred comparison group’).
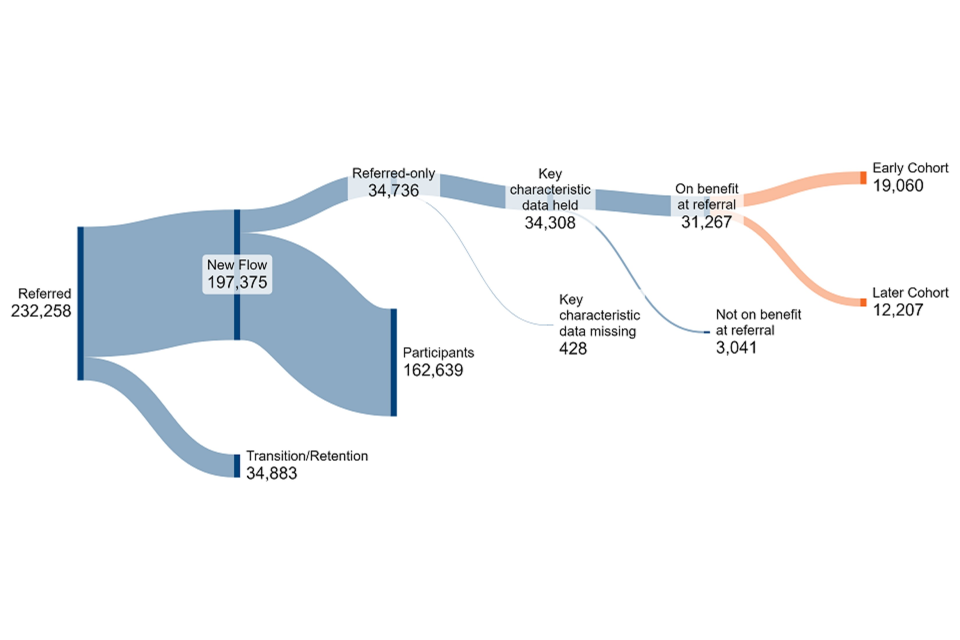
As for the participant group, referrals to the new flow group were identified using the DWP Provider Referral and Payments (PRaP) dataset. Of the 197,375 individuals referred from the new flow group 34,736 individuals did not start Work Choice.
The same criteria as used for selecting the participant group was then used to select referred-only individuals to be included in the comparison pool i.e.:
- Have a record on the LMS
- Were receiving a looking for work/low-income benefit at the point of referral
This resulted in similar proportions being excluded: 428 (1.2%) were excluded because they did not have a record on the LMS, and a further 3,041 referrals (8.8%) were excluded because the individuals were not receiving a looking for work/low-income benefit at the point of referral.
This resulting group of 31,267 referred-only individuals was then split into an ‘early’ and a ‘later’ cohort. The early cohort has 19,060 referred-only individuals and the later cohort has 12,207 referred-only individuals.
Where individuals had multiple referrals, the earliest referral was selected for inclusion in the analysis and used as the date from which to track outcomes. 14.1% of the early referred-only cohort (2,685 individuals) and 9.8% of the later referred-only cohort (1,197 individuals) had multiple referrals.
Figure 2‑2 illustrates the exclusion of individuals from the pool of all referred individuals to form the two referred-only cohorts included in this analysis.
Figure 2‑2: Selection of referred-only cohorts from all referred individuals.
2.4 Comparing participants and the comparison pool
Together the participant cohorts and referred-only cohorts include 176,105 individuals referred to Work Choice between October 2010 and February 2018. This represents 76% of all individuals referred to Work Choice and 89% of individuals referred to the new flow group.
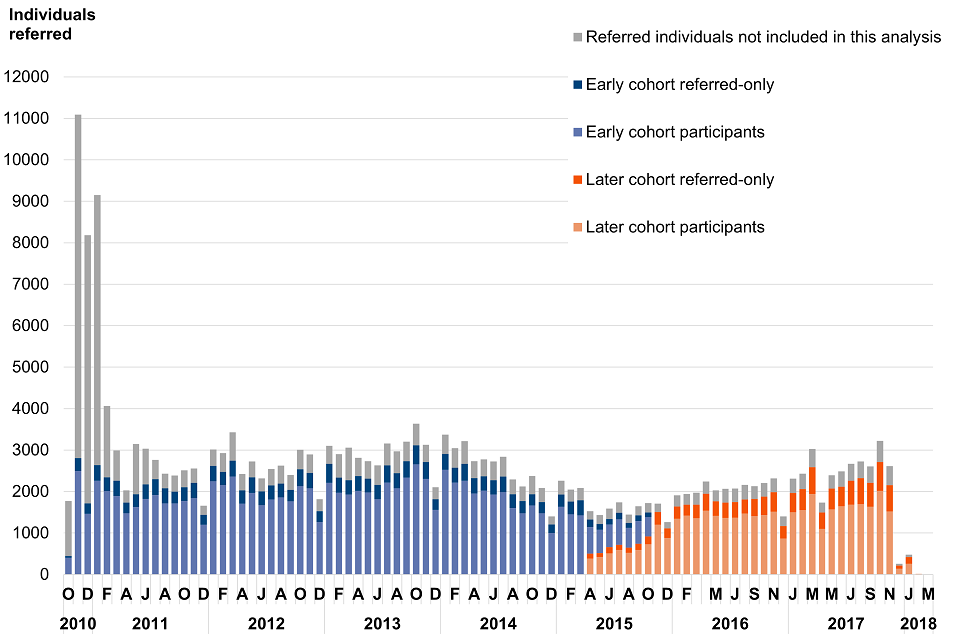
Figure 2‑3 shows the number of individuals referred, and the subset in the participant and referred-only cohorts, across time. The large spike in referrals at the beginning of the programme is due to transition cases. Transition and retention participants are not included in this analysis. Early and later cohorts overlap because contract changes came into effect at different times for different providers.
Figure 2‑4 shows the different pathways taken by the participant and referred-only groups. We do not know why referred-only individuals did not start Work Choice. Some potential participants were rejected by providers as they felt the potential participants lacked motivation or were unlikely to move into work quickly (Purvis and others, 2013). This suggests that the referred-only group could be less likely to move into work and/or have higher support needs than those who started Work Choice. This could lead to overestimating the impact of Work Choice. Alternatively, some non-starts, including all exits before the first provider meeting, were customer choice. Customers may have found work or felt that they did not need Work Choice support. This could lead to underestimating the impact of Work Choice.
Figure 2‑3: Individuals referred to Work Choice by referral month. Where individuals are referred more than once only their earliest referral that led to a start on Work Choice, or their earliest referral if they never started, is counted.
The characteristics of the participant and unmatched referred-only group are compared in Table 2‑1 and Table 2‑2. Table 2‑1 shows what proportion of the groups were receiving each looking for work/low-income at referral. For both cohorts, most participants were receiving JSA, with the referred-only group slightly less likely to be receiving it than participants. Similar proportions of both cohorts were in receipt of ESA at referral to Work Choice, with the referred-only group more likely to be receiving ESA than participants. Due to the gradual roll-out of UC (see ‘2.1.1 Rollout of Universal Credit’), only a few people in the early cohorts were receiving UC at the point of referral. However, 17% of the later cohort participants and 16% of the later cohort referred-only group were in receipt of UC at referral, with lower proportions receiving JSA.
Figure 2‑4: Work Choice referral process and group allocation for analysis
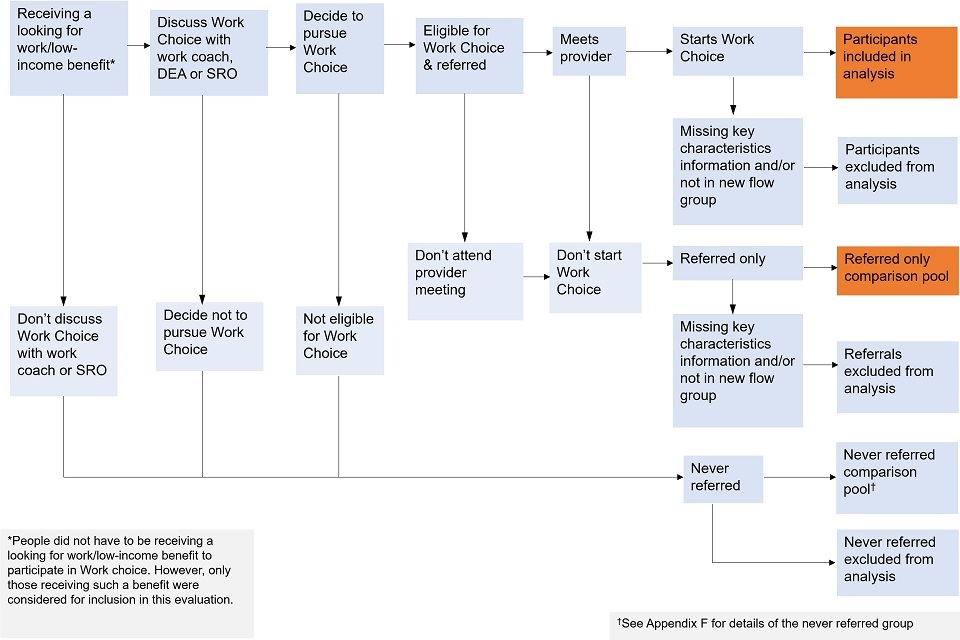
Table 2‑2 summarises key characteristics and the employment history of the participant group and the unmatched referred-only group (see ‘Appendix C: Post matching balance assessment’ for a larger list, and ‘Appendix A: Data Sources’ for descriptions of the data sources).
Although there are many similarities between the early and later cohorts, there are some differences. For example, the early cohort is younger, has spent fewer days in payrolled employment over the two years before referral, and is more likely to have been referred to the Work Programme prior to referral to Work Choice.
Table 2‑1: Looking for work/low-income benefit received at the point of referral to work choice for unmatched participants and referred-only groups.
| Looking for work/low-income benefit received at referral | Early cohort participant | Early cohort referred-only | Later cohort participant | Later cohort referred-only |
|---|---|---|---|---|
| Jobseeker’s Allowance (JSA) | 79.5% | 74.8% | 65.2% | 63.0% |
| Employment and Support Allowance (ESA) | 16.2% | 20.8% | 16.8% | 19.9% |
| Universal Credit excluding ‘Working – No Requirements’ (UC) | 0.2% | 0.3% | 16.9% | 16.1% |
| Income Support (IS) only | 1.0% | 1.1% | 1.1% | 1.0% |
| Incapacity Benefit (IB) only | 1.8% | 1.7% | 0.1% | 0.0% |
| IS and IB together | 1.2% | 1.3% | 0.0% | 0.0% |
| Severe Disablement Allowance (SDA) | 0.0% | 0.0% | 0.0% | 0.0% |
| Training Allowance (TA) | 0.1% | 0.0% | 0.0% | 0.0% |
Table 2‑2: Characteristics of individuals in the un-matched participant and referred-only groups.
| Variable | Early participant group | Early referred-only group | Later participant group | Later referred-only group |
|---|---|---|---|---|
| Aged 18 to 24 | 25.2% | 24.4% | 17.8% | 16.5% |
| Aged 25 to 49 | 51.4% | 52.3% | 51.3% | 52.0% |
| Aged 50+ | 23.4% | 23.3% | 30.8% | 31.5% |
| Male | 64.7% | 64.0% | 63.1% | 63.3% |
| Ethnicity - White | 86.2% | 83.3% | 84.5% | 82.8% |
| Ethnicity - Black | 3.3% | 4.3% | 4.3% | 4.9% |
| Ethnicity - Asian | 3.1% | 4.1% | 3.8% | 4.4% |
| Ethnicity - Mixed | 1.2% | 1.3% | 1.4% | 1.6% |
| Ethnicity - Other | 1.0% | 1.8% | 1.1% | 1.5% |
| Ethnicity - Prefer Not to Say | 5.2% | 5.1% | 4.6% | 4.5% |
| Disability: Conditions Restricting Mobility / Dexterity | 15.0% | 15.3% | 15.9% | 16.9% |
| Disability: Visual Impairment | 2.3% | 2.5% | 1.9% | 1.8% |
| Disability: Hearing and / or Speech Impairment | 3.9% | 3.4% | 2.9% | 2.3% |
| Disability: Long-term Medical Conditions | 11.1% | 11.8% | 12.4% | 12.5% |
| Disability: Moderate to Severe Learning Disability | 6.4% | 6.4% | 4.0% | 4.3% |
| Disability: Mild Learning Disability | 13.6% | 11.6% | 9.5% | 7.5% |
| Disability: Severe Mental Illness | 1.0% | 1.3% | 1.0% | 1.3% |
| Disability: Mild to Moderate Mental Health condition | 18.9% | 20.8% | 17.6% | 18.2% |
| Disability: Neurological Conditions | 4.0% | 4.2% | 3.1% | 3.0% |
| Disability: Multiple Conditions | 12.0% | 12.3% | 13.5% | 13.8% |
| Referred to Work Programme at any time prior to Work Choice referral | 10.8% | 11.7% | 38.5% | 41.9% |
| Referral to any contracted employment support in the two years prior to referral | 21.8% | 16.6% | 18.8% | 11.7% |
| Adverse sanction decision in the two years before referral | 22% | 26% | 17% | 19% |
| Days in P45 employment over the two years prior to referral | 182.2 | 135.8 | 191.9 | 144.0 |
| Days receiving JSA or UC with Searching for Work conditionality over the two years prior to referral | 240.7 | 227.7 | 261.7 | 254.4 |
| Days receiving other looking for work/low-income benefits over the two years prior to referral | 231.1 | 283.2 | 220.8 | 276.8 |
| Days receiving any looking for work/low-income benefits over the two years prior to referral | 471.8 | 510.9 | 482.5 | 531.1 |
For both the early and late cohort, Work Choice participants were more likely to have been referred to other contracted employment support prior to referral to Work Choice. They were also less likely to have received a benefit sanction in the two years prior to referral. Such differences may be correlated with a difference in motivation to find employment and, therefore, outcomes.
For both cohorts Work Choice participants had, on average, spent more days in payrolled employment, and fewer days receiving a looking for work/low-income benefit (although more days in receipt of JSA/UC with searching work conditionality), in the two years before referral to Work Choice than those referred only. A difference in employment history may lead to a difference in outcomes. There were also differences in ethnicity and disability type between the participant and referral-only groups. Demographic differences such as these may also be correlated with different outcomes.
The aim of matching is to control differences between the participant and referral-only groups as much as possible using observed characteristics.
2.5 Estimating propensity scores
The propensity score is the probability of starting Work Choice given a set of observed characteristics. Observed factors that influence either participation in Work Choice or the outcomes achieved were included as variables when calculating propensity scores. ‘Appendix B: Variables used in propensity score matching’ shows the complete list of variables chosen from available DWP and HMRC datasets. These included:
- Individual characteristics (e.g., age and sex)
- Family circumstances (e.g., parental status)
- Payrolled employment history in the two years prior to referral, including the total number of days spent in employment and weekly payrolled employment flags.
- Benefit history in the two years prior to the claim start, including the total number of weeks spent receiving specific benefits, and weekly flags indicating receipt of looking for work/low-income benefits.
- Benefit sanctions history in the two years prior to referral
- History of employment programme participation in the two years prior to referral
- Geography
- Disability type
- Occupation sought (Standard Occupational Classification (SOC))
- Provider level variables that may influence participation:
- proportion of referrals to provider that did not result in a provider meeting
- proportion of referrals to provider that resulted in a provider meeting but not a start
- the average time between referral to the provider and participant start
- Local unemployment rate one year before referral
- Timing of referral to Work Choice
Propensity scores were estimated using logistic regression with the set of observed characteristics as independent variables.
2.6 Matching
Within each cohort participants were matched to the individual in the comparison group with the closest propensity score within a specified range (the caliper). This is ‘nearest neighbour’ matching. The inclusion of a caliper prevents poor matches where there is a large difference between a participant’s propensity score and the closest propensity score in the comparison group. The caliper was set at 0.1 standard deviations of the propensity scores.
The referred-only group is smaller than the Work Choice participant group. Matching with replacement was therefore required so that every participant could potentially be matched to an individual from the referred-only group. This means that individuals from the referred-only group could be matched to multiple individuals in the participant group.
See ‘Appendix D: Sensitivity checks’ for assessment of the sensitivity of impact estimates to different matching methods.
2.7 Assessing the quality of the match
2.7.1 Common support
Before estimating impacts, it is important to check the overlap in the range of propensity scores for each group (the ‘common support’). For a participant to be matched, and therefore included in the analysis, there must be an individual in the comparison pool with the same or similar propensity score. The results of this evaluation are only valid for these ‘on support’ participants. Participants that cannot be matched are excluded from the analysis. The more participants that are excluded the less representative impact estimates become.
For both the early and late cohort there was extensive overlap between the propensity scores for Work Choice participants and scores for the referred-only group (Figure 2‑5). For the early cohort 99.9% of the participant group was ‘on support’; following matching only seven of the participants (<0.1%) remained unmatched and were excluded from the analysis (Table 2‑3). For the later cohort 99.98% of the participant group was ‘on support’; following matching only four of participants (<0.1%) remained unmatched and were excluded from the analysis (Table 2‑4).
On average individuals in the early cohort referred-only group were matched to six participants. The maximum number of participants an individual in the referred-only group was matched to was 73 (Table 2‑3). In the later cohort, on average, individuals in the referred-only group were matched to four participants. The maximum number of participants an individual in the referred-only group was matched to was 74 (Table 2‑4).
Figure 2‑5: Propensity scores for work choice participants and the unmatched referred-only group for a) the early cohort, and b) the later cohort.
a.
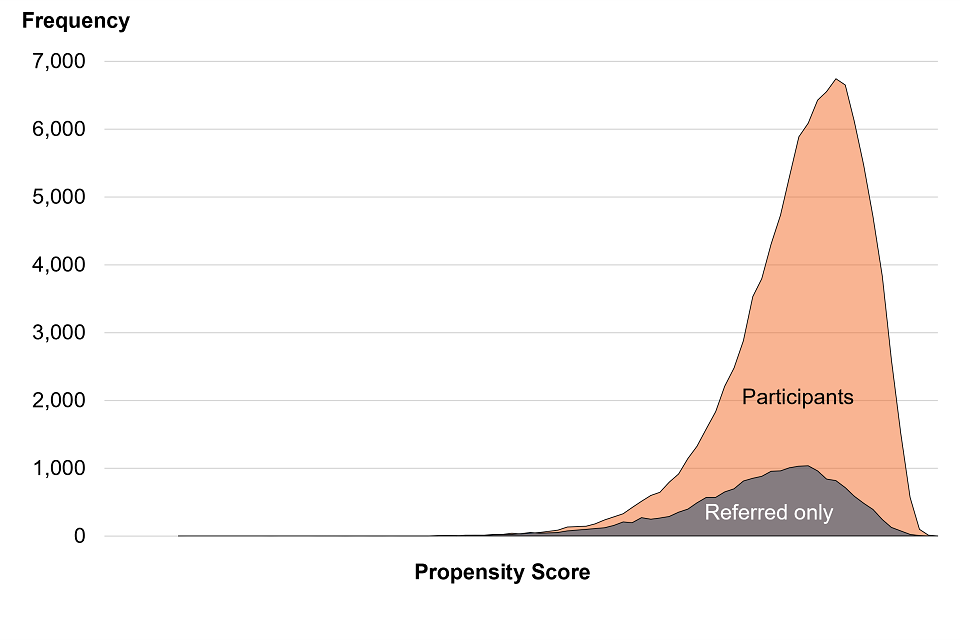
b.
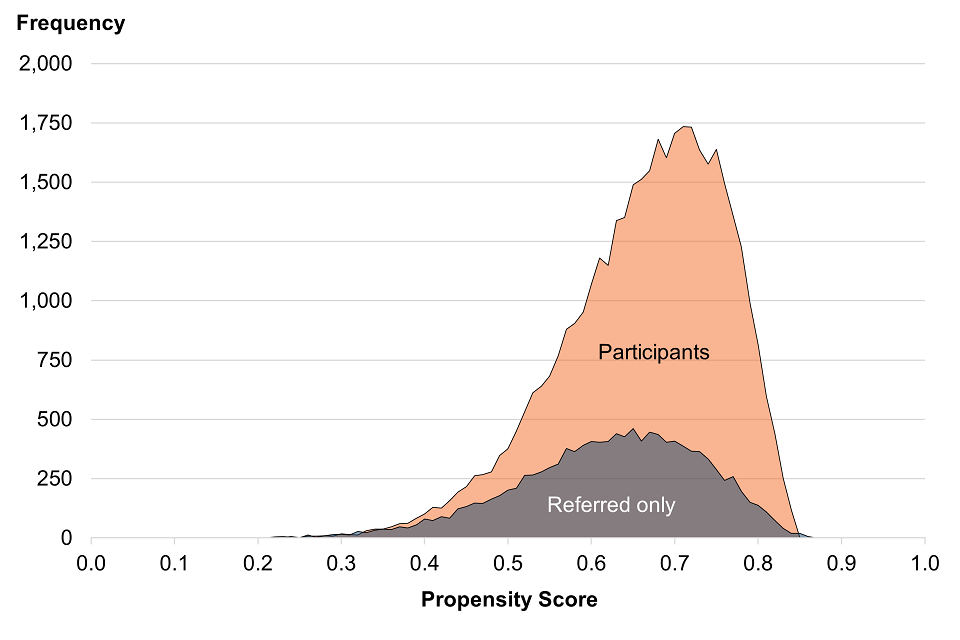
Table 2‑3: The size of the early cohort participant and referred-only groups before and after matching.
| Matching group | Size before matching | Size after matching | Max replacement | Mean replacement | Proportion on support |
|---|---|---|---|---|---|
| Participant | 104, 221 | 104, 217 | N/A | N/A | >99.99% |
| Referred-only | 19,060 | 16,964 | 73 | 6 | N/A |
Table 2‑4: The size of the later cohort participant and referred-only groups before and after matching.
| Matching group | Size before matching | Size after matching | Max replacement | Mean replacement | Proportion on support |
|---|---|---|---|---|---|
| Participant | 40,617 | 40,609 | N/A | N/A | 99.98% |
| Referred-only | 12, 207 | 9,740 | 74 | 4 | N/A |
2.7.2 Variable balance
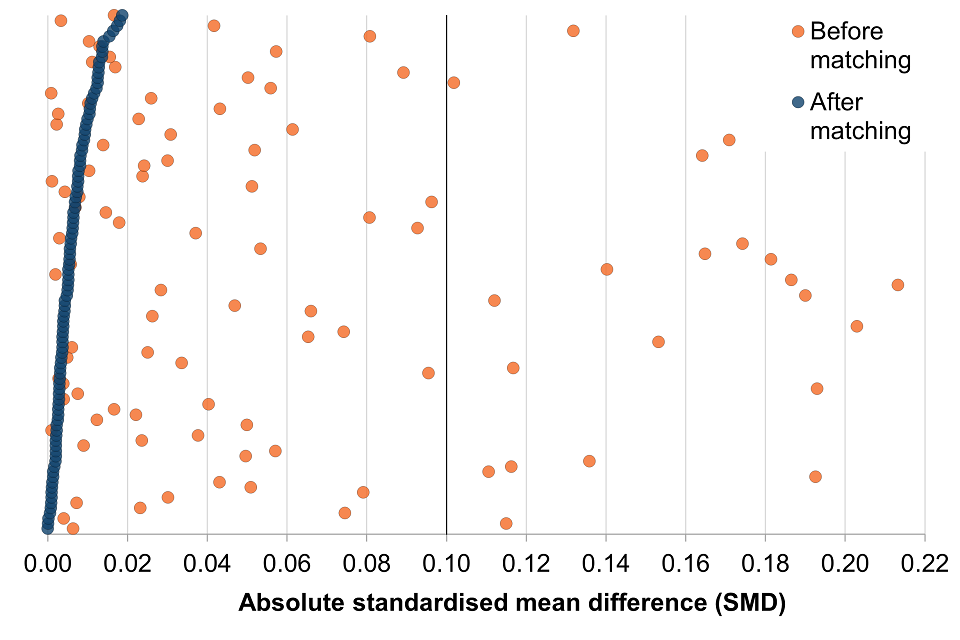
After matching, the characteristics of the matched comparison group should be similar to, or ‘balanced’ with, those of the matched participant group. If there are differences between the groups, impact estimates may not be reliable. Characteristics are compared using standardised mean differences (SMD): the difference between the means of the participant and matched comparison group divided by the square root of the mean sample variance. An SMD of zero indicates no difference between groups. An absolute SMD of below 0.1 is commonly used to indicate a good balance between groups. The absolute SMD was calculated for all variables included in the propensity score calculation.
Figure 2‑6 shows the absolute SMD before and after matching for all matching variables except the weekly payrolled employment/benefit receipt/neither flags (see ‘Appendix B: Variables used in propensity score matching’). Before matching, 22 variables had an absolute SMD of 0.1 or greater for the early cohort, and 23 variables for the later cohort. After matching the mean values are much closer and no observed characteristics for either cohort had an absolute SMD of 0.1 or greater. For both cohorts, all weekly flag variables had an absolute SMD of 0 before and after matching.
Figure 2‑6: Absolute standardised mean differences for observed characteristics between the participant and referred-only groups for a) the early cohort, and b) the later cohort
a.
b.
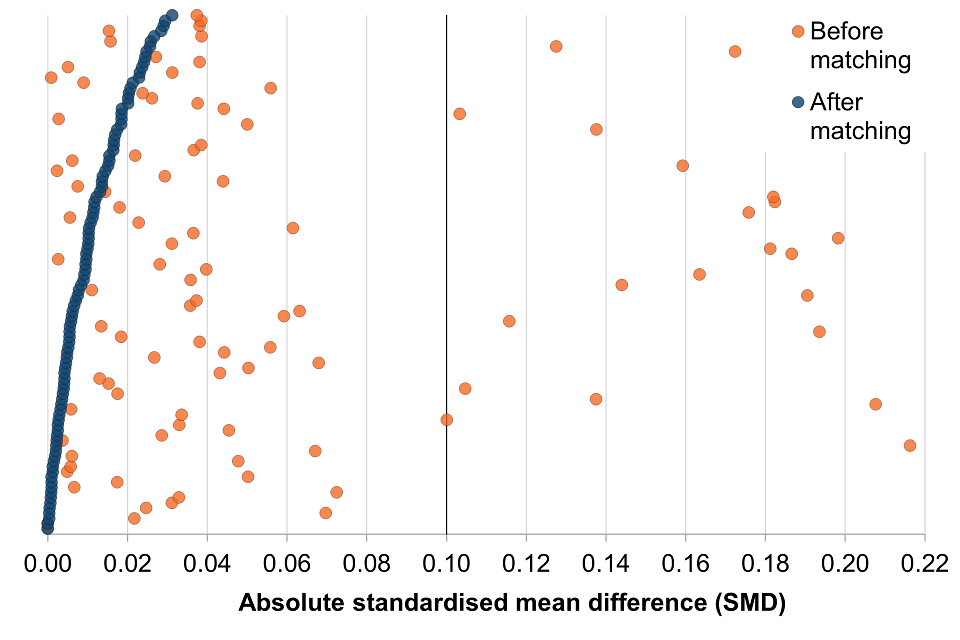
Table 8‑1 and Table 8‑2 in ‘Appendix C: Post matching balance assessment’ provide more detail on variable balance. Before matching the differences between the values of variables show that the participant and referred-only groups were not well matched. For example, prior to matching, participants spent, on average, more days in payrolled employment over the two years before referral than the referred-only group (46 more days for the early cohort and 48 more days for the later cohort). After matching the difference between the participant group and matched referral-only group is less than two days for both cohorts.
Figure 2‑7 shows that matching has minimised the difference in employment history between the participant and referred-only groups. Before matching the pre-referral employment rate of Work Choice participants is higher than that of the referred-only group. After matching the matched referred-only group has a similar pre-referral employment rate to the participant group. For all weeks pre-referral the confidence interval of the difference in the payrolled employment rate between matched groups includes zero.
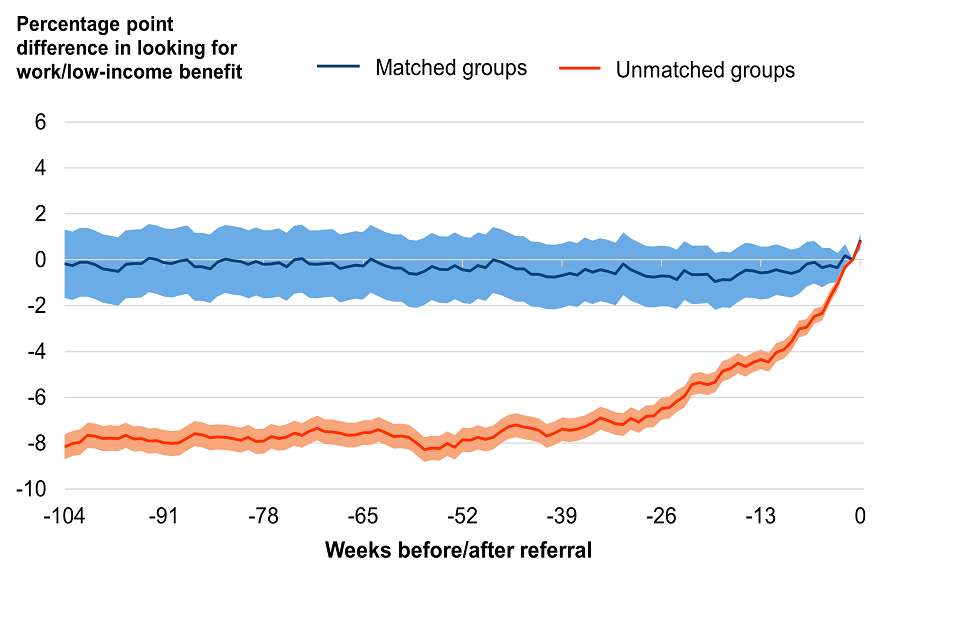
Figure 2‑8 shows that matching has also minimised the difference in looking for work/low-income benefits history between the participant and referred-only groups. Before matching the proportion of Work Choice participants receiving a looking for work/low-income benefit pre-referral was lower than that of the referred-only group. After matching the matched referred-only group had a similar proportion of people receiving a looking for work/low-income benefit pre-referral as the participant group. For all weeks pre-referral the confidence interval of the difference in looking for work/low-income benefit receipt between matched groups includes zero.
Whilst we can assess the balance of observed factors that influence participation in Work Choice and labour market outcomes, we cannot know if we have successfully matched unobserved factors such as motivation. Relevant differences between the later cohort participant and referred-only groups may therefore remain.
Figure 2‑7: The difference between the payrolled employment rate of participants and the referred-only group, before and after matching, by weeks before referral for a) the early cohort, and b) the later cohort.
a.
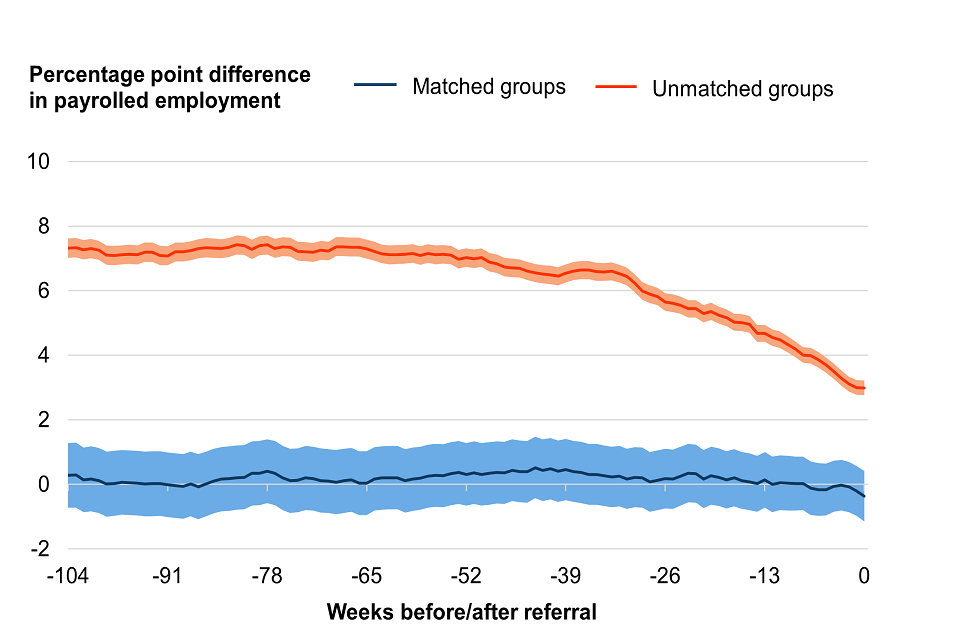
b.
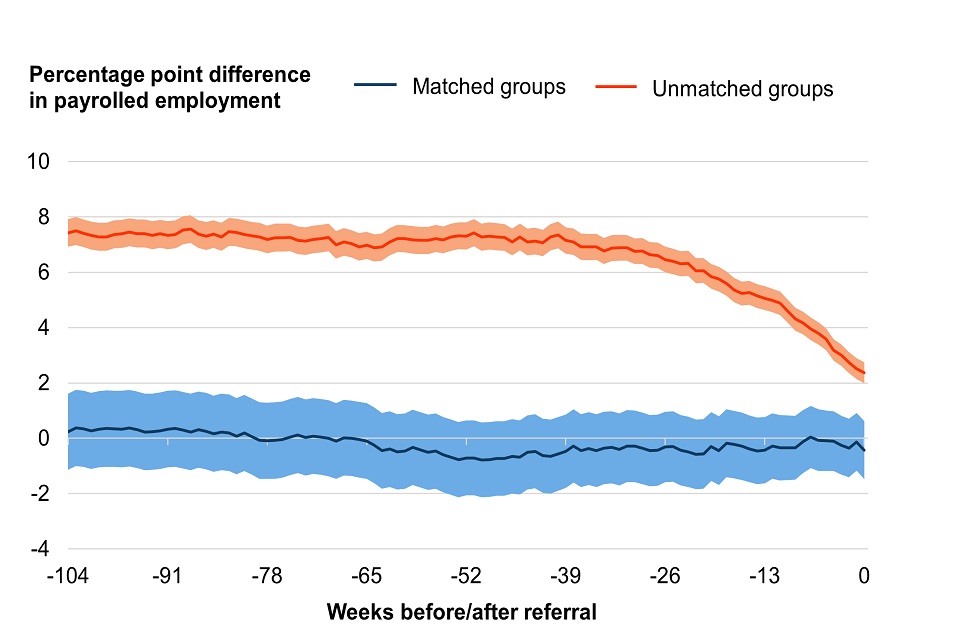
Figure 2‑8: The difference between the percentage of participants and the percentage of the referred-only group receiving a looking for work/low-income benefit, before and after matching, by weeks before referral for a) the early cohort, and b) the later cohort.
a.
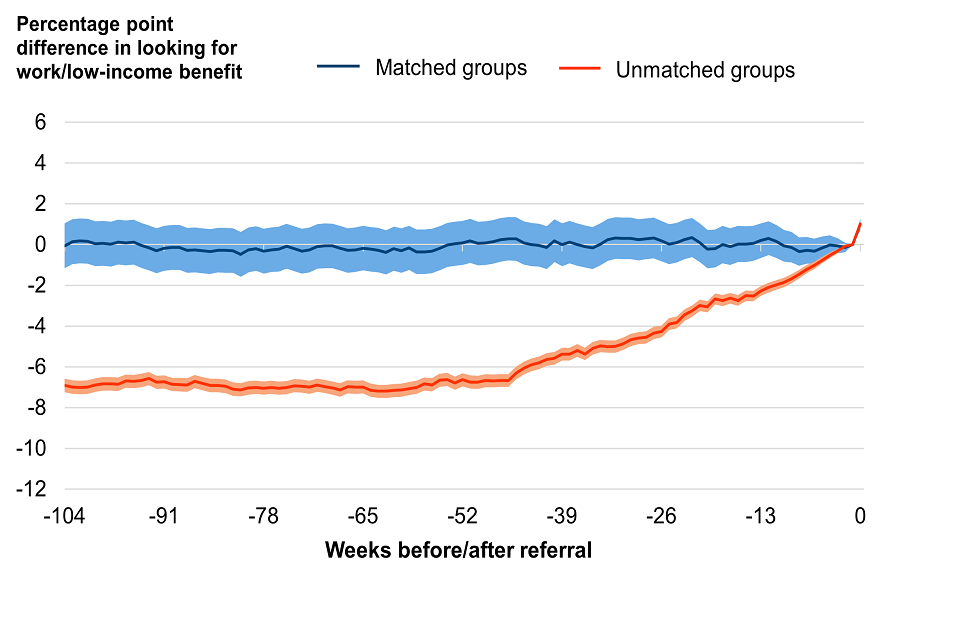
b.
2.8 Estimating impact
For each week post-referral, the proportion of individuals in each outcome state was calculated for both the matched participant and matched referred-only groups. The outcomes of the referred-only group represent the outcomes that participants would have achieved without Work Choice participation. To estimate the impact of Work Choice these outcomes are subtracted from the outcomes of the participant group.
3. Impact on employment and benefits
Estimates of impact are presented along with values showing the upper and lower confidence limits around the impact. These values define the range that 95% of the time you would expect the estimate to fall within if the evaluation were to be repeated (the 95% confidence interval (CI)).
Estimates relate specifically to the impact of Work Choice on new flow participants included in this analysis and may not be generalisable to other Work Choice participants. Furthermore, the impact of Work Choice may be affected by the wider context in which the programme operated including the labour market conditions, wider economy, DWP benefit regime, and other support available.
Caution should be taken when interpreting and using these results. The validity of the technique used in this report rests on the assumption that all the characteristics linked to a person’s participation in the programme and the outcomes of interest have been sufficiently accounted for in the analysis, either explicitly or otherwise. We carefully considered such characteristics and included variables to control for these. However, this assumption cannot be tested and depends on the data available and on the nature of the programme and its participants. Therefore, we are less confident that the results are an unbiased estimate of impact than would be the case with a well-designed and well-implemented randomised controlled trial.
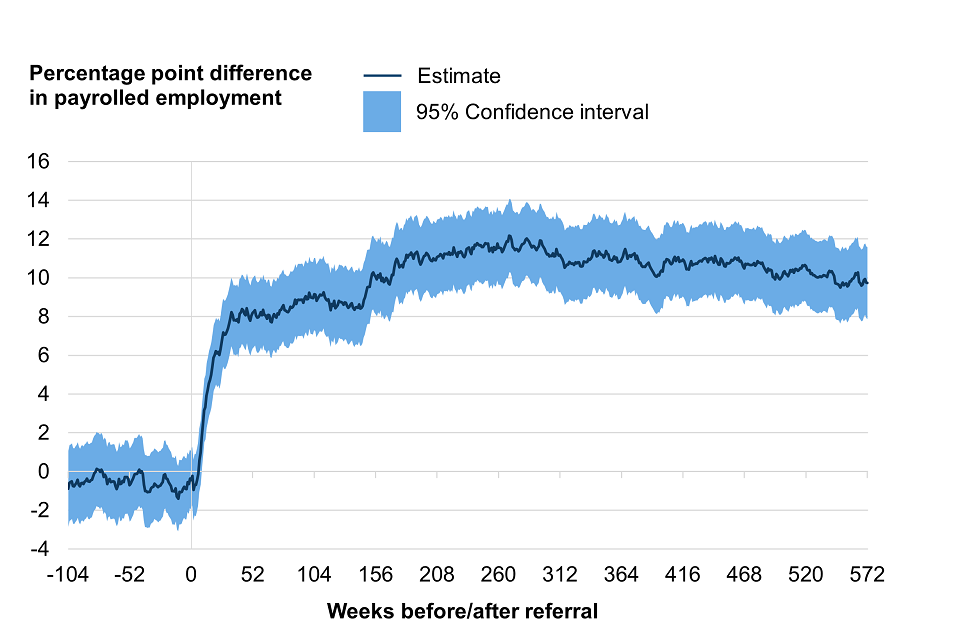
3.1 The impact of Work Choice on payrolled employment
Following referral to Work Choice the payrolled employment rate of both the participants and referred-only individuals increased for both cohorts (Figure 3‑1 and Figure 3‑2). This increase was greater for Work Choice participants than the referred-only group.
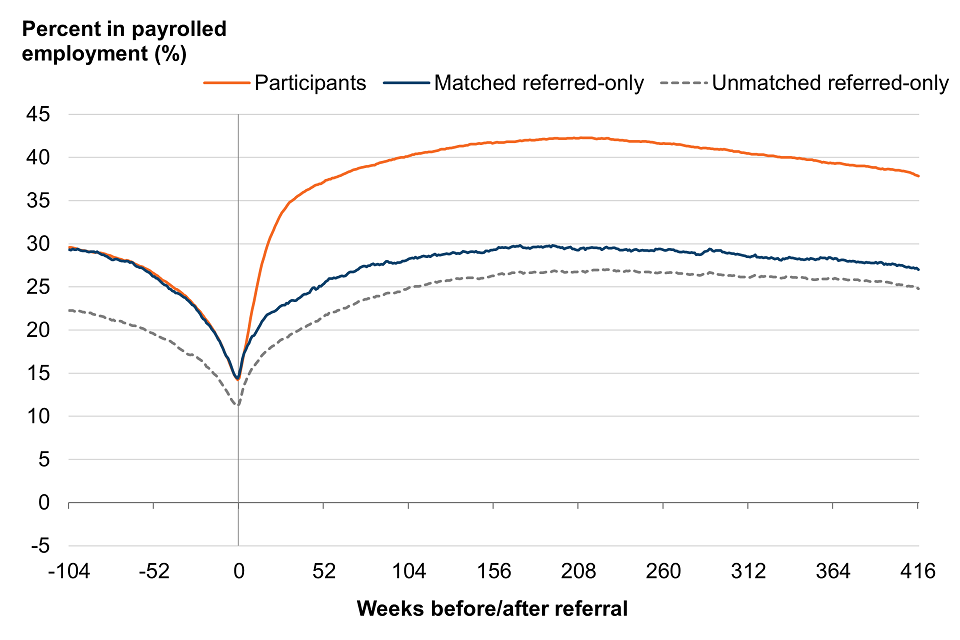
52 weeks after referral, early cohort participants were 11.8 percentage points (CI: 10.8 to 12.8) more likely to be in payrolled employment than the referred-only group (37.2% vs. 25.4%, Figure 3‑1 b). This increased likelihood of employment slowly declined over the remainder of the tracking period, but after 416 weeks Work Choice participants were still 10.9 percentage points (CI: 9.9 to 11.8) more likely to be in employment than the matched comparison group (37.9% vs 27.0%, Figure 3‑1 b). On average participants spent 337 more days (CI: 314 to 359) in payrolled employment (11.5 percentage points, CI: 10.8 to 12.3) over that time.
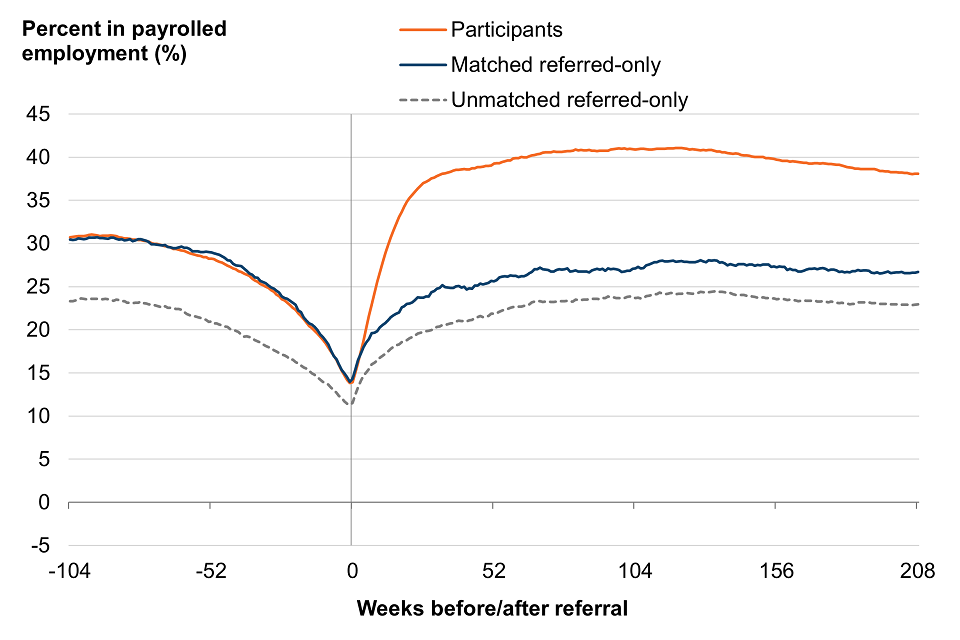
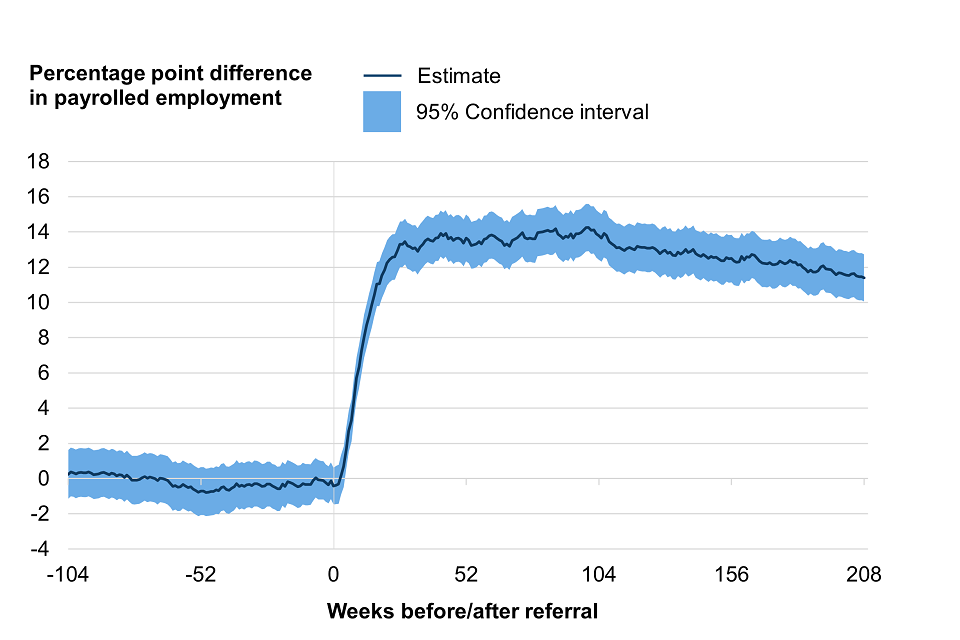
52 weeks after referral to Work Choice, later cohort participants were 13.7 percentage points (CI: 12.3 to 15.0) more likely to be in payrolled employment than the referred-only group (39.3% vs 25.6% Figure 3‑2 b). As for the early cohort this impact slightly declined over the remainder of the tracking period, but after 208 weeks Work Choice participants were still 11.4 percentage points (CI: 10.1 to 12.7) more likely to be in employment than the matched comparison group (38.1% vs 26.7% Figure 3‑2 b). On average participants spent 179 (CI: 163 to 194) more days in payrolled employment (12.3 percentage points, CI: 11.2 to 13.3) over that time.
Figure 3‑1: a) The percentage of the early cohort participant and matched referred-only group in payrolled employment by weeks after referral. b) The difference between the payrolled employment rate of the early cohort participants and matched referred-only group by week after referral. This difference is the impact of Work Choice.
a.
b.
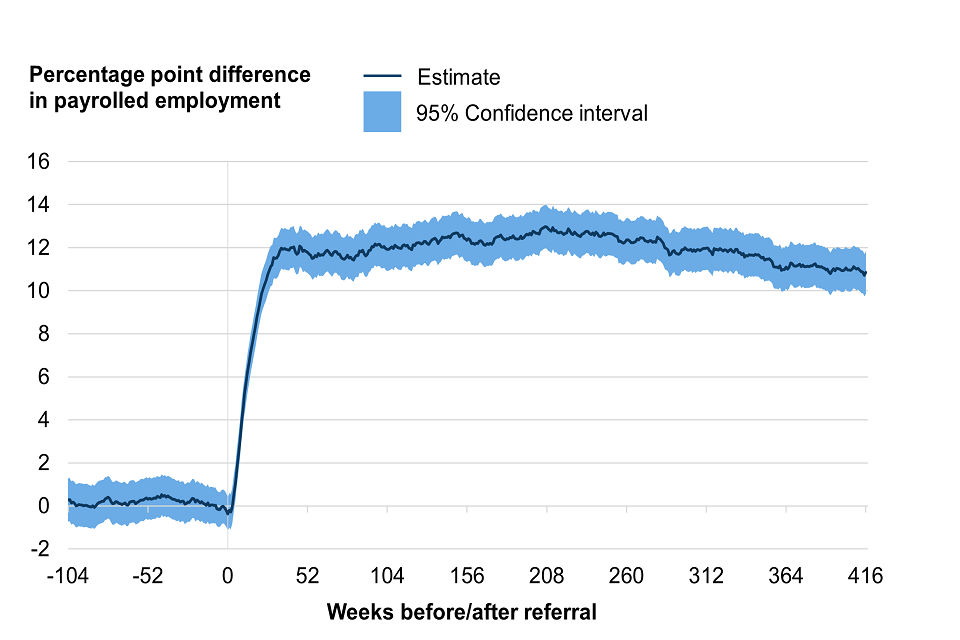
Figure 3‑2: a) The percentage of the later cohort participants and referred-only comparison group in payrolled employment by weeks after referral. b) The difference between the payrolled employment rate of the later cohort participants and matched referred-only group by week after referral. This difference is the impact of Work Choice.
a.
b.
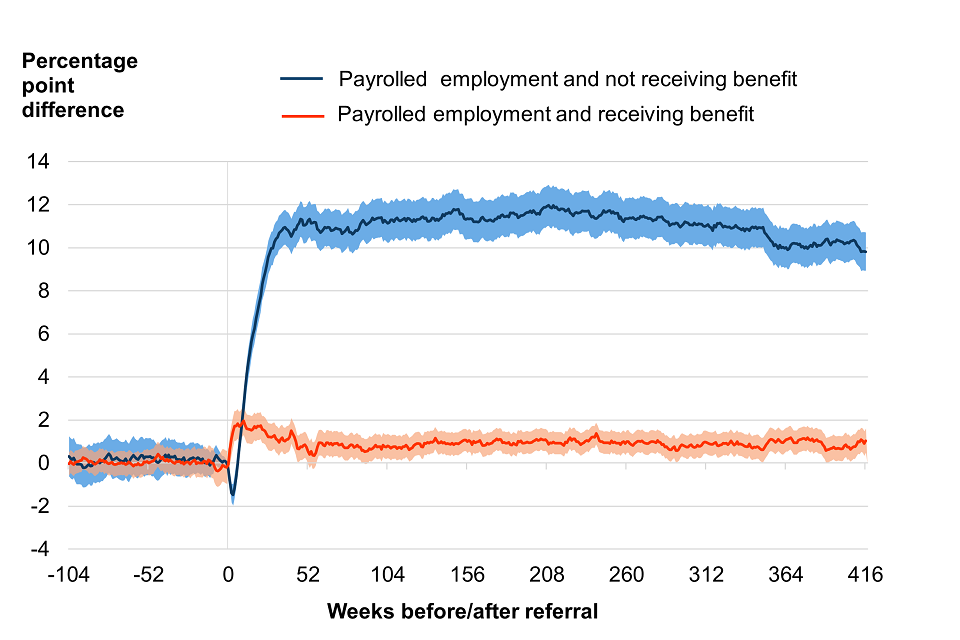
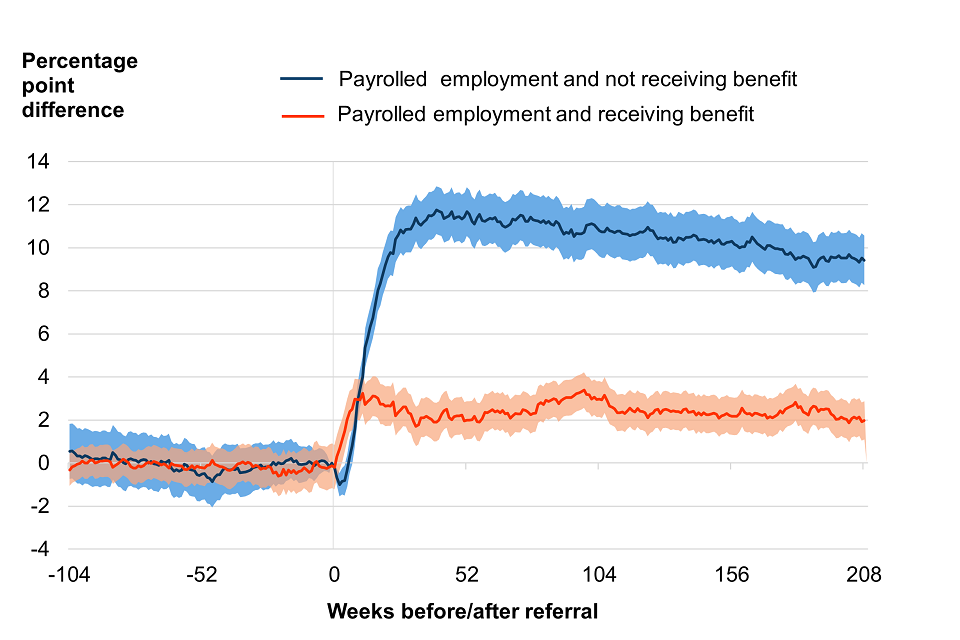
Payrolled employment figures include people receiving looking for work/low-income benefits whilst in payrolled employment. Figure 3‑3 shows the impact on payrolled employment whilst not receiving looking for work/low-income benefits, and the impact on payrolled employment whilst receiving looking for work/low-income benefits. This shows that some of the impact on payrolled employment is due to employment where individuals are also in receipt of looking for work/low-income benefits.
Figure 3‑3: The difference between the proportion of participants and proportion of the referred-only comparison group in payrolled employment split by in payrolled employment and not receiving looking for work/low-income benefit (blue line), and payrolled employment and receiving looking for work/low-income benefits (orange line) for a) the early cohort, and b) the later cohort.
a.
b.
Payrolled employment does not include self-employment, and overall employment rates (i.e., the proportion in either payrolled employment or self-employment) for both the participant and referred-only groups may be different from the payrolled employment rates. If the self-employment rates of the participant and referred-only groups are the same, then the estimate of the impact of Work Choice on overall employment is the same as presented here. If the self-employment rates differ between the two groups, then the impact on overall employment may be higher or lower than presented here.
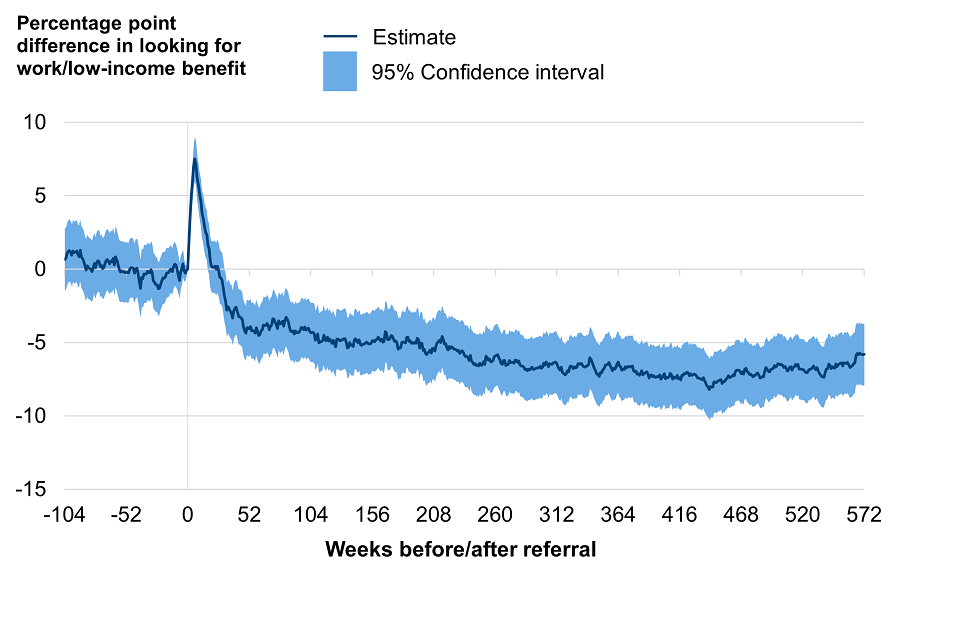
3.2 The impact of work choice on looking for work/low-income benefit receipt
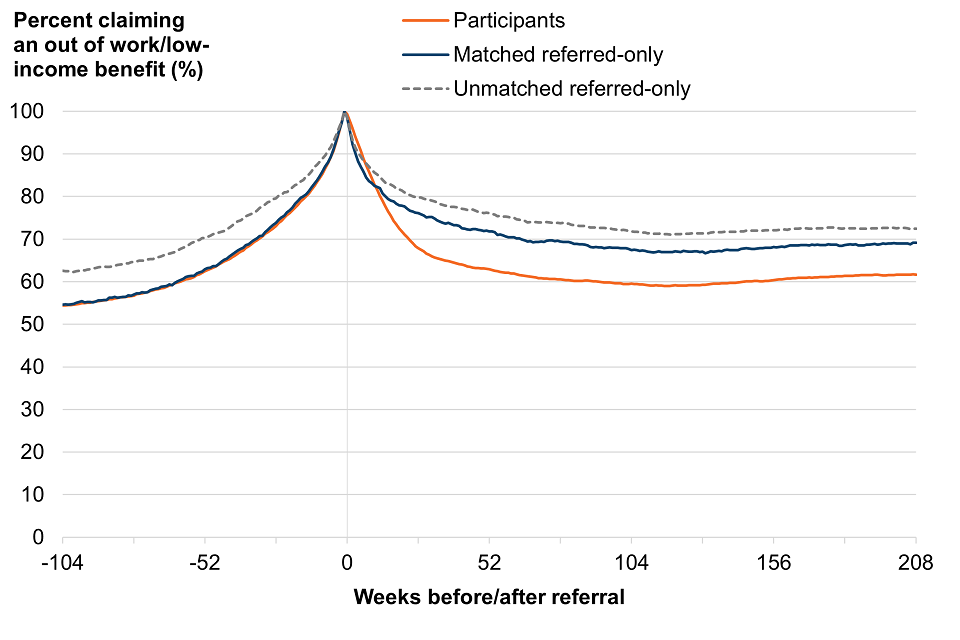
Over the years following referral, the proportion of people receiving a looking for work/low-income benefit fell for both the Work Choice participant and matched referred-only groups (Figure 3‑4 and Figure 3‑5). This decrease was greater for Work Choice participants than the referred-only groups.
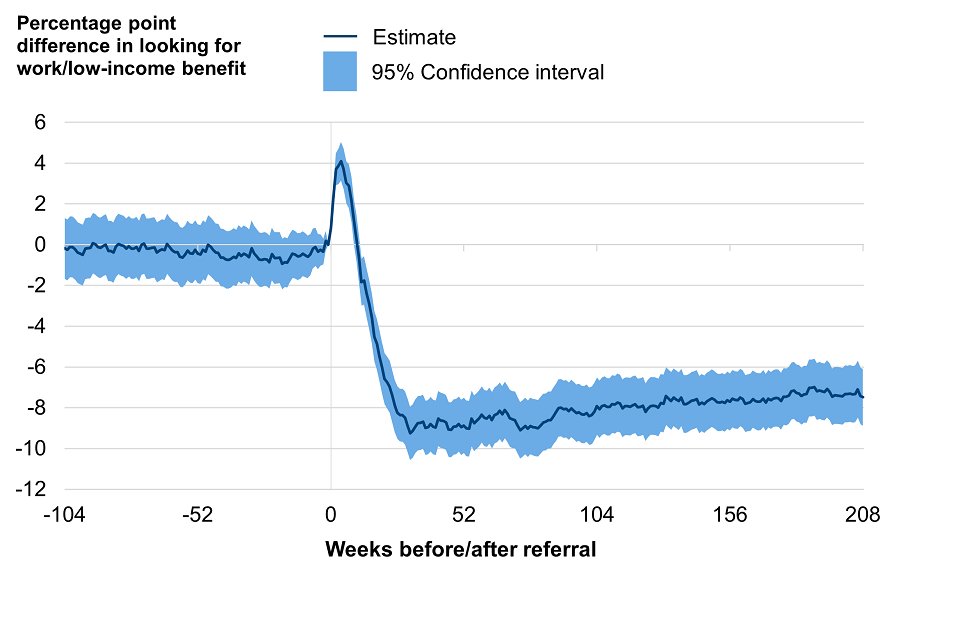
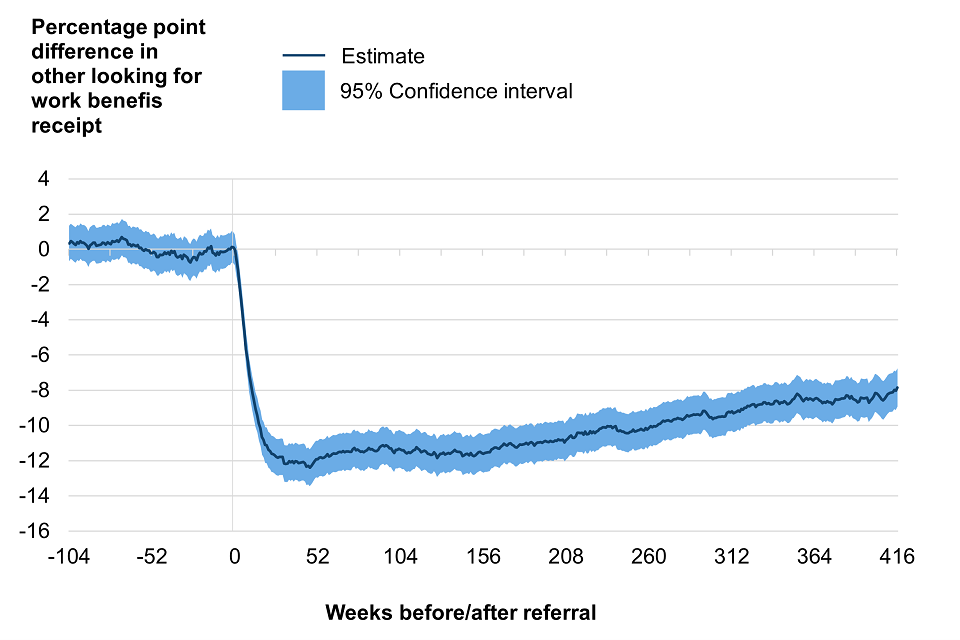
For the first 12 weeks following referral, early-cohort participants were more likely to be receiving a looking for work/low-income benefit.[footnote 5] However, for the remainder of the tracking period participants were less likely than the comparison group to be receiving a looking for work/low-income benefit. 52 weeks after referral to the programme, participants were 7.9 percentage points less likely (CI: -8.9 to -6.9) to be receiving a looking for work/low-income benefit (61.2% vs 69.1% Figure 3‑4 b). This impact declined slightly over the tracking period, but after 416 weeks early cohort Work Choice participants were still 7.3 percentage points less likely (CI: ‑8.4 to -6.2) to be receiving a looking for work/low-income benefit than the referred-only group (50.2% vs 57.5% Figure 3‑4 b). On average participants spent 215 fewer days (CI: -238 to -191) receiving a looking for work/low-income benefit (-7.4 percentage points, CI: -8.2 to ‑6.5) over that time.
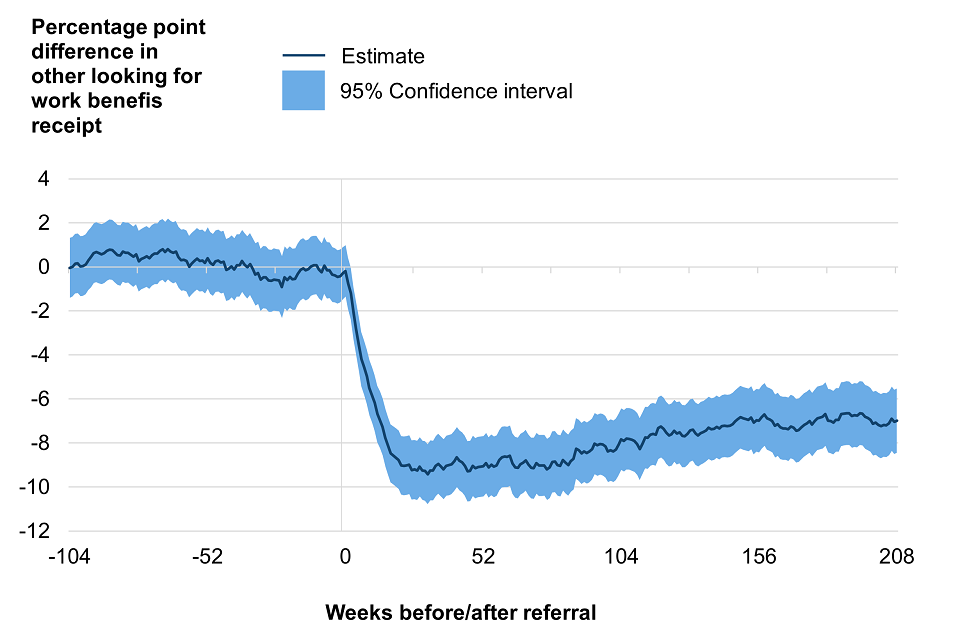
A similar pattern was seen for the later cohort. For the first ten weeks following referral, participants were more likely to be receiving a looking for work/low-income benefit.[footnote 6] After this, participants were less likely to be receiving a looking for work/low-income benefit. 52 weeks after referral to the programme participants were 8.9 percentage points less likely (CI: -10.2 to -7.5) to be receiving a looking for work/low-income benefit (63.0% vs 71.8% Figure 3‑5 b). This impact fell slightly but after 208 weeks later cohort Work Choice participants were still 7.5 percentage points less likely (CI: -8.9 to -6.1) to be receiving a looking for work/low-income benefit than the referred-only group (61.7% vs 69.2% Figure 3‑5 b). On average participants spent 106 fewer days (CI: -121 to -90) receiving a looking for work/low-income benefit (-7.3 percentage points, CI: -8.3 to -6.2) over that time.
Figure 3‑4: a) The percentage of the early cohort participant and matched referred-only group receiving a looking for work/low-income benefit by weeks after referral. b) The difference between the proportion of the early cohort participants and matched referred-only comparison group receiving a looking for work/low-income benefit by week after referral. This difference is the impact of Work Choice.
a.
b.
Figure 3‑5: a) The percentage of the later cohort participant and matched referred-only group receiving a looking for work/low-income benefit by weeks after referral. b) The difference between the proportion of the later cohort participants and matched referred-only comparison group receiving a looking for work/low-income benefit by week after referral. This difference is the impact of Work Choice.
a.
b.
The impact of Work Choice was not the same for all individuals in receipt of looking for work/low-income benefits. For the early cohort, following the first 12 weeks post referral, Work Choice participants were less likely to be receiving any looking for work/low-income benefit but were more likely to specifically be receiving JSA or UC with Searching for Work conditionality (Figure 3‑6 a). After 416 weeks the average participant had spent 81 more days receiving JSA or UC with Searching for Work conditionality than the average person in the comparison group (CI: 64 to 98).
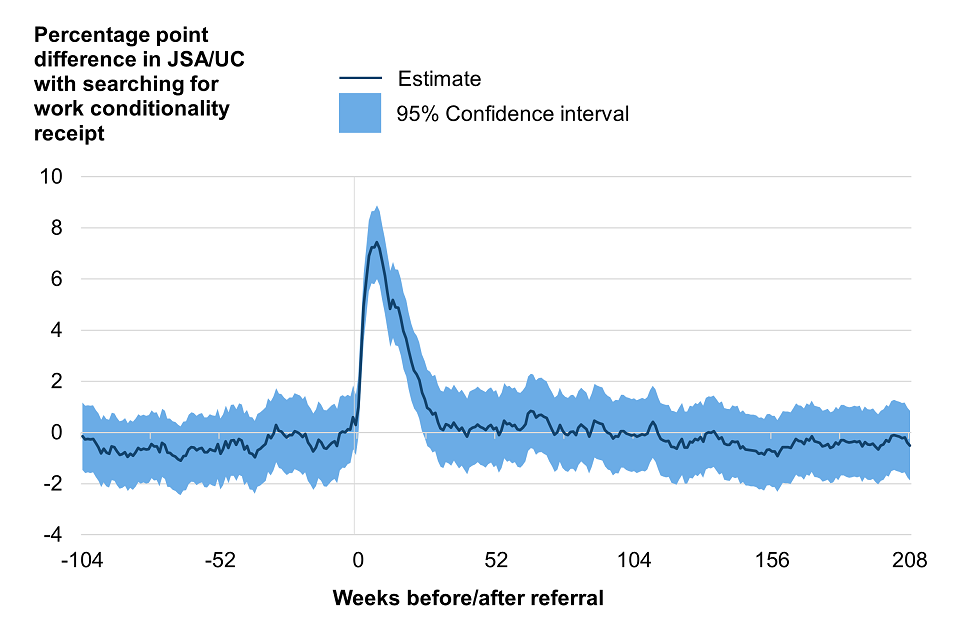
The same pattern was seen for the later cohort. Between weeks ten and 25 following referral, participants were less likely to receive any looking for work/low-income benefit but more likely to be receiving JSA or UC with Searching for Work conditionality (Figure 3‑6 b). For the remainder of the 208-week tracking period there was no impact of Work Choice on receiving JSA or UC with Searching for Work (Figure 3‑6 b).
Figure 3‑6: The difference between the proportion of the participant and matched referred-only comparison groups receiving JSA or UC with Searching for Work conditionality by week after referral for a) the early cohort and b) the later cohort.
a.
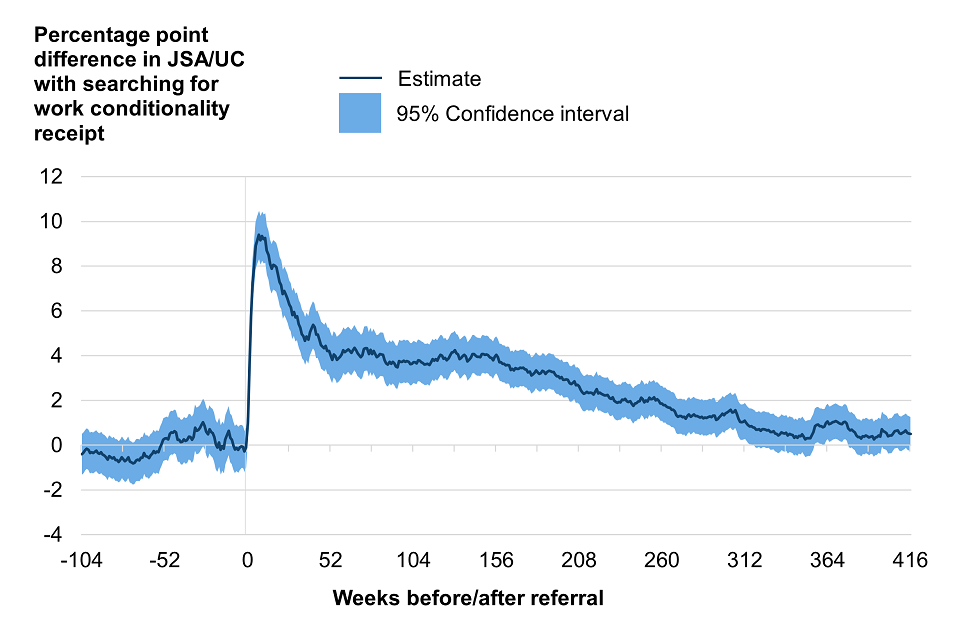
b.
There was an opposing impact on receipt of other looking for work/low-income benefits. Work Choice participants were less likely than those in the referred-only group to be receiving other looking for work/low-income benefits (Figure 3‑7). After 416 weeks, the average Work Choice participant in the early cohort had spent 296 fewer days in receipt of other looking for work/low-income benefits (CI: -272 to -320). After 208 weeks, the average Work Choice participant in the later cohort had spent 112 fewer days in receipt of other Looking for work/low-income benefits (CI: -96 to -129).
Figure 3‑7: The difference between the proportion of the early cohort participant and matched referred-only comparison groups receiving other looking for work/low-income benefits by week after referral for a) the early cohort and b) the later cohort.
a.
b.
This was driven by a decrease in receipt of ESA. At referral 79% of participants and 81% of the matched comparison group in the early cohort, and not receiving JSA or UC with Searching for Work conditionality, were receiving ESA. At referral 90% of participants and 88% of the matched comparison group in the later cohort, and not receiving JSA or UC with Searching for Work conditionality, were receiving ESA.
416 weeks after referral to Work Choice early cohort participants had spent on average 264 fewer days in receipt of ESA than comparison individuals (CI: -241 to -288), and after 208 weeks later cohort participants had spent on average 98 fewer days in receipt of ESA than comparison individuals (CI: -83 to -113).
3.2.1 Impact on DLA/PIP
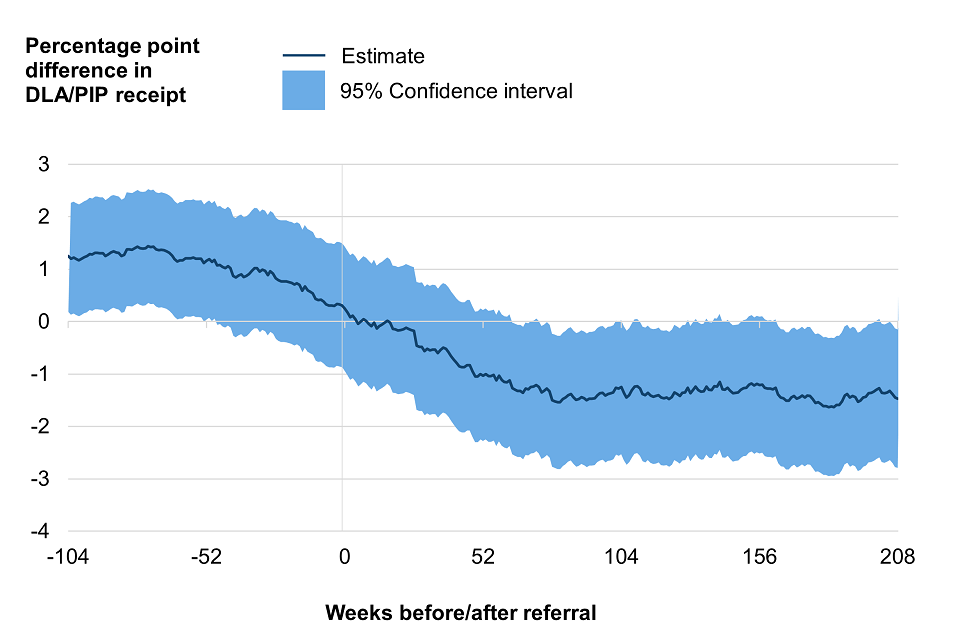
DLA/PIP are not income related benefits and can be claimed regardless of employment status. Work Choice was not designed to have an impact on receipt of these benefits but an association between ESA and DLA/PIP receipt has previously been observed. Work Choice could therefore have an indirect effect on DLA/PIP.
A positive impact would suggest that Work Choice participation leads to a rise in take up; Work Choice support may have better helped people understand their eligibility to disability benefits. A negative impact would suggest that Work Choice leads to a reduction in disability benefit, possibly via a reduction in ESA receipt.
Figure 3‑8a shows that for the early cohort there was no statistically significant impact on PIP/DLA receipt after referral. Figure 3‑8b shows that for the later cohort there is a small impact of about -1.5 percentage points for some months following referral. However, DLA/PIP receipt was not well balanced prior to referral.
Figure 3‑8: The difference between the proportion of the participant and matched group receiving DLA or PIP by week after referral for a) the early cohort and b) the later cohort.
a.
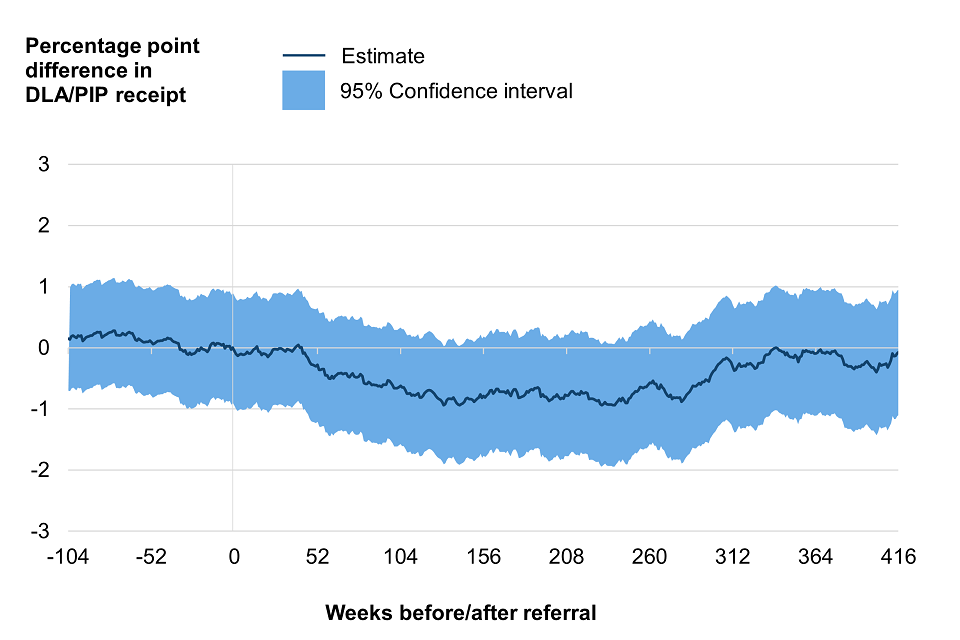
b.
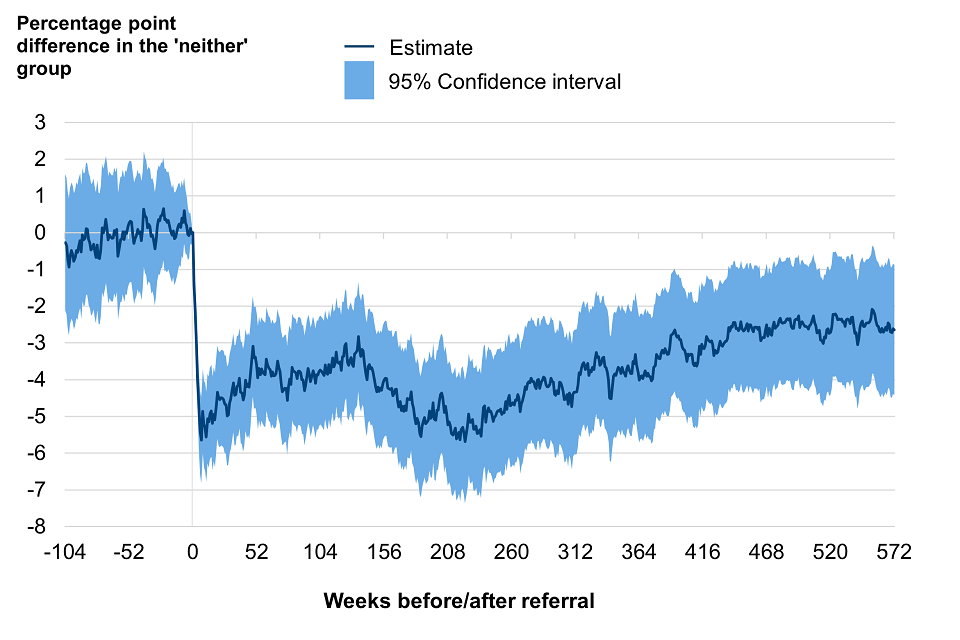
3.3 The impact on ‘neither’
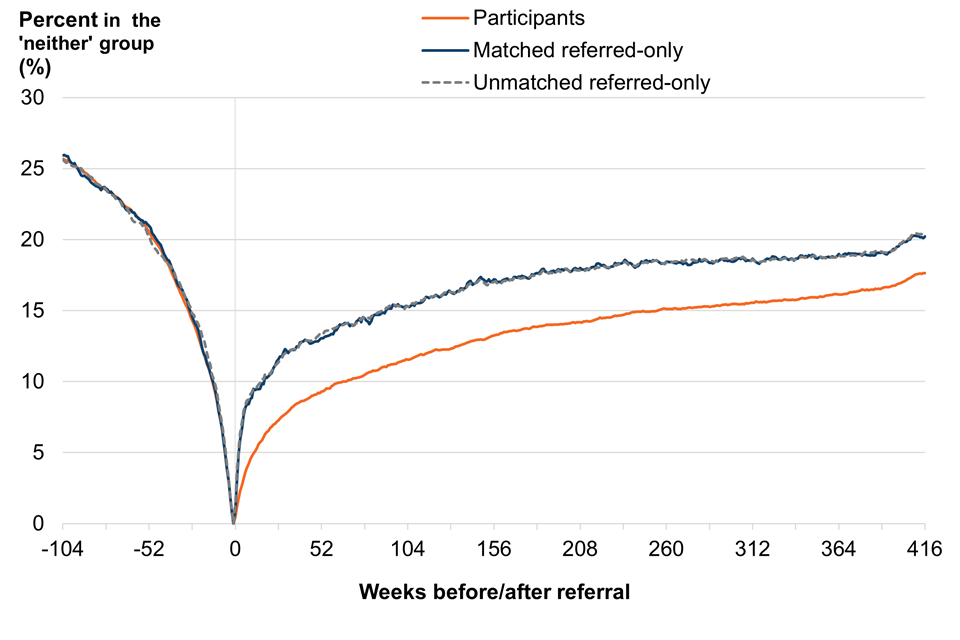
The ‘neither’ outcome consists of people not in payrolled employment nor receiving looking for work/low-income benefits. Following referral to Work Choice, the proportion of both the participants and referred-only individuals in the ‘neither’ outcome increased for both cohorts (Figure 3‑9a and Figure 3‑10a). This increase was greater for the comparison group than for Work Choice participants.
52 weeks after referral early cohort participants were 3.8 percentage points less likely (CI: -4.5 to -3.0) to be in the ‘neither’ outcome than the comparison group (9.3% vs 13.0% Figure 3‑9 b).This impact slowly declined over the remainder of the tracking period but after 416 weeks, Work Choice participants were still 2.6 percentage points less likely (CI: -3.5 to -1.7) to be in the ‘neither’ outcome than the matched comparison group (17.6% 20.2% Figure 3‑9 b). On average participants spent 101 fewer days (CI: -118 to -84) in the ‘neither’ outcome (-3.5 percentage points, CI: -4.0 to -2.9) over that time.
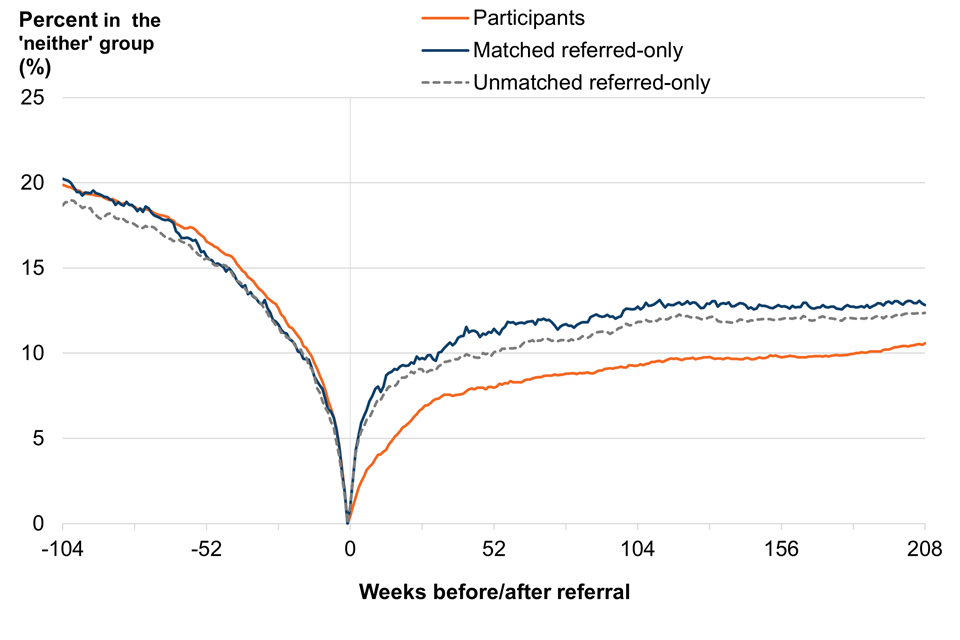
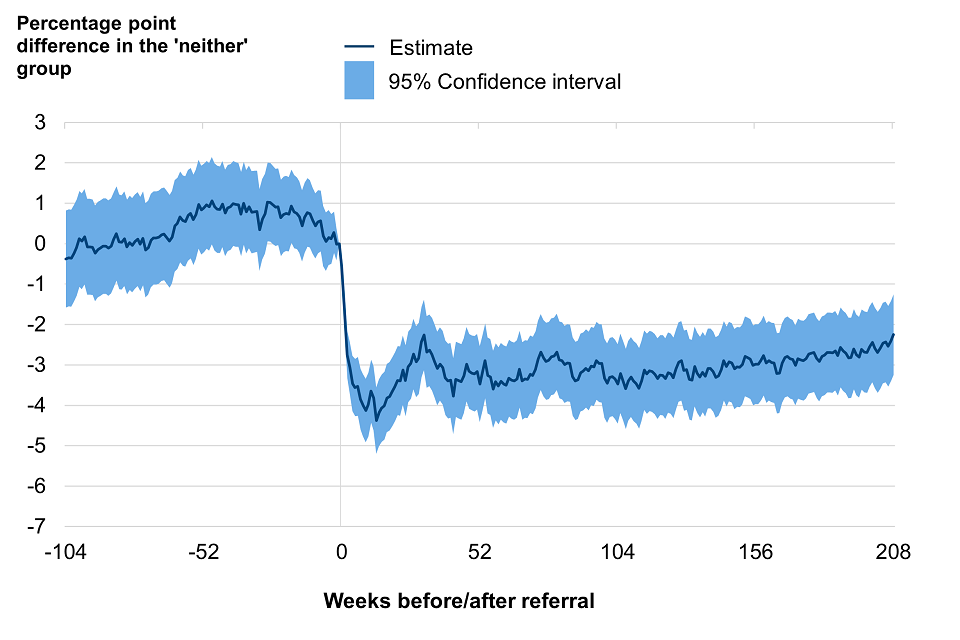
The results for the later cohort were similar. 52 weeks after referral, later cohort participants were 3.5 percentage points less likely (CI: -4.4 to -2.5) to be in the ‘neither’ outcome (8.0% vs 11.4% Figure 3‑10 b). This impact slowly declined over the remainder of the tracking period, but after 208 weeks Work Choice participants were still 2.3 percentage points less likely (CI: -3.2 to -1.3) to be in the ‘neither’ outcome (10.6% vs 12.8% Figure 3‑10 b). On average participants spent 45 fewer days (CI: -55 to -35) in the ‘neither’ outcome (-3.1 percentage points, CI: -3.8 to -2.4) over that time.
Figure 3‑9: a) The percentage of the early cohort participants and matched comparison group in the ‘neither’ outcome by weeks after referral. b) The difference between the percentage of the early cohort participants and matched comparison group in the ‘neither’ outcome. This difference is the impact of Work Choice.
a.
b.
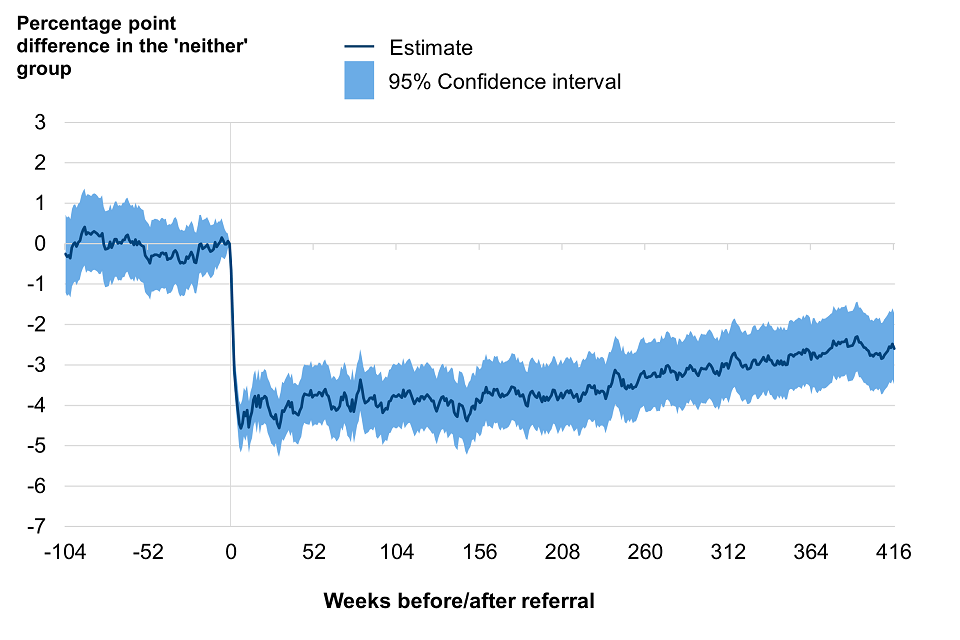
Figure 3‑10: a) The percentage of the later cohort participants and matched comparison group in the ‘neither’ outcome by weeks after referral. b) The difference between the percentage of the early cohort participants and matched comparison group in the ‘neither’ outcome. This difference is the impact of Work Choice.
a.
b.
3.4 How long will impacts last?
The early cohort of referrals from October 2010 to March 2015 can be tracked for eight years (416 weeks), which is considerably longer than for most DWP programme evaluations. By looking only at referrals up to March 2012 we can track outcomes for 11 years (572 weeks). For this cohort there was still an impact of Work Choice on labour market outcomes after 11 years. This suggests that the impact of Work Choice will be sustained for longer than the eight years observed for the later cohort.
After 11 years, participants were 9.7 percentage points more likely (CI: 7.9 to 11.6) to be in payrolled employment than the matched comparison group (35.1% vs 25.3% Figure 3‑11), and the average participant had spent 398 more days (CI: 341 to 455) in payrolled employment (9.9 percentage points, CI: 8.5 to 11.3) over this time.
Figure 3‑11: The difference between the payrolled employment rate of the participant and matched comparison groups referred before 5th April 2012, by week after referral. This difference is the impact of Work Choice.
Additionally, participants were 5.8 percentage points less likely (CI: ‑7.9 to -3.7) to be receiving a looking for work/low-income benefit than referred-only individuals (51.6% vs 57.4% Figure 3‑12), and after 11 years the average participant had spent 221 fewer days (CI: ‑282 to ‑160) in receipt of looking for work/low-income benefits (-5.5 percentage points, CI: -7.0 to -4.0) over this time.
Figure 3‑12: The difference between the participant and comparison groups receiving a looking for work/low-income benefit referred before 5th April 2012 by week after referral. This difference is the impact of Work Choice.
There was also an impact on the proportion who were in the ‘neither’ outcome. After 572 weeks participants were 2.7 percentage points less likely (CI: ‑4.4 to ‑0.9) to be in the ‘neither’ outcome than referred-only individuals (20.4% vs 23% Figure 3‑13), and had on average spent 149 fewer days (CI: -194 to -105) in the ‘neither’ outcome (-3.7 percentage points, CI: -4.8 to -2.6) over this time.
Figure 3‑13: The difference between the participant and comparison groups in the ‘neither’ outcome referred before 5th April 2012 by week after referral. This difference is the impact of Work Choice.
3.5 Subgroup analysis
The impact of Work Choice on subgroups of participants was also investigated. This allowed us to investigate if impacts differ across participants with different characteristics. Specifically, we split participants by sex, age-group, and benefit at referral. This was done by including only individuals (both participant and referred-only) who met the specific subgroup criteria in the analysis. For each subgroup matching was performed following the method described in sections ‘2.5 Estimating propensity scores’ and ‘2.6 Matching’.
Across all groups analysed, at the end of the tracking period (208 or 416 weeks), Work Choice has a positive impact on payrolled employment, and a negative impact on looking for work/low-income benefit receipt. However, there are differences between subgroups in the magnitude of impacts. There is a larger negative impact on looking for work/low-income benefits, and a larger positive impact on payrolled employment, for those receiving benefits other than JSA or UC with searching for work conditionality at referral. The impacts on the ‘neither’ outcome are more mixed and confidence intervals are large.
Subgroup analysis is discussed in more detail in ‘Appendix E: Subgroup analysis’.
3.6 Summary of results
Work Choice had an impact on both payrolled employment and looking for work/low-income benefit receipt. Compared to referred-only individuals Work Choice participants were more likely to be in payrolled employment and less likely to be receiving looking for work/low-income benefits over the years following referral (Table 3‑1and Table 3‑2). Movement off a looking for work/low-income benefit is normally due to moving into employment where the hours worked, or earnings gained, are enough to lose looking for work/low-income benefit entitlement.
Work Choice participants were also less likely to be in the ‘neither’ outcome (neither in payrolled employment nor receiving looking for work/low-income benefits) (Table 3‑3). We do not know the composition of this group. This group includes, among others, individuals in self-employment and not receiving looking for work/low-income benefits, and those still looking for work but with no access to looking for work/low-income benefits. However, it will also include individuals who have left the labour market and are not receiving looking for work/low-income benefits, for example due to education/training, retirement, or caring responsibilities.
One possible explanation of the impact of Work Choice on this group is that Work Choice might cause some participants who would otherwise have been self-employed to become PAYE employees instead. Even if this is the case, and this represents a reduction in self-employment, there is still a positive impact on total employment (PAYE employment plus self-employment). Another possible explanation is that Work Choice prevented some individuals from leaving the labour market and they instead either found employment or were searching for work and entitled to looking for work/low-income benefits.
The impacts of Work Choice differed in magnitude between the two cohorts. This could reflect several things including different labour market contexts, differences in the characteristics of the cohorts, or possibly increasing effectiveness of the programme over time. Subgroup analysis also shows that the impact of Work Choice differs between participants with different characteristics.
Overall Work Choice had a positive impact on labour market outcomes through additional time in employment, less time receiving looking for work/low-income benefits, and less time in the ‘neither’ outcome (Table 3‑1 to Table 3‑3, Figure 3‑14). Analysis of the earliest referrals suggests that these impacts will be sustained for several more years.
Table 3‑1: The impact of work choice on payrolled employment, and total additional days spent in payrolled employment, by year after referral. Confidence intervals in parentheses.
| Years after referral | Early cohort impact at 416 weeks (percentage point) | Early cohort additional days after 416 weeks | Later cohort impact at 208 weeks (percentage point) | Later cohort additional days after 208 weeks |
|---|---|---|---|---|
| 1 | 11.8 (10.8-12.8) | 31 (29-34) | 13.7 (12.3 – 15.0) | 38 (34 - 42) |
| 2 | 11.9 (10.9-12.9) | 74 (68-80) | 13.8 (12.4 - 15.1) | 88 (80 - 96) |
| 3 | 12.3 (11.3-13.4) | 119 (110-128) | 12.5 (11.1 - 13.8) | 135 (123 - 147) |
| 4 | 13.0 (11.9-14) | 164 (153-176) | 11.4 (10.1 - 12.7) | 179 (163 - 194) |
| 5 | 12.4 (11.4-13.4) | 210 (196-224) | ||
| 6 | 12.0 (11.0-13.0) | 254 (237-271) | ||
| 7 | 11.1 (10.1-12.1) | 296 (277-316) | ||
| 8 | 10.9 (9.9-11.8) | 337 (314-359) |
Table 3‑2: The impact of work choice on looking for work/low-income benefit receipt, and total additional days spent receiving looking for work/low-income benefits by year after referral. Confidence intervals in parentheses.
| Years after referral | Early cohort impact at 416 weeks (percentage point) | Early cohort additional days after 416 weeks | Later cohort impact at 208 weeks (percentage point) | Later cohort additional days after 208 weeks |
|---|---|---|---|---|
| 1 | -7.9 (-8.9 - -6.9) | -13 (-16 - -10) | -8.9 (-10.2 - -7.5) | -19 (-23 - -16) |
| 2 | -7.7 (-8.7 - -6.6) | -40 (-46 - -35) | -7.9 (-9.3 - -6.5) | -50 (-58 - -43) |
| 3 | -7.6 (-8.7 - -6.5) | -68 (-77 - -60) | -7.7 (-9.1 - -6.3) | -79 (-90 - -67) |
| 4 | -8.2 (-9.3 - -7.1) | -97 (-108 - -85) | -7.5 (-8.9 - -6.1) | -106 (-121 - -90) |
| 5 | -8.3 (-9.3 - -7.2) | -127 (-141 - -112) | ||
| 6 | -8.1 (-9.2 - -7.0) | -157 (-174 - -139) | ||
| 7 | -7.4 (-8.5 - -6.3) | -186 (-207 - -165) | ||
| 8 | -7.3 (-8.4 - -6.2) | -215 (-238 - -191) |
Table 3‑3: The impact of work choice on the ‘neither’ outcome, and total additional days spent in the ‘neither’ by year after referral. Confidence intervals in parentheses.
| Years after referral | Early cohort impact at 416 weeks (percentage point) | Early cohort additional days after 416 weeks | Later cohort impact at 208 weeks (percentage point) | Later cohort additional days after 208 weeks |
|---|---|---|---|---|
| 1 | -3.8 (-4.5 - -3.0) | -15 (-16 - -13) | -3.5 (-4.4 - -2.5) | -12 (-14 - -10) |
| 2 | -3.8 (-4.6 - -3.0) | -29 (-32 - -25) | -3.5 (-4.5 - -2.5) | -24 (-28 - -19) |
| 3 | -3.9 (-4.8 - -3.1) | -43 (-49 - -37) | -3.0 (-4.0 - -2.0) | -35 (-42 - -28) |
| 4 | -3.8 (-4.7 - -3.0) | -57 (-64 - -49) | -2.3 (-3.2 - -1.3) | -45 (-55 - -35) |
| 5 | -3.3 (-4.2 - -2.4) | -70 (-80 - -60) | ||
| 6 | -3.1 (-3.9 - -2.2) | -81 (-93 - -69) | ||
| 7 | -2.9 (-3.7 - -2.0) | -92 (-106 - -77) | ||
| 8 | -2.6 (-3.5 - -1.7) | -101 (-118 - -84) |
Figure 3‑14: Cumulative additional days spent a) in payrolled employment b) receiving a looking for work/low-income benefit c) in the ‘neither’ outcome, by year after referral
a.
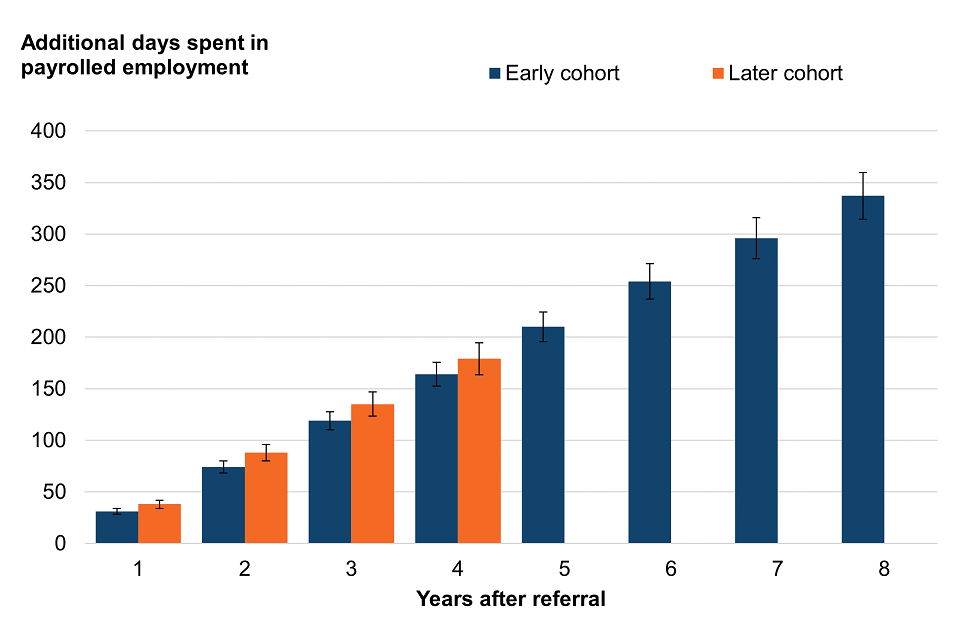
b.
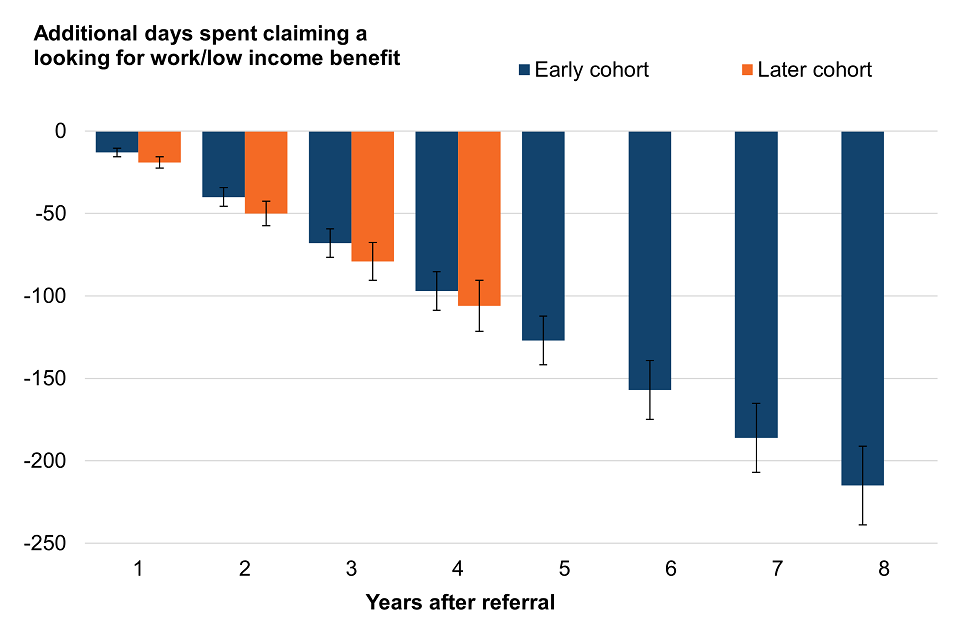
c.
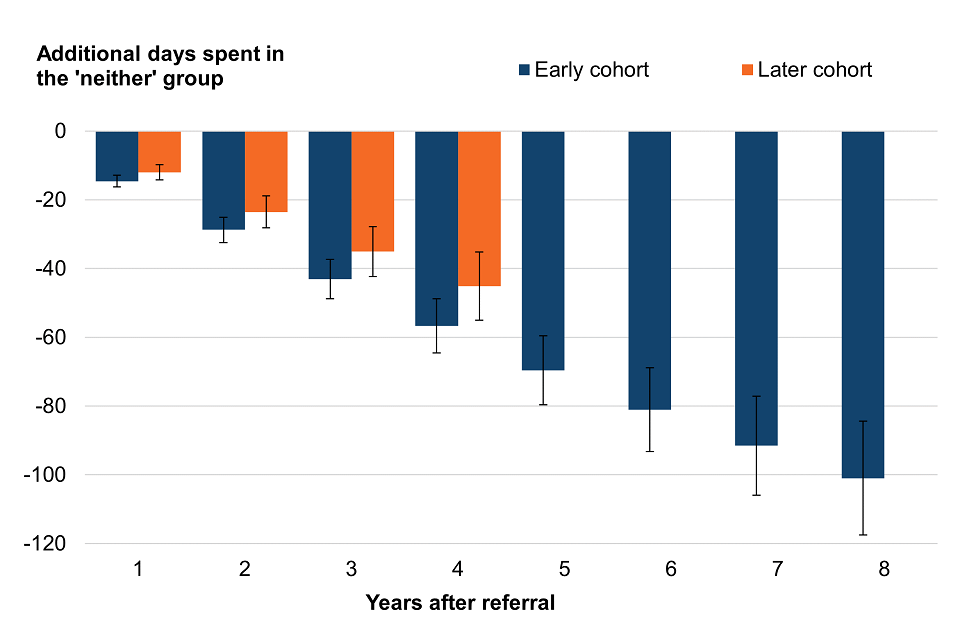
4. Caveats and limitations
4.1 Potential bias
As described in section 1.3, participation in Work Choice was not random and was the result of decisions made by individuals and providers. As well as easily observable characteristics (e.g., age, gender, parental status), unobserved characteristics such as personality traits, personal preferences and attitudes may simultaneously influence both participation decisions and labour market outcomes. Such unobserved variables introduce bias into the estimated impacts of Work Choice. For example, if highly motivated individuals are more likely to participate in Work Choice, and are also more likely to enter employment, then we will overestimate the impact of Work Choice on employment. This is because these individuals would have had better labour market outcomes than the comparison group even without Work Choice participation.
A key assumption of this analysis is that we have controlled for sufficient characteristics such that, after matching, there are no important unobserved influences on participation and outcomes. This is known as the conditional independence assumption (CIA). We carefully considered characteristics influencing participation and labour market outcomes when selecting variables to include in the calculation of propensity scores.
Motivation and job search behaviour have been shown to influence participation in labour market policies (see Caliendo, Mahlstedt and Mitnik, 2014). There is also evidence that Work Choice providers sometimes rejected referred individuals they thought lacked motivation (Purvis and others, 2013). Individuals referred to Work Choice probably also assessed the perceived benefit of participation which is determined by personality and expectations. All these factors are unobserved.
Controlling for pre-treatment outcomes and labour market histories reduces the influence of unobserved variables such as personality traits and motivation (Lecher and Wunsch, 2011; Caliendo, Mahlstedt and Mitnik, 2014). Therefore, a range of variables relating to past participation in employment support programmes and historical participation in the labour market were included in this analysis to indirectly control for unobserved characteristics. It is assumed that unobserved characteristics such as motivation and personality shaped these past outcomes and influenced Work Choice participation and outcomes in the same way.
Pre-treatment variables included; previous referral to any contracted employment programmes, the number of weeks spent receiving specific benefits, adverse sanctions decisions, days spent in payrolled employment, gross pay (from payrolled employment) in the second tax year prior to referral, and weekly variables indicating payrolled employment and looking for work/low-income benefit receipt. Each of these variables covered the two years prior to referral. Variables indicating the following transitions between outcomes in the 13 weeks before referral were also included:
- from being in payrolled employment and not receiving a looking for work/low-income benefit, to being not in payrolled employment and receiving a looking for work/low-income benefit
- from being neither in payrolled employment nor receiving a looking for work/low-income benefit, to being in payrolled employment and not receiving a looking for work/low-income benefit
- from being neither in payrolled employment nor receiving a looking for work/low-income benefit, to receiving a looking for work/low-income benefit.
To test the assumption that there are no important unobserved influences on participation and outcomes we repeated the analysis using a placebo treatment date one year before the referral date. This analysis showed no impact in the period between the placebo treatment date and the actual referral. This provides reassurance that the observed impact of Work Choice does not reflect compositional differences between the participant and comparison groups, or outcomes that would have occurred anyway.
The way the participant and comparison groups are defined could also introduce bias into the analysis. People in the referred-only group did not ultimately participate in Work Choice, but we do not know why. If these people did not start because they found employment, the estimated employment impact would be negatively biased. However, the time between referral and start was short (median of seven working days) which makes it unlikely that people found employment before starting on Work Choice. Neither do we see this in the data; there is no rapid increase in the employment rate of the comparison group following referral.
However, there is a rapid increase in the proportion of the comparison group in the ‘neither’ outcome immediately following referral. These people are neither in payrolled employment nor receiving looking for work/low-income benefits. We lack data to fully understand the circumstances of this group, but it is likely to include individuals in self-employment and not receiving looking for work/low-income benefits, those still looking for work but with no access to looking for work/low-income benefits, and individuals who have left the labour market. Referred-only individuals may not have gone on to start Work Choice due to “dropping out” of the labour market. If this is the case, in the counterfactual scenario (i.e. without Work Choice participation) the group would have both a lower employment rate and lower rate of looking for work/low-income benefit receipt than participants. This would lead to an overestimation of the positive impact of Work Choice on payrolled employment, and an underestimation of the negative impact on looking for work/low-income benefit receipt.
Due to these potential sources of bias, we are less confident that the results are an unbiased estimate of impact than would be the case with a well-designed and implemented randomised controlled trial. Caution should be taken when interpreting and using these results.
4.2 Multiple participation spells
20% of participants started on Work Choice more than once, and 5% started at least three times. The median time between the first and last start was 74 weeks (mean 103.5 weeks). Where individuals had multiple participation spells the earliest referral leading to a start was taken as the date from which outcomes were measured. Impact estimates therefore include the impact associated with multiple spells of participation in Work Choice.
Multiple spells of participation may result in different labour market impacts on participants than single spells. For example, participants with repeat spells may benefit from familiarity with Work Choice and experience improved labour market outcomes. Alternatively, those that participate multiple times may be harder to help, or benefit least from Work Choice, resulting in smaller labour market impacts than for participants with single spells.
4.3 Contemporaneous employment support
People who did not participate in Work Choice did not exist in an environment of no support. They represent what happens in the absence of Work Choice but with all other Jobcentre Plus and employment programme support available – both DWP and non-DWP.
Over the period Work Choice was operational other contracted support was available. Such support provides the context in which the impacts of Work Choice are estimated. The impact of Work Choice would likely be different in different contexts. This could occur if differences in alternative provision resulted in different participation decisions, and therefore a different set of participants, and/or if following referral to Work Choice some individuals start other employment support provision, either voluntarily or mandatorily.
Over the period Work Choice was active the large-scale Work Programme, which was mandatory for JSA customers and some ESA customers, was also active (evaluated in Kay and Marlow 2020). Other national DWP programmes active at the same time were Work Experience (evaluated in Haigh and Woods 2016), Sector-based Work Academies (evaluated in Ward, Woods and Haigh 2016), Mandatory Work Activity (evaluated in Department for Work and Pensions 2012b), and New Enterprise Allowance (see New Enterprise Allowance statistics, Department for Work and Pensions 2022).
These other employment programmes were designed to offer support tackling different barriers to employment than Work Choice, or in the case of New Enterprise Allowance, to support an individual into becoming self-employed. It was possible for individuals to participate in multiple programmes. DWP records indicate if people started DWP-contracted provision, but we do not know if they participated in non-DWP provision.
Figure 4‑1 shows the proportions of the matched participant and comparison groups that started select employment provision in the 104 weeks following referral to Work Choice. 25% of participants started other contracted provision compared to 32% of the referral-only group. The majority of these were starts to the Work Programme.
Figure 4‑1: Starts to other contracted provision within the two years following Work Choice referral
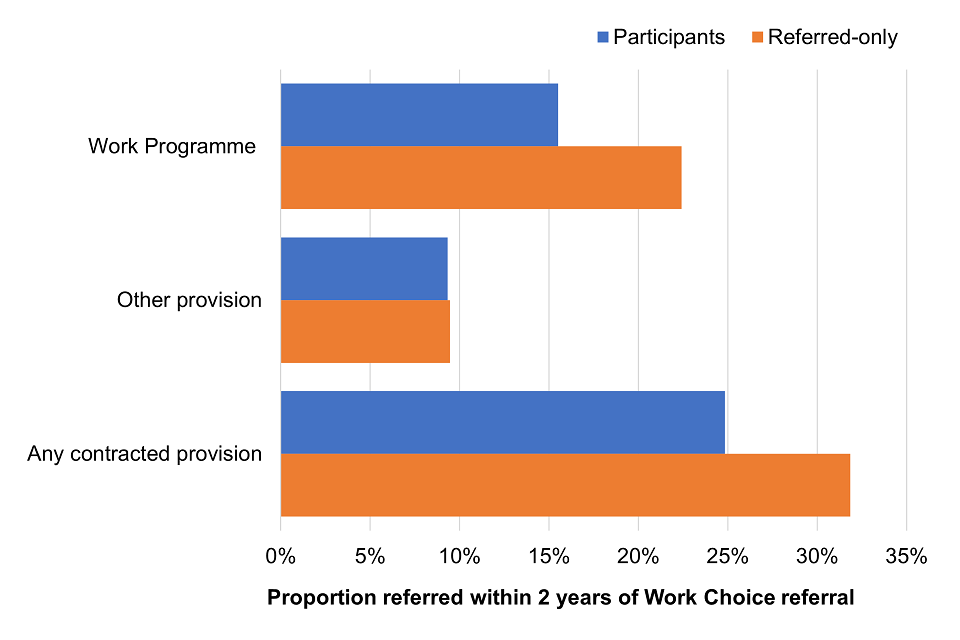
Past evaluations have generally found positive impacts for these programmes (e.g., Work Programme (Kay and Marlow 2020)). If other provision has a positive impact this will result in referred-only individuals achieving better labour market outcomes than if they were receiving only standard Jobcentre Plus support. Where Work Choice participants participated in other provision the effects of this other provision are included in the estimated impact of Work Choice.
4.4 The nature of Work Choice Support
As stated in section ‘1.4 Work Choice support’, the support offered to participants was tailored to individuals and defined by the provider. Participants received different support depending on their individual needs and their Work Choice provider. Furthermore, there was likely variation in degree to which participants engaged with support. Therefore, although we can estimate the impact of Work Choice, we cannot attribute this to specific interventions or support.
4.5 Impact of Covid-19
Outcomes are tracked up to April 2022. The tracking period therefore includes the period of COVID-19 lockdowns and restrictions which began in March 2020, and the subsequent economic impacts. Work Choice support ended in March 2019, so no participants were receiving Work Choice support during the period of COVID-19 restrictions. Depending upon when referrals were made COIVD-19 restrictions began between 2 and 10.5 years after referral to Work Choice. No impact of COVID-19 could be seen in the analysis of annual referral cohorts conducted as part of the cost-benefit analysis (section ‘5 Cost benefit analysis’).
5. Cost-benefit analysis of Work Choice
The following section presents a cost-benefit analysis (CBA) of participation on the Work Choice programme. Section 5.1 covers the methodology behind the CBA, section 5.2 details the findings of the CBA, and section 5.3 contains the conclusion.
5.1 CBA methodology
This cost benefit analysis follows the DWP Social Cost-Benefit Analysis Framework methodology (Fujiwara 2010). This is a recognised piece of supplementary guidance to the HM Treasury Green Book (HM Treasury, 2022) which has been scrutinised and approved for use within DWP – other departments each have their own standard methodology. This framework has been used in previous quantitative impact analyses, including for the Work Programme (Kay and Marlow 2020). The following sections outline how this approach was applied to Work Choice, with regards to whose perspectives are under consideration, which costs and benefits are considered, and the scale of these costs and benefits.
This framework does, however, exclude a number of costs and benefits where it was not possible to obtain robust evidence, for example, the additional leisure time foregone by participants who gain employment. Further detail on the limitations of the adopted methodology is discussed later in this section.
5.1.1 Perspectives under consideration
The costs and benefits are considered from the perspectives of:
- The Work Choice participant
- The Department for Work and Pensions
- The Exchequer
- Society
The Work Choice participant perspective primarily considers the individual changes in wages and benefits received by those on the programme. The DWP perspective considers reductions in benefits payments, departmental operational costs, and the cost of running the programme. The exchequer, or government budget perspective, includes the benefits and costs accruing to DWP in addition to other fiscal benefits like income tax receipts and the reduction in healthcare costs. These two perspectives are therefore not mutually exclusive.
The society perspective represents the net impact from other perspectives, with society in this analysis representing an aggregation of all British citizens. When all perspectives are considered, some elements cancel out as they represent an equal benefit and cost from two different perspectives, such as wages (benefit for participants, cost for employers) and income tax (cost for participants, benefit for the exchequer).[footnote 7]
Different costs and benefits are considered for each of these perspectives, and cost benefit ratios can be calculated based on estimates of these. The cost benefit ratio represents the value returned for the perspective under consideration for each £1 of cost incurred from that perspective.
The main driver of the estimates of these costs and benefits are the impact results, i.e. the number of additional days in employment, and the number of additional days not receiving looking for work/low-income benefits, as a result of participation in the programme. There is uncertainty in these impact estimates; to illustrate this uncertainty, sensitivity analysis was conducted, and this is described in section 5.2.
Costs and benefits under consideration
This section details the monetised costs and benefits resulting from the impacts of the Work Choice programme that are under consideration for this CBA. Table 5‑1 below summarises these.
Table 5‑1: Monetised costs and benefits of the Work Choice programme for each perspective under consideration
| Impact | Participants | DWP | Exchequer | Society |
|---|---|---|---|---|
| Increase in economic output | 0 | 0 | 0 | + |
| Increase in wages | + | 0 | 0 | 0 |
| Programme costs | 0 | - | - | - |
| Reduction in operational costs | 0 | + | + | + |
| Reduction in benefits payments | - | + | + | 0 |
| Increase in taxes | - | 0 | + | 0 |
| Increase in travel and childcare costs | - | 0 | 0 | - |
| Reduction in healthcare costs | 0 | 0 | + | + |
| Redistributive costs and benefits | + | 0 | 0 | + |
| Monetised change in quality of life | + | 0 | 0 | + |
Key: ‘+’ denotes a net benefit; ‘-’ denotes a net cost; ‘0’ denotes neither cost nor a benefit.
Increase in economic output
This refers to the economic output produced by participants because of the additional time spent in employment illustrated in section 3 of this report. This output represents a benefit to employers (who sell it) and society (who consume it). DWP does not have information on the value of this output, so it is necessary to make several simplifying assumptions, discussed below.
The labour market is assumed to be perfectly competitive. This implies that employers will hire workers up to the point where the value of an additional unit of output is equal to the associated marginal cost of production. The cost of production, and therefore the value of the output produced during additional spells in employment, is assumed to equal the commensurate gross wage payments and employers’ National Insurance contributions.
Increase in wages
This refers to the gross wages received by participants from additional time spent in employment. This is a benefit to the participants and an equal cost to their employers, therefore from society’s perspective there is no net benefit or cost, only a redistribution of resources. As DWP does not have information on the income received by Work Choice participants, income increases were estimated using the DWP Policy Simulation Model, a microsimulation model which combines data from the Family Resources Survey with information on the UK tax and benefit systems. This allows users to estimate the changes in benefit payments and tax revenue that occur when unemployed individuals with a given set of characteristics move into work.
It is assumed that participants received the minimum wage and worked for 27 hours per week, based on data from the labour force survey on the average working hours for people with disabilities (Office for National Statistics, 2023). The Policy Simulation Model provides estimates for the years 2016/17 to 2021/22 only; for earlier years (2010/11 to 2015/16), where estimates aren’t available, the CBA model deflates the values from the Policy Simulation Model using average weekly earnings data from the Office for National Statistics (2024), which is based on average monthly earnings across financial years. The CBA model estimates future years (2022/23 to 2028/29) by uprating using average earnings growth data from the Office for Budget Responsibility’s March 2023 Economic and Fiscal Outlook (2023).
Programme costs
Programme costs consist of funds paid to third-party contracted providers to run and deliver the programme. These represent a cost to DWP, the exchequer, and society.
The costs are made up of:
- Service Fee – which represented 70% of contract value (excluding protected places funding) for 2010-15 contracts and 50% of 2015 and 2017 extensions. This was calculated on pre-programme starts forecast and was paid in a monthly lump sum.
- Payment by Results (PbR) – 30% (2010) moving up to 50% of contract value (2015 and 2017 extensions). This was paid on achievement of individual short or sustained job outcomes and was claimed by provider in arrears.
- Protected Places Funding – a subsidy paid through Work Choice prime providers (not Remploy) to supported businesses to employ Work Choice participants.
- Grant in Aid (GIA) funding – direct funding of Remploy to deliver Work Choice in 2010-15 contract phase. The budget was paid as annual settlement each year to cover the service fee and PbR elements. This ended in the 2015 contract phase.
Programme costs per participant have been estimated for each cohort, with costs assumed to accrue over three years following referral. Year 1 consists of fixed costs (service fee, protected places, and GIA) and PbR for outcomes achieved within 1 year, while years 2 and 3 contain PbR costs only, therefore most costs are estimated to accrue in the first year.
Table 5‑2 below shows the estimated programme costs per participant for each cohort[footnote 8]. These costs vary between cohorts and years following referral. This is because the contracts went through multiple changes throughout the life of the programme, with different amounts being paid for service fees and outcomes in different years and to different providers. Furthermore, costs vary depending on the number of short and sustained outcomes achieved for each cohort in each year following referral, and so unit costs vary between cohorts on this basis.
Table 5‑2: Programme costs per participant, by cohort
| Cohort | Year 1 programme costs per participant | Year 2 programme costs per participant | Year 3 programme costs per participant | Total programme costs per participant | Number of participants |
|---|---|---|---|---|---|
| 2010-2011 | £4,366 | £190 | £201 | £4,757 | 27,585 |
| 2011-2012 | £3,893 | £107 | £27 | £4,027 | 23,701 |
| 2012-2013 | £4,191 | £141 | £20 | £4,352 | 26,744 |
| 2013-2014 | £4,313 | £138 | £13 | £4,464 | 31,833 |
| 2014-2015 | £4,387 | £141 | £10 | £4,538 | 27,155 |
| 2015-2016 | £5,250 | £368 | £23 | £5,641 | 18,445 |
| 2016-2017 | £5,004 | £340 | £9 | £5,352 | 21,724 |
| 2017-2018 | £3,564 | £159 | £1 | £3,724 | 17,826 |
| All cohorts | £4,360 | £189 | £41 | £4,590 | 195,013 |
Programme costs for ‘all cohorts’ are a weighted average
Reduction in operational costs
Work Choice participants are less likely to receive support from Jobcentre Plus advisers following a placement because they are more likely to be working and less likely to be claiming benefits. As a result, this also means participants are less likely to participate in other DWP employment programmes. This translates into operational savings which represent a benefit to the Exchequer and society, as economic resources can be reallocated to alternative uses.
Reduction in benefits
This refers to the net reduction in benefit entitlement and take-up that occurs when participants spend additional time in employment because of participation on the Work Choice programme. This is treated as a transfer payment, representing a cost to participants but a benefit to the Exchequer, which means there is no net cost or benefit to society except via redistributive effects. Changes in benefit entitlement and take-up are estimated using the DWP Policy Simulation Model.
Increase in taxes
This refers to the increase in income tax, National Insurance and indirect tax revenue that occurs when participants spend additional time in employment as a result of participation in Work Choice. This represents a benefit to the Exchequer but a cost to participants and employers, which means there is no net cost or benefit to society, except via redistributive effects. Increases in tax revenue were estimated using the DWP Policy Simulation Model. For years where estimates weren’t available, indirect tax was deflated by the model using Office for National Statistics earnings inflator for earlier years and uprated using the Consumer Prices Index (CPI) forecast for later years, while income tax and national insurance contributions were estimated by using estimates of participants’ wage increases and applying appropriate tax rates for each financial year.
Increase in travel and childcare costs
This refers to the additional travel and childcare costs that are incurred by participants during additional employment as a result of participation in Work Choice. This also represents a cost to society as the provision of additional travel and childcare services diverts economic resources from alternative uses. Furthermore, there are additional social costs of travel which accrues to society as a whole, due to, for example, congestion and pollution for example.
It should be noted that, under Universal Credit, a portion of childcare costs may be covered by UC payments. Although the period assessed in this CBA begins before UC, this policy may affect participants later in the period. The amount paid would depend on factors like number of children, the need for formal childcare, and broader policy changes throughout the course of the CBA period. This would represent a cost to the exchequer/DWP, however in this CBA it is assumed that any increase in childcare costs is experienced by the participant, as the CBA is based on the department’s legacy benefit Social Costs Benefit Analysis (SCBA) model due to the age of Work Choice. CBAs of more recent programmes may incorporate additional childcare costs as a cost to the exchequer and DWP, through use of the UC SCBA model.
A further simplifying assumption has been made of not adjusting for costs of non-DWP childcare support provided by the Department for Education.
Reduction in healthcare costs
This refers to the reduction in National Health Service (NHS) costs which is expected to occur when participants spend additional time in unsubsidised employment as a result of their participation in Work Choice. This represents a benefit to the Exchequer, via reductions in NHS expenditure, and society, as economic resources that had been allocated to healthcare provision can be reallocated to alternative uses.
Redistributive costs and benefits
This refers to the redistributive costs and benefits associated with monetary transfers between participants, employers, and the Exchequer. In line with the methodology prescribed in the HM Treasury Green Book (HM Treasury, 2022), participants, who have relatively low incomes, are assumed to value each additional pound more highly than the average taxpayer, who have a relatively high income compared to Work Choice participants. This assumption is based on the economic principle of the diminishing marginal utility of income. Individuals on lower incomes will experience a greater impact on their utility following an increase in their income compared with a wealthier individual who experiences the same level of increase in their income, because the increase is a higher percentage of the poorer individual’s income than the wealthier individual’s. This implies that monetary transfers from the Exchequer to Work Choice participants represent a benefit to society as a whole.
In this report, redistributive effects are considered as part of the sensitivity analysis rather than the main results as recommended by Green Book experts (HM Treasury, 2022). In line with the recommendations of Fujiwara (2010), and as previously applied in the Universal Credit Business Case (Department for Work and Pensions, 2018), redistributive costs and benefits are estimated by applying a ‘welfare weight’ of 2.5 to monetary transfers made to and from programme participants. This figure is based on an estimated marginal utility of income of 1.3. While this figure is appropriate for the time period covered in this analysis, it should be noted that the welfare weight can change over time, for example when the gap between median and lower quintile incomes change.
Monetised change in quality of life
This captures the change in physical and mental wellbeing as a result of being in employment. These health outcomes are estimated using quality-adjusted life years (QALYs), which combine longevity and level of health into a single measure, with 1 QALY representing a year in perfect health. The Department of Health estimates that a QALY has a monetised value of £70,000 in 2020/21 prices, with future years up to 2028/29 being uprated using the OBR GDP deflator. Years 2010/11 to 2019/20 are imputed using the 2008/09 QALY value estimate of £60,000 and using a linear annual increase up to the £70,000 2020/21 estimate. Schuring and others (2011) estimate the QALY gains associated with someone returning to employment at 0.068, which would be multiplied by the QALY estimate for the year in question and subjected to a 1.5% QALY discount rate to get the monetised change in quality of life. 1.5% is used because the ‘wealth effect’, or real per capita consumption growth element of the usual discount rate (3.5%), is excluded.
This represents a benefit to the participant and society and is included here only as part of the sensitivity analysis, not the main results.
5.1.3 Estimating the scale of the benefits under consideration.
The scale of the costs and benefits of Work Choice depends on the magnitude and the duration of its impacts. In this case, the impacts are measured as the number of additional days participants spent on average in employment, and the number of additional days spent on average not in receipt of looking for work/low-income benefits. As explained in section ‘2.1.1 Rollout of Universal Credit’ the analysis here spans the time from when only legacy benefits existed through the UC rollout period to April 2023. The SCBA model used here considers differences between benefit systems and different legacy benefits. For example, participants who started the programme in 2010 started before UC was introduced, whereas those who started in 2017 were likely to be on UC at the point of referral to Work Choice. This gradual rollout of UC is considered within the model.
Work Choice began in October 2010 and ended in March 2019. The CBA is split into seven separate cohorts of people who started the programme in each tax year from 2010/11 up to 2017/18. Though the programme was still active during the 2018/19 tax year, there were only 12 starts in this period and so a decision was made to exclude this cohort from the CBA.
Using cohorts based on financial years makes the CBA calculations easier than using the early and later cohorts that were used to estimate impacts (see section 3 of this report), as costs and benefits can be neatly allocated to financial years and then aggregated to get the total costs and benefits of the programme as a whole. As the yearly impacts are consistent with the early and later cohorts described in the impact section of the report, the CBA should produce similar results for aggregated individual years as it would for the early and later cohorts. Table 5‑3 to Table 5‑6 show the in-year and cumulative impacts for each year’s cohort, including extrapolated impacts as described below.
For the earliest cohort (2010/11), there is data available through the impact analysis to show consistent employment impacts for Work Choice participants compared with non-participants for 12 years following referral. This 12-year period is only the time that impacts have been monitored– there may be impacts beyond this time period. It is reasonable, based on these observed impacts, to extrapolate up to the same number of years’ worth of impacts for each proceeding cohort. This was done for each cohort by assuming the most recent year’s impact is repeated for each following year until a total of 12 years of impact are available. For the latest cohort (2017/18), this means 5 years of observed impact, with a further 7 years of extrapolated impact, each extrapolated year being the same magnitude as seen in the final observed year.
Table 5‑3: In-year additional days in employment
| Years after tracking start | 1 | 2 | 3 | 4 | 5 | 6 | 7 | 8 | 9 | 10 | 11 | 12 |
|---|---|---|---|---|---|---|---|---|---|---|---|---|
| 2010-2011 cohort | 17 | 33 | 39 | 45 | 44 | 42 | 39 | 41 | 46 | 48 | 45 | 45 |
| 2011-2012 cohort | 27 | 36 | 37 | 42 | 44 | 46 | 44 | 43 | 43 | 42 | 40 | 40* |
| 2012-2013 cohort | 29 | 44 | 45 | 48 | 46 | 45 | 42 | 38 | 35 | 32 | 32* | 32* |
| 2013-2014 cohort | 34 | 43 | 44 | 45 | 45 | 44 | 41 | 39 | 41 | 41* | 41* | 41* |
| 2014-2015 cohort | 37 | 45 | 51 | 50 | 48 | 44 | 40 | 38 | 38* | 38* | 38* | 38* |
| 2015-2016 cohort | 44 | 55 | 55 | 52 | 49 | 47 | 44 | 44* | 44* | 44* | 44* | 44* |
| 2016-2017 cohort | 41 | 56 | 51 | 48 | 44 | 44 | 44* | 44* | 44* | 44* | 44* | 44* |
| 2017-2018 cohort | 35 | 38 | 39 | 38 | 38 | 38* | 38* | 38* | 38* | 38* | 38* | 38* |
Key: extrapolated impacts are indicated by an asterisk.
Table 5‑4: In-year additional days spent not on a looking for work/low-income benefit
| Years after tracking start | 1 | 2 | 3 | 4 | 5 | 6 | 7 | 8 | 9 | 10 | 11 | 12 |
|---|---|---|---|---|---|---|---|---|---|---|---|---|
| 2010-2011 cohort | -8 | 12 | 13 | 17 | 21 | 24 | 23 | 28 | 29 | 26 | 29 | 30 |
| 2011-2012 cohort | 6 | 20 | 21 | 27 | 27 | 29 | 29 | 29 | 27 | 24 | 24 | 24* |
| 2012-2013 cohort | 9 | 27 | 27 | 27 | 26 | 23 | 21 | 22 | 19 | 19 | 19* | 19* |
| 2013-2014 cohort | 12 | 23 | 25 | 27 | 28 | 27 | 28 | 28 | 25 | 25* | 25* | 25* |
| 2014-2015 cohort | 26 | 37 | 36 | 37 | 36 | 34 | 34 | 31 | 31* | 31* | 31* | 31* |
| 2015-2016 cohort | 31 | 38 | 34 | 30 | 29 | 27 | 30 | 30* | 30* | 30* | 30* | 30* |
| 2016-2017 cohort | 23 | 35 | 30 | 26 | 25 | 26 | 26* | 26* | 26* | 26* | 26* | 26* |
| 2017-2018 cohort | 20 | 26 | 23 | 24 | 23 | 23* | 23* | 23* | 23* | 23* | 23* | 23* |
Key: extrapolated impacts are indicated by an asterisk.
Table 5‑5: Cumulative additional days in employment
| Years after tracking start | 1 | 2 | 3 | 4 | 5 | 6 | 7 | 8 | 9 | 10 | 11 | 12 |
|---|---|---|---|---|---|---|---|---|---|---|---|---|
| 2010-2011 cohort | 17 | 50 | 89 | 135 | 179 | 221 | 260 | 301 | 347 | 394 | 439 | 484 |
| 2011-2012 cohort | 27 | 63 | 100 | 143 | 187 | 232 | 276 | 319 | 363 | 404 | 444 | 484* |
| 2012-2013 cohort | 29 | 73 | 119 | 166 | 212 | 257 | 299 | 337 | 372 | 405 | 437* | 470* |
| 2013-2014 cohort | 34 | 77 | 121 | 166 | 211 | 255 | 295 | 334 | 375 | 416* | 457* | 497* |
| 2014-2015 cohort | 37 | 82 | 134 | 184 | 232 | 276 | 316 | 354 | 392* | 430* | 468* | 506* |
| 2015-2016 cohort | 44 | 99 | 154 | 206 | 255 | 302 | 346 | 389* | 433* | 476* | 520* | 563* |
| 2016-2017 cohort | 41 | 97 | 148 | 196 | 240 | 283 | 327* | 371* | 415* | 458* | 502* | 546* |
| 2017-2018 cohort | 35 | 73 | 112 | 150 | 188 | 226* | 264* | 302* | 340* | 377* | 415* | 453* |
Key: extrapolated impacts are indicated by an asterisk.
Table 5‑6: Cumulative additional days spent not on a looking for work/low-income benefit
| Years after tracking start | 1 | 2 | 3 | 4 | 5 | 6 | 7 | 8 | 9 | 10 | 11 | 12 |
|---|---|---|---|---|---|---|---|---|---|---|---|---|
| 2010-2011 cohort | -8 | 4 | 17 | 34 | 55 | 79 | 102 | 130 | 159 | 184 | 213 | 243 |
| 2011-2012 cohort | 6 | 26 | 47 | 74 | 101 | 130 | 159 | 188 | 215 | 239 | 263 | 288* |
| 2012-2013 cohort | 9 | 36 | 63 | 90 | 116 | 139 | 160 | 182 | 201 | 220 | 239* | 257* |
| 2013-2014 cohort | 12 | 35 | 60 | 88 | 116 | 143 | 171 | 199 | 224 | 249* | 274* | 299* |
| 2014-2015 cohort | 26 | 62 | 98 | 135 | 171 | 205 | 239 | 270 | 300* | 331* | 362* | 393* |
| 2015-2016 cohort | 31 | 68 | 103 | 133 | 162 | 189 | 219 | 250* | 280* | 311* | 341* | 372* |
| 2016-2017 cohort | 23 | 58 | 88 | 114 | 139 | 165 | 191* | 217* | 243* | 269* | 295* | 321* |
| 2017-2018 cohort | 20 | 46 | 69 | 93 | 116 | 139* | 162* | 185* | 208* | 230* | 253* | 276* |
Key: extrapolated impacts are indicated by an asterisk.
This method of extrapolation was chosen for its simplicity and accuracy compared to various other methods of extrapolation. To test this, the first 5 years of observed impacts for all cohorts were taken, and 7 years of extrapolation were performed on each cohort based on the 5 years of observed data using the method described above. The same process was then repeated using two other methods: a simple linear forecast and exponential smoothing with three-month seasonality. 5 years was chosen as this is the number of years of impact observed for the latest cohort (2017/18), and so the fewest number of years of observations that would be extrapolated from.
The extrapolated results were compared with observed results where available. For example, the first 5 years of results for the 2010/11 cohort were extrapolated forward by an additional 7 years, then these extrapolated results were compared with the observed results for those 7 years. Figure 5‑1 illustrates this example, showing the actual and extrapolated cumulative additional days in employment. For each method, the deviation of extrapolated results from observed results was assessed in order to determine which was most accurate. The chosen method had the smallest maximum deviation across the greatest number of cohorts (5 out of seven cohorts), and the smallest total deviation when aggregating the maximum deviation across every cohort. These deviations are listed in Table 5‑7.
It should be noted that the further into the future the impacts are assumed to persist, the less reliable the estimated costs and benefits become. A scenario using only observed data has been tested in section 4.2 as a step towards mitigating this uncertainty.
Figure 5‑1: Actual and extrapolated cumulative additional days in employment for the 2010/11 cohort
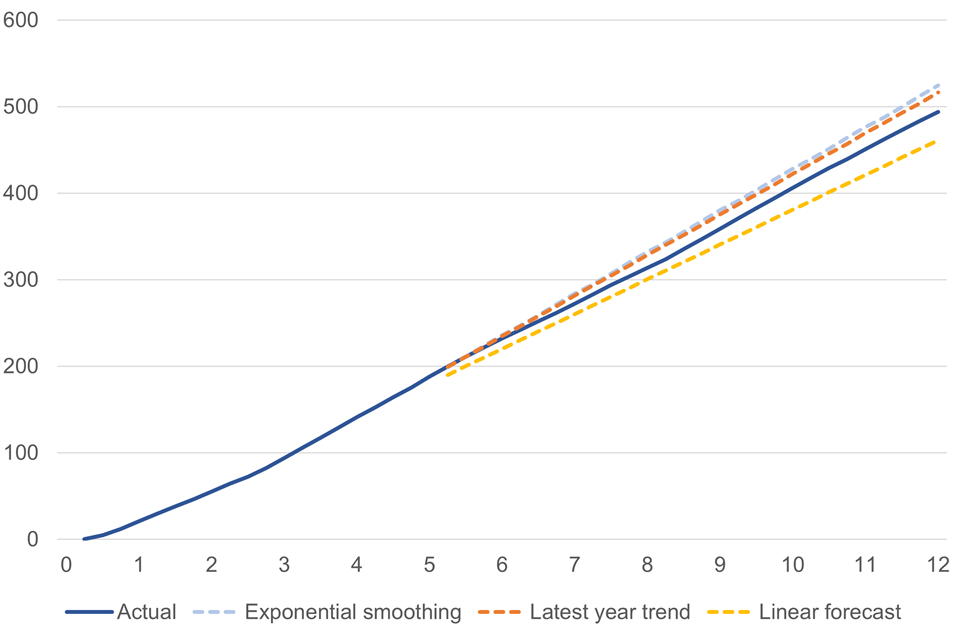
Key: additional days presented across vertical axis, years after referral presented across horizontal axis.
Table 5‑7: Maximum difference between actual and extrapolated impacts, by cohort and extrapolation method
| Method | 2010-2011 cohort | 2011-2012 cohort | 2012-2013 cohort | 2013-2014 cohort | 2014-2015 cohort | 2015-2016 cohort | 2016-2017 cohort | Total deviation |
|---|---|---|---|---|---|---|---|---|
| Exponential smoothing | 30.8 | 7.1 | 23.3 | 13.7 | 26.8 | 18.3 | -2.2 | 122.2 |
| Latest year trend | 22.6 | 14.0 | 21.8 | 18.0 | 11.9 | 4.8 | 0.2 | 93.4 |
| Linear forecast | -32.6 | -16.3 | 24.0 | 13.1 | 26.9 | 18.5 | 12.7 | 144.1 |
5.1.4 Limitations of this approach
As discussed in previous sections, the CBA estimates are derived from the impact estimates which carry a degree of uncertainty. The assumptions underpinning the impact analysis are directly relevant for the CBA, as the impacts provide the main inputs into the model. Any assumptions underpinning the methodology of the CBA described in earlier in this section also influence the accuracy of the results.
The CBA under this framework excludes some potentially significant costs and benefits where robust evidence is lacking. Any interpretation of the CBA estimates should consider these missing costs and benefits. These include:
- Additional leisure time foregone by participants.
- Non-pecuniary benefits associated with additional time in unsubsidised employment.
- The economic multiplier effect of the programme.
- Potential reduction in crime because of movement into employment.
See Fujiwara (2010) for a more detailed discussion of the non-monetised costs and benefits of employment programmes.
5.2 Findings of cost benefit analysis
This section presents estimated benefit-cost ratios (BCRs) of the Work Choice programme.
As inputs, this model uses:
- Programme costs per year
- Additional days in employment
- Additional days not in receipt of a looking for work/low-income benefit
Estimates based on the baseline case of central impact estimates with extrapolation of impacts up to 12 years, alongside upper and lower impact estimates, are presented first, followed by a sensitivity analysis wherein varying options and assumptions are considered. BCRs are based on costs and benefits expressed in 2021/22 prices.
5.2.1 Baseline estimates
Table 5‑8 below lists the BCRs from each perspective using central, lower-, and upper-point estimates for additional days in employment and additional days off benefits. It should be noted that, while the lower impact estimates result in lower BCRs for the exchequer, society, and DWP perspectives, they result in a higher BCR for the participant. This is because, although the total benefits, costs, and net benefits to the participant are reduced, the total benefits are reduced by a lower percentage than the total costs.
These results are presented graphically in Figure 5‑2 with the error bars representing the BCRs under the lower and upper impact estimates. These are based on the assumptions underpinning the estimation of the impact results, as well as the following:
- The value of output produced through participation on the Work Choice programme is equal to the commensurate gross wage payments and employers’ national insurance contributions.
- Participants on the Work Choice programme worked for 27 hours per week and received the minimum wage. This assumption is based on data from the labour force survey on the average working hours for people with disabilities (ONS, 2023).
- The Work Choice programme does not result in redistributive costs and benefits, substitution effects, or a social cost of exchequer finance (distribution and substitution effects are considered in the sensitivity analysis).
- Work Choice participants continued to achieve additional days in work and additional days not in looking for work/low-income benefits for 12 years.
Table 5‑8: Baseline benefit-cost ratios
| Participant | DWP | Exchequer | Society | |
|---|---|---|---|---|
| Central impact estimates | £2.19 | £0.99 | £1.67 | £2.98 |
| Lower impact estimates | £2.36 | £0.73 | £1.31 | £2.36 |
| Upper impact estimates | £2.07 | £1.25 | £2.02 | £3.39 |
Figure 5‑2: Baseline benefit-cost ratios
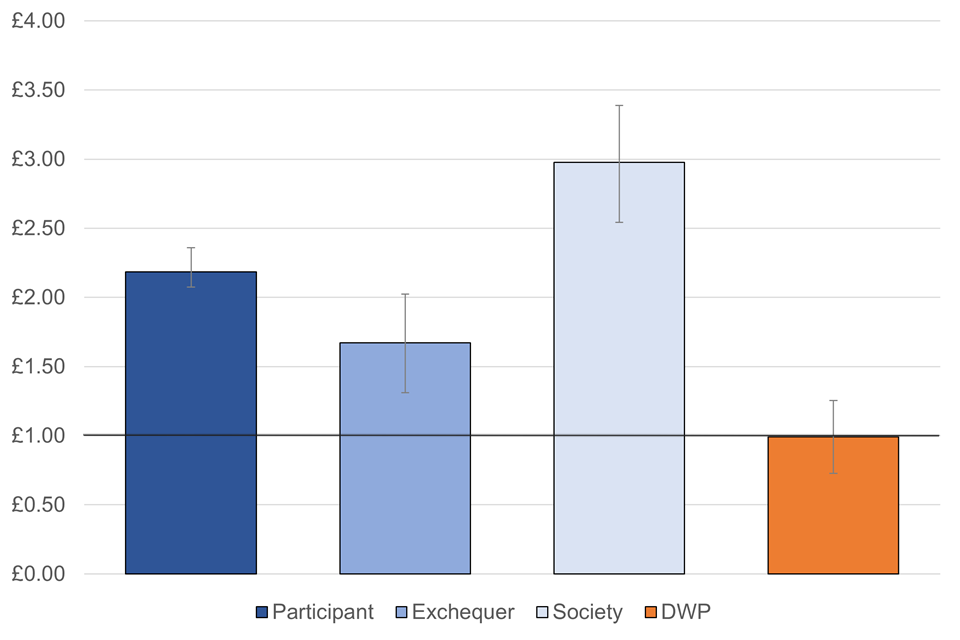
As noted previously, the reliability of these CBA estimates is dependent on the robustness of the impact estimates from which these results are derived, as well as the assumptions used in the SCBA model. Furthermore, these impact results have been extrapolated such that each cohort has 12 years’ worth of impacts, meaning the cohort with the least observed data has 7 years’ worth of extrapolated impact results; extrapolating impacts becomes less reliable the further into the future projections are made.
For participants of the Work Choice programme, participation on average brings a net benefit. For each £1 lost by the participant, in the form of reduced benefits, higher taxes and NIC, and other costs such as travel and childcare, they gain £2.19 in increased wages and tax credits.
From the exchequer perspective, each £1 spent in programme costs and tax credit increases resulted in £1.67 gained from tax receipts, reduced benefit payments and a reduction in operational costs. Furthermore, from DWP’s perspective, which considers only the reduction in DWP benefits payments and the actual costs of running the programme, there was a £0.99 benefit for each £1 of cost, which is broadly cost-neutral given the uncertainty of results.
The broader societal return combines other perspectives into one, leading to it having the highest BCR at £2.98. This is because many of the costs and benefits from the participants and exchequer perspectives cancel each other out, leaving a relatively large benefit of the increase in output and the relatively small programme costs as the main benefits and costs from this perspective.
When using lower, more conservative impact estimates, the BCR from the Work Choice participant’s perspective increases to £2.36, meaning if impacts have been overestimated then the participant BCR is underestimated. The exchequer, society and DWP perspectives see the opposite change, with their BCRs falling to £1.31, £2.54, and £0.73 respectively when using lower impact estimates.
When using higher, more optimistic impact estimates, the BCR from the Work Choice participant’s perspective decreases to £2.07. The exchequer, society and DWP perspectives have higher BCRs of £2.02, £3.39, and £1.25 respectively in this scenario. These results show that each perspective is fairly sensitive to changes in the additional days in employment and additional days not claiming looking for work/low-income benefits used. This is expected, as these estimates are the main drivers of the estimated costs and benefits of the programme.
5.2.2 Sensitivity analysis
To test the robustness of these results, a number of sensitivity tests have been conducted to test different assumptions used in the modelling. Table 5‑9 summarises the assumptions, while Table 5‑10 lists the BCRs under each alternative scenario.
Table 5‑9: Scenarios for sensitivity analysis
| Assumption | Baseline | Sensitivity |
|---|---|---|
| Substitution effects | No substitution effects | 30% substitution effects |
| Extrapolated impacts | Each cohort assumed to have 12 years of impact | Only consider observed impacts |
| Redistributive effects | Distribution not considered as part of main BCRs | Welfare weight applied to monetary transfers |
| Monetised quality of life (QALYs) improvements | QALYs not included | QALYs included in total benefits for participant and societal perspectives |
Table 5‑10: Sensitivity analysis benefit-cost ratios
| Participant | DWP | Exchequer | Society | |
|---|---|---|---|---|
| Central impact estimates | £2.19 | £0.99 | £1.67 | £2.98 |
| Lower impact estimates | £2.36 | £0.73 | £1.31 | £2.54 |
| Upper impact estimates | £2.07 | £1.25 | £2.02 | £3.39 |
| Substitution effect (30%) | £2.19 | £0.92 | £1.38 | £2.11 |
| Observed impact only | £2.16 | £0.75 | £1.19 | £2.18 |
| Redistributive effects | £3.21 | £0.99 | £1.67 | £3.93 |
| QALYs included | £2.64 | £0.99 | £1.67 | £3.54 |
Substitution effects
The baseline model does not assume any substitution effects. In the context of employment programmes, substitution effects occur when participants of a programme gain employment at the expense of non-participants who may have filled the role anyway. This displacement of workers who are not participants in the programme has been found to be larger in programmes that subsidise employers to hire participants, compared with programmes that only provide job search assistance and training. Fujiwara (2010) recommends a 20% substitution effect for supply-side programmes, and a 45% substitution effect for demand-side programmes. As Work Choice contains some elements of both a supply-side and a demand-side programme, we have tested a substitution effect of 30% as a sensitivity.
Substitution effects decrease the estimated results, as a portion of the estimated benefits are assumed to be substituted. The BCRs in this scenario are shown graphically alongside the central results in Figure 5‑3.
The BCR for the Work Choice participant does not change, as they receive the same benefit regardless of whether they may have gained employment at the expense of a non-participant. For the other perspectives, the BCRs do fall – the exchequer to £1.38, the societal perspective to £2.11, and the DWP to £0.92. Still, there remains a net benefit under this more conservative assumption for all perspectives under consideration other than the DWP.
Figure 5‑3: Substitution effect benefit-cost ratios
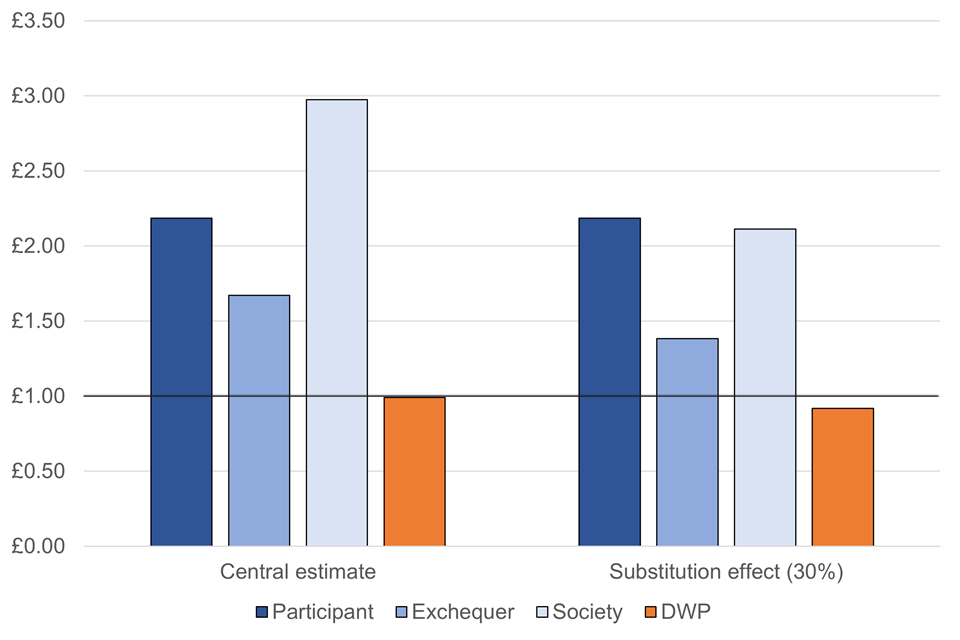
Extrapolated impacts
The baseline model assumes each cohort of participants sees an equal number of years’ worth of impacts, expressed as additional days in employment and additional days not on benefits compared with non-participants. To achieve this, some of the impacts have been extrapolated. As a sensitivity, a CBA has been performed based on observed data only. In this scenario, the earliest cohort (2010/11) still includes 12 years of impact, but each subsequent year includes one fewer year, up to cohort 2017/18, which includes only 5 years of impact. This effects the BCRs from all perspectives and is a very conservative scenario as it assumes that future impacts are zero. Figure 5‑4 presents this graphically, alongside the central results for comparison.
Under this scenario, the BCR falls to £2.16 for the participant, £1.19 for the exchequer, £2.18 for society and £0.75 for the DWP perspective. These BCRs represent the costs and benefits of the programme that have materialised to date.
Figure 5‑4: No extrapolation benefit-cost ratios
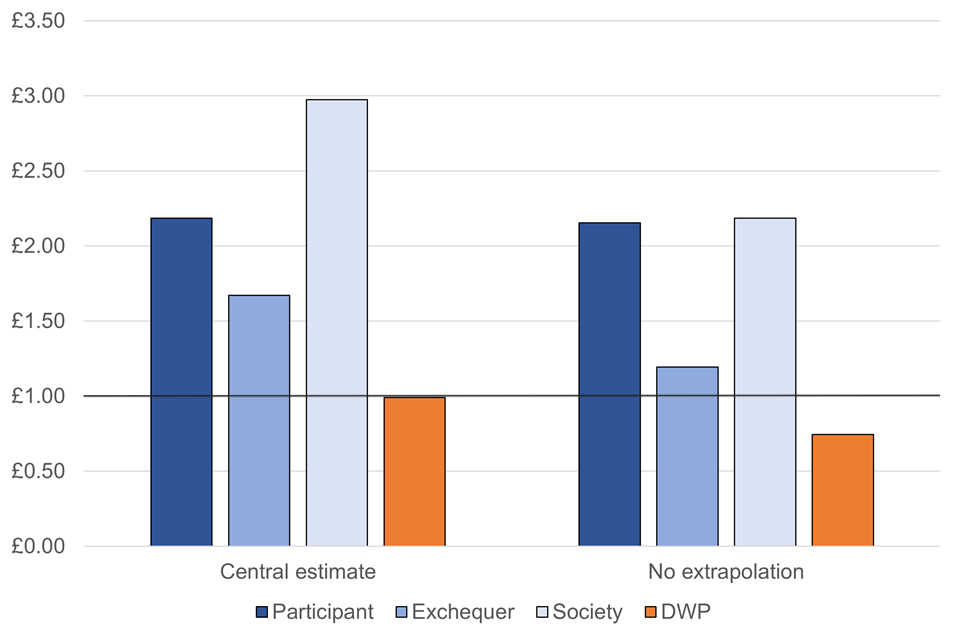
Redistributive effects
As described in section 5.1, those on lower incomes may experience a greater utility increase from receiving an additional £1 compared with those on higher incomes. Most Work Choice participants were receiving means-tested benefits at the point of referral, and therefore will have lower incomes than the average UK taxpayer. To capture the redistributive benefits of the programme, BCRs for the participant and society perspectives are calculated by applying the welfare weight to the increases in net income for the participant (the distributional benefit), and to the indirect tax, travel costs and childcare costs (the distributional costs). These benefits and costs are then added to the original benefit and cost figures, and new BCRs are calculated based on these. This only applies to the participant and broader societal perspectives. The BCRs for the exchequer and DWP perspectives do not change. These BCRs can be seen graphically in Figure 5‑5, alongside central results for comparison.
The BCRs for both participants and society increase in this scenario. Participants achieve a £3.21 return and society achieves a £3.93 return for each £1 of cost. So, while the baseline results show clear positive returns from both of these perspectives regardless, those estimates may be conservative as they do not consider the potential societal benefits of redistribution from higher to lower incomes.
Figure 5‑5: Distributional effects benefit-cost ratios
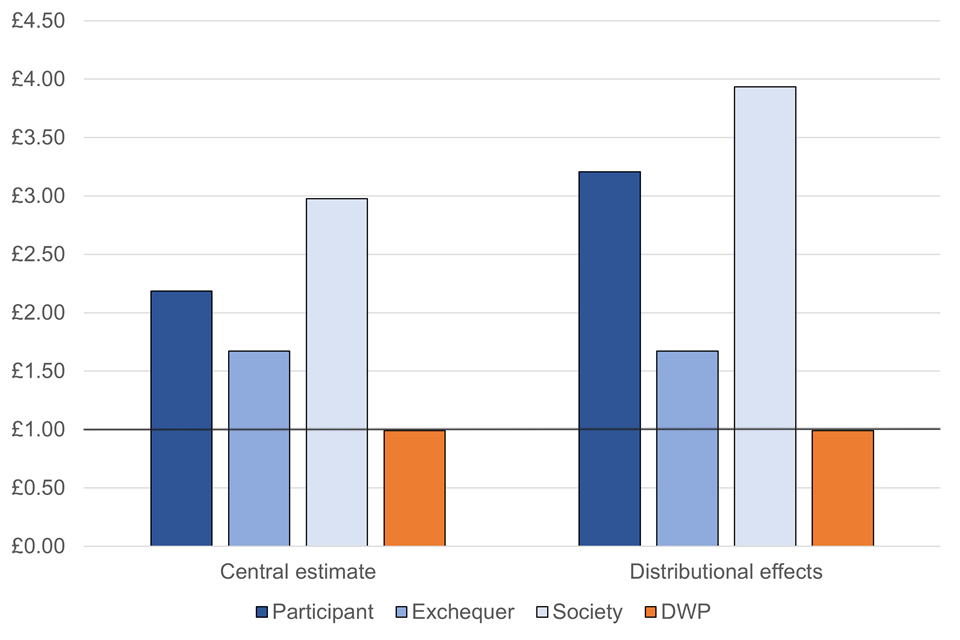
Monetised change in quality of life
This sensitivity option considers the quality-of-life increases associated with returning to employment, which Schuring and others (2011) estimate as a 0.068 QALY gain. This gain is then monetised using the value of a QALY (see section ‘5.1.2 Costs and benefits under consideration’ for details on values used). As with redistribution effects, the BCRs for the exchequer and the DWP do not change, as QALY gains are an intangible monetised benefit. The BCRs for participants and society increase to £2.64 and £3.54 respectively, as shown graphically in Figure 5‑6.
Figure 5‑6: QALYs benefit-cost ratios
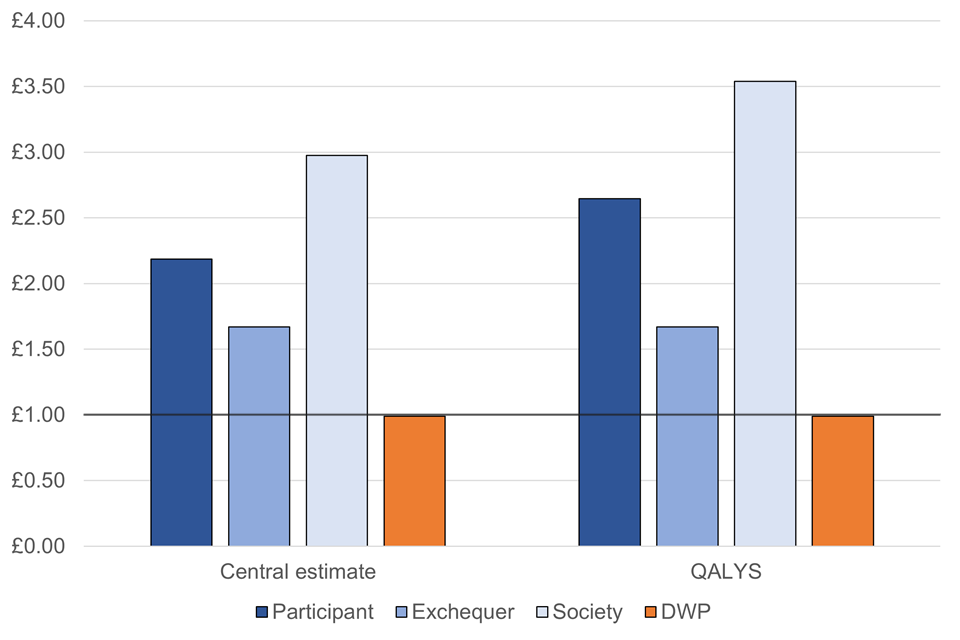
5.3 Conclusions of cost benefit analysis
The observed impact estimates from chapter 5 have been used in a cost benefit analysis to quantify the return on investment from the participant, exchequer, societal, and DWP perspectives. The estimated costs and benefits of the Work Choice programme come with significant uncertainty, however under the baseline case and all other scenarios considered in the sensitivity analysis, the programme is estimated to result in a net benefit to the participant, exchequer, and society.
In the baseline case, the Work Choice programme is estimated to result in, for each £1 of cost, £1.67 of fiscal return to the exchequer, £0.99 return in DWP benefits, and £2.98 to society as a whole. Participants are also better off following participation in the programme, with a return of £2.19.
Sensitivity analysis suggested a positive return to the exchequer in all scenarios considered, with a BCR of £1.19 under the most conservative option of using only observed impacts, wherein the latest cohort was assumed to have only 5 years of impact despite evidence of earlier cohorts having up to 12 years. The most optimistic assumptions estimated the return to the exchequer at £2.02.
When interpreting these results, it is important to consider the caveats discussed previously. The accuracy of the estimates provided depend on the robustness of the impact estimates from which they are derived and the validity of the assumptions on which they are based. Furthermore, some potentially significant costs and benefits are excluded from this analysis due to a lack of robust evidence, including economic multiplier effects and various non-pecuniary costs and benefits (e.g., leisure time, wellbeing).
6. Appendix A: Data Sources
The data used for this analysis was taken from multiple sources that were linked using unique identifiers. All the data used for matching pertain to factors that may impact the likelihood of participating on Work Choice and affect future outcomes.
6.1 Work Choice participation and provider characteristics
Work choice referrals were identified using the Provider Referrals and Payments system (PRaP). PRaP is used to administer contracted employment programmes and contains details of all referrals made to provision and all commercial outcomes achieved. Using unique identifiers individuals were linked to the datasets described below.
PRaP was also used to obtain the provider characteristics used as matching variables, such as ‘did not start’ rates.
6.2 Benefit receipt history and outcomes
DWP collects data to support the administration and delivery of benefits. Data is stored across multiple datasets which can be linked. These datasets contain start and end dates of benefit claims, amount of money received, and characteristics about the claimant and their entitlement.
UC spells were identified using DWP’s UC Production database. UC claims are summarised into month-long assessment periods, with a single conditionality group recorded for the whole period. Consecutive assessment periods with the same conditionality were joined to form UC spells.
All other looking for work/low-income benefit spells were identified using the department’s National Benefits Database (NBD).
PIP or DLA receipt was used as a matching variable. DLA spells were also identified using the NBD. PIP spells were identified using the PIP Atomic Data Store.
This information was used to build up detailed picture of an individual’s benefit history over time. For each of the 104 weeks before referral, and for every week in the tracking period, a flag was created to indicate whether an individual was receiving a benefit of interest.
The number of weeks in which an individual received a looking for work/low-income benefit for within a given period was multiplied by seven to give the number of days receiving benefit.
These datasets were also used to assemble the never referred comparison group.
One of the limitations of the data is that the end dates for some benefits are not always an exact record of the end date of a claim. Often, they are inferred by a change in status between two scans of the computer systems that are typically weeks apart. In such cases the end date is assigned randomly within the range of dates between the scans. Since the dates are assigned randomly and efforts are made to match benefit characteristics between the participant and comparison groups this is not expected to be a source of bias.
6.3 Employment history and outcomes
Employment spells and the total amount of taxable pay were identified using data collected by HMRC for the administration of Income Tax and National Insurance. These datasets contain information on every employment spell or pension paid in the UK via the PAYE system. Start and end dates of employment spells were used to determine if an individual was employed.
These datasets do not include self-employment. A small number of other employment spells are also missing where employers are exempt from using PAYE, for example for religious reasons.
Payrolled employment data was linked to PRaP data using unique identifiers. For each of the 104 weeks before referral, and for every week in the tracking period, a flag was created to indicate whether an individual was in payrolled employment.
The number of weeks an individual was in employment over a given period was multiplied by seven to give the number of days in employment.
The total amount of taxable pay was used to calculate gross pay in the second tax year preceding referral.
6.4 Individual characteristics
Only referred individuals who had a record on the Labour Market System (LMS) were included in this analysis. LMS was the main case management system used in Jobcentre Plus office prior to UC. LMS managed appointments, job referrals, provision referrals, sanction decisions, and information on the client/customer. The LMS contains detailed information on claimants such as age, sex, and whether they have dependent children. Most personal characteristics data was obtained from LMS.
Disability variables were taken from the Labour Market Opportunities dataset (LM Opp). LM Opp holds individual level data about opportunities that Jobcentre customers have been referred to/started as well as personal characteristics for these individuals. This was also the source of disability data for Work Choice published statistics and was used here for consistency and comparative purposes.
Data from these sources was linked to referrals using unique identifiers. Categorical variables were re-coded as binary variables. For example, ethnicity was coded as separate variables for ‘White’, ‘Asian’, ‘Black’, ‘Mixed’, ‘Other’ and ‘Prefer not to say’.
The datasets used for individual characteristics can contain missing values when filling in a field is optional. For ‘Sought occupation’, ‘JCP region’ and ‘Disability type’ ‘missing’ variables have been included as matching variables. For other variables (‘Misuser of Alcohol’, ‘Has a disability’, ‘Misuser of Drugs’, ‘Ex-Offender’, ‘Homeless’, ‘Lone parent’, ‘Parent’, and ‘Refugee’) missing values are not distinguished from zero values.
6.5 Local unemployment rate
Employment outcomes are likely to be affected by local labour market conditions. The unemployment rate one year before referral, in the local authority the Jobcentre Plus a referral originated from, was used as a matching variable. Local authority unemployment rates are estimated by the Office for National Statistics using the Annual Population Survey and the claimant count. These estimates are available from the Office for National Statistics.
7. Appendix B: Variables used in propensity score matching
Time
Referral date
Personal Characteristics
Age at referral
Age group at the point of referral - 18-24
Age group at the point of referral - 25-49
Age group at the point of referral - 50+
Male
Has a disability
Disability – Mobility
Disability - Manual Dexterity
Disability - Physical Coordination
Disability – Continence
Disability - Ability to Lift, carry or otherwise move everyday objects
Disability - Speech, hearing, or eyesight
Disability - Memory or ability to concentrate, learn or understand
Disability - Perception of the risk of physical danger
Disability - Past Disability
Disability - Progressive Condition
Disability - Severe Disfigurement
Disability - Recurring Condition
Disability - Cumulative effect of several of the above
Disability - Existing Person with Disability (PWD) client
Disability - Supported by specialist DS programmes/services
Disability: Missing
Disability: Not Known
Disability: Conditions Restricting Mobility / Dexterity
Disability: Visual Impairment
Disability: Hearing and / or Speech Impairment
Disability: Long-term Medical Conditions
Disability: Moderate to Severe Learning Disability
Disability: Mild Learning Disability
Disability: Severe Mental Illness
Disability: Mild to Moderate Mental Health condition
Disability: Neurological Conditions
Disability: Multiple Conditions
Ethnic Minority
Ethnicity – Asian
Ethnicity – Black
Ethnicity – Mixed
Ethnicity – Other
Ethnicity - Prefer Not to Say
Ethnicity – White
Lone parent
Parent
Refugee
Ex-Offender
Homeless
Misuser of Drugs
Misuser of Alcohol
Sought occupation: Managers and Senior Officials
Sought occupation: Professional Occupations
Sought occupation: Associate Professional and Technical Occupations
Sought occupation: Administrative and Secretarial Occupations
Sought occupation: Skilled Trades Occupations
Sought occupation: Personal Service Occupations
Sought occupation: Sales and Customer Service Occupations
Sought occupation: Process, Plant and Machine Operatives
Sought occupation: Elementary Occupations
Sought occupation: Unknown
Sought occupation: Missing
Geography
Jobcentre Plus Region - Central & West Scotland
Jobcentre Plus Region - East & North Scotland
Jobcentre Plus Region - London & Essex
Jobcentre Plus Region - North & East Midlands
Jobcentre Plus Region - North Central England
Jobcentre Plus Region - Northeast England
Jobcentre Plus Region - Northwest England
Jobcentre Plus Region - Southeast England
Jobcentre Plus Region - Southwest England
Jobcentre Plus Region – Wales
Jobcentre Plus Region - National/Unknown
Employment support history
Referral to any contracted employment support in the two years prior to referral
Referred to Work Programme at any time prior to Work Choice referral
Referred to Work Preparation at any time prior to Work Choice referral
Referred to WORKSTEP at any time prior to Work Choice referral
Participated in European Social Fund at any time prior to Work Choice referral
Participated in Flexible New Deal at any time prior to Work Choice referral
Participated in Support Contract at any time prior to Work Choice referral
Participated in Young Persons Guarantee at any time prior to Work Choice referral
Benefit history
Weekly looking for work/low-income benefit receipt flags for each week over the 2 years prior to referral
Weeks spent receiving DLA or PIP over the two years before referral
Weeks spent receiving ESA over the two years before referral
Weeks spent receiving Income Support or Incapacity Benefit over the two years before referral
Weeks spent receiving JSA or UC with searching for work conditionality over the two years before referral
Met with disability employment advisor in two years before referral
Number of Disability employment advisor meetings in two years before referral
Adverse sanction decision in the two years before referral
Number of adverse sanction decisions in the two years before referral
Work Capability Assessment (WCA) outcome: Fit for Work
WCA Outcome: Support Group
WCA Outcome: Work Related Activity Group
WCA outcome: Other
Employment History
Weekly payrolled employment flags for each week over the 2 years prior to referral
Weekly flags indicating if neither in payrolled employment nor receiving a looking for work/low-income benefit for each week over the 2 years prior to referral
Weeks spent in employment and not receiving a looking for work/low-income benefit over the 104 weeks before referral
Days spent neither in employment nor receiving a looking for work/low-income benefit over the 104 weeks before referral
Days spent neither in employment nor receiving a looking for work/low-income benefit over the 13 weeks before referral
Days spent neither in employment nor receiving a looking for work/low-income benefit over the 26 weeks before referral
Days spent neither in employment nor receiving a looking for work/low-income benefit over the 39 weeks before referral
Days spent neither in employment nor receiving a looking for work/low-income benefit over the 52 weeks before referral
Days spent neither in employment nor receiving a looking for work/low-income benefit over the 65 weeks before referral
Days spent neither in employment nor receiving a looking for work/low-income benefit over the 78 weeks before referral
Days spent neither in employment nor receiving a looking for work/low-income benefit over the 91 weeks before referral
Days spent in employment over the 104 weeks before referral
Days spent in employment over the 13 weeks before referral
Days spent in employment over the 26 weeks before referral
Days spent in employment over the 39 weeks before referral
Days spent in employment over the 52 weeks before referral
Days spent in employment over the 65 weeks before referral
Days spent in employment over the 78 weeks before referral
Days spent in employment over the 91 weeks before referral
Gross Pay in second tax year preceding referral
In the 13 weeks prior to referral transitioned from being employed without receiving a looking for work/low-income benefit to receiving a looking for work/low-income benefit
In the 13 weeks prior to referral transitioned from not employed and not receiving a looking for work/low-income benefit to employment without receiving a looking for work/low-income benefit
In the 13 weeks prior to referral transitioned from not employed and not receiving a looking for work/low-income benefit to receiving a looking for work/low-income benefit
Provider Characteristics
Provider mean number of working days between referral and start
Provider ‘Did not start’ rate (DNS flags divided by referrals)
Provider ‘Did not attend’ rate (DNA flags divided by referrals)
Labour Market
Unemployment rate in JCP district one year before referral
8. Appendix C: Post matching balance assessment
The tables below show the mean values, before and after matching for all matching variables except the weekly payrolled employment/benefit receipt/neither flags (see ‘Appendix B: Variables used in propensity score matching’)
Before matching the groups were not well matched as shown by differences in the mean values. After propensity score matching the mean values of the participants and comparison groups are much closer. The standardised mean bias (SMD) shows the size of the difference. Absolute SMD values below 0.1 suggest the groups are well matched.
Table 8‑1: Early cohort mean value of assessed variables, for each group, before and after matching. The absolute standardised mean difference (SMD) is also shown.
| Variable | Un-matched comparison group | Un-matched participant group | Absolute standardised mean difference (SMD) | Matched comparison group | Matched participant group | Absolute standardised mean difference (SMD) |
|---|---|---|---|---|---|---|
| Referral date | 19418 | 19393 | 0.05 | 19390 | 19393 | 0.01 |
| Age at referral | 37.3 | 37.3 | 0.0 | 37.2 | 37.3 | 0.0 |
| Aged 18 to 24 | 24.4% | 25.2% | 0.02 | 25.3% | 25.2% | 0.00 |
| Aged 25 to 49 | 52.3% | 51.4% | 0.02 | 52.0% | 51.4% | 0.01 |
| Aged 50+ | 23.3% | 23.4% | 0.00 | 22.6% | 23.4% | 0.02 |
| Male | 64.0% | 64.7% | 0.01 | 64.0% | 64.7% | 0.01 |
| Has a disability | 99.5% | 99.6% | 0.02 | 99.6% | 99.6% | 0.01 |
| Disability: Missing | 0.2% | 0.2% | 0.01 | 0.2% | 0.2% | 0.01 |
| Disability: Not Known | 10.2% | 11.5% | 0.04 | 12.1% | 11.5% | 0.02 |
| Disability: Conditions Restricting Mobility / Dexterity | 15.3% | 15.0% | 0.01 | 14.9% | 15.0% | 0.00 |
| Disability: Visual Impairment | 2.5% | 2.3% | 0.02 | 2.0% | 2.3% | 0.02 |
| Disability: Hearing and / or Speech Impairment | 3.4% | 3.9% | 0.03 | 3.8% | 3.9% | 0.00 |
| Disability: Long-term Medical Conditions | 11.8% | 11.1% | 0.02 | 10.8% | 11.1% | 0.01 |
| Disability: Moderate to Severe Learning Disability | 6.4% | 6.4% | 0.00 | 6.1% | 6.4% | 0.01 |
| Disability: Mild Learning Disability | 11.6% | 13.6% | 0.06 | 14.0% | 13.6% | 0.01 |
| Disability: Severe Mental Illness | 1.3% | 1.0% | 0.02 | 1.1% | 1.0% | 0.00 |
| Disability: Mild to Moderate Mental Health condition | 20.8% | 18.9% | 0.05 | 19.1% | 18.9% | 0.00 |
| Disability: Neurological Conditions | 4.2% | 4.0% | 0.01 | 4.0% | 4.0% | 0.00 |
| Disability: Multiple Conditions | 12.3% | 12.0% | 0.01 | 12.0% | 12.0% | 0.00 |
| Ethnic Minority | 11.6% | 8.7% | 0.10 | 8.9% | 8.7% | 0.01 |
| Ethnicity - Asian | 4.1% | 3.1% | 0.05 | 3.2% | 3.1% | 0.01 |
| Ethnicity - Black | 4.3% | 3.3% | 0.05 | 3.5% | 3.3% | 0.01 |
| Ethnicity - Mixed | 1.3% | 1.2% | 0.01 | 1.2% | 1.2% | 0.00 |
| Ethnicity - Other | 1.8% | 1.0% | 0.07 | 1.0% | 1.0% | 0.00 |
| Ethnicity - Prefer Not to Say | 5.1% | 5.2% | 0.00 | 4.9% | 5.2% | 0.01 |
| Ethnicity - White | 83.3% | 86.2% | 0.08 | 86.2% | 86.2% | 0.00 |
| Lone parent | 7.1% | 5.8% | 0.05 | 5.9% | 5.8% | 0.00 |
| Parent | 14.4% | 12.7% | 0.05 | 12.8% | 12.7% | 0.00 |
| Refugee | 0.5% | 0.3% | 0.03 | 0.4% | 0.3% | 0.01 |
| Ex-Offender | 2.2% | 1.0% | 0.10 | 1.0% | 1.0% | 0.00 |
| Homeless | 0.4% | 0.2% | 0.04 | 0.2% | 0.2% | 0.00 |
| Misuser of Drugs | 0.3% | 0.1% | 0.04 | 0.1% | 0.1% | 0.01 |
| Misuser of Alcohol | 0.6% | 0.4% | 0.03 | 0.3% | 0.4% | 0.00 |
| Sought occupation: Managers and Senior Officials | 1.9% | 1.8% | 0.01 | 2.0% | 1.8% | 0.01 |
| Sought occupation: Professional Occupations | 1.5% | 1.6% | 0.00 | 1.5% | 1.6% | 0.01 |
| Sought occupation: Associate Professional and Technical Occupations | 3.5% | 4.3% | 0.04 | 4.4% | 4.3% | 0.00 |
| Sought occupation: Administrative and Secretarial Occupations | 10.0% | 12.4% | 0.07 | 12.5% | 12.4% | 0.00 |
| Sought occupation: Skilled Trades Occupations | 6.9% | 6.1% | 0.03 | 6.3% | 6.1% | 0.01 |
| Sought occupation: Personal Service Occupations | 6.9% | 7.3% | 0.02 | 7.7% | 7.3% | 0.01 |
| Sought occupation: Sales and Customer Service Occupations | 17.3% | 18.4% | 0.03 | 18.5% | 18.4% | 0.00 |
| Sought occupation: Process, Plant and Machine Operatives | 7.8% | 7.6% | 0.01 | 7.6% | 7.6% | 0.00 |
| Sought occupation: Elementary Occupations | 31.0% | 28.7% | 0.05 | 28.1% | 28.7% | 0.01 |
| Sought occupation: Unknown | 0.0% | 0.1% | 0.01 | 0.1% | 0.1% | 0.01 |
| Sought occupation: Missing | 13.2% | 11.8% | 0.04 | 11.4% | 11.8% | 0.01 |
| JCP Region - Southwest England | 6.9% | 8.4% | 0.06 | 8.7% | 8.4% | 0.01 |
| JCP Region - Southeast England | 7.2% | 5.6% | 0.07 | 5.6% | 5.6% | 0.00 |
| JCP Region - London & Essex | 19.1% | 11.2% | 0.22 | 11.3% | 11.2% | 0.00 |
| JCP Region - West Midlands | 9.0% | 9.0% | 0.00 | 9.2% | 9.0% | 0.01 |
| JCP Region - North & East Midlands | 13.3% | 12.9% | 0.01 | 12.5% | 12.9% | 0.01 |
| JCP Region - Wales | 6.3% | 11.1% | 0.17 | 10.8% | 11.1% | 0.01 |
| JCP Region - North Central England | 10.9% | 10.8% | 0.00 | 10.5% | 10.8% | 0.01 |
| JCP Region - Northwest England | 10.4% | 10.6% | 0.01 | 10.7% | 10.6% | 0.00 |
| JCP Region - Northeast England | 7.1% | 7.2% | 0.00 | 7.2% | 7.2% | 0.00 |
| JCP Region - East & North Scotland | 4.5% | 5.8% | 0.06 | 6.1% | 5.8% | 0.01 |
| JCP Region - Central & West Scotland | 5.2% | 7.1% | 0.08 | 6.7% | 7.1% | 0.02 |
| Referral to any contracted employment support in the two years prior to referral | 16.6% | 21.8% | 0.13 | 21.1% | 21.8% | 0.02 |
| Referred to Work Programme prior to Work Choice referral | 11.7% | 10.8% | 0.03 | 11.0% | 10.8% | 0.00 |
| Referred to Work Preparation at any time prior to Work Choice referral | 3.9% | 6.2% | 0.10 | 6.5% | 6.2% | 0.01 |
| Referred to WORKSTEP at any time prior to Work Choice referral | 2.9% | 4.6% | 0.09 | 4.9% | 4.6% | 0.01 |
| Participated in European Social Fund at any time prior to Work Choice referral | 1.6% | 1.6% | 0.00 | 1.7% | 1.6% | 0.01 |
| Participated in Flexible New Deal at any time prior to Work Choice referral | 2.8% | 3.7% | 0.05 | 3.6% | 3.7% | 0.00 |
| Participated in Support Contract at any time prior to Work Choice referral | 4.6% | 5.4% | 0.04 | 5.4% | 5.4% | 0.00 |
| Participated in Young Persons Guarantee at any time prior to Work Choice referral | 0.4% | 0.4% | 0.01 | 0.5% | 0.4% | 0.01 |
| Weeks spent receiving DLA or PIP over the two years before referral | 20.3 | 20.4 | 0.00 | 20.3 | 20.4 | 0.00 |
| Weeks spent receiving ESA over the two years before referral | 25.1 | 19.8 | 0.16 | 20.1 | 19.8 | 0.01 |
| Weeks spent receiving Income Support or Incapacity Benefit over the two years before referral | 5.6 | 4.2 | 0.07 | 4.2 | 4.2 | 0.00 |
| Weeks spent receiving JSA or UC with searching for work conditionality over the two years before referral | 32.5 | 34.4 | 0.06 | 34.5 | 34.4 | 0.00 |
| Met with disability employment advisor in two years before referral | 76.6% | 79.9% | 0.08 | 80.2% | 79.9% | 0.01 |
| Number of Disability employment advisor meetings in two years before referral | 3.1 | 3.9 | 0.14 | 3.9 | 3.9 | 0.01 |
| Benefit sanction in the two years prior referral | 25.6% | 21.7% | 0.09 | 21.4% | 21.7% | 0.01 |
| Number of adverse sanction decisions in the two years before referral | 0.4 | 0.3 | 0.12 | 0.3 | 0.3 | 0.00 |
| Work Capability Assessment (WCA) outcome: Fit for Work | 2.4% | 2.4% | 0.00 | 2.5% | 2.4% | 0.01 |
| WCA Outcome: Support Group | 4.0% | 3.5% | 0.03 | 3.7% | 3.5% | 0.01 |
| WCA Outcome: Work Related Activity Group | 12.0% | 8.5% | 0.11 | 8.5% | 8.5% | 0.00 |
| WCA outcome: Other | 1.2% | 1.5% | 0.02 | 1.5% | 1.5% | 0.00 |
| Weeks spent in employment and not receiving a looking for work/low-income benefit over the 104 weeks before referral | 11.7 | 17.4 | 0.21 | 17.2 | 17.4 | 0.01 |
| Days spent neither in employment nor receiving a looking for work/low-income benefit over the 104 weeks before referral | 134.4 | 133.6 | 0.00 | 134.2 | 133.6 | 0.00 |
| Days spent neither in employment nor receiving a looking for work/low-income benefit in the 13 weeks before referral | 5.0 | 4.6 | 0.02 | 4.7 | 4.6 | 0.00 |
| Days spent neither in employment nor receiving a looking for work/low-income benefit in the 26 weeks before referral | 16.8 | 15.7 | 0.03 | 15.9 | 15.8 | 0.00 |
| Days spent neither in employment nor receiving a looking for work/low-income benefit in the 39 weeks before referral | 31.9 | 30.5 | 0.02 | 31.0 | 30.5 | 0.01 |
| Days spent neither in employment nor receiving a looking for work/low-income benefit in the 52 weeks before referral | 49.3 | 48.1 | 0.01 | 48.8 | 48.1 | 0.01 |
| Days spent neither in employment nor receiving a looking for work/low-income benefit in the 65 weeks before referral | 68.6 | 67.7 | 0.01 | 68.5 | 67.7 | 0.01 |
| Days spent neither in employment nor receiving a looking for work/low-income benefit in the 78 weeks before referral | 89.5 | 88.6 | 0.01 | 89.4 | 88.6 | 0.01 |
| Days spent neither in employment nor receiving a looking for work/low-income benefit in the 91 weeks before referral | 111.5 | 110.6 | 0.00 | 111.2 | 110.6 | 0.00 |
| Days in P45 employment over the two years prior to referral | 135.8 | 182.2 | 0.19 | 180.9 | 182.2 | 0.00 |
| Days spent in P45 employment in the 13 weeks before referral | 11.4 | 14.9 | 0.12 | 15.0 | 14.9 | 0.00 |
| Days spent in P45 employment in the 26 weeks before referral | 25.7 | 34.0 | 0.14 | 33.8 | 34.0 | 0.00 |
| Days spent in P45 employment in the 39 weeks before referral | 41.6 | 55.6 | 0.15 | 55.2 | 55.6 | 0.00 |
| Days spent in P45 employment in the 52 weeks before referral | 58.8 | 78.9 | 0.16 | 78.2 | 78.9 | 0.01 |
| Days spent in P45 employment in the 65 weeks before referral | 77.1 | 103.6 | 0.17 | 102.7 | 103.6 | 0.01 |
| Days spent in P45 employment in the 78 weeks before referral | 96.0 | 129.3 | 0.18 | 128.2 | 129.3 | 0.01 |
| Days spent in P45 employment in the 91 weeks before referral | 115.6 | 155.5 | 0.19 | 154.3 | 155.5 | 0.01 |
| Gross Pay in second tax year preceding referral | 2131.8 | 3161.3 | 0.11 | 3153.9 | 3123.9 | 0.00 |
| In the 13 weeks prior to referral transitioned from being employed without receiving a looking for work/low-income benefit not being employed to receiving a looking for work/low-income benefit | 5.3% | 8.0% | 0.11 | 8.0% | 8.0% | 0.00 |
| In the 13 weeks prior to referral transitioned from not employed and not receiving a looking for work/low-income benefit to employment without receiving a looking for work/low-income benefit | 0.0% | 0.0% | 0.00 | 0.0% | 0.0% | 0.00 |
| In the 13 weeks prior to referral transitioned from not employed and not receiving a looking for work/low-income benefit to receiving a looking for work/low-income benefit | 10.2% | 9.7% | 0.02 | 9.8% | 9.7% | 0.01 |
| Provider mean number of working days between referral and start | 4.5 | 3.4 | 0.19 | 3.5 | 3.4 | 0.00 |
| Provider ‘Did not attend’ rate (DNA flags divided by referrals) | 0.8% | 1.0% | 0.19 | 1.0% | 1.0% | 0.00 |
| Provider ‘Did not start’ rate (DNS flags divided by referrals) | 17.6% | 16.7% | 0.20 | 16.7% | 16.7% | 0.00 |
| Unemployment rate in JCP district one year before referral | 8.3% | 8.3% | 0.01 | 8.3% | 8.3% | 0.01 |
Table 8‑2: Later cohort mean value of assessed variables, for each group, before and after matching. The absolute standardised mean bias is also shown.
| Variable | Un-matched comparison group | Un-matched participant group | Absolute standardised mean difference (SMD) | Matched comparison group | Matched participant group | Absolute standardised mean difference (SMD) |
|---|---|---|---|---|---|---|
| Referral date | 20794 | 20753 | 0.16 | 20749 | 20753 | 0.02 |
| Age at referral | 40.4 | 40.0 | 0.03 | 40.0 | 40.0 | 0.00 |
| Aged 18 to 24 | 16.5% | 17.8% | 0.04 | 18.2% | 17.8% | 0.01 |
| Aged 25 to 49 | 52.0% | 51.3% | 0.01 | 51.1% | 51.4% | 0.00 |
| Aged 50+ | 31.5% | 30.8% | 0.02 | 30.6% | 30.8% | 0.00 |
| Male | 63.3% | 63.1% | 0.00 | 64.0% | 63.1% | 0.02 |
| Has a disability | 91.0% | 91.5% | 0.02 | 91.4% | 91.5% | 0.01 |
| Disability: Missing | 15.6% | 16.1% | 0.01 | 15.6% | 16.1% | 0.01 |
| Disability: Not Known | 2.9% | 2.2% | 0.04 | 2.1% | 2.2% | 0.01 |
| Disability: Conditions Restricting Mobility / Dexterity | 16.9% | 15.9% | 0.03 | 16.1% | 15.9% | 0.00 |
| Disability: Visual Impairment | 1.8% | 1.9% | 0.01 | 1.9% | 1.9% | 0.00 |
| Disability: Hearing and / or Speech Impairment | 2.3% | 2.9% | 0.04 | 2.7% | 2.9% | 0.01 |
| Disability: Long-term Medical Conditions | 12.5% | 12.4% | 0.00 | 13.2% | 12.4% | 0.02 |
| Disability: Moderate to Severe Learning Disability | 4.3% | 4.0% | 0.02 | 3.9% | 4.0% | 0.00 |
| Disability: Mild Learning Disability | 7.5% | 9.5% | 0.07 | 9.5% | 9.5% | 0.00 |
| Disability: Severe Mental Illness | 1.3% | 1.0% | 0.03 | 0.8% | 1.0% | 0.02 |
| Disability: Mild to Moderate Mental Health condition | 18.2% | 17.6% | 0.02 | 18.6% | 17.6% | 0.03 |
| Disability: Neurological Conditions | 3.0% | 3.1% | 0.00 | 2.9% | 3.1% | 0.01 |
| Disability: Multiple Conditions | 13.8% | 13.5% | 0.01 | 12.7% | 13.5% | 0.02 |
| Ethnic Minority | 12.7% | 10.9% | 0.06 | 10.8% | 10.9% | 0.01 |
| Ethnicity - Asian | 4.4% | 3.8% | 0.03 | 3.8% | 3.8% | 0.00 |
| Ethnicity - Black | 4.9% | 4.3% | 0.03 | 4.1% | 4.3% | 0.01 |
| Ethnicity - Mixed | 1.6% | 1.4% | 0.02 | 1.5% | 1.4% | 0.01 |
| Ethnicity - Other | 1.5% | 1.1% | 0.04 | 1.0% | 1.1% | 0.01 |
| Ethnicity - Prefer Not to Say | 4.5% | 4.6% | 0.01 | 4.7% | 4.6% | 0.00 |
| Ethnicity - White | 82.8% | 84.5% | 0.05 | 84.5% | 84.5% | 0.00 |
| Lone parent | 8.0% | 7.5% | 0.02 | 7.2% | 7.5% | 0.01 |
| Parent | 14.6% | 13.8% | 0.02 | 13.8% | 13.8% | 0.00 |
| Refugee | 0.7% | 0.6% | 0.02 | 0.6% | 0.6% | 0.00 |
| Ex-Offender | 0.0% | 0.0% | 0.06 | 0.0% | 0.0% | 0.01 |
| Homeless | 0.0% | 0.0% | 0.05 | 0.0% | 0.0% | 0.00 |
| Misuser of Drugs | 0.2% | 0.1% | 0.03 | 0.1% | 0.1% | 0.00 |
| Misuser of Alcohol | 0.5% | 0.3% | 0.03 | 0.3% | 0.3% | 0.01 |
| Sought occupation: Managers and Senior Officials | 3.8% | 3.6% | 0.01 | 3.9% | 3.6% | 0.01 |
| Sought occupation: Professional Occupations | 1.3% | 1.3% | 0.01 | 1.2% | 1.3% | 0.02 |
| Sought occupation: Associate Professional and Technical Occupations | 2.5% | 3.0% | 0.04 | 2.9% | 3.0% | 0.01 |
| Sought occupation: Administrative and Secretarial Occupations | 6.3% | 7.7% | 0.06 | 7.2% | 7.7% | 0.02 |
| Sought occupation: Skilled Trades Occupations | 5.9% | 4.9% | 0.04 | 4.6% | 4.9% | 0.01 |
| Sought occupation: Personal Service Occupations | 5.7% | 5.6% | 0.00 | 5.6% | 5.6% | 0.00 |
| Sought occupation: Sales and Customer Service Occupations | 14.2% | 15.0% | 0.02 | 15.0% | 15.0% | 0.00 |
| Sought occupation: Process, Plant and Machine Operatives | 6.6% | 6.0% | 0.02 | 6.5% | 6.0% | 0.02 |
| Sought occupation: Elementary Occupations | 24.6% | 21.8% | 0.07 | 21.8% | 21.8% | 0.00 |
| Sought occupation: Unknown | 0.0% | 0.0% | 0.01 | 0.0% | 0.0% | 0.01 |
| Sought occupation: Missing | 29.2% | 30.9% | 0.04 | 31.2% | 30.9% | 0.01 |
| JCP Region - Southwest England | 7.7% | 8.9% | 0.04 | 8.8% | 8.9% | 0.00 |
| JCP Region - Southeast England | 8.0% | 4.9% | 0.13 | 4.3% | 4.9% | 0.03 |
| JCP Region - London & Essex | 14.5% | 10.0% | 0.14 | 10.5% | 10.0% | 0.02 |
| JCP Region - West Midlands | 9.5% | 9.6% | 0.00 | 9.6% | 9.6% | 0.00 |
| JCP Region - North & East Midlands | 16.8% | 14.5% | 0.06 | 14.8% | 14.5% | 0.01 |
| JCP Region - Wales | 8.7% | 14.5% | 0.18 | 14.8% | 14.5% | 0.01 |
| JCP Region - North Central England | 11.1% | 9.6% | 0.05 | 9.6% | 9.6% | 0.00 |
| JCP Region - Northwest England | 11.2% | 11.9% | 0.02 | 11.4% | 11.9% | 0.02 |
| JCP Region - Northeast England | 5.5% | 6.6% | 0.05 | 6.6% | 6.6% | 0.00 |
| JCP Region - East & North Scotland | 2.6% | 4.5% | 0.10 | 4.4% | 4.4% | 0.00 |
| JCP Region - Central & West Scotland | 4.4% | 5.0% | 0.03 | 5.0% | 5.0% | 0.00 |
| Referral to any contracted employment support in the two years prior to referral | 11.7% | 18.8% | 0.20 | 18.4% | 18.8% | 0.01 |
| Referred to Work Programme prior to Work Choice referral | 41.9% | 38.5% | 0.07 | 38.8% | 38.5% | 0.00 |
| Referred to Work Preparation at any time prior to Work Choice referral | 1.6% | 2.1% | 0.04 | 1.9% | 2.1% | 0.02 |
| Referred to WORKSTEP at any time prior to Work Choice referral | 1.0% | 1.6% | 0.05 | 1.4% | 1.6% | 0.02 |
| Participated in European Social Fund at any time prior to Work Choice referral | 1.0% | 1.1% | 0.01 | 1.1% | 1.1% | 0.00 |
| Participated in Flexible New Deal at any time prior to Work Choice referral | 0.0% | 0.0% | 0.00 | 0.0% | 0.0% | - |
| Participated in Support Contract at any time prior to Work Choice referral | 0.6% | 0.9% | 0.03 | 0.9% | 0.9% | 0.00 |
| Participated in Young Persons Guarantee at any time prior to Work Choice referral | 0.0% | 0.0% | 0.00 | 0.0% | 0.0% | - |
| Weeks spent receiving DLA or PIP over the two years before referral | 19.2 | 18.6 | 0.02 | 17.5 | 18.6 | 0.03 |
| Weeks spent receiving ESA over the two years before referral | 35.2 | 27.4 | 0.21 | 27.3 | 27.4 | 0.00 |
| Weeks spent receiving Income Support or Incapacity Benefit over the two years before referral | 0.2 | 0.2 | 0.00 | 0.3 | 0.2 | 0.01 |
| Weeks spent receiving JSA or UC with searching for work conditionality over the two years before referral | 36.3 | 37.4 | 0.03 | 37.9 | 37.4 | 0.01 |
| Met with disability employment advisor in two years before referral | 24.0% | 32.5% | 0.19 | 33.2% | 32.4% | 0.02 |
| Number of Disability employment advisor meetings in two years before referral | 0.9 | 1.3 | 0.10 | 1.3 | 1.3 | 0.00 |
| Benefit sanction in the two years prior referral | 19.5% | 17.1% | 0.06 | 17.5% | 17.1% | 0.01 |
| Number of adverse sanction decisions in the two years before referral | 0.2 | 0.2 | 0.07 | 0.2 | 0.2 | 0.00 |
| Work Capability Assessment (WCA) outcome: Fit for Work | 1.9% | 2.0% | 0.01 | 1.9% | 2.0% | 0.01 |
| WCA Outcome: Support Group | 6.1% | 6.0% | 0.01 | 6.2% | 6.0% | 0.01 |
| WCA Outcome: Work Related Activity Group | 10.1% | 7.2% | 0.10 | 6.7% | 7.2% | 0.02 |
| WCA outcome: Other | 1.2% | 1.4% | 0.03 | 1.7% | 1.4% | 0.02 |
| Weeks spent in employment and not receiving a looking for work/low-income benefit over the 104 weeks before referral | 12.6 | 18.6 | 0.22 | 18.6 | 18.6 | 0.00 |
| Days spent neither in employment nor receiving a looking for work/low-income benefit over the 104 weeks before referral | 103.2 | 109.9 | 0.04 | 106.9 | 109.9 | 0.02 |
| Days spent neither in employment nor receiving a looking for work/low-income benefit in the 13 weeks before referral | 4.7 | 5.3 | 0.04 | 5.0 | 5.3 | 0.02 |
| Days spent neither in employment nor receiving a looking for work/low-income benefit in the 26 weeks before referral | 14.1 | 15.4 | 0.04 | 14.5 | 15.4 | 0.03 |
| Days spent neither in employment nor receiving a looking for work/low-income benefit in the 39 weeks before referral | 25.8 | 28.0 | 0.04 | 26.3 | 28.0 | 0.03 |
| Days spent neither in employment nor receiving a looking for work/low-income benefit in the 52 weeks before referral | 39.4 | 42.4 | 0.04 | 39.9 | 42.4 | 0.03 |
| Days spent neither in employment nor receiving a looking for work/low-income benefit in the 65 weeks before referral | 54.2 | 58.2 | 0.04 | 55.2 | 58.2 | 0.03 |
| Days spent neither in employment nor receiving a looking for work/low-income benefit in the 78 weeks before referral | 69.9 | 74.9 | 0.04 | 71.7 | 74.9 | 0.02 |
| Days spent neither in employment nor receiving a looking for work/low-income benefit in the 91 weeks before referral | 86.3 | 92.1 | 0.04 | 89.0 | 92.1 | 0.02 |
| Days in P45 employment over the two years prior to referral | 144.0 | 191.9 | 0.19 | 193.2 | 191.8 | 0.01 |
| Days spent in P45 employment in the 13 weeks before referral | 11.7 | 15.1 | 0.12 | 15.3 | 15.1 | 0.01 |
| Days spent in P45 employment in the 26 weeks before referral | 26.2 | 34.8 | 0.14 | 35.4 | 34.8 | 0.01 |
| Days spent in P45 employment in the 39 weeks before referral | 42.7 | 57.6 | 0.16 | 58.5 | 57.6 | 0.01 |
| Days spent in P45 employment in the 52 weeks before referral | 61.0 | 82.5 | 0.18 | 83.9 | 82.5 | 0.01 |
| Days spent in P45 employment in the 65 weeks before referral | 80.7 | 108.7 | 0.18 | 110.5 | 108.6 | 0.01 |
| Days spent in P45 employment in the 78 weeks before referral | 101.4 | 135.9 | 0.19 | 137.7 | 135.8 | 0.01 |
| Days spent in P45 employment in the 91 weeks before referral | 122.6 | 163.8 | 0.19 | 165.4 | 163.7 | 0.01 |
| Gross Pay in second tax year preceding referral | 2408.9 | 3540.7 | 0.17 | 3726.8 | 3537.1 | 0.02 |
| In the 13 weeks prior to referral transitioned from being employed without receiving a looking for work/low-income benefit to receiving a looking for work/low-income benefit | 5.2% | 8.6% | 0.14 | 8.7% | 8.6% | 0.00 |
| In the 13 weeks prior to referral transitioned from not employed and not receiving a looking for work/low-income benefit to employment without receiving a looking for work/low-income benefit | 0.0% | 0.0% | 0.01 | 0.0% | 0.0% | 0.00 |
| In the 13 weeks prior to referral transitioned from not employed and not receiving a looking for work/low-income benefit to receiving a looking for work/low-income benefit | 8.7% | 9.4% | 0.03 | 8.7% | 9.4% | 0.02 |
| Provider mean number of working days between referral and start | 8.3 | 8.0 | 0.18 | 8.0 | 8.0 | 0.01 |
| Provider ‘Did not attend’ rate (DNA flags divided by referrals) | 71.1% | 71.4% | 0.01 | 70.2% | 71.4% | 0.02 |
| Provider ‘Did not start’ rate (DNS flags divided by referrals) | 2652.7% | 2579.3% | 0.21 | 2584.7% | 2579.3% | 0.02 |
| Unemployment rate in JCP district one year before referral | 553.1% | 559.7% | 0.04 | 560.4% | 559.7% | 0.00 |
9. Appendix D: Sensitivity checks
We assessed the extent to which impact estimates varied with different matching methods. Tables 9‑1 and 9‑2 shows how the impact estimates 416 weeks or 208 weeks post-referral varied with different matching specifications. Overall, impact estimates do not vary much between the different matching specifications tested.
Table 9‑1: Impact estimates at 416 weeks post-referral using different model specifications for analysis of the early cohort.
| Payrolled employment | Looking for work/low-income benefit | Neither | |
|---|---|---|---|
| 1. Main specification. Logistic regression to estimate the propensity score. Matching with replacement. Caliper 0.1 standard deviations of the propensity scores (caliper = 0.0075) | 10.9 | -7.3 | -2.6 |
| 2. Probit regression to estimate the propensity score. Otherwise as main specification. | 10.7 | -7.7 | -2.3 |
| 3. As main specification but with caliper of 0.001 | 10.8 | -7.4 | -2.6 |
| 4. As main specification but with caliper of 0.0005 | 10.8 | -7.4 | -2.5 |
Table 9‑2: Impact estimates at 208 weeks post-referral using different model specifications for analysis of the later cohort.
| Payrolled employment | Looking for work/low-income benefit | Neither | |
|---|---|---|---|
| 1. Main specification. Logistic regression to estimate the propensity score. Matching with replacement. Caliper 0.1 standard deviations of the propensity scores (caliper =0.0104) | 11.4 | -7.5 | -2.3 |
| 2. Probit regression to estimate the propensity score. Otherwise as main specification. | 11.0 | -6.0 | -2.8 |
| 3. As main specification but with caliper of 0.01 | 11.4 | -7.5 | -2.3 |
| 4. As main specification but with caliper of 0.001 | 11.5 | -7.6 | -2.3 |
| 5. As main specification but with caliper of 0.0005 | 11.5 | -7.6 | -2.3 |
10. Appendix E: Subgroup analysis
We assessed the impact of Work Choice on different subgroups of participants. Specifically, we split participants by sex, age-group, and benefit at the point of referral. This resulted in seven subgroups; male, female, aged 18 to 24, aged 25 to 49, or aged 50 plus at referral, receiving JSA/UC with searching for work conditionality at referral, and receiving a different looking for work/low-income benefit at referral. PSM was carried out for each subgroup following the method described in sections ‘2.5 Estimating propensity scores’ and ‘2.6 Matching’. Subgroup impact estimates are based on smaller samples than used in the main analysis. There is more uncertainty around impact estimates than equivalent estimates in the main analysis.
Figure 10‑1 to Figure 10‑3 and Table 10‑1 to Table 10‑3 show the estimated impact of Work Choice on each subgroup at 52 weeks post-referral and 416 (early cohort) or 208 (later cohort) weeks post-referral.
Subgroup analysis suggests that Work Choice has different impacts, and a different pattern of impact over time, for different groups of participants. However, there is a lot of uncertainty around these estimates, and differences between cohorts, making it difficult to draw firm conclusions. The largest difference between comparable subgroups is for the impact on looking for work/low-income benefit receipt on those receiving JSA or UC with searching for work conditionality at referral and those receiving another benefit. There is a larger impact on looking for work/low-income benefits for participants receiving benefits other than JSA or UC with searching for work conditionality at referral (Figure 10‑1a and Figure 10‑1b, Table 10‑1). It is possible that Work choice is better at supporting these participants.
The impact of Work Choice on looking for work/low-income benefit receipt was similar for males and females in the early cohort (Figure 10‑1a, Table 10‑1). For the later cohort the impact on looking for work/low-income benefit receipt after 208 weeks was smaller for males than females (Figure 10‑1b, Table 10‑1). The impact on looking for work/low-income benefit receipt also differs by age group. The impact on participants aged 18 to 24 at referral increased between 52 weeks and 416 (early cohort)/208 weeks (later cohort) but did not for other age groups, although the confidence intervals around these estimates are large (Figure 10‑1a and Figure 10‑1b, Table 10‑1).
Figure 10‑1: The impact of Work Choice on looking for work/low-income benefit receipt for different subgroups of participants for a) the early cohort and b) the later cohort.
a.

b.

Table 10‑1: The impact of work choice on looking for work/low-income benefit receipt, and total additional days spent receiving looking for work/low-income benefit by subgroup. Confidence intervals in parentheses.
| Sub-group | Early cohort impact at 52 weeks | Early cohort impact at 416 weeks | Early cohort additional days after 416 weeks | Later cohort impact at 52 weeks | Later cohort impact at 208 weeks | Later cohort additional days after 208 weeks |
|---|---|---|---|---|---|---|
| Main estimate | -7.9 | -7.3 | -215 | -8.9 | -7.5 | -106 |
| (-8.9 - -6.9) | (-8.4 - -6.2) | (-238 - -191) | (-9.9 - -7.8) | (-8.6 - -6.4) | (-121 - -90) | |
| Male | -7.2 | -6.9 | -203 | -8.6 | -5.0 | -94 |
| (-8.5 - -5.9) | (-8.3 - -5.5) | (-233 - -173) | (-9.9 - -7.3) | (-6.4 - -3.6) | (-114 - -75) | |
| Female | -8.8 | -7.0 | -212 | -9.2 | -8.8 | -116 |
| (-10.5 - -7.1) | (-8.8 - -5.2) | (-251 - -172) | (-10.8 - -7.5) | (-10.6 - -6.9) | (-142 - -91) | |
| 18-24 | -5.5 | -9.4 | -190 | -7.8 | -11.3 | -103 |
| (-7.7 - -3.3) | (-11.7 - -7.1) | (-239 - -141) | (-10.0 - -5.6) | (-13.7 - -9.0) | (-142 - -64) | |
| 25-49 | -7.5 | -7.7 | -228 | -9.8 | -7.3 | -117 |
| (-9.0 - -6.1) | (-9.2 - -6.2) | (-262 - -195) | (-11.2 - -8.3) | (-8.9 - -5.8) | (-138 - -95) | |
| 50+ | -9.0 | -5.7 | -196 | -9.0 | -7.3 | -106 |
| (-11.2 - -6.8) | (-8.1 - -3.3) | (-250 - -141) | (-11.2 - -6.8) | (-9.8 - -4.9) | (-132 - -79) | |
| JSA/UC searching for work | -4.7 | -5.9 | -151 | -7.9 | -6.8 | -94 |
| (-5.9 - -3.5) | (-7.2 - -4.7) | (-179 - -124) | (-9.5 - -6.4) | (-8.4 - -5.2) | (-111 - -77) | |
| Another benefit | -15.9 | -10.4 | -353 | -15.0 | -12.3 | -186 |
| (-17.8 - -14.1) | (-12.6 - -8.2) | (-400 - -306) | (-18.1 - -12) | (-15.5 - -9.0) | (-222 - -150) |
The impact on payrolled employment also differed between subgroups. 52 weeks after referral the impact on payrolled employment was similar across age groups but analysis of the early cohort suggests that by 416 weeks this impact had declined for those aged 50 plus at referral (Figure 10‑2, Table 10‑2). Sustained employment may be harder to find for older participants, or they may be more likely to leave the labour market. This impact also differed between participants receiving different benefits. After 52 weeks there is a greater impact on payrolled employment for participants receiving benefits other than JSA or UC with searching for work conditionality at referral than for those receiving JSA or UC with searching for work conditionality (Figure 10‑2, Table 10‑2). However, the confidence intervals around these estimates are large.
Figure 10‑2: The impact of Work Choice on payrolled employment for different subgroups of participants for a) the early cohort and b) the later cohort.
a.
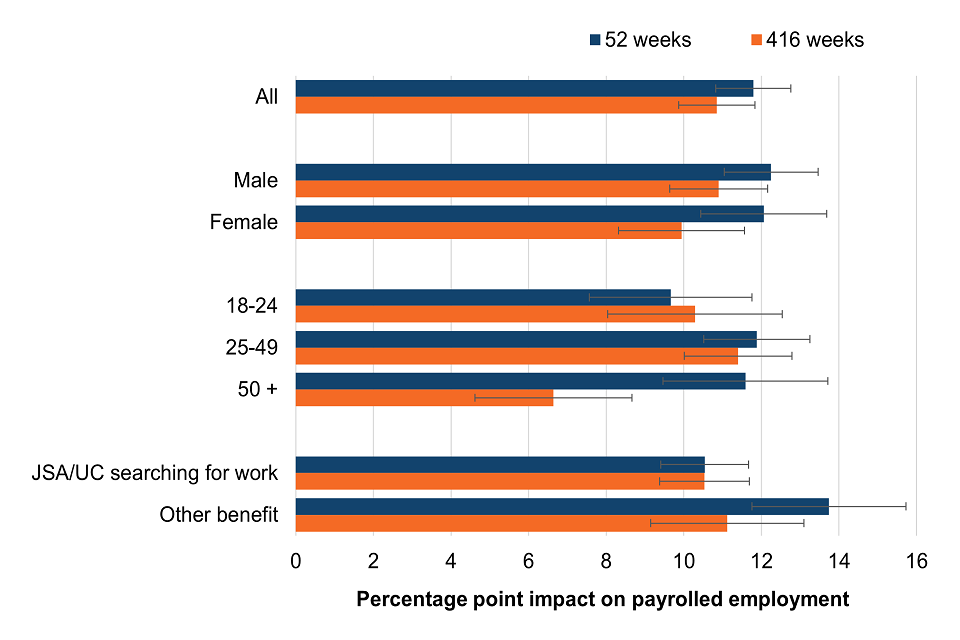
b.
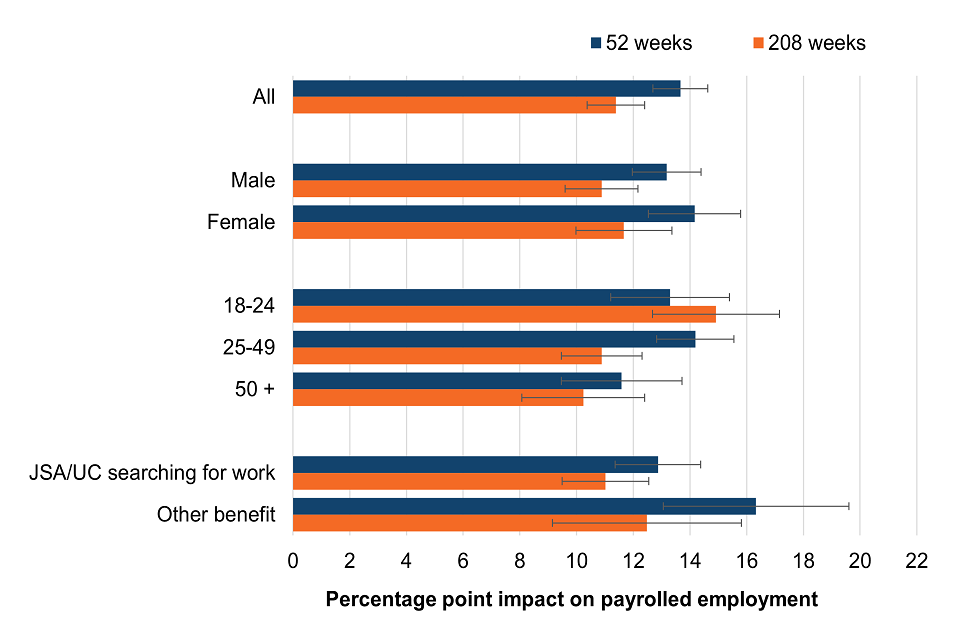
Table 10‑2: The impact of work choice on payrolled employment, and total additional days spent in payrolled employment, by subgroup. Confidence intervals in parentheses.
| Sub-group | Early cohort impact at 52 weeks | Early cohort impact at 416 weeks | Early cohort additional days after 416 weeks | Later cohort impact at 52 weeks | Later cohort impact at 208 weeks | Later cohort additional days after 208 weeks |
|---|---|---|---|---|---|---|
| Main estimate | 11.8 | 10.8 | 337 | 13.7 | 11.4 | 179 |
| (10.8 - 12.8) | (9.9 - 11.8) | (314 - 359) | (12.7 - 14.6) | (10.4 - 12.4) | (163 - 194) | |
| Male | 12.3 | 10.9 | 340 | 13.2 | 10.9 | 173 |
| (11 - 13.5) | (9.6 - 12.2) | (311 - 368) | (12.0 - 14.4) | (9.6 - 12.2) | (153 - 192) | |
| Female | 12.1 | 9.9 | 316 | 14.2 | 11.7 | 186 |
| (10.4 - 13.7) | (8.3 - 11.6) | (278 - 354) | (12.5 - 15.8) | (10.0 - 13.4) | (160 - 212) | |
| 18-24 | 9.7 | 10.3 | 321 | 13.3 | 14.9 | 176 |
| (7.6 - 11.8) | (8.0 - 12.5) | (273 - 368) | (11.2 - 15.4) | (12.7 - 17.2) | (136 - 216) | |
| 25-49 | 11.9 | 11.4 | 342 | 14.2 | 10.9 | 179 |
| (10.5 - 13.2) | (10 - 12.8) | (310 - 374) | (12.8 - 15.6) | (9.5 - 12.3) | (157 - 200) | |
| 50+ | 11.6 | 6.6 | 257 | 11.6 | 10.2 | 144 |
| (9.5 - 13.7) | (4.6 - 8.7) | (206 - 309) | (9.5 - 13.7) | (8.1 - 12.4) | (117 – 170) | |
| JSA/UC searching for work | 10.5 | 10.5 | 311 | 12.9 | 11.0 | 169 |
| (9.4 - 11.7) | (9.4 - 11.7) | (284 - 337) | (11.4 - 14.4) | (9.5 - 12.6) | (152 - 187) | |
| Another benefit | 13.7 | 11.1 | 364.0 | 16.3 | 12.5 | 213.0 |
| (11.8 - 15.7) | (9.1 - 13.1) | (318 - 410) | (13.1 - 19.6) | (9.2 - 15.8) | (175 - 252) |
The confidence intervals around the estimates of the impact of Work Choice on the ‘neither’ outcome were large for all subgroups. However, after 52 weeks the impact on ‘neither’ was larger for those receiving JSA or UC with searching for work conditionality than for those receiving benefits other than JSA or UC with searching for work conditionality (Figure 10‑3, Table 10‑3).
Figure 10‑3: The impact of Work Choice on the ‘neither’ outcome for different subgroups of participants for a) the early cohort and b) the later cohort.
a.
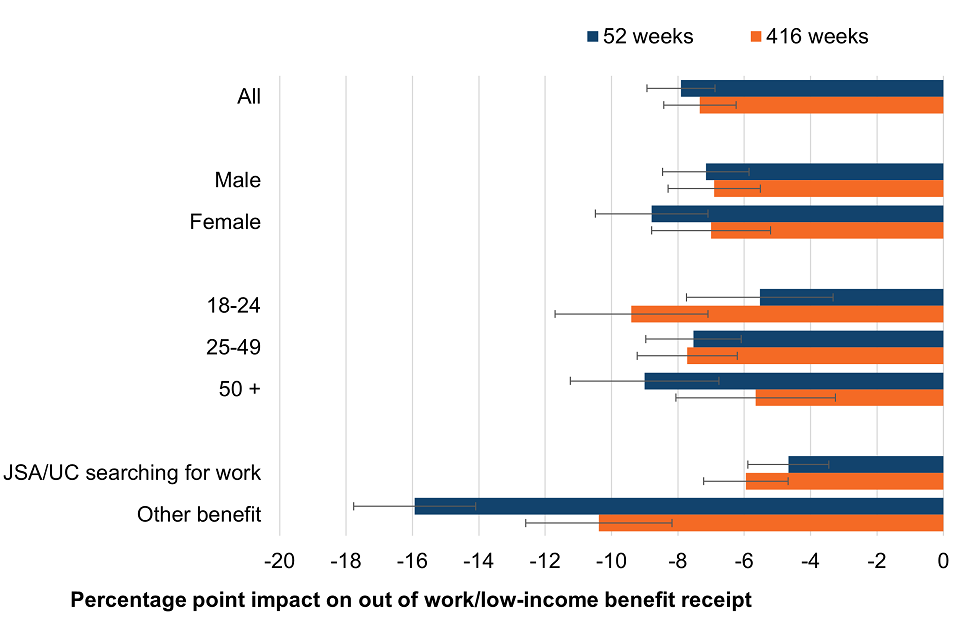
b.
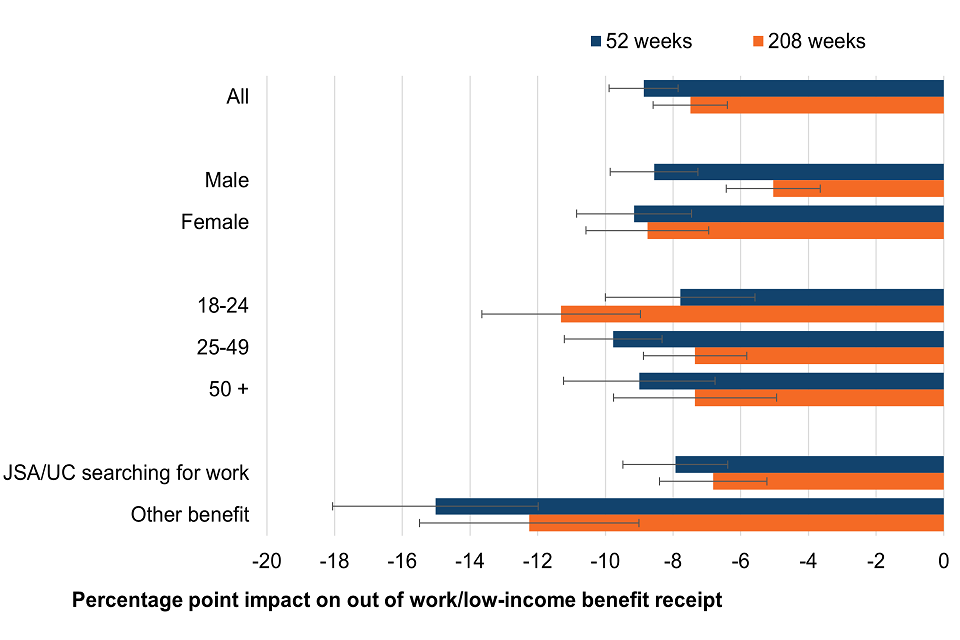
Table 10‑3: The impact of work choice on the ‘neither’ outcome, and total additional days spent in the ‘neither’ outcome, by subgroup. Confidence intervals in parentheses.
| Sub-group | Early cohort impact at 52 weeks | Early cohort impact at 416 weeks | Early cohort additional days after 416 weeks | Later cohort impact at 52 weeks | Later cohort impact at 208 weeks | Later cohort additional days after 208 weeks |
|---|---|---|---|---|---|---|
| Main estimate | -3.8 | -2.6 | -101 | -3.5 | -2.3 | -45 |
| (-4.5 - -3.0) | (-3.5 - -1.7) | (-118 - -84) | (-4.2 - -2.7) | (-3.1 - -1.4) | (-55 - -35) | |
| Male | -4.5 | -2.9 | -110 | -3.4 | -3.5 | -54 |
| (-5.5 - -3.6) | (-4 - -1.8) | (-131 - -89) | (-4.4 - -2.4) | (-4.5 - -2.4) | (-67 - -41) | |
| Female | -2.9 | -2.0 | -89 | -2.9 | -1.7 | -38 |
| (-4.1 - -1.8) | (-3.4 - -0.5) | (-117 - -62) | (-4 - -1.7) | (-3.1 - -0.3) | (-54 - -21) | |
| 18-24 | -3.5 | -0.8 | -105 | -3.8 | -2.4 | -48 |
| (-5.0 - -1.9) | (-2.3 - 0.7) | (-134 - -76) | (-5.3 - -2.2) | (-4.1 - -0.7) | (-70 - -25) | |
| 25-49 | -3.4 | -2.6 | -87 | -2.3 | -0.9 | -30 |
| (-4.4 - -2.4) | (-3.7 - -1.5) | (-109 - -66) | (-3.3 - -1.3) | (-2.0 - 0.2) | (-43 - -18) | |
| 50+ | -3.5 | -1.1 | -63 | -3.5 | -2.1 | -40 |
| (-5.1 - -1.8) | (-3.5 - 1.2) | (-107 - -19) | (-5.1 - -1.8) | (-4.1 – 0.0) | (-59 - -20) | |
| JSA/UC searching for work | -4.9 | -3.4 | -126 | -2.8 | -1.6 | -40 |
| (-5.8 - -4.0) | (-4.5 - -2.4) | (-146 - -107) | (-3.9 - -1.8) | (-2.7 - -0.5) | (-51 - -29) | |
| Another benefit | 0.4 | -1.3 | -15 | 0.1 | -1.3 | -9 |
| (-0.7 - 1.5) | (-3.1 - 0.4) | (-44 - 13) | (-1.6 - 1.8) | (-3.5 - 0.9) | (-29 - 11) |
11. Appendix F: A never referred comparison group
Instead of a referred-only comparison group we could have used a comparison group of never referred people. We explored this approach, but a referred-only group remained our preferred comparison group.
A referred-only comparison controls for selection into referral, leaving only selection into participation to be controlled for using matching. However, a never referred comparison group requires matching to control for both selection into referral and selection into participation. Furthermore, selection into referral is more discriminating than selection into participation; many more people were never referred to Work Choice than were referred, whereas most people referred went on to start Work Choice.
We do not know why people were not referred, or if they were eligible for Work Choice, whereas all those in the referred-only group had been deemed to meet the eligibility criteria. There are likely unobserved factors relevant to the referral process, for example, work coach opinion, which are not easily controlled for by matching on observables. Using a never-referred comparison group also requires assigning pseudo-referral dates as the baseline from which to track outcomes.
Evaluation using a never referred control group found that participants spent more days in payrolled employment, fewer days receiving looking for work/low-income benefits and less time not in employment nor on benefits than the never referred group. However, although the variable balance after matching was fair the match was poorer than that for the referral-only group, and there were significant differences in outcomes in the pre-referral period. This reduces our confidence in the results based on this comparison group and supports our decision not to use this group for our analysis.
References
Caliendo, M, Mahlstedt, R and Mitnik, OA 2014 ‘Unobservable, But Unimportant? The Influence of Personality Traits (and Other Usually Unobserved Variables) for the Evaluation of Labor Market Policies’ DIW Berlin Discussion Paper No. 1407
Department for Work and Pensions 2008a ‘No one written off: reforming welfare to reward responsibility’ Public consultation Available at: No one written off: reforming welfare to reward responsibility Public consultation CM 7363 (publishing.service.gov.uk)
Department for Work and Pensions 2008b ‘Raising expectations and increasing support: reforming welfare for the future’ Available at: Department for Work and Pensions Raising expectations and increasing support: reforming welfare for the future Cm 7506 (publishing.service.gov.uk)
Department for Work and Pensions 2011 Work Choice provider guidance: before April 2017 Available at: [Withdrawn] Work Choice provider guidance: before April 2017 - GOV.UK (www.gov.uk)
Department for Work and Pensions 2012a ‘Disability employment support: fulfilling potential. Government’s response to the consultation on the recommendations in Liz Sayce’s independent review Getting in, staying in and getting on’ Available at: Disability employment support: fulfilling potential - CM8312 March 2012 (publishing.service.gov.uk)
Department for Work and Pensions 2012b ‘Evaluation of Mandatory Work Activity’ Department for Work and Pensions Research Report No. 823 (rrep823.pdf)
Department for Work and Pensions 2017 ‘Work Choice provider guidance: effective from April 2017’ Available at: [Withdrawn] Work Choice provider guidance: effective from April 2017 - GOV.UK (www.gov.uk)
Department for Work and Pensions 2018 ‘Universal Credit Programme Full Business Case Summary’ Available at: Universal Credit Programme full business case summary - GOV.UK (www.gov.uk)
Department for Work and Pensions 2020 ‘Work Choice: referrals, starts and job outcomes to October 2019’ Available at: Work Choice: referrals, starts and job outcomes to October 2019 - GOV.UK (www.gov.uk)
Department for Work and Pensions 2022 ‘New Enterprise Allowance: April 2011 to December 2021’ Available at: New Enterprise Allowance: April 2011 to December 2021 - GOV.UK (www.gov.uk)
Equality Act 2010, c15 Available at: Equality Act 2010 (legislation.gov.uk)
Fujiwara, D 2010 ‘The DWP Social Cost-Benefit Analysis framework (WP86)’ Department for Work and Pensions Working Paper 86 Available at: The DWP Social Cost-Benefit Analysis framework (WP86)
Haigh, R, and Woods J 2016 ‘Work experience: A quantitative impact assessment’ Department for Work and Pensions Research Report No. 917 Available at: Work experience - A quantitative impact assessment - DWP Report 917
HM Treasury 2022 ‘The Green Book: Central Government Guidance on Appraisal and Evaluation’ Available at: The Green Book (publishing.service.gov.uk)
Kay, J and Marlow, S 2020 ‘The Work Programme: A quantitative impact assessment’ Department for Work and Pensions Available at: The Work Programme Evaluation 2020 (HTML)
Lecher, M and Wunsch, C 2011 ‘Sensitivity of Matching-Based Program Evaluations to the Availability of Control Variables’ IZA Discussion Paper No. 5553 Available at: Sensitivity of Matching-Based Program Evaluations to the Availability of Control Variables (iza.org)
Office for Budget Responsibility 2023 ‘Economic and fiscal outlook – March 2023’ Available at: Economic and fiscal outlook - March 2023 - Office for Budget Responsibility (obr.uk)
Office for National Statistics ‘Nomis. Official census and labour market statistics’ Available at: Nomis - Official Census and Labour Market Statistics (nomisweb.co.uk)
Office for National Statistics 2023 ‘Dataset A08: Labour market status of disabled people’ Available at: A08: Labour market status of disabled people - Office for National Statistics (ons.gov.uk)
Office for National Statistics 2024 ‘Dataset EARN01: Average weekly earnings’ Available at: EARN01: Average weekly earnings - Office for National Statistics (ons.gov.uk)
Purvis, A, Foster, S, Lane, P, Aston, J and Davies, M 2013 ‘Evaluation of the Work Choice Specialist Disability Employment Programme’ Department for Work and Pensions Research Report No. 846 (rrep846.pdf)
Purvis, A, Lowrey, J, and Dobb, J 2006 ‘WORKSTEP evaluation case studies: Exploring the design, delivery and performance of the WORKSTEP Programme’ Department for Work and Pension Research Report No. 348 available at PMD (core.ac.uk)
Rosenbaum, PR and Rubin, DB 1983 ‘The central role of the propensity score in observational studies for causal effects’ Biometrika 70(1), 41-55
Sayce, L 2011 ‘Disability employment support fit for the future. A review to Government’ Available at: Getting in, staying in and getting on: Disability employment support fit for the future (publishing.service.gov.uk)
Schuring, M, Mackenbach J, Voorham T, and Burdorf, A 2011 ‘The effect of re-employment on perceived health’ Journal of Epidemiology & Community Health 65, 639-644
Thompson, A, Trenell, P, Hope, M, and McPhillips, A 2011 ‘Work Choice Evaluation: Commissioning and Transition of Clients to the Programme’ Department for Work and Pensions In-House Research No. 6
Ward, R, Woods, J, and Haigh, R 2016 ‘Sector-based work academies: A quantitative impact assessment’ Department for Work and Pensions Research Report No. 918 Available at: Sector-based work academies - A quantitative impact assessment - DWP report 918
-
ESF contributed to the cost of delivering the programme. The ESF contribution is known as match funding. ESF eligibility rules applied to all programme spending including match funding. ↩
-
This figure is higher than recorded in the official statistics because the statistics do not include referrals that were supported by Remploy in 2010-14 ↩
-
Early and later cohorts overlap as contract changes came into effect at different times. Remploy commercialisation, and new contract terms, occurred in April 2015. Contract changes came into effect for the remaining providers in October 2015. ↩
-
An alternative approach would have been to define participants using their first referral. Under this approach an individual who did not participate following their first referral, but participated following a later referral would be in the comparison group, not the participant group. As a sensitivity check we conducted analysis using this approach and found similar impact estimates. ↩
-
This could be a ‘lock-in’ effect whereby participants spend the first weeks following referral engaging with Work Choice support rather than looking for, and gaining, employment that allows them to move off looking for work/low-income benefits. However, we do not see a corresponding negative impact on employment expected with a ‘lock-in’ effect. Alternatively, this pattern could arise if referred-only individuals do not start Work Choice due to having moved into employment, or increased their working hours, and subsequently losing eligibility for looking for work/low-income benefits. However, under this scenario we would also expect a corresponding negative impact on employment. Figure 3 3 shows that in the short-term following referral there is a negative impact on payrolled employment without receiving a looking for work/low-income benefit, and a positive impact on payrolled employment whilst receiving a looking for work/low-income benefit. This indicates that participants who move into employment quickly following referral do so whilst still receiving benefits, whereas those in the comparison group move into employment without receiving benefits. Furthermore, as shown in section 3.3, following referral there is a rapid increase in the proportion of the comparison group neither in payrolled employment nor receiving benefits. This movement of referred only individuals off benefits, either into employment or otherwise, could explain the short-term positive impact on looking for work/low-income benefit receipt. ↩
-
The information in footnote 5 applies to the later cohort also. ↩
-
This follows a variation of the circular flow of income, where money moves back and forth between households, firms, and government. In this simplified case, firms on aggregate produce output and pay wages to individuals of equal value, who subsequently spend their wages to consume that output. Some of this money flows to the government in the form of taxes, and then flows back to households and firms through public expenditure. ↩
-
As there are on average 1.26 starts per participant, the number of participants in each cohort was estimated by dividing the number of starts in that cohort by 1.26. This allowed us to estimate the programme cost per participant. ↩