Universal Credit Programme full business case summary
Published 7 June 2018

© Crown copyright 2018
This publication is licensed under the terms of the Open Government Licence v3.0 except where otherwise stated. To view this licence, visit nationalarchives.gov.uk/doc/open-government-licence/version/3 or write to the Information Policy Team, The National Archives, Kew, London TW9 4DU, or email: psi@nationalarchives.gov.uk.
Where we have identified any third party copyright information you will need to obtain permission from the copyright holders concerned.
This publication is available at https://www.gov.uk/government/publications/universal-credit-programme-full-business-case-summary/universal-credit-programme-full-business-case-summary
Foreword by Neil Couling
Senior Responsible Owner for the implementation of Universal Credit
Universal Credit is the most important and fundamental reform since the inception of the welfare state. It represents an opportunity to sweep away the complex, inefficient system of the past, to replace it with a simpler system that is more able to help people into work whilst supporting those who can’t work, and in doing so to reshape fundamentally the relationship between individuals and the state.
A reform this ambitious and large has naturally attracted high levels of scrutiny from Parliament and beyond. Ministers have therefore agreed, although these documents are not normally published, that we should publish a summary of the Universal Credit Full Business Case.
A Business Case is a document that supports the appraisal and evaluation of a government project. Each Business Case is developed according to “Green Book” guidance issued by HM Treasury, which sets out how to appraise policies, programmes and projects. It also provides guidance on the design and use of monitoring and evaluation processes before, during and after implementation. A Business Case goes through a process of scrutiny before ultimately being approved by Treasury Ministers. The Universal Credit Full Business Case received Treasury approval on 31 May 2018.
This Business Case clearly demonstrates that Universal Credit provides value for money and huge benefits for claimants, the broader population and the economy as a whole. Some of the most compelling aspects of Universal Credit are also highlighted here: the £2 billion total cost of investment against a social return to the economy of £34 billion over ten years; and an increase of people in employment of 200,000.
I am pleased to be able to share this Business Case summary which shows that these benefits are not purely financial, but have broader societal impact: Universal Credit supports people into work, will help them to progress whilst in work, and represents clear value for money for the whole economy.
Key Business Case Estimates
- The Full Business Case continues to demonstrate that Universal Credit remains deliverable, affordable and provides value for money with a Net Present (social)[footnote 1] Value (NPV) of £34 billion[footnote 2] (over 10 years) compared to a total investment cost of £2 billion.
- In steady state Universal Credit will generate economic value of £8 billion a year.
- This NPV reflects the positive economic impacts from Universal Credit increasing the number of individuals in employment by around 200,000 and increasing the total number of hours worked by 113 million per year for those already in work.
- Universal Credit operational costs break even against legacy operational savings from 2019/20 and are reduced in steady state by over £0.3 billion on a like for like basis. This saving funds the Labour Market support to an additional 1 million claimants not supported in legacy benefits.
- The net Departmental Expenditure Limit (DEL) savings, even after funding the additional Labour Market costs, is around £100 million in steady state.
- Whilst there have been many underlying changes and improvements in assumptions and modelling (including some changes to the economic impact methodology) since the Outline Business Case (OBC), the Full Business Case (FBC) continues to demonstrate value for money and a positive return from investing in Universal Credit.
1. The Economic Case
Key Findings (1)
- £34 billion is total estimated economic value of Universal Credit (NPV) consisting of:
- £19.3 billion from people choosing to work or work more
- £8.7 billion from distribution of welfare payments
- £7.5 billion from reduced fraud and error
- £1.2 billion Net DEL costs
- £ 8 billion – per year in steady state
Sources of Economic Benefits
A. Impacts resulting from individuals choosing to work / work more under Universal Credit:
- £5.2 billion – at steady state
- £19.3 billion – over the 10 years of the business case
B. Impacts resulting from differences in the level and distribution of welfare benefit payments:
- £2.7 billion – at steady state
- £16.2 billion – over the 10 years of the business case
C. Impacts resulting from changes in the costs of administering Universal Credit compared with the existing system:
- £0.3 billion – Operational savings per year in steady state (DEL)
1.1. The Economic case describes the economic and social costs and benefits of UC. The total value of discounted[footnote 3] benefits less costs describes whether the programme spending optimises public value.
1.2. All costs and benefits have been identified over the 10 year period of the business case in a discounted economic impact statement and a summary can be seen at Annex A. For a summary of the assumptions and uncertainties within the analysis see Annex B
1.3. The FBC demonstrates better value for money and a more positive return from Universal Credit than the OBC. This is due to a number of underlying changes and improvements in assumptions and modelling since the OBC, and an additional two full years of steady state benefits. (See a summary of the changes from OBC to FBC at Annex C)
1.4. The FBC economic case models three main sources of economic impacts triggered by Universal Credit compared to the legacy system (see a map of the entire modelling process at Annex D):
(A) Impacts resulting from individuals choosing to work / work more under Universal Credit
Key Findings (2)
It is estimated that:
- there will be an increase of approximately 200,000 individuals in employment in steady state as a result of Universal Credit as follows:
- increases due to financial incentives – approximately 110,000
- increases due to additional conditionality – approximately 30,000
- increases due to simplicity/smoothing – approximately 60,000
- those already in employment will work around 113 million additional hours (net) per annum under Universal Credit, due to improved incentives for those already in work
- around 30,000 additional individuals will be in work once Universal Credit is fully rolled out due to additional conditionality
- around 60,000 additional individuals will be in work once Universal Credit is fully rolled out due to the simplicity of the system and the smoother transitions into work compared to legacy
1.5. The policy is modelled with reference to the counterfactual of the legacy benefit system. Universal Credit has an impact on the labour market through changes in financial incentives (i.e. monetary incentives to work/work more) and non- financial incentives (i.e. conditionality and improved simplicity).
1.6. In order to understand how people respond to these factors, a combination of the academic evidence on people’s responses to previous welfare system reforms with the DWP Policy Simulation Model (PSM) is used. The PSM is used to understand drivers of labour market decisions for different groups due to the introduction of Universal Credit. The potential positive and negative impacts on work participation are added together and multiplied by the population. See Annex C.
(i) Financial incentives
1.7. Universal Credit will affect work incentives. There are two financial factors that influence a person’s incentives to work at all under Universal Credit:
- the relative difference between their out of work income under Universal Credit as compared to the legacy system
- the relative difference between their in work income (if they worked) under Universal Credit as compared to the legacy system
1.8. Elasticities taken from published external research[footnote 4] are used to estimate the response to the factors. In-work income elasticities are positive reflecting that if in-work income is higher people will be more likely to move into work. Out of work income elasticities are negative reflecting that if out of work incomes are higher people will be less likely to stay in work.
1.9. These positive and negative influences are used to calculate a net change in participation probability for each individual, we then average over all individuals in the population and then multiply by the overall population to calculate the estimated change in participation volume.
1.10. These estimates do not include people on the Employment and Support Allowance (ESA) Support Group as it is assumed that their disability is the main barrier to work, not the benefit system/financial incentives. The self-employed and full time students are also excluded.
1.11. When considering how many hours people will choose to work when on Universal Credit compared with the legacy system, there are two effects to estimate: an income effect and a substitution effect.
1.12. The income effect leads to a reduction in labour supply. This is based on the notion that people have a target income in mind and so if work is made more rewarding they will respond by reducing the hours worked to meet their target income.
1.13. The substitution effect leads to an increase in labour supply. This is based on the notion that if work is made more rewarding relative to leisure then people will increase the number of hours they work in response. The overall impact on hours worked is the result of these two effects.
1.14. The difference between out of work net income under Universal Credit is compared with the legacy system for each individual and is multiplied by the appropriate elasticity (taken from external research) to give us an estimate of the income effect.
1.15. The change in net in work income from one extra hour of work under Universal Credit relative to the change in net in work income from one extra hour of work under the legacy system is multiplied by the appropriate elasticity[footnote 5] to give an estimate of the substitution effect.
1.16. Summing the income and substitution effects across individuals provides the overall changes in hours due to the financial incentives provided by Universal Credit. This is done separately for selected groups of individuals as research shows lone mothers, women in couples with children and women in couples without children will respond in different ways to financial incentives by changing their hours of work.
Employment under 16 hours per week adjustment
1.17. Universal Credit removes some of the financial barriers to working under 16 hours per week, however, since there is currently little incentive to take-up employment for under 16 hours per week in the legacy system, there are relatively few people working those hours. This means that calculating the impact on participation in under 16 hours per week employment using legacy system data would lead to a Universal Credit employment impact which is biased downwards by the legacy rules[footnote 6]. To describe the Universal Credit impact, the approach is to offset the bias by adjusting the formula separately for under 16 hours per week employment. If the same incentives in Universal Credit applied now to legacy, we might expect a higher number of people with children working under 16 hours. Therefore, when calculating the employment impact, the elasticity is adjusted to compensate for the low number of people currently working under 16 hours, increasing the lone mother under 16 hours employment elasticity as well as, but to a slightly lesser extent for mothers in couples. There is uncertainty around this judgement so the estimates are halved to reflect this.
1.18. Some claimants near the Tax Credit threshold will potentially reduce their labour supply in Universal Credit. It is assumed they will reduce their hours if they work 16-18 hours per week by 2 hours per week.
1.19. Overall, we estimate that around 110,000 additional individuals will be in work once Universal Credit is fully rolled out, of which around 70,000 are from jobs at under 16 hours per week.
(ii) Non-financial incentives: additional conditionality
1.20. In Universal Credit, there are groups of claimants who, for the first time, will need to make a commitment to look for work and in return will be offered support to find work. This include the previous claimants of Child Tax Credit (CTC) only, Housing Benefit (HB) only, partners, those in the assessment phase but yet to complete a Work Capability Assessment or those appealing a fit-for work decision. Based on evidence from Jobseekers Allowance (JSA) trials, it is estimated this will increase employment. However this effect is reduced by a third in the assumptions to account for the uncertainty of applying this evidence to a fundamentally different Universal Credit environment.
(iii) Non-financial incentives: a simpler and smoother benefit system
1.21. The design of Universal Credit makes the payoff from taking up work clearer to individuals on Universal Credit than they were on legacy benefits. Also, the transition into work is “smoother” due to reduced transaction costs of closing and reclaiming benefit. Evidence from the introduction of work focussed interviews in the lone parent pilots, a suite of policies designed to help lone parents into work in selected Jobcentre Plus districts in Great Britain during 2004-05, shows how simplification clarified claimants’ ability to move off benefits into work.
1.22. The research[footnote 7] showed a 1.8 percentage point increase in exit rates. The business case assumes a conservative 0.5 percentage point increase to reflect that the research doesn’t isolate impact to simplicity (i.e. it includes impacts of other aspects of work focussed interviews).
1.23. For smoothing, evidence from the evaluation of in work credit reported a 1.4 percentage point increase in employment attributed to the fact that the amount paid is more easily administered. Half of this impact has been applied in Universal Credit modelling of smoothing (reflecting that this evidence relates to exit rates rather than entry into employment).
(B) Impacts resulting from differences in the level and distribution of welfare benefit payments.
Key Findings (3)
Impacts resulting from differences in the level and distribution of welfare benefit payments:
- £2.7 billion – at steady state
- £16.2 billion – over 10 years
Combined redistribution value of changes to take-up, entitlement and sensitivity to changes in earnings:
- £1.4 billion – at steady state
- £8.7 billion – over 10 years.
Fraud and error savings:
- £1.3 billion – at steady state
- £7.5 billion – over 10 years.
1.24. Economic benefits are much broader than exchequer finances. The value of economic benefits is based on wider social costs and benefits, this is known as ‘Distributional Impact’ or ‘Equity Value’ and it is the recognition that people who are on lower incomes will place more value on an extra pound of income than someone of higher income. Universal Credit will generate positive distributional impacts.
1.25. This section will explain how this works by describing the impact of delivering Universal Credit compared to the legacy system on the income distribution, particularly in how it transfers money to people in different income brackets, and generates social economic value[footnote 8].
1.26. There are four parts to this: take-up, entitlement, sensitivity to changes in earnings, and fraud and error.
Take-up, entitlement and sensitivity to changes in earnings
1.27. Universal Credit, by replacing six working age benefits into a single benefit, increases benefit take-up as it is no longer possible only to take up part entitlement. This costs around £2.4 billion per year once Universal Credit is fully rolled out. This is not counted as an economic benefit, however we estimate the economic value of this by applying distributional weights[footnote 9] to it which adds extra economic value (because Universal Credit take-up favours those lower in the income distribution). The economic redistribution value of take-up is the difference between the social welfare weighted total and the original increase due to take-up. This is around £15 billion over 10 years (from 2017/18).
1.28. Entitlement refers to changes in the Universal Credit rules (excluding the effects of take up) compared to the legacy system. The value is calculated in the same way but unlike take-up, the net effect is a reduction in Universal Credit benefit income, and so there will be an economic redistribution disvalue, of around £2.7 billion.
1.29. Similarly, sensitivity to changes in earnings (which arises because Universal Credit is able to collect earnings information through Real Time Earnings (RTE) in a timelier manner compared to tax credits). This reduces benefit spend as it removes the tax credit income disregard and represents economic redistribution disvalue, of around £3.4 billion in 2017/18 prices and discounted over 10 years (from 2017/18).
Fraud and error
1.30. Recovery of fraud and error are not treated as transfer payments (see glossary) as they represent a gain to government and society overall, but not a loss to individuals[footnote 10]. Therefore fraud and error savings are applied as the economic value of this activity.
2.The Financial Case
Key Findings (4)
Savings to the Welfare Budget (AME)
Overall reduction in spending
- £3.6 billion – per year in steady state
- £19.8 billion – over the 10 years of the business case
Employment gains
- £1.8 billion – per year in steady state
- £9.1 billion over the 10 years of the business case
Fraud and error Savings
- £1.3 billion per year in steady state
- £9.1 billion over the 10 years of the business case
Sensitivity to changes in Earnings savings
- £0.8 billion – per year in steady state
- £5.5 billion – over the 10 years of the business case
Savings to the Departmental Budget (DEL)
- £0.3 billion – Reduction in operational costs compared to legacy (like for like) in steady state
- 26% of service centre sites are exceeding average caseload per case manager expectations and the proportion rises the more mature the location
(A) Savings to the Welfare Budget (AME)
For a full list of the AME impact of Universal Credit see Annex E.
For a summary of the baselines see Annex F.
2.1. Employment gains are the reductions in AME as a result of claimants taking on employment or increasing hours worked thus reducing the amount of Universal Credit being paid by £1.8 billion per year in steady state.
2.2. Fraud and error in the legacy system leads to higher benefit payments than would otherwise be the case. The design of Universal Credit will lead to reductions in fraud and error resulting in saving to the Exchequer of £1.3 billion per annum in steady state. Key design features impacting this include:
- RTI – improved accuracy – as Universal Credit payments will be based on RTI data that provides monthly information about PAYE earnings and non- state pension payments received by claimant each month
- No hours rule – entitlement to Tax Credits is dependent on working a minimum number of hours. Fraud and error occurs when claimants overstate their hours. In Universal Credit, entitlement is based on income amount rather than hours, so this cause of incorrectness will not exist
- Ending Tax Credit Claims – HMRC requires claimants to renew their Tax Credits claim each financial year by the end of July but, if they do not submit a renewed claim, they continue to be paid at their old rate until that deadline is reached or they inform HMRC that they are no longer claiming
- Sensitivity to changes in earnings – Universal Credit will not have any income changes disregards in place, as is currently the case in Tax Credits. Any change in the amount of income for those on or near the taper will impact the amount of Universal Credit they are entitled to receive
- Capital limits – Unlike the Tax Credits system, Universal Credit entitlement is dependent on the amount of capital owned. The adoption of capital thresholds for in-work claimants will lead to increased levels of fraud and error due to incorrectly reported capital
2.3. Sensitivity to changes in earnings is the impact of Universal Credit being able to react dynamically to changes in the working status of its claimants to an extent that is not possible in the current benefit/credits regime. The Tax Credits scheme, in which income is assessed annually, has an ‘income change disregard’ in place which means that in-year changes in income up to a defined threshold do not affect entitlement. The existence of the disregards in Tax Credits contributes to an overall increased annual Tax Credits expenditure which under Universal Credit will be removed.
2.4. Marginal cost of Universal Credit is the net impact i.e. the reduced legacy benefit payments against the amounts expected to be paid in Universal Credit (excluding sensitivity to changes in earnings; transitional; and fraud and error). In 2024/25 this is expected to be £0.3 billion.
2.5. Transitional protection will be applied to claimants that are migrated by the Department to ensure there are no cash losers at the point of migration to Universal Credit. This is estimated to be £0.6 billion in 2024/25.
(B) Savings to the Departmental Budget (DEL)
(i) Savings through Efficiency
2.6. Universal Credit operational costs break even against legacy operational savings from 2019/20 and are reduced in steady state by over £0.3 billion (c30%) on a like for like basis.
2.7. This saving is used to fund the Labour Market conditionality regime providing support to an additional 1 million claimants not supported in legacy benefits, at a cost of £0.2 billion. Therefore the net reduction in operation costs is £0.1 billion.
2.8. On a like for like basis and when compared to legacy, Universal Credit is significantly more efficient in the administration and processing of claims and caseload. Key factors in achieving efficiency include:
- service automation – increasing claimant self-service, and increasing straight through automated processing via automated and risk-based verification
- delivery via online/digital channels
2.9. Furthermore, as the Universal Credit system matures the caseload mix will change – moving from 40% of claimants currently in the full conditionality regime to only 20% by steady state as increasing numbers of people in work transfer from tax credits. As the case mix changes, on average, the cost of administering a Universal Credit claim will fall.
2.10. At OBC efficiency was measured through Unit Costs however the FBC moves away from the Unit Costs as a measure of efficiency. New methods of measuring efficiency are being developed with the primary approach being caseload per FTE.
2.11. In April 2018 at a national level, it is expected that the average caseload per case manager will be 285. Current performance data across all locations shows this is already being exceeded in 26% of cases. Across the most mature sites this performance increases to 43%. In Canterbury the most mature location this grows to 76%. This demonstrates the Department’s ability not only to deliver, but to exceed the expected level of productivity.
2.12. However, it is recognised that it has taken longer to achieve than previously assumed. This has been due to complexity of caseload and geographical alignment of service centres and jobcentres that have been rolled out, which has required us to draw forward recruitment and training spend.
2.13. Furthermore, current performance does not take account of the changes that will occur in terms of caseload mix. Over time this will include, as a proportion, fewer new claims compared to longer claims. New claims are the expensive element of the service due to the level of activity and verification to on board new claimants. This will continue to reduce over time from 21% in January 2018 to 4% in March 2022.
2.14. All the evidence demonstrates that the efficiency levels forecast in this business case are achievable and provides the foundation for confidence in the ability for operations to deliver the increasing efficiency forecasts over time as Universal Credit Full Service beds in and matures in each site.
2.15. In 2018 a test of productivity assumptions is planned by withholding any supply uplift from some locations in order test the forecasts on the number of cases agents can effectively manage. A report demonstrating productivity will be developed with the aim of demonstrating how individuals, teams and site efficiency matures over time.
2.16. The overall efficiency of Universal Credit produces significant savings in terms of operational and staffing costs for DWP, HMRC and Local Authorities as Universal Credit replaces the legacy services.
2.17. This allows the re-investment of these savings into extending the conditionality and labour market regime to up to an additional 1 million claimants, which in turn supports Universal Credit’s labour market impacts of up to an additional 200,000 people into work and provides significant AME savings and wider economic benefits
(ii) Investment Costs
Key Findings (5)
£2 billion – Total investment expenditure forecast
- £575 million – IT costs
- £338 million – Programme costs
- £276 million – Migration costs
- £195 million – Commissions and recharges
- £185 million – Universal support
- £157 million – HMRC
- £116 million – Learning and development
- £87 million – Other implementation
- £68 million – Exits
2.18. The key investment areas are:
- IT - the technology cost of developing the Universal Credit Live Service, the Full service and the security solution
- Programme – covers the staffing and associated cost of the teams working within the Core Universal Credit Programme and across DWP on a commissioned basis. A summary of Key Universal Credit Programme background and information is available at Annex G
- Migration (natural and managed) will bring people from legacy benefits, administered across several organisations, into Universal Credit and includes ensuring that claimants of legacy benefits are migrated efficiently
- Learning and development – the cost of ensuring that all staff working on Universal Credit and all staff who need to be trained within legacy, to allow for movement of staff between legacy benefits and Universal Credit, are effectively trained
- Universal Support/Pilots and trials: includes £170 million for Universal Support, with the remainder of the costs covering a range of pilots and trials to test elements of the Universal Credit service
- HMRC – including development and decommissioning of HMRC tax credit IT systems, for example HMRC staff involved in the closing of tax credit claims
- Exits – is the expected cost of exiting a number of staff across HMRC and LAs due to the net staffing requirement under Universal Credit being lower
- Other implementation costs are operational support costs associated with the implementation and delivery of the Live Service
- Commissions and recharges are the costs in areas of DWP that are not part of the programme but are making significant contributions to the delivery of Universal Credit
2.19. Total expenditure is £0.3 billion higher than the forecast in the OBC (£1.7 billion) mainly due to increased scope of the Programme (£32 million) and re-categorisation of Universal Support (£170 million) from running cost to investment cost.
(iii) Whole life Costs since OBC
2.20. Whole life Costs is our estimate of the investment cost plus the costs of running the entire system from 2010/11 through to 2026/27. Whole life Costs in the FBC have fallen by £0.9 billion from £13.6 billion in OBC to £12.7 billion in the FBC, this is due to:
- lower operating costs
- lower volumes
- re-planning to transition and migration
Annex A: Value for Money Economic impact
Discounted at each line (for the 10 years figures)
Negatives (costs) in brackets
| Value for money (economic case) - Discounted cash flow | Steady State £m (undiscounted) | 10 Years of the FBC £m (undiscounted) | 10 Years of the FBC £m (discounted) |
|---|---|---|---|
| Total investment | (2) | (933) | (872) |
| DEL recurrent | |||
| Recurrent costs | (1,056) | (9,469) | (8,015) |
| Recurrent savings* | 1,155 | 9,197 | 7,677 |
| Net DEL recurrent | (99) | (273) | (338) |
| Economic impact | |||
| People choosing to work/work more | 5,172 | 24,515 | 19,294 |
| Distribution of welfare payments | 1,417 | 10,546 | 8,676 |
| Reduced fraud and error | 1,273 | 9,139 | 7,508 |
| Net economic impact | 7,862 | 44,200 | 35,478 |
| Total | 7,959 | 42,995 | 34,269 |
| Net cashflow discounted (NPV) | N/A | N/A | 34,269 |
Annex B: Key assumptions and uncertainties
The challenge of estimating the impact of Universal Credit is that the available evidence base is largely based on the legacy system, which is different from Universal Credit. The analysis of financial incentives applies the most relevant research and survey data but requires judgement (as in employment under 16 hours or the outcomes of those moving into work) or contains statistical uncertainty (from the FRS survey). These limitations also mean there are behavioural impacts of Universal Credit that cannot be captured; it is very difficult to evidence for a behavioural responses to Universal Credit[footnote 11] (so no attempt to model non-linearity of the benefit system has been made).
There are uncertainties around the estimates of financial incentives, and non- financial incentives (simplicity/smoothing and conditionality).
For financial incentives, the key sensitivity is the application of income elasticity of employment in deriving the labour market impacts of UC. The estimates used in the economic case are based on external published research. However, the sensitivity of these elasticity to the impacts on employment has been tested; this demonstrated a one to one relationship between the elasticity and employment impacts, so for example, a 50% increase in the elasticity point estimates led to a 50% increase in employment impacts from financial incentives.
For simplicity/smoothing, the key sensitivities are the evaluation estimates of comparable policies observed in the relevant section on non-financial incentives. In the estimate of simplicity for example, if a 1 percentage point increase in employment was used rather than 0.5 percentage points, and in the estimate of smoothing, if a 1.4 percentage point estimate was used instead of 0.7 percentage points, then the UC employment impacts from simplicity/smoothing would be double the original 60,000 estimate in the economic case.
For conditionality, the evidence used was the experience of JSA conditionality trials and this was reduced by a third when applied to UC employment. If this adjustment was not made the estimate of 30,000 additional employment would increase to 45,000.
More generally issues relating to intra-household allocations of income are ignored and only the labour supply effects are modelled (so on the demand side, it is implicitly assumed that everybody can find a job that allows their preferred number of hours). For simplicity of approach it is assumed that, for couple benefit units, the number of hours worked/participation decision by the other member of the benefit unit remains constant.
There is a risk employment impacts from financial incentives and non-financial incentives may contain some overlap. The approach acknowledges this and is one of the reasons for taking a conservative approach to the application of the estimates used.
Annex C (1): Key Changes OBC to FBC
- Structural changes in FBC:
- the FBC includes an additional two full years of steady state benefits compared to OBC (in the final years of FBC 2025/26 and 2026/27 this is worth around £17 billion undiscounted or £13 billion in NPV terms)
- Methodology changes in FBC:
- error savings now form part of the economic benefits
- employment impact now based on economic activity (as a proxy for Gross Domestic Product) rather than financial flows (e.g. AME, taxes)
- Employment impacts of UC compared to the legacy system have reduced by 50,000 to 200,000 additional employment since OBC (before discounting)[footnote 12]
- The Re-distributional impacts, (excluding employment), total (before discounting) over period of the business case £10.5 billion in the FBC whereas in OBC was £11.4 billion
- The FBC fraud and error savings in the economic case (before discounting) total £9.1 billion. The OBC only included fraud savings as an economic benefit and totalled £1.1 billion over period of the business case
Annex C (2): Differences between the approach taken OBC to FBC
| Impact | OBC | FBC |
|---|---|---|
| DEL | The absolute fiscal cost | The absolute fiscal cost |
| Fraud | The absolute fiscal saving - assumed to be a gain to government but not a loss to individuals | The absolute fiscal saving - assumed to be a gain to government but not a loss to individuals |
| Error | Not scored - assumed fiscal saving is a gain to government but equivalent loss to individuals nets off | The absolute fiscal saving - assumed to be a gain to government but not a loss to individuals |
| Sensitivity to changes in earnings | The re-distributional impact value to society of reduced spend on lower income groups | The re-distributional impact value to society of reduced spend on lower income groups |
| Take-up and entitlement | The re-distributional impact value to society of increased take- up/reduced entitlement spend on lower income groups | The re-distributional impact value to society of increased take- up/reduced entitlement spend on lower income groups |
| Labour supply from increases in participation and hours worked[footnote 13] | Absolute change in disposable income for individuals[footnote 14] Distributional impact of the change in disposable income for individuals Gains to the exchequer from increases in direct taxes and reductions in benefit payments Gains to the NHS |
Distributional impact of the change in disposable income for individuals[footnote 15] Change in output of the economy – estimated as change in gross wages + employer NICs Gains to the NHS |
Annex D: Model map representation of the modelling
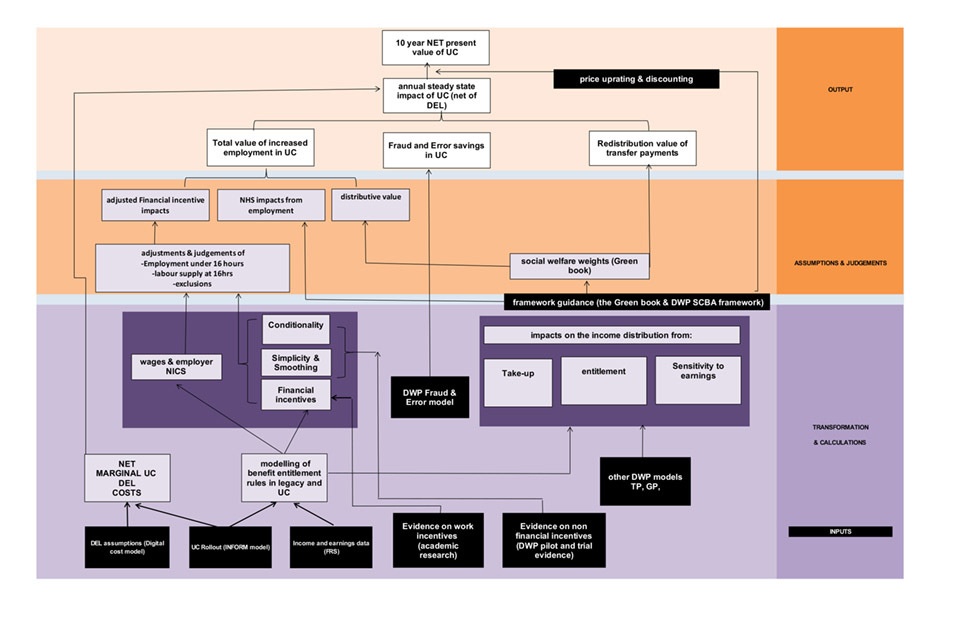
Annex D: Model map representation of the modelling
View the model map [PDF, 72.9KB, 1 page]
Annex E: AME impact of Universal Credit
| AME impact of UC at steady state and over the 10 years of the FBC | 2024/25 | Total |
|---|---|---|
| AME (Dynamic) - Employment Gains | £1.9 billion | £9.1 billion |
| Fraud and error | £1.3 billion | £9.1 billion |
| Sensitivity to changes in Earnings | £0.8 billion | £5.5 billion |
| Marginal cost of UC (excluding sensitivity to changes in earnings and employment gains) | £0.3 billion | £1.6 billion |
| Transitional Protection | (£0.6 billion) | (£5.5 billion) |
| Total | £3.6 billion | £19.8 billion |
Total does not sum due to rounding
Negatives (costs) in brackets
Annex F: Baselines
Financial baselines
2.21. The Departmental Expenditure Limits (DEL) and Full Time Equivalent (FTE) baseline for the administration of 6 existing Benefits i.e. Job Seekers Allowance (JSA), Employment Support Allowance (ESA) and Income Support (IS), administered by DWP, Working and Child Tax Credits, administered by HMRC and Housing Benefit (HB) for working age claimants, administered by all 380 Local Authorities (LAs) is approximately £1.6 billion per annum and c40,000 staff across the three organisations.
2.22. The AME baseline for the legacy benefits that will be absorbed into Universal Credit is approximately £63 billion per annum (based on Autumn 2017 volumes).
Table: Legacy baseline
| Legacy benefit | £billion |
|---|---|
| DWP (JSA/IS/ESA) | 17.0 |
| LA (HB) | 18.8 |
| HMRC (Working Tax Credit/Child Tax Credit) | 27.3 |
| Total | 63.2 |
2.23. Fraud and error in the legacy system leads to higher benefit payments than would otherwise be the case and are of the order of £4 billion per annum.
Non financial baselines
2.24. There are around 7 million households in receipt of legacy benefits.
Table: Steady State counter-factual caseload (households) by legacy benefit type
| Benefit Combination | Caseload |
|---|---|
| JSA, ESA, IS | - |
| and no other benefit | 1,100,000 |
| and Housing Benefit | 1,450,000 |
| and Tax Credits | 140,000 |
| and Housing Benefit and Tax Credits | 680,000 |
| Tax Credits only | 2,130,000 |
| Tax Credits and Housing Benefit | 860,000 |
| Housing Benefit only | 440,000 |
| Reduction from Universal Credit compared to legacy | -260,000 |
| Total | 6,550,000 |
Annex G: Universal Credit Programme Background and Key information
Programme Objectives
2.25. The Programme has 5 key objectives as follows:
- Delivering full employment – Universal Credit will deliver 200k additional entrants into the Labour Market once fully implemented
- Reducing and preventing fraud, error – Universal Credit will save approximately £1.3 billion in fraud and error (excluding sensitivity to changes in earnings reductions in Tax Credits)
- Controlling welfare cost – Universal Credit will control the cost of welfare through targeted savings of £3.6 billion in steady state when compared to the legacy system
- Providing a safety net – Universal Credit will allow the Department to tailor our offer to those who need it most, with extra assistance for vulnerable / complex claimants, and those with disabilities
- Increasing efficiency through automation – Universal Credit will achieve savings representing a 29% reduction to the cost of administering the current legacy system (on a like for like basis), a saving of some £0.3 billion
Changes in Scope since OBC
2.26. Universal Credit has been designed in order to continue make changes and improvements along the way. We are delivering significant additional scope in terms of policy changes since OBC, a large proportion of which the Department has not received additional funding for, including:
- Improvements in the first assessment period. Changes announced in November 2017 included a set of Universal Credit Budget measures worth £1.5 billion in order to address concerns raised around the first assessment period, and helping support the vast majority of claimants transitioning onto Universal Credit, We re-profiled the ro:llout plans in order to deliver these changes safely and securely. These changes include
- the removal of the 7-day waiting period for new claims to Universal Credit;
- changes to advances – enabling claimants to repay over 12 months, and claim up to 100% of their indicative entitlement
- introduction of 2-week transitional housing payment for those
- The reduction in the Universal Credit taper rate from 65% to 63%, announced at Autumn Statement 2016 and which took effect from April 2017. This measure increased the financial work incentives for claimants to move into work, changing the volume of claimants and their associated Universal Credit payments
- A series of welfare reforms, which were announced at Summer Budget 2015 or Autumn Statement and Spending Review 2015 (e.g. 18-21 Youth obligations, lone parent conditionality changes, changes to the work allowances) and required a change to the scope, policy design and delivery schedule of the programme. The revised rollout of Universal Credit was announced in Parliament on the 20 July 2016
- Changes to the labour market regime as part of Spending Review (SR) 2015 settlement, most notably the move from the legacy Work Programme to the Work and Health Programme, and the introduction of the Youth Obligation. These changes, went live across 2017, changed the volumes and amount of support Universal Credit provides to unemployed claimants, and therefore the subsequent labour market costs for the Jobcentre Plus regime in the business case
Operating Models
The Programme has developed operating models that provide a more detailed view of the main elements of the Universal Credit service, and how they will be brought together to deliver at a series of defined points in the future. These align with the Programme objectives.
The Target Operating Model (TOM) describes the Universal Credit service as it will be when fully implemented and the interim Operating Models (IOM) describe the evolution of the Universal Credit service as it develops over time and is rolled out to increasing numbers of claimants and claimant groups.
Key features include:
- more efficient digital systems/automated processes ¬– Universal Credit Full Service will automate a large proportion of our back-end processes, driving business efficiencies and a higher quality service;
- multi-channel access (primary channel will be digital) with additional support for those who require it either by Freephone number or face-to-face;
- vulnerable / complex claimant support We are continuously reviewing and improving the service for vulnerable people who claim Universal Credit to ensure that it is accessible and responsive to their needs. This includes specific training for work coaches and £170 million investment in Universal Support to help people manage the transition to Universal Credit including digital capability and managing the monthly payment
- targeted labour market support with tailored support products/services for those who require it. Under Universal Credit up to an additional 1m claimants will be brought into conditionality that previously had no requirements placed upon them
- claimant commitment claimant’s obligations are recorded in one place, clarifying both what people are expected to do in return for benefits and support, and exactly what will happen if they fail to comply. They are tailored to claimants individual circumstances
- focus on earnings not hours worked – a fundamental tenet of the Universal Credit System which makes it more transparent than the legacy system and removes the cliff edges
- claimants paid directly and monthly – this replicates the world of work, and is fundamental to the assessment period and payment structure of Universal Credit. Vulnerable claimants can who have difficulty can receive budgeting Support or in a limited number of cases Alternative Payment Arrangements including managed payment of rent to a landlord, more frequent Payments, or Split payments
- a single unified taper of 63% of net income for all claimants, clearly demonstrating that it always pays to be in work
- Real Time Information (RTI) system to collect regular Pay As You Earn (PAYE) information from employers and pension providers as individual payments are made. This real-time flow of information between employers, HMRC and DWP enables Universal Credit to validate earnings every month
Glossary
Annually managed expenditure (AME)
Costs and savings in this area relate to welfare spend i.e. the Universal Credit and legacy benefit payments to claimants. This is demand led and separate from the Departmental budget.
Departmental Expenditure Limits (DEL)
Costs and savings in this area relate to the Department for Work and Pensions budget which is set at the spending review and is used for running the Department’s services such as Universal Credit Programme and Operations.
Digital cost model
The digital cost model describes the costs of delivering UC.
Discounting
A discount rate is used in appraisals of future costs and benefits because money now is usually more highly valued than money in the future. A discount rate effectively reduces the value of benefits or costs in future compared with now (at the start of the appraisal period). Future payments to which a discount rate has been applied (i.e. that have been discounted) are said to be in net-present-value (NPV) terms. The discount rate used here is 3.5%, in accordance with the Green Book.
Distributional / Re-distributional value
Both Distributional / Re-distributional value describes the economic value of diminishing marginal utility of income. It states that the value of an additional pound of income is higher for a low-income recipient and lower for a high-income recipient. Distributional refers to the act of sharing resources (such as the distributional value of UC additional employment) while re-distributional refers to the act of changing the distribution of resources (such as the value of UC take-up, entitlement and sensitivity to changes in earnings compared to the legacy benefit system).
Elasticity
Elasticity is the measurement of how an economic variable responds to a change in another. It can be quantified as the ratio of the percentage change in one variable to the percentage change in another variable, when the latter variable has a causal influence on the former.
INFORM
The DWP INFORM (Integrated Benefit Forecasting) model is used to create key UC data volumetrics which are used by Operational Planning and for general analysis, which feeds into the UC expenditure forecasts. It’s an integrated dynamic microsimulation model of the working age benefits system: this means it forecasts caseloads by individually ageing the claimants each month and modelling what happens to each of them on benefits (e.g. joining, leaving, changing circumstance), based on past evidence.
Policy Simulation Model
The Policy Simulation Model (PSM) is a static microsimulation model which encapsulates the tax and benefits system, and population, of Great Britain. It is based on survey data from the Family Resources Survey (FRS) which is uprated to simulate the current year, together with several years into the future. It produces outputs including the financial and work-incentive impacts on a representative sample of the GB population from hypothetical policy changes to the tax and benefits system.
Transfer Payments
Transfer payments pass purchasing power from one person/ entity to another and do not involve the consumption of resources. They include the transfer of resources between people such as gifts, taxes or social security payments and should be excluded from the overall estimate of social value. In the UC economic case, take-up, entitlement and sensitivity to changes in earnings are transfer payments while fraud and error are non- transfer payments. P.113 HMT Green book.
Abbreviations
| Abbreviation | Description |
|---|---|
| AME | Annually Managed Expenditure |
| DCF | Discounted Cash Flow |
| DEL | Departmental Expenditure Limit |
| DWP | Department for Work and Pensions |
| ESA | Employment and Support Allowance |
| FTE | Full Time Equivalent |
| HB | Housing Benefit |
| HMRC | His Majesty’s Revenue and Customs |
| HMT | His Majesty’s Treasury |
| IOM | Interim Operating Model |
| IPA | Infrastructure and Projects Authority |
| IS | Income Support |
| IT | Information Technology |
| JSA | Jobseeker’s Allowance |
| LA | Local Authority |
| MPA | Major Projects Authority |
| MPRG | Major Projects Review Group |
| NHS | National Health Service |
| NPV | Net Present Value |
| OBC | Outline Business Case |
| PAYE | Pay As You Earn |
| RTE | Real Time Earnings |
| RTI | Real Time Information |
| SOBC | Strategic Outline Business Case |
| SR15 | Spending Review 2015 |
| SRO | Senior Responsible Owner |
| TOM | Target Operating Model |
| UC | Universal Credit |
| VFM | Value for Money |
-
This describes wider social and economic costs and benefits, using the method of discounting, (see Glossary) ↩
-
All figures rounded see annex A for detail ↩
-
This relates to time preference which captures the preference for value now rather than later (see glossary) ↩
-
For lone mothers: Brewer, Duncan, Shepherd and Suarez 2005. For all other groups: Source: Meghir 2008 (author analysis) ↩
-
Blundell,Duncan,Meghir, 1998 ↩
-
Family Resources Survey (FRS) data shows that Lone mothers on benefits/tax credits are 18 times more likely to work over 16 hours than work under 16 hours (Mothers in couples with children are 8 times more likely). ↩
-
Source: DWP research reports Research Report 606 and 484 ↩
-
Economic value here describes the economic principle of the diminishing marginal utility of income. It states that the value of an additional pound of income is higher for a low-income recipient and lower for a high- income recipient, in line with Green book practice. ↩
-
See page 80 of Green book for a description of how these are calculated ↩
-
For fraud, the rationale is that claimants shouldn’t systematically forecast fraud payments (illegal activity), while error payments represent windfall gains. ↩
-
However, modelling includes a labour supply reduction of 2hrs for claimants working within 16-18 hours/week on working tax credits ↩
-
Previous employment impact estimates have been put into the public domain through the Universal Credit at Work publication, which were updated in the Universal Credit employment impact analysis: update, and through responses to Parliamentary Questions and correspondence with Members of Parliament ↩
-
The approach to calculating the labour supply impacts in terms of methodology and approach in FBC is unchanged from OBC ↩
-
Indirect taxes subtracted from disposable income ↩
-
Indirect taxes not subtracted from disposable income on the basis that the utility value of goods purchased is represented by the full price (as the spending is not mandatory). ↩