UK International Climate Finance results 2025
Published 9 October 2025

© Crown copyright 2025
This publication is licensed under the terms of the Open Government Licence v3.0 except where otherwise stated. To view this licence, visit nationalarchives.gov.uk/doc/open-government-licence/version/3 or write to the Information Policy Team, The National Archives, Kew, London TW9 4DU, or email: psi@nationalarchives.gov.uk.
Where we have identified any third party copyright information you will need to obtain permission from the copyright holders concerned.
This publication is available at https://www.gov.uk/government/publications/uk-international-climate-finance-results-2025/uk-international-climate-finance-results-2025
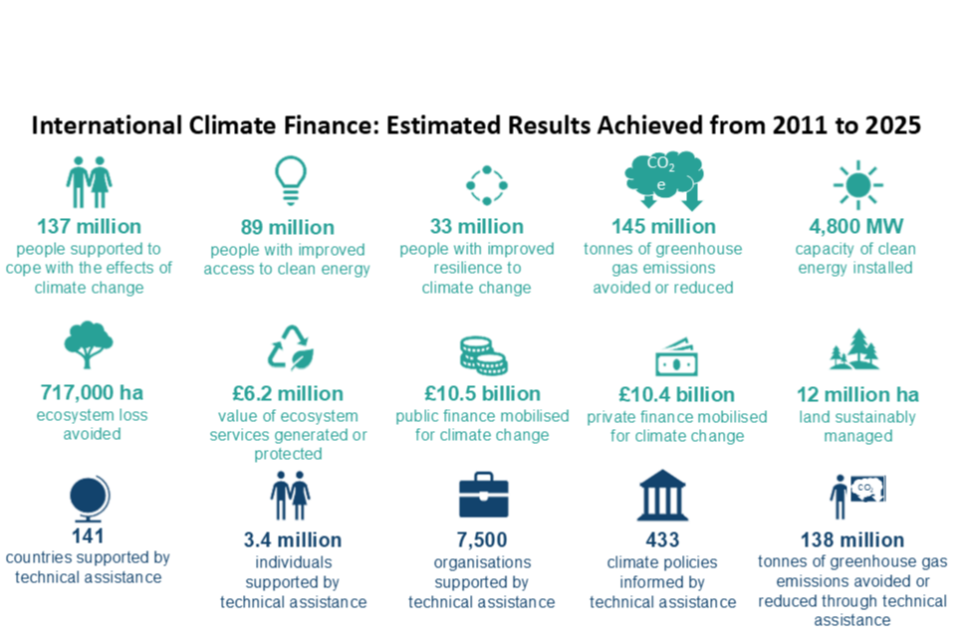
An infographic summarising the main results
- an estimated 137 million people have been supported to better adapt to the effects of climate change as a result of UK International Climate Finance since 2011
- UK International Climate Finance has helped to mobilise an estimated £21 billion in public and private finance combined since 2011
- through UK International Climate Finance, an estimated 145 million tonnes of greenhouse gas emissions have been reduced or avoided since 2011
- an estimated 12 million hectares of land are managed more sustainably as a result of UK International Climate Finance since 2011
Introduction
UK International Climate Finance (ICF) is Official Development Assistance (ODA) the UK provides to help developing countries reduce greenhouse gas emissions, biodiversity loss, damage to the environment and adapt to the effects of climate change. These investments help developing countries to:
- adapt to climate change and become more resilient to its effects, both now and in the future
- grow their economies with less carbon
- use natural resources in a sustainable way
- increase access to clean energy technologies
- reduce deforestation and protect natural habitats
The ICF portfolio is currently delivered jointly across 4 UK government departments:
- Foreign, Commonwealth & Development Office (FCDO)
- Department for Energy Security and Net Zero (DESNZ)
- Department for Science, Innovation and Technology (DSIT)
- Department for Environment, Food & Rural Affairs (Defra)
In addition to providing International Climate Finance (ICF), the UK government has made sure that, since 2024, all new bilateral ODA programmes are aligned with the Paris Agreement. Government departments use processes like the Programme Operating Framework to keep programmes in line with these commitments. This approach means the UK’s aid helps to reduce carbon emissions, protect the environment, and support communities to adapt to climate change while also supporting green economic growth. These actions are important for meeting the targets of the Paris Agreement, and for protecting our economies, livelihoods and wellbeing, which all depend on nature.
This publication highlights the main achievements of UK International Climate Finance since 2011. It summarises results from 15 key measures used to track progress in UK international development programmes that have climate change adaptation or mitigation as an objective. These 15 indicators provide a portfolio overview of what we are achieving in the climate space. However, they don’t tell the whole story, as each programme also has its own specific goals, which are reported separately.
You can find more details about these programmes on Development Tracker.
Total achieved results
All results in this publication are estimates based on programme level data, which contain a level of uncertainty – see the data quality section for more details.
ICF results are reported for 15 key performance indicators (KPIs). Four of these focus on technical assistance and are called ‘TA KPIs’[footnote 1]. These indicators measure results across the main climate themes our programmes cover. They are flexible and can be used for projects covering different topics, such as sustainable manufacturing, financial systems, and more traditional climate work such as agriculture and nature protection. Since 2011, 395 programmes have reported results. Many programmes will continue to deliver benefits after they end. We report both the total results achieved so far and the expected future benefits (see Annex 1).
Table 1 shows the estimated results for each KPI from April 2011 to March 2025. This covers the period from start of the first official UK ICF commitment up to the end of the most recent financial year. The results are cumulative, adding together the achievements from all ICF programmes over this period. More details for each KPI are given in the section ‘Results for each key performance indicator (KPI)’.
To avoid overestimating, we give guidance on how to estimate the extra impact (‘additionality’[footnote 2] of our results. We advise a cautious approach. All figures over 10,000 are rounded down to the nearest thousand. If a programme has more than one funder, we report the results that match the UK’s share of funding. For technical assistance indicators, we use a contribution approach.
Sometimes, we update results from previous years if we get new data, use better methods, or correct errors. Some programmes may report for the first time and include data from earlier years, or there may be delays in reporting.
When we compare results from this year to previous years, we use the latest data, including any updates. This means the numbers may not match those published before. We explain any major changes to historical data in the text. All charts use the latest cumulative results and include updates.
You can find previous publications and details about how we collect results on the ICF results webpage.
Table 1: ICF results achieved from April 2011 to March 2025
| KPI number | KPI title | Achieved total | |||
|---|---|---|---|---|---|
| KPI 1 | Number of people supported to better adapt to the effects of climate change | 137,526,000 people | |||
| KPI 2.1 | Number of people with improved access to clean energy | 89,163,000 people | |||
| KPI 2.2 | Number of social institutions with improved access to clean energy | 1,463 institutions | |||
| KPI 4 | Number of people whose resilience has been improved | 33,890,000 people | |||
| KPI 6 | Tonnes of greenhouse gas emissions reduced or avoided | 145,755,000 tonnes of CO2 (tCO2e) | |||
| KPI 7 | Installed capacity of clean energy | 4,872 megawatts (MW) | |||
| KPI 8 | Ecosystem loss avoided | 717,000 hectares | |||
| KPI 10 | Value of ecosystem services generated or protected | 6,278,000 GBP (£) | |||
| KPI 11 | Volume of public finance mobilised for climate change purposes | 10,589,837,000 GBP (£) | |||
| KPI 12 | Volume of private finance mobilised for climate change purposes | 10,461,073,000 GBP (£) | |||
| KPI 15 | Extent to which ICF intervention is likely to lead to transformational change | 69.4% programmes scored a 4 or 5 | |||
| KPI 17 | Area under sustainable management practices | 12,149,000 hectares | |||
| TA KPI 1 | Number of countries supported by ICF Technical Assistance | 141 countries | |||
| TA KPI 2.1 | Number of individuals supported by ICF Technical Assistance | 3,414,000 people | |||
| TA KPI 2.2 | Number of organisations supported by ICF Technical Assistance | 7,535 organisations | |||
| TA KPI 3 | Number of climate policies informed by ICF Technical Assistance | 433 policies | |||
| TA KPI 5 | Tonnes of greenhouse gas emissions reduced or avoided through ICF Technical Assistance | 138,925,000 tonnes of CO2 (tCO2e) |
Data quality
This publication has been produced following voluntary application of the Code of Practice for Statistics. You can read more about how we apply the code in our statement of voluntary compliance with the Code of Practice for Statistics.
The results in this report cover many programmes working on different themes across several government departments. Programme partners often collect the data, and their methods may vary. We give partners guidance notes on how to collect data for ICF KPIs, and we train programme teams to help them collect good quality data.
Programme teams send us their results, provide evidence and complete a checklist to show they have followed the correct methods. Our cross-government ICF analysts then check the results and supporting information. We have improved this process by adding semi-automated checks to spot unusual results or patterns, which we then investigate further.
Because there are so many programmes, we cannot check every detail of the data at source. If better data becomes available later, we update historical results to make them more accurate. We explain any changes under each indicator section if needed.
This publication focuses on ‘achieved results’. These are the results delivered by ICF programmes from April 2011 to March 2025. The figures are our best estimates, but there is some uncertainty. This is because we sometimes must make assumptions or use average values in our calculations.
We aim to be cautious with our estimates. We round down the overall totals and recommend making downward adjustments to reflect how confident we are in the results. Sometimes, we need to estimate things like the average household size in an area, the best exchange rate for currency conversions, the value of an ecosystem service per hectare, or how many years a solar energy installation will last.
In the annex, we also show ‘expected total programme benefits’. These try to estimate what our programmes might deliver over their full lifetime, including anything delivered after the programme ends. For example, renewable energy installations are expected to keep working after the programme finishes. These forecasts are less certain.
If we find an error in any results after publication, we will respond based on how serious the error is. If the mistake could change the overall conclusions, we will issue an unscheduled revision as soon as possible. Smaller errors will be corrected in the next annual update on ICF results. You can find more details in the FCDO statistics: statement on revisions policy.
Inclusive data and data disaggregation
We ask programmes to break down the number of people they help by sex, age, disability, and location. However, not all programmes have systems that can collect this information.
Sometimes, programmes cannot report a person’s details across more than one category. For example, it may not be possible to show how many disabled women live in rural areas. If a programme cannot provide the breakdown we need, we list those results as ‘unspecified’ in this publication. This includes cases where we do not yet report on a category, cannot check the data properly, or do not have the data yet.
We are working to improve our data systems so we can collect more detailed information and increase the coverage of these breakdowns. For more information, see our guidance on inclusive data for ICF.
To protect sensitive information, we do not publish breakdowns if fewer than 5 programmes report them, or if there are fewer than 20 people in a group. You can read more in the FCDO statistics: statement on disclosure control.
We also show breakdowns for other categories, such as sector and technology type, in our KPI results. However, similar challenges exist for these categories. Sometimes, programmes cannot collect or report this detailed information, so we list those results as ‘unspecified’.
Publication notes
Improvements in 2025
We are always working to make our results publication more useful and transparent. This year, we have:
- made the main results easier to find
- improved our quality checks to reduce the risk of mistakes
- reviewed our results process against the Code of Practice for Statistics and made changes where needed
- added a new section on data quality to be more open about how we collect and check data
- updated our charts for the technical assistance indicators to be clearer on the time period covered
- explained that our results are estimates and may change, with details in the text
User feedback
We welcome your feedback. If you have suggestions or ideas to improve this publication, email statistics@fcdo.gov.uk.
ICF key performance indicator results
KPI 1: Estimated number of people supported to better adapt to the effects of climate change
This indicator shows how many people have received direct support[footnote 3] from the UK’s International Climate Finance (ICF) to help them adapt to climate change. Support includes helping people grow more food, manage water supplies, and prepare for natural disasters linked to climate change. These actions support the achievement of Sustainable Development Goal (SDG) target 13.1 on strengthening resilience and adaptive capacity to climate-related hazards, as well as contributing towards SDG 1 on ending poverty, SDG 2 on food security and SDG 6 on access to water.
From April 2011 to March 2025, an estimated 137,526,000 people were directly supported to adapt to climate change, through 152 programmes. This was an increase of 22,007,000 (19%) compared to last year (Figure 1). These figures show people who received help directly from UK projects. They do not include people who may benefit indirectly.
The 3 programmes that supported the most people in the last year were ‘Global System for Mobile technology Association (GSMA) Mobile for Development’, ‘Zambia Social Protection Expansion Programme Phase II’ and ‘Global Risk Financing (GRIF) Programme’.
There was an increase in historical results of 5,442,000 beneficiaries. This was mainly because one programme reported data for earlier years that had not been included before.
Figure 1: Estimated cumulative annual results achieved for KPI 1
Number of people supported to better adapt to the effects of climate change as a result of UK ICF, from April 2011 to March 2025. Reporting year refers to the end point of a reporting period, ie ‘2025’ marks the result reported for the period from April 2024 to March 2025.

A line chart showing the results for KPI 1, in number of people. There is a steady upwards trend from 2012 to 2025.
We have information on the sex of beneficiaries for 72% of the results for this indicator. Of these, 53% were male and 47% were female. Most beneficiaries were adults where age information was available. For 3% of the results, we have data on disability. Of these, 2% of people were recorded as having a disability. We have geography data for 20% of results. Of these, 87% of beneficiaries live in rural areas and 13% in urban areas.
Table 2: Disaggregated data for KPI 1 (number of people supported to adapt to climate change)
Shows how the overall total is split across different categories such as age, sex and disability.
| Disaggregation | Total achieved (number of people) | Number of programmes |
|---|---|---|
| Age | ||
| Child (Age 0-14) | 769,000 | 6 |
| Youth (Age 15-24) | 58,000 | 5 |
| Adult (Age 25-64) | 1,701,000 | 15 |
| Elder (Age 65+) | 31,000 | 5 |
| Unspecified | 134,965,000 | 163 |
| Disability | ||
| Disabled | 77,000 | 12 |
| Not disabled | 4,371,000 | 21 |
| Unspecified | 133,077,000 | 159 |
| Geography | ||
| Rural | 23,793,000 | 42 |
| Urban | 3,502,000 | 11 |
| Unspecified | 110,230,000 | 137 |
| Sex | ||
| Female | 46,174,000 | 116 |
| Male | 52,988,000 | 115 |
| Unspecified | 38,363,000 | 85 |
KPI 2.1: Estimated number of people with improved access to clean energy
This indicator helps achieve sustainable development goals for affordable and clean energy (SDG 7) and health and wellbeing (SDG 3). By reducing the use of polluting cooking fuels, we cut carbon emissions and improve the health of beneficiaries, as indoor air pollution is a major problem.
Actions that contribute to this indicator include:
- installing solar technology
- setting up green mini-grids to supply power in rural areas
- providing clean cook stoves to reduce the need for firewood
- supporting improvements in energy efficiency
From 2011 to 2025, an estimated 89,163,000 people gained better access to clean energy. This is an increase of 10,087,000 (13%) since 2024 (Figure 2). From the 65 programmes reporting against this KPI, the largest increases came from the programmes: ‘Transforming Energy Access (TEA)’, ‘Manufacturing Africa - Foreign Direct Investment’ and ‘Carbon Initiative for Development (Ci-Dev)’. Some programmes updated their historical results, which led to a decrease of 3,056,000 beneficiaries reported for the previous years.
Figure 2: Estimated cumulative annual results achieved for KPI 2.1
Number of people with improved access to clean energy as a result of UK ICF, from April 2011 to March 2025.

A line chart showing the results for KPI 2.1, in number of people, from 2012 to 2025. The first two years are relatively flat, then there is a steady upward trend from 2014 to 2025.
We have broken down the results for this indicator by age, type of clean energy, disability, location, and sex. For the results where sex was reported (46%), 53% of beneficiaries were female and 47% were male. Less than 1% of beneficiaries were reported by age or disability. Geographic disaggregation was available for 3% of results, with 67% of beneficiaries living in urban locations and 33% in rural. Of the results where the type of clean energy was reported, 72% were for clean electricity and 28% for clean cooking.
Table 3: Disaggregated data for KPI 2.1 (number of people with improved clean energy access)
Shows how the overall total is split across different categories such as age, sex and type of energy.
| Disaggregation | Total achieved (number of people) | Number of programmes |
|---|---|---|
| Age | ||
| Child (Age 0-14) | 1,362,000 | <5 |
| Youth (Age 15-24) | 505,000 | <5 |
| Adult (Age 25-64) | 874,000 | 6 |
| Elder (Age 65+) | 92,000 | <5 |
| Unspecified | 86,328,000 | 64 |
| Clean energy type | ||
| Clean cooking | 9,736,000 | 16 |
| Clean electricity | 25,214,000 | 31 |
| Unspecified | 54,212,000 | 38 |
| Disability | ||
| Disabled | 9,500 | <5 |
| Not disabled | 136,000 | 5 |
| Unspecified | 89,017,000 | 66 |
| Geography | ||
| Rural | 889,000 | 15 |
| Urban | 1,815,000 | 9 |
| Unspecified | 86,459,000 | 54 |
| Sex | ||
| Female | 21,394,000 | 33 |
| Male | 19,229,000 | 31 |
| Unspecified | 48,539,000 | 43 |
KPI 2.1 Case study: Transforming Energy Access (TEA)
Transforming Energy Access (TEA) is the UK’s flagship research and innovation platform supporting early-stage testing and scale up of new technologies and business models that accelerate access to affordable clean energy in developing countries. It is one of the main delivery mechanisms for the Ayrton Fund, which supports research, development and demonstration (RD&D) to speed up the clean energy transition in developing countries.
Since 2016, TEA has stimulated research and development of 872 new clean energy technologies and business models in areas such as energy storage, sustainable cooling, electric pressure cookers, smart energy systems, pay-as-you-go solar energy solutions, energy access crowdfunding, zero emissions generators, electric vehicles, mini-grids, e-waste recycling and more. Its work has helped improve social infrastructure, for example by electrifying clinics, and helped generate incomes and jobs for developing economies.
Overall, TEA has helped support improved clean energy access for 30 million people in developing countries (KPI 2.1), leveraged £1.6 billion of additional investment from both private and public sources (KPIs 11 and 12), created and supported 153,000 sustainable long-term jobs; and avoided 4.6 million tonnes of carbon dioxide emissions (the equivalent of removing over 3 million UK cars from the road for one year – KPI 6).

Two people riding on a Zembo ‘Zero Emission Motorcycle Boda’ in Uganda (TEA platform)
KPI 2.2: Estimated number of social institutions with improved access to clean energy
KPI 2.2 is similar to KPI 2.1 but focuses on social institutions[footnote 4] that have improved access to clean energy, which provide benefits to the wider community.
An estimated total of 1,463 institutions have been supported with improved energy access between 2011 and 2025, through 15 programmes (Figure 3). There was an increase of 376 institutions supported compared to 2024. The largest increase this year comes from the programme ‘Building Resilience and Addressing Vulnerability in Emergencies (BRAVE)’, followed by ‘Delivering Accelerated Family Planning in Pakistan (DAFPAK)’. There was a small revision to historical results for one programme, adjusting which year results were counted under and avoiding overlap, which led to a decrease of 24 for previous years.
Figure 3: Estimated cumulative annual results achieved for KPI 2.2
Number of social institutions with improved access to clean energy as a result of UK ICF, from April 2011 to March 2025.

A line chart showing the results for KPI 2.2, in number of institutions, from 2012 to 2025. The line is relatively flat up to 2016 then begins to increase gradually to 2023, with a steeper increase from 2023 to 2025.
KPI 4: Estimated number of people whose resilience has been improved
This indicator shows how many people have become more resilient to climate shocks and stresses with support from UK International Climate Finance (ICF) programmes. These programmes help achieve the global goal of making communities stronger against climate hazards (SDG 13.1). Each programme is designed to improve resilience based on the specific climate risks in its area.
Climate resilience has 3 main parts:
- adaptive capacity (how well people can adjust to change)
- anticipatory capacity (how well people can prepare for future risks)
- absorptive capacity (how well people can cope with impacts)
To report against this indicator, programmes must show improvements in at least 2 of these areas. Examples of support include building houses on raised platforms, protecting water sources, strengthening flood defences, setting up early warning systems, and providing social protection.
Programmes collect evidence before and after their work, often through surveys, to show whether people’s resilience has improved. These results are combined to give a single outcome for each person: ‘improved’ or ‘not improved’.
From April 2011 to March 2025, an estimated 33,890,000 people became more resilient to climate shocks through 39 ICF programmes (see Figure 4). This was an increase of 1,165,000 from the previous year. The largest increase came from ‘Building Resilience and Addressing Vulnerability in Emergencies (BRAVE)’. Revisions to historical results resulted in an increase of 203,000 for previous years.
Figure 4: Estimated cumulative annual results achieved for KPI 4
Number of people whose resilience has been improved as a result of UK ICF, from April 2011 to March 2025.

A line chart showing the results for KPI 4, in number of people, from 2012 to 2025. The line is relatively flat up to 2017, then increases steeply to 2022, with slower increase from 2022 to 2025.
We have information on the sex of beneficiaries for 63% of the results. Of these, 58% were male and 42% were female. About 7% of results included geography information, and nearly all of these people lived in rural areas.
Table 4: Disaggregated data for KPI 4 (number of people with improved resilience)
Shows how the overall total is split across different categories such as age, sex and disability.
| Disaggregation | Total achieved (number of people) | Number of programmes |
|---|---|---|
| Age | ||
| Adult (Age 25-64) | 1,034,000 | <5 |
| Unspecified | 32,855,000 | 39 |
| Disability | ||
| Disabled | 3,000 | <5 |
| Not disabled | 231,000 | <5 |
| Unspecified | 33,656,000 | 39 |
| Geography | ||
| Rural | 2,447,000 | 8 |
| Urban | 11,000 | <5 |
| Unspecified | 31,431,000 | 31 |
| Sex | ||
| Female | 9,061,000 | 27 |
| Male | 12,398,000 | 26 |
| Unspecified | 12,430,000 | 16 |
KPI 4 Case study: Building Resilience and Addressing Vulnerability in Emergencies (BRAVE)
BRAVE is a 7-year (2021 to 2028) climate resilience programme that aims to save lives and improve the coping capacity of the most vulnerable people, while increasing the ability of the Government of Pakistan, civil society and communities to mitigate and respond to the effects of climate change.
Its work helps transform lives. BRAVE rehabilitated hand pumps in a village damaged by the 2024 floods, this time using a “build back better” approach. Installed on raised platforms and connected through lead lines, the pumps now ensure reliable access to clean water, even during future floods. Strategically locating these hand pumps near 4 to 6 family home clusters also saves women in the village from walking miles everyday, often in extreme heat or rain just to fetch water. Instead, they now have more time and energy for their families and have resumed income-generating activities such as embroidery and livestock rearing.
This shift has not only improved household incomes but also enhanced their sense of dignity, safety, and independence. Through interventions like this, BRAVE has supported over 600,000 people to improve their resilience since the start of the programme.
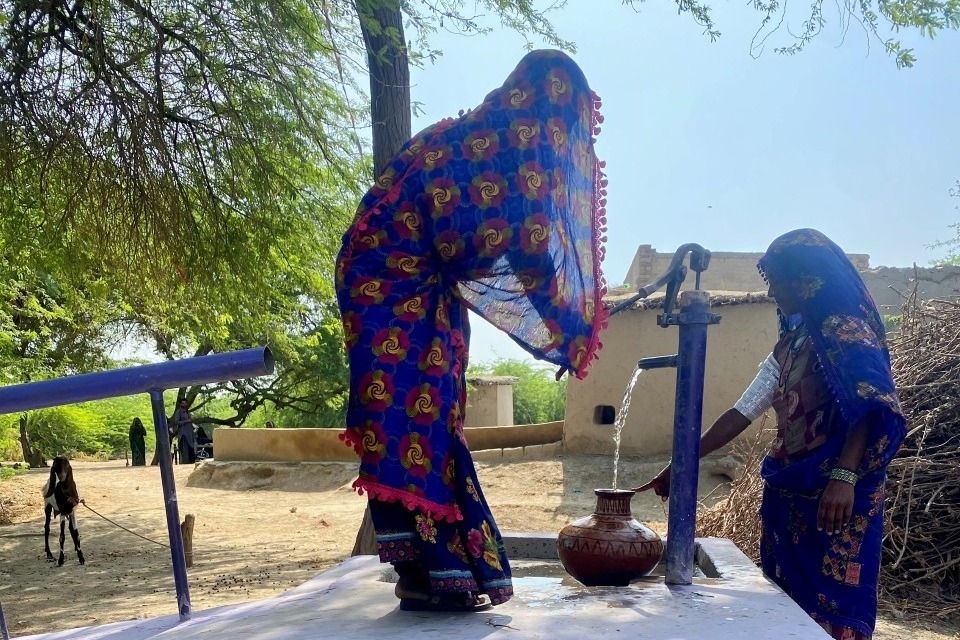
A woman collects water from a rehabilitated hand pump (image credit: Sherwan Asif)
KPI 6: Estimated tonnes of greenhouse gas emissions reduced or avoided
This indicator estimates how much UK International Climate Finance (ICF) programmes have reduced greenhouse gas emissions, compared to what would have happened without this support. It is similar to another indicator (TA KPI 5), which measures the emissions reduced through ICF technical assistance. The main difference is that KPI 6 looks at capital investment projects where we can directly link the reduction in emissions to ICF funding, while TA KPI 5 measures the contribution of technical assistance[footnote 5].
UK ICF helps cut greenhouse gas emissions through programmes in all sectors of the economy. Examples include:
- replacing fossil fuels with renewable energy, such as solar, wind, or geothermal
- promoting cleaner alternatives to wood for cooking
- reducing deforestation
This indicator is aligned with SDG 13.2.2, which also tracks annual greenhouse gas emissions.
Some benefits continue even after a programme ends. For example, solar panels keep generating clean energy and reducing emissions for as long as they work, even after the programme that funded them has finished. This means the expected total lifetime results are much higher than the results achieved so far (see Annex 1).
Since 2011, ICF programmes have reduced or avoided an estimated 145,755,000 tonnes of carbon dioxide equivalent, through 61 programmes. This is an increase of 38,243,000 tonnes (36%) compared to the total up to 2024 (see Figure 5). The biggest increases came from the programmes ‘Manufacturing Africa - Foreign Direct Investment’, ‘Lowering Emissions by Accelerating Forest finance (LEAF) Coalition’, and ‘REDD Early Movers programme (REM)’. Updates to past results added 1,791,000 tonnes, mostly from a new programme reporting results for 2024.
Figure 5: Estimated cumulative annual results achieved for KPI 6
Tonnes of greenhouse gas emissions reduced or avoided as a result of UK ICF, from April 2011 to March 2025.

A line chart showing the results for KPI 6, in tonnes of CO2, from 2012 to 2025. The line increases slowly up to 2015 then increases more steeply to 2025 .
We have sector breakdowns for 36% of the results for this indicator. Most of the emissions reduced or avoided came from energy supply (57%), followed by transport (14%), forestry (7%), industrial processes (4%), and waste management (2%). Other sectors, such as agriculture, residential, land and sea use, business, and public, contributed smaller amounts.
Table 5: Disaggregated data for KPI 6 (greenhouse gas emissions reduced or avoided)
Shows how the overall total is split across different categories, such as sector and technology type used.
| Disaggregation | Total achieved (tonnes of greenhouse gas emissions) | Number of programmes |
|---|---|---|
| Carbon credits | ||
| Not obtained | 16,765,000 | 24 |
| Obtained and sold | 802,000 | <5 |
| Unspecified | 128,188,000 | 28 |
| Sector | ||
| Agriculture | 1,757,000 | <5 |
| Business | 57,000 | <5 |
| Energy supply | 29,878,000 | 21 |
| Forestry | 3,872,000 | 5 |
| Industrial processes | 1,934,000 | <5 |
| Land/sea-use and land/sea-use change | 5,527,000 | <5 |
| Public | 35 | <5 |
| Residential | 1,136,000 | <5 |
| Transport | 7,588,000 | 11 |
| Waste management | 957,000 | 7 |
| Water | 137,000 | <5 |
| Unspecified | 92,906,000 | 46 |
| Technology type | ||
| Biofuels | 196,000 | <5 |
| Biomass | 639,000 | 5 |
| Clean cookstoves | 2,550,000 | <5 |
| Concentrated solar power (CSP) | 969,000 | <5 |
| Hydropower | 1,221,000 | <5 |
| Multiple/mixed renewable energy | 10,544,000 | 10 |
| Process Heating/Drying | 533,000 | <5 |
| Solar photovoltaicaic (PV) | 7,356,000 | 13 |
| Wind power | 2,503,000 | <5 |
| Unspecified | 119,239,000 | 20 |
KPI 7: Estimated installed capacity of clean energy
This indicator measures the amount of clean energy capacity installed through UK International Climate Finance (ICF) programmes. It includes both on-grid and off-grid sources, such as wind, solar, geothermal energy, and clean cookstoves. Installed capacity means the maximum power the clean energy source can produce when it is working, which is different from the actual energy generated.
Access to energy is a key barrier to economic growth and job creation. This work supports global goal SDG 7, which aims to expand infrastructure and technology to provide modern, sustainable energy for everyone in developing countries. In many cases, clean energy partly replaces fossil fuels, which helps reduce greenhouse gas emissions and also contributes to KPI 6 (tonnes of greenhouse gas emissions reduced or avoided).
Between 2011 and 2025, ICF programmes installed an estimated 4,872 megawatts (MW) of clean energy capacity. This is an increase of 13% compared to the total up to 2024 (see Figure 6). A total of 58 programmes reported results for this indicator.
The biggest absolute increases came from ‘British International Investment (BII) Programme of Support in Africa, South Asia, Indo-Pacific & Carib (2015 to 2027)’, ‘Support to the multilateral Climate Investment Funds (CIFs)’ and ‘Sustainable Infrastructure Programme - Latin America (SIP LA)’. Revisions to historical results resulted in a decrease of 238 for previous years, mainly because one programme revised its figures downwards.
Figure 6: Estimated cumulative annual results achieved for KPI 7
Installed capacity of clean energy as a result of UK ICF, from April 2011 to March 2025.

A line chart showing the results for KPI 7, in megawatts, from 2012 to 2025. The line shows a steady increase from 2012 to 2025.
We have broken down the results by location, grid connection, and type of technology. Of the results where grid connection was reported (44%), 93% were connected to a national or regional grid (on-grid). These projects are usually large and produce tens or hundreds of megawatts. For technology type, we have data for 69% of the reported clean energy capacity. Most of this was solar photovoltaic (PV) at 61%, followed by wind at 10% and clean cookstoves at 6%. Smaller amounts were reported for hydropower, mixed renewable energy, biofuels, concentrated solar power (CSP), and biomass.
Table 6: Disaggregated data for KPI 7 (MW clean energy installed)
Shows how the overall total is split across different categories such as technology used.
| Disaggregation | Total achieved (megawatts) | Number of programmes |
|---|---|---|
| Geography | ||
| Rural | 308 | 14 |
| Urban | 402 | 11 |
| Unspecified | 4,100 | 45 |
| Grid connectivity | ||
| Off-grid | 156 | 27 |
| On-grid | 1,900 | 17 |
| Unspecified | 2,700 | 9 |
| Technology type | ||
| Biofuels | 95 | <5 |
| Biomass | 24 | <5 |
| Clean cookstoves | 217 | <5 |
| Concentrated solar power (CSP) | 81 | <5 |
| Hydropower | 188 | 8 |
| Mixed solar | 1 | <5 |
| Multiple/mixed renewable energy | 372 | 6 |
| Solar photovoltaic (PV) | 2,000 | 34 |
| Wind power | 331 | 5 |
| Unspecified | 1,500 | 35 |
KPI 7 Case study: British International Investment
BII is the UK’s Development Finance Institution, with a mission to help solve the biggest global development challenges by investing over the long term to support private sector growth and innovation in developing countries. In the 5 years up to 2026, BII has committed to make at least 30% of its investments in climate, and in 2024 made £708 million of climate finance investments (41% of total investments for that year). BII’s climate investments build the foundations for net zero, supporting a just and inclusive transition and strengthening resilience to climate shocks in developing countries.
For KPI 7 (installed capacity of clean energy), as a result of BII’s investments in 2024, an additional 113 MW of clean energy capacity was installed, including:
- Frontier Energy II Delta K/S (Planet Solar): BII is invested in Planet Solar, Sierra Leone’s first large-scale solar independent power producer, helping to address the country’s need for clean, affordable and reliable power. Only 23% of the population in Sierra Leone have access to electricity, and through BII’s investment alongside Frontier Energy and other development finance institutions, the project is expected to increase the country’s power supply by approximately 30%. This will have a positive impact on the country’s economic growth, employment opportunities, and living standards.
- Fourth Partner energy: BII’s investment into Fourth Partner, a leading renewable energy company for commercial and industrial (C&I) businesses will enable approximately 295 megawatts of greenfield renewable energy generation capacity across India, Sri Lanka, Vietnam, Bangladesh, and Indonesia, increasing supply of power to the company’s C&I customers, and helping avoid 326,000 tonnes of carbon dioxide emissions annually.
- Skye Renewables: A joint investment from BII and Idemitsu to support the development of solar projects for commercial and industrial use in Southeast Asia, helping to sustainably meet increasing energy demand in a region with a high reliance on fossil fuels. This investment aims to build over 300MW of greenfield solar power capacity across South-East Asia. The solar projects are expected to avoid 270,000 tonnes of carbon emissions annually.
KPI 8: Estimated ecosystem loss avoided
This indicator measures how much extra area of natural habitat has been protected by UK International Climate Finance (ICF) projects, compared to what would have happened without this support. Protecting ecosystems helps tackle climate change by reducing greenhouse gas emissions and helps people adapt by preserving biodiversity and supporting livelihoods.
In February 2023, we updated our methods so we can now measure more types of ecosystems, not just forests. This includes marine, freshwater, and grassland areas, using International Union for the Conservation of Nature (IUCN) biome categories. We also check that the habitats protected are still healthy and have not been damaged.
From April 2011 to March 2025, ICF programmes helped protect an estimated 717,000 hectares of land from ecosystem loss, reported by 20 programmes (see Figure 7). The total area protected is lower than last year because one programme revised its results downwards, reducing the historical total by 107,753 hectares. With the updated data, there has been a 10% increase in protected area (65,000ha) since 2024. The biggest increase came from the ‘Mobilising Finance for Forests (MFF)’ programme.
We collect information on the type of ecosystem and the pressures removed, but this detailed data was only available for 1% of the results, so it is not shown here.
Figure 7: Estimated cumulative annual results achieved for KPI 8
Ecosystem loss avoided as a result of UK ICF, from April 2011 to March 2025.

A line chart showing the results for KPI 8, in hectares, from 2012 to 2025. The line increases slowly to 2019, then has a larger increase to 2021, levels off, then increases again between 2023 to 2025.
KPI 8 Case study: REDD+ Early Movers (REM) programme
The REDD+ Early Movers (REM) programme helps reduce emissions from deforestation, and is supported by the UK, Germany, and Norway. UK support in Colombia and 2 Brazilian states – Acre and Mato Grosso – has helped cut 31 million tonnes of carbon emissions by protecting forests. The money earned from the results-based payments is reinvested to keep reducing deforestation, strengthen local policies and institutions, and support forest communities. This includes funding projects that empower Indigenous Peoples and local communities, promote sustainable farming, and improve cattle and soy farms on already degraded land.
To date, funding invested has benefitted over 100,000 rural, traditional, farming, and Indigenous families supporting them to develop more sustainable income sources. By working with people living in and near the forest, the programme is able to strengthen the supply chains of native products, including banana, honey and acai. Supporting communities in this way helps to move beyond a focus on tackling illegal deforestation, to also reducing legal deforestation.
KPI 10: Estimated value of ecosystem services generated or protected
Ecosystem services are the benefits people get from nature and healthy ecosystems. These services include:
- provisioning services, such as energy, food, and medicine
- regulating services, like flood protection, climate control, and pest management
- cultural services, such as education, recreation, and spiritual value
- supporting services, which help ecosystems function, like nutrient and water cycles
Actions that contribute to this indicator include reducing deforestation in mangroves and other forests, encouraging sustainable practices in forest areas, and improving how resources are managed.
This indicator supports the Kunming-Montreal Global Biodiversity Framework target 11, which aims to maintain or improve nature’s benefits to people, including ecosystem services. It also provides evidence of support towards several global goals that depend on ecosystem services, such as food (SDG 2), water (SDG 6), health (SDG 3), and biodiversity (SDGs 14 and 15).
From April 2011 to March 2025, UK ICF programmes have generated or protected an estimated £6,278,000 worth of ecosystem services (see Figure 8). So far, only 3 programmes have reported results for this indicator. The programmes are: ‘Reducing Deforestation and Forest Fires in the Brazilian Cerrado’, ‘Blue Forest Initiatives’ and ‘Accountability in Tanzania Programme - Phase II’. Revisions to historical results have led to a decrease of 107,753 for previous years.
Even though we updated the methods in February 2023 to include more types of ecosystems and make this indicator easier to use, only a few programmes are reporting results. We will keep monitoring this and may review the indicator again if needed.
Figure 8: Estimated cumulative annual results achieved for KPI 10
Value of ecosystem services generated or protected as a result of UK ICF, from April 2011 to March 2025.

A line chart showing the results for KPI 10, in GBP, from 2012 to 2025. The line is relatively flat up to 2015 then increases steeply to 2018, then has a more gradual increase to 2025.
KPI 11: Estimated volume of public finance mobilised for climate change purposes
Achieving the UK’s global climate change goals needs large amounts of funding from outside the UK. This indicator shows how much money from non-UK public sources has been raised for climate action because of UK International Climate Finance (ICF) programmes.
The finance counted here comes from public sources, such as partner country governments, UN agencies, and multilateral or regional development banks. To be included, the money must be either new funding or existing funds that have been redirected from more polluting uses.
Since April 2011, an estimated total of £10,589,837,000 has been raised, an increase of 20% compared to 2024 (Figure 9). Results for this indicator have been reported by 96 programmes since 2011. The largest increases in achieved results were seen in the programmes ‘Global Environment Facility 8th Replenishment’, ‘Market Accelerator for Green Construction (MAGC)’ and ‘Climate, Energy and Water Security in Central Asia CEW-CA’.
Figure 9: Estimated cumulative annual results achieved for KPI 11
Volume of public finance mobilised for climate change purposes as a result of UK ICF, from April 2011 to March 2025.

A line chart showing the results for KPI 11, in GBP, from 2012 to 2025. The line shows a steady increase from 2012 to 2025.
Of the public finance where the origin is reported (40% of results), most came from other DAC donors[footnote 6] and from developing countries eligible for official development assistance (ODA)[footnote 7] (19%). Of the finance reported by theme (69%), 72% was for climate change mitigation, 10% for adaptation, and the rest covered both.
Table 7: Disaggregated data for KPI 11 (public finance mobilised for climate change purposes)
Shows how the overall total is split across different categories such as the origin of finance and how it was leveraged.
| Disaggregation | Total achieved (GBP) | Number of programmes |
|---|---|---|
| Climate theme | ||
| Adaptation | 728,226,000 | 22 |
| Mitigation | 5,299,764,000 | 35 |
| Mitigation and adaptation | 1,307,685,000 | 17 |
| Unspecified | 3,254,161,000 | 46 |
| Leveraging mechanism and role position | ||
| Credit lines | 177,110,000 | <5 |
| Direct investment in companies | 1,368,000 | <5 |
| Project finance | 533,037,000 | 9 |
| Simple co-financing arrangements | 307,988,000 | 10 |
| Unspecified | 9,570,331,000 | 19 |
| Origin of public finance mobilised | ||
| Developing country finance | 797,500,000 | 21 |
| DAC donor finance | 1,346,309,000 | 20 |
| Multilateral finance | 2,140,846,000 | 13 |
| Non-DAC donor finance | 750,000 | <5 |
| Unspecified | 6,304,430,000 | 65 |
| Sector | ||
| Agriculture | 14,707,000 | 6 |
| Business | 30,447,000 | 6 |
| Energy supply | 593,414,000 | 12 |
| Forestry | 4,035,000 | <5 |
| Industrial processes | 78,023,000 | <5 |
| Public | 11,697,000 | <5 |
| Residential | 42,000 | <5 |
| Transport | 8,316,000 | <5 |
| Waste management | 11,569,000 | 6 |
| Water | 17,155,000 | 6 |
| Unspecified | 9,820,427,000 | 20 |
KPI 11 Case study: Climate Investment Funds
The Climate Investment Funds (CIF), launched in 2008, supports 82 countries. With a portfolio of over 362 approved projects and $12.5 billion in commitments, the CIF drives transformational change in clean energy, nature, resilience, and sustainable infrastructure. It contributes to at least ten Sustainable Development Goals, reinforcing its global impact.
Delivered through 6 major Multilateral Development Banks (MDBs), CIF leverages existing systems for cost-effective, system-wide impact and pioneers’ solutions to frontier challenges such as just transitions, coal phase-out and clean energy transitions, nature-based solutions, adaptation and resilience, and industrial decarbonisation.
CIF established the CIF Capital Market Mechanism (CCMM), the first capital market-facing instrument among climate funds with the potential to raise an expected $7.5 billion directly. On average, every £1 of CIF funding supports a further £10 in public and private climate finance flows. The 1:10 co-finance ratio is made up of around 2 thirds public finance and one third private finance. CIFs continues to make significant contributions to the ICF portfolio results contributing £1.7 billion in public finance mobilised (ICF KPI 11) and £0.6 billion in private finance mobilised (ICF KPI 12).
A notable example is Vietnam’s Distribution Efficiency Project, which used smart grids to upgrade power supplies in Hanoi and Ho Chi Minh City. With $20 million in Clean Technology Fund (CTF) support, the project mobilised over $600 million in co-financing and achieved 449 GWh in annual energy savings.

In Vietnam, CIF’s Clean Technology Fund supported smart grids to upgrade power supplies in Hanoi and Ho Chi Minh City. Image shows a view of Ho Chi Minh City from above, showing the city lit up at night. (image credit: Diego Delso, delso.photo, License CC BY-SA)
KPI 12: Estimated volume of private finance mobilised for climate change purposes
This indicator shows how much private finance has been raised for climate action because of UK International Climate Finance (ICF) programmes. It helps measure the UK’s contribution to the previous commitment by developed countries to raise $100 billion of public and private finance each year to help developing countries tackle climate change (SDG 13.a). In future, it will also help track the UK’s contribution to the New Collective Quantified Goal (NCQG) on climate finance.
The finance counted here comes from private sources, such as banks (not including multilateral or regional development banks), private companies, pension funds, charities, Clean Development Mechanism (CDM) financing, voluntary carbon credit markets, insurance companies, private savings, family money, entrepreneurs’ own capital, and sovereign wealth funds. It includes all types of finance, such as equity, loans, and guarantees.
Between April 2011 and March 2025, it is estimated that £10,461,073,000 of private finance has been mobilised across 98 programmes. This is an increase of 28% when compared with the total up to 2024 (Figure 10). The biggest increases came from ‘Second phase of DFID’s Support to the Private Infrastructure Development Group (PIDG)’, ‘British International Investment (BII) Programme of Support in Africa, South Asia, Indo-Pacific & Carib (2015 to 2027)’ and ‘Mobilising Finance for Forests (MFF)’.
Figure 10: Estimated cumulative annual results achieved for KPI 12
Volume of private finance mobilised for climate change purposes as a result of UK ICF, from April 2011 to March 2025.

A line chart showing the results for KPI 12, in GBP, from 2012 to 2025. The line shows a gradual increase up to 2017 and then a steeper increase to 2025.
Of the results where the origin of private finance was reported (58%), most came from multiple origins (89%), with the next largest share from recipient countries (8%). For the results that reported how the finance was raised, the most common method was simple co-financing arrangements (54%). These include business partnerships, surveys, matching programmes, and result-based approaches to leveraging finance.
Table 8: Disaggregated data for KPI 12 (private finance mobilised for climate change purposes)
Shows how the overall total is split across different categories such as the origin of finance and how it was leveraged.
| Disaggregation | Total achieved (GBP) | Number of programmes |
|---|---|---|
| Climate theme | ||
| Adaptation | 586,499,000 | 27 |
| Mitigation | 6,459,552,000 | 55 |
| Mitigation and adaptation | 761,030,000 | 16 |
| Unspecified | 2,653,991,000 | 41 |
| Leveraging mechanism and role position | ||
| Credit lines | 269,897,000 | 7 |
| Direct investment in companies | 572,154,000 | 7 |
| Guarantees | 448,968,000 | <5 |
| Project finance | 541,351,000 | 13 |
| Shares in collective investment vehicles | 102,765,000 | <5 |
| Simple co-financing arrangements | 2,334,744,000 | 46 |
| Syndicated loans | 69,320,000 | <5 |
| Unspecified | 6,121,871,000 | 44 |
| Origin of private finance mobilised | ||
| Multiple origins | 5,392,766,000 | 60 |
| Provider country | 11,142,000 | 6 |
| Recipient country | 498,334,000 | 21 |
| Third high-income/OECD country | 151,050,000 | 12 |
| Unspecified | 4,407,779,000 | 30 |
| Sector | ||
| Agriculture | 134,041,000 | 13 |
| Business | 45,316,000 | 6 |
| Energy supply | 762,628,000 | 9 |
| Fisheries and aquaculture | 6,198,000 | <5 |
| Forestry | 94,667,000 | <5 |
| Industrial processes | 10,572,000 | <5 |
| Land/sea-use and land/sea-use change | 37,000 | <5 |
| Public | 1,613,000 | <5 |
| Residential | 14,972,000 | <5 |
| Transport | 85,111,000 | 7 |
| Waste management | 14,663,000 | 5 |
| Water | 88,871,000 | <5 |
| Unspecified | 9,202,377,000 | 19 |
KPI 15: Extent to which ICF intervention is likely to lead to transformational change
Transformational change is defined in our methodology as “change that catalyses further changes”, enabling either a shift from one state to another, or faster change than otherwise expected. For KPI 15, programmes rate how likely they are to lead to transformational change using a scale from 1 to 5. Because of this, we do not add up the scores over time. Instead, we show how the scores are spread across all programmes that report.
In 2023, we updated the scoring for KPI 15 to use a 1 to 5 scale (it was previously 0 to 4). We also improved the descriptions for each score to make it easier to tell the difference between them (see Table 9). Because of this change, we show data for 2023, 2024, and 2025, and include earlier scores in the Appendix of the 2023 ICF Results.
Since 2011, 149 programmes have reported on KPI 15, with 72 reporting this year. Of those reporting this year, 69.4% scored a 4 or 5, showing evidence that these programmes are likely to lead to transformational change.
Figure 11: Annual results achieved for KPI 15
Extent to which ICF intervention is likely to lead to transformational change from April 2022 to March 2025. This shows the years on the y axis and the percentage of programmes achieving each score on the x axis, with the number of programmes annotated on the bars.

A bar chart showing the percentages of programmes achieving each score for KPI 15. Slightly more programmes scored a 4 or 5 in 2025 compared to the previous year.
Table 9: Scores and definitions for KPI 15
| Score | Description |
|---|---|
| 1 | Substantial evidence transformational change is unlikely or will not occur |
| 2 | Partial evidence transformational change is unlikely |
| 3 | Not enough evidence yet to assess, or the balance of evidence is inconclusive |
| 4 | Partial evidence transformational change is likely |
| 5 | Substantial evidence transformational change is likely or already occurring |
KPI 15 Case study: Malawi Trade and Investment Programme
The Malawi Value Chains (MVC) component of the UK-funded Malawi Trade and Investment Programme, implemented by Adam Smith International, is driving transformational change in Malawi’s export agriculture — earning a top score of 5 (evidence that transformational change is likely or already occurring) against ICF KPI 15.
MVC supports the growth of 3 high-potential sectors — macadamia, mango, and mining — by improving production quality and quantity, strengthening the business environment, and facilitating market linkages. In the macadamia sector, MVC is pioneering a shift from conventional, chemical-intensive farming to climate-resilient orchard management and Integrated Pest Management (IPM). This includes the use of organic manure, cover crops, biological pest control, and digitised scouting data to replace calendar-based spraying with evidence-based interventions.
These innovations are reducing input costs, improving yields, and enhancing environmental sustainability. For example, one farm increased production by 32%, while another improved its Sound Kernel Recovery (SKR) rate (% of usable, high-quality kernel that meets quality standards for export or sale) by 10% and boosted nut-in-shell exports by 54% in one season. Institutional support to the Malawi Macadamia Association is also embedding industry-wide learning and adoption.
Beyond KPI 15, MVC contributes to KPI 17 (sustainable land management) through reduced chemical use and KPI 1 (people supported to adapt to climate change) by strengthening livelihoods. There is strong evidence of sustainability and replicability through knowledge dissemination and adoption of rules and enabling environment reforms. The programme is therefore laying the foundation for long-term competitiveness and resilience in Malawi’s export agriculture — a clear example of UK support delivering lasting, systemic change.
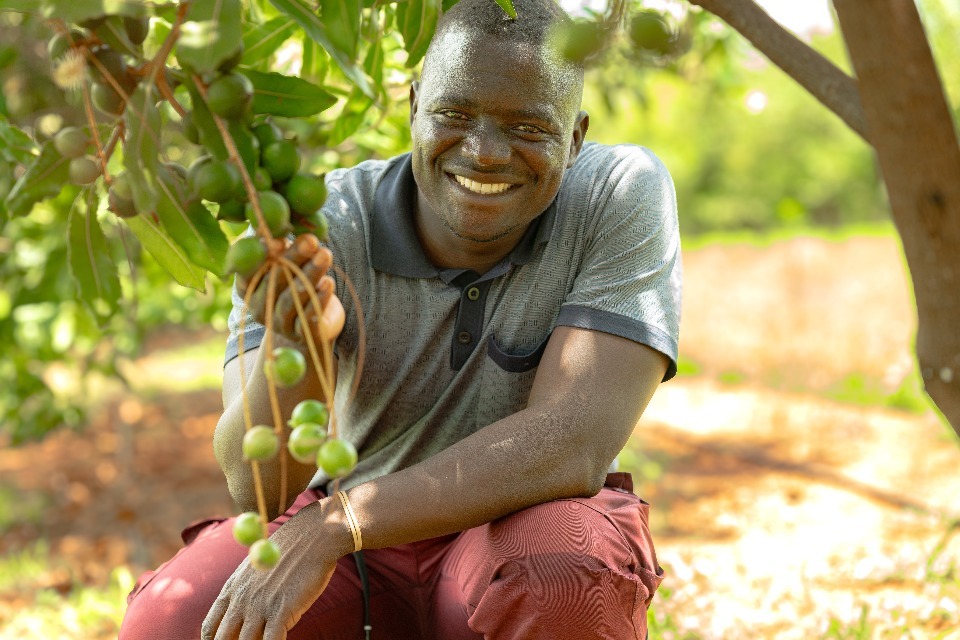
Malawi Value Chains (MVC) is demonstrating climate-related transformational change in the macadamia sector through enhanced productivity and quality. Image of a man presenting macadamia nuts growing on a tree.
KPI 17: Estimated area under sustainable management practices
Ecosystem degradation is a major cause of biodiversity loss and carbon emissions, which both worsen and are made worse by climate change. It also reduces the benefits people get from nature, such as support for their livelihoods, health, and wellbeing. By managing ecosystems in a sustainable way, we can help reduce the impacts of climate change, protect ecosystem services and biodiversity, and make ecosystems more resilient to future climate shocks.
What counts as sustainable management depends on the local context, the type of ecosystem, and how it is used. Examples include managing vegetation, aquaculture, and protecting or restoring habitats. These actions support global goals for sustainable use of natural resources (SDG 12.2), and for the sustainable use and restoration of land and sea ecosystems (SDGs 14.2 and 15.1). This indicator also supports the Kunming-Montreal Global Biodiversity Framework target 10, which aims to ensure ecosystems are used sustainably.
From April 2011 to March 2025, an estimated 12,149,000 hectares have been managed sustainably through ICF programmes, reported by 33 programmes. This was an increase of 3,832,000 hectares (46%) from the previous year (Figure 12). The biggest increases came from ‘Global Biodiversity Framework Fund (GBF Fund)’, the ‘Forest Carbon Partnership Facility - Carbon Fund (FCPF -C)’ and ‘Ocean Risk and Resilience Action Alliance (ORRAA)’. Some programmes also updated their past results after improving their methods and data, which led to an increase of 4,087,000 hectares in historical results.
In February 2023, we updated the methods for this indicator to include more types of practices, allowing non-forest environments such as marine, freshwater, and agricultural areas to be counted.
Figure 12: Estimated cumulative annual results achieved for KPI 17
Area under sustainable management practices as a result of UK ICF, from April 2011 to March 2025.

A line chart showing the results for KPI 17, in hectares, from 2012 to 2025. The line is relatively flat up to 2016 then shows a steady increase to 2024, with a larger jump in the most recent year to 2025.
We have information on the type of ecosystem managed for 31% of results. Where this breakdown is available, the largest areas of ecosystem types being managed are marine shelf (49%), shrublands and shrubby woodlands (30%), shorelines (9%), intensive land-use (5%) and tropical-subtropical forests (5%).
We have data on the sustainable management theme for 32% of results: 98% were management, 2% restoration, and less than 1% protection. The type of sustainable management practices carried out has been reported for 30% of results. Of those, 53% were fisheries management and 35% vegetation management. Smaller categories are included in Table 10.
Table 10: Disaggregated data for KPI 17 (area of land under sustainable management)
Shows how the overall total is split across different categories such as ecosystem and type of sustainable management.
| Disaggregation | Total achieved (hectares) | Number of programmes |
|---|---|---|
| Ecosystem type | ||
| Brackish tidal | 69,000 | <5 |
| Deserts and semi-deserts | 537 | <5 |
| Intensive land-use | 204,000 | 5 |
| Marine shelf | 1,850,000 | <5 |
| Savannas and grasslands | 10,000 | <5 |
| Shorelines | 348,000 | <5 |
| Shrublands and shrubby woodlands | 1,138,000 | <5 |
| Tropical-subtropical forests | 191,000 | 5 |
| Unspecified | 8,335,000 | 16 |
| Sustainable management practice | ||
| Animal management | 82,000 | <5 |
| Aquaculture | 14 | <5 |
| Coastal management | 254,000 | <5 |
| Fisheries management | 1,945,000 | <5 |
| Forest management | 49,000 | 6 |
| Rehabilitation | 10 | <5 |
| Restoration | 15,000 | <5 |
| Soil management | 501 | <5 |
| Vegetation management | 1,295,000 | 7 |
| Water management | 65 | <5 |
| Watershed/freshwater management | 28,000 | <5 |
| Unspecified | 8,477,000 | 17 |
| Sustainable management theme | ||
| Management | 3,850,000 | 17 |
| Protection | 1,000 | <5 |
| Restoration | 69,000 | 8 |
| Unspecified | 8,227,000 | 12 |
KPI 17 Case study: Global Biodiversity Framework Fund
The Global Biodiversity Framework Fund (GBF Fund) launched in 2024 to scale up finance for biodiversity and support delivery of the Kunming-Montreal Global Biodiversity Framework. It aims to help countries around the globe by strengthening national-level biodiversity management, planning, policy, governance and finance approaches. UK investment in the GBF Fund is expected to reduce greenhouse gas emissions by around 25 million tonnes (CO2eq) and improve sustainable land management practices in almost 14 million hectares of land worldwide. ICF funding allocated to projects to date are estimated to help over 20,000 people adapt to climate change (ICF KPI 1), contribute to over 5 million tonnes of greenhouse gas emissions avoided (ICF KPI 6), mobilise £4.6 million in public finance (ICF KPI 11) and over £500,000 in private finance (ICF KPI 12), and place over 3 million hectares of land under sustainable management (ICF KPI 17).
One of the first projects to receive funding was an initiative designed to support efforts by Brazil’s Indigenous Peoples to manage the land under their care more sustainably. This 5-year project is expected to yield local and global benefits.
Locally, it will help curb deforestation and habitat degradation by improving the management of over 6 million hectares of land and contribute to the conservation of threatened species by expanding safe environments for their recovery. Importantly, putting the land management plans on a sound footing and protecting and expanding healthy forest ecosystems will support communities to cope with the effects of climate change and help to maintain water cycles, which are vital for the availability of fresh water for people, plants, and animals.
Anticipated global benefits include the conservation of key ecosystems, including some of Brazil’s ancient forest lands that are critical to climate change mitigation efforts.
ICF Technical Assistance Key Performance Indicator results
Technical Assistance Key Performance Indicators (TA KPIs) track activities where experts provide non-financial support to help development. Technical assistance can include:
-
supporting policy and providing evidence, such as sharing information, helping with project planning or policy development, or supplying climate data
-
helping with projects and investments, providing UK expert advice and encouraging collaboration between public and private organisations
-
long-term capacity building to support more in-country expertise, for example through training, workshops and conferences
Most current monitoring and reporting methods focus on capital spending, so they do not work well for programmes that only deliver technical assistance. ICF technical assistance is often given alongside other support, such as capital investment from the UK Government or other partners, technical help from other organisations, and contributions from national governments. This makes it difficult to separate out results that are only due to ICF technical assistance. For this reason, TA indicators measure the contribution of ICF technical assistance to overall results[footnote 5].
The TA indicators were first published in 2023, so there is less data than for the other KPIs. However, some programmes have been able to report results for earlier years, so we have included the full time series in the charts.
TA KPI 1: Number of countries supported by ICF technical assistance
The ICF TA KPI 1 indicator gives an overview of how many countries have received technical assistance (TA) for climate action from UK International Climate Finance (ICF). ICF supports countries that are eligible for official development assistance (ODA), and this list is updated every 3 years.
Results are reported as a running total, so the list of countries includes all those that have received technical assistance since 2011, even if they did not receive support in the latest year. Some countries are no longer eligible for ICF TA support but are still listed because they were eligible in previous years.
From April 2011 to March 2025, 84 programmes have provided technical assistance in 141 countries. The map in figure 13 and accompanying table show the countries that were supported in the most recent year (April 2024 to March 2025). Countries supported in previous years can be found in the 2024 ICF results publication.
Figure 13: Countries supported with technical assistance reported by ICF TA KPI 1 in 2024 to 2025 (darker shading).

A map of the world showing the locations of the countries listed in table 11
Table 11: Countries supported by ICF Technical Assistance from April 2024 to March 2025
| Country names |
|---|
| Albania, Algeria, Angola, Argentina, Armenia, Azerbaijan, Bangladesh, Belize, Benin, Bhutan, Bolivia, Bosnia and Herzegovina, Botswana, Brazil, Burkina Faso, Burundi, Cabo Verde, Cambodia, Cameroon, Central African Republic, Chile, China, Colombia, Comoros, Costa Rica, Cote d’Ivoire, Cuba, Democratic Republic of the Congo, Djibouti, Dominica, Dominican Republic, Ecuador, Egypt, El Salvador, Eswatini, Ethiopia, Fiji, Gambia, Georgia, Ghana, Grenada, Guatemala, Guinea, Guyana, Haiti, Honduras, India, Indonesia, Iraq, Jamaica, Kazakhstan, Kenya, Kiribati, Kosovo, Kyrgyzstan, Laos, Lebanon, Lesotho, Liberia, Madagascar, Malawi, Malaysia, Maldives, Mali, Marshall Islands, Mauritania, Mauritius, Mexico, Moldova, Mongolia, Morocco, Mozambique, Myanmar, Namibia, Nepal, Nicaragua, Niger, Nigeria, North Macedonia, Pakistan, Palau, Palestine, Panama, Papua New Guinea, Paraguay, Peru, Philippines, Republic of the Congo, Rwanda, Saint Lucia, Saint Vincent, Samoa, Sao Tome and Principe, Senegal, Serbia, Sierra Leone, Solomon Islands, Somalia, South Africa, South Sudan, Sri Lanka, Suriname, Syria, Tajikistan, Tanzania, Thailand, Timor-leste, Togo, Tonga, Trinidad and Tobago, Tunisia, Tuvalu, Türkiye, Uganda, Ukraine, Uruguay, Uzbekistan, Vanuatu, Vietnam, Yemen, Zambia, Zimbabwe |
TA KPI 1 Case study: Sustainable Cooling and Cold Chain Solutions
The Sustainable Cooling and Cold Chain Solutions Programme began in 2019 and is delivered by the United Nations Environment Programme and an academic consortium led by the University of Birmingham. The programme aims to improve people’s livelihoods by reducing food and vaccine loss, and economically empower smallholder farmers by building capacity in developing markets for affordable, resilient and equitable cooling and cold chain, whilst mitigating the environmental impacts of cooling and cold chain through more energy efficient and climate-friendly technologies.
Lack of optimised refrigeration exacerbates post-harvest food losses, particularly for smallholder farmers in sub-Saharan Africa who on average experience 37% food loss. However, many cooling technologies used to reduce losses are energy intensive and use hydrofluorocarbon (HFC) refrigerants, which are potent greenhouse gases. Recent studies estimate that optimised refrigeration could reduce food loss by 47% and greenhouse gas emissions by 66%.
Since 2019, partners have leveraged over £21 million of public and private finance (ICF KPIs 11 and 12) to match the UK government’s £21 million investment, as of financial year 2024 to 2025. This has supported research, operations and replication of the Cold Chain Centres of Excellence reference model through the Africa Centre of Excellence for Sustainable Cooling and Cold Chain in Rwanda, and Specialist Outreach and Knowledge Establishment (SPOKE) in Kenya. The Cold Chain Centre of Excellence model is a scalable, systems-based approach to delivering sustainable cooling solutions across regions. Each Centre of Excellence serves as a regional hub for training, testing and demonstration, supported by a network of SPOKEs that deploy clean cold chain technologies in local application, and feed learning back to the centre. The programme has supported 89 different countries with technical assistance.
TA KPI 2.1: Estimated number of individuals supported by ICF technical assistance
This indicator estimates how many people have received technical assistance from UK International Climate Finance (ICF).
Between April 2011 and March 2025, an estimated 3,414,000 individuals were supported through 81 ICF programmes providing technical assistance. The ‘Animal and Plant Health Innovation and Evidence Delivery (APHID)’ programme delivered the largest contribution to these results.
Figure 14: Estimated cumulative annual results achieved for TA KPI 2.1
Number of individuals supported by ICF technical assistance as a result of UK ICF, from April 2011 to March 2025.

A line chart showing the results for TA KPI 2.1, in number of people, from 2017 to 2025. The line is relatively flat up to 2021 then shows a steeper increase to 2025.
This indicator is broken down by the actor that has received support, age, climate theme, disability, geography, sector, sex and type of technical assistance. Of the results where the type of technical assistance was reported (65%), most support was for capacity building (87%) and project or investment support (12%). Sector information was available for 59% of results, with agriculture making up 94% and energy supply 4%. For results where sex was reported (45%), 56% of beneficiaries were male and 44% were female. Where disaggregated data were available for geography (48%), 99% of beneficiaries were in rural locations.
Table 12: Disaggregated data for TA KPI 2.1 (number of people supported with technical assistance)
Shows how the overall total is split across different categories such as age, sex and disability.
| Disaggregation | Total achieved (number of people) | Number of programmes |
|---|---|---|
| Actor that has received support | ||
| Academia | 330 | 5 |
| Finance sector | 331 | <5 |
| NGO/civil society | 23,000 | 17 |
| Private sector | 557,000 | 16 |
| Public sector | 252,000 | 28 |
| Unspecified | 2,580,000 | 47 |
| Age | ||
| Adult (Age 25-64) | 4,200 | 12 |
| Unspecified | 3,410,000 | 75 |
| Climate theme | ||
| Adaptation | 1,865,000 | 20 |
| Mitigation | 329,000 | 24 |
| Mitigation and adaptation | 27,000 | 19 |
| Unspecified | 1,192,000 | 38 |
| Disability | ||
| Not disabled | 502 | 7 |
| Unspecified | 3,414,000 | 84 |
| Geography | ||
| Rural | 1,620,000 | 10 |
| Urban | 15,000 | 12 |
| Unspecified | 1,778,000 | 72 |
| Sector | ||
| Agriculture | 1,892,000 | 13 |
| Business | 174 | 5 |
| Energy supply | 89,000 | 10 |
| Fisheries and aquaculture | 22 | <5 |
| Forestry | 3,800 | <5 |
| Industrial processes | 627 | <5 |
| Land/sea-use and land/sea-use change | 17,000 | <5 |
| Public | 5,800 | 16 |
| Residential | 171 | <5 |
| Transport | 824 | <5 |
| Waste management | 3,600 | <5 |
| Water | 512 | <5 |
| Unspecified | 1,398,000 | 49 |
| Sex | ||
| Female | 676,000 | 49 |
| Male | 846,000 | 48 |
| Unspecified | 1,892,000 | 63 |
| Type of Technical Assistance | ||
| Capacity building | 1,939,000 | 47 |
| Policy support and evidence | 22,000 | 13 |
| Project and investment support | 260,000 | 7 |
| Unspecified | 1,192,000 | 37 |
TA KPI 2 Case study: Climate Ambition Support Alliance (CASA) programme
The Climate Ambition Support Alliance (CASA) works to increase the capacity and capability of ambitious, low-income and climate vulnerable countries in international climate negotiations. CASA currently supports the Least Developed Countries (LDC) Group, the Alliance of Small Island Developing States (AOSIS), the High Ambition Coalition (HAC) and the Independent Alliance of Latin America and the Caribbean (AILAC) – collectively representing over 100 countries across multiple regions.
CASA’s partners provide technical, legal, scientific and strategic support to amplify the influence of supported groups and upskill negotiators. These include advisory briefings, technical notes, preparatory and live legal advice, knowledge products, work plans and communications activities to amplify the influence of supported groups and upskill negotiators. Since 2023, CASA has delivered over 1,000 instances of either preparatory or real-time support for negotiations sessions, helping strengthen the effectiveness of vulnerable countries as progressive voices in climate negotiations.

International climate negotiators from Saint Kitts and Nevis engaging during plenary discussions at the Subsidiary Bodies meeting of the UNFCCC in Bonn, Germany (image credit: Kiara Worth/IISD).
TA KPI 2.2: Estimated number of organisations supported by ICF technical assistance
This indicator estimates how many organisations have received technical assistance from UK International Climate Finance (ICF).
From April 2011 to March 2025, an estimated total of 7,535 organisations were supported through 73 different programmes. The ‘Urban Climate Action Programme’ programme contributed the most to this result.
Figure 15: Estimated cumulative annual results achieved for TA KPI 2.2
Number of organisations supported by ICF technical assistance as a result of UK ICF, from April 2011 to March 2025.

A line chart showing the results for TA KPI 2.2, in number of organisations, from 2017 to 2025. The line is relatively flat up to 2021 then shows a steeper increase to 2025.
This indicator is broken down by the actor that has received support, climate theme, sector and type of technical assistance. Sector information was available for 63% of results. The organisations supported were from a range of sectors, including 24% in the energy supply sector, 14% agriculture, 10% in the public sector and 5% in transport. Other sectors supported included business, waste management, industrial processes, land/sea-use and land/sea-use change, forestry, water and residential. Of the results where the type of technical assistance was reported (76%), most support was for capacity building (80%), followed by policy support and evidence (13%), and project or investment support (8%).
Table 13: Disaggregated data for TA KPI 2.2 (number of organisations supported with technical assistance)
Shows how the overall total is split across different categories such as sector and type of technical assistance provided.
| Disaggregation | Total achieved (number of organisations) | Number of programmes |
|---|---|---|
| Actor that has received support | ||
| Academia | 243 | 13 |
| Finance sector | 388 | 11 |
| NGO/civil society | 748 | 21 |
| Private sector | 1,300 | 29 |
| Public sector | 2,800 | 44 |
| Unspecified | 1,900 | 44 |
| Climate theme | ||
| Adaptation | 951 | 17 |
| Mitigation | 4,800 | 28 |
| Mitigation and adaptation | 1,500 | 25 |
| Unspecified | 199 | 44 |
| Sector | ||
| Agriculture | 682 | 12 |
| Business | 244 | 10 |
| Energy supply | 1,100 | 16 |
| Fisheries and aquaculture | 564 | <5 |
| Forestry | 886 | 7 |
| Industrial processes | 109 | 6 |
| Land/sea-use and land/sea-use change | 81 | 5 |
| Public | 500 | 18 |
| Residential | 39 | <5 |
| Transport | 260 | 10 |
| Waste management | 164 | <5 |
| Water | 103 | 6 |
| Unspecified | 2,700 | 52 |
| Type of Technical Assistance | ||
| Capacity building | 4,500 | 34 |
| Policy support and evidence | 716 | 23 |
| Project and investment support | 440 | 18 |
| Unspecified | 1,800 | 42 |
TA KPI 3: Estimated number of climate policies informed by ICF technical assistance
This indicator counts the number of public sector climate policies that have been shaped by technical assistance from UK International Climate Finance (ICF) programmes. It includes all types of support, such as training workshops, knowledge sharing, and feasibility studies.
From 2011 to March 2025, an estimated 433 climate policies were informed by ICF technical assistance. The ‘South East Asia Energy Transition Programme’ made the biggest contribution to these results, followed by ‘Partnerships for Market Implementation (PMI)’ and ‘UK Partnering for Accelerating Climate Transitions (UK PACT)’ (see case study below).
Figure 16: Estimated cumulative annual results achieved for TA KPI 3
Number of climate policies informed by ICF technical assistance as a result of UK ICF, from April 2011 to March 2025.

A line chart showing the results for TA KPI 3, in number of policies, from 2017 to 2025. The line increases slowly up to 2021 then shows a steeper increase to 2025.
This indicator is broken down by sector, level (international, national, or sub-national), climate theme, and type of technical assistance. Sector information was available for 55% of results, with the largest shares in: energy supply (36%), waste management (15%) and agriculture (11%).
Of the results where the type of technical assistance was reported (50%), most focused on policy support and evidence (92%), with 7% on project and investment support.
Table 14: Disaggregated data for TA KPI 3 (number of climate policies informed by technical assistance)
Shows how the overall total is split across different categories such as sector and climate theme
| Disaggregation | Total achieved (number of climate policies) | Number of programmes |
|---|---|---|
| Climate theme | ||
| Adaptation | 39 | 7 |
| Mitigation | 211 | 24 |
| Mitigation and adaptation | 48 | 8 |
| Unspecified | 135 | 15 |
| International, national or sub-national | ||
| International | 2 | <5 |
| National | 149 | 23 |
| Sub-National | 71 | 12 |
| Unspecified | 211 | 15 |
| Sector | ||
| Agriculture | 27 | 6 |
| Business | 5 | <5 |
| Energy supply | 85 | 9 |
| Forestry | 24 | 5 |
| Industrial processes | 4 | <5 |
| Land/sea-use and land/sea-use change | 13 | 5 |
| Public | 18 | 8 |
| Residential | 2 | <5 |
| Transport | 21 | <5 |
| Waste management | 36 | <5 |
| Water | 2 | <5 |
| Unspecified | 196 | 15 |
| Type of Technical Assistance | ||
| Capacity building | 3 | <5 |
| Policy support and evidence | 198 | 26 |
| Project and investment support | 15 | <5 |
| Unspecified | 217 | 13 |
TA KPI 3 Case study: UK Partnering for Accelerated Climate Transitions (UK PACT)
UK PACT builds long term climate partnerships with country governments, sharing expertise and helping them build the capacity and institutions they urgently need in the areas most critical to their climate transition.
Mexico is one of the world’s largest carbon emitters, and by working directly with legislative and executive branches of state governments – such as Ministries of Environment and Treasury – technical assistance has facilitated ambitious climate legislation in regions where federal initiatives have stalled. With UK support, new climate legislation has been developed and enshrined in 9 Mexican federal entities, and legal reform proposals advanced in 5, covering 18 out of Mexico’s 32 federal entities. This includes supporting the passage of Baja California Sur’s first Climate Change Law, a state deeply vulnerable to climate change due to its peninsular geography. This has involved expertise sharing and consensus building to establish a more ambitious framework and commitment to reduce carbon emissions and increase climate change action.
In the most recent reporting year, UK PACT has supported over 20 countries with technical assistance and helped inform at least 15 climate policies across a range of sectors at both national and sub-national levels.
TA KPI 5: Estimated tonnes of greenhouse gas emissions reduced or avoided, supported by International Climate Finance technical assistance
ICF TA KPI 5 measures how UK International Climate Finance (ICF) technical assistance has helped countries, investments, or projects to reduce or avoid greenhouse gas (GHG) emissions. Because it is difficult to link specific emission reductions directly to technical assistance, this indicator does not try to show the exact amount of emissions reduced by ICF TA. Instead, it shows the total volume of emissions reductions that ICF TA has supported. This is a broader measure than KPI 6, which only counts emissions reductions that can be directly linked to ICF funding. Some programmes may report results under both indicators.
From April 2011 to March 2025, ICF TA from 11 programmes had supported the reduction or avoidance of an estimated 138,925,000 tonnes of CO2 (tCO2e) emissions. The largest increase in results came from the ‘Accelerating Innovation Monitoring For Forests (AIM4Forests)’ programme.
Figure 17: Estimated cumulative annual results achieved for TA KPI 5
Tonnes of greenhouse gas emissions reduced or avoided, supported by International Climate Finance technical assistance as a result of UK ICF, from April 2011 to March 2025.

A line chart showing the results for TA KPI 5, in tonnes of CO2, from 2017 to 2025. The line is relatively flat up to 2020 then increases more steeply to 2024, with a larger increase in the most recent year to 2025.
This indicator is broken down by sector and type of technical assistance. Of the results where sector was reported (67%), most were in forestry (87%), followed by waste management (8%), energy supply (2%), and agriculture (2%). For results where the type of technical assistance was reported (16%), almost all (99%) focused on capacity building.
Table 15: Disaggregated data for TA KPI 5 (tonnes of greenhouse gas emissions reduced or avoided through technical assistance)
Shows how the overall total is split across different categories such as the sectors where support was provided.
| Disaggregation | Total achieved (tonnes of greenhouse gas emissions) | Number of programmes |
|---|---|---|
| Sector | ||
| Agriculture | 1,867,000 | <5 |
| Business | 555 | <5 |
| Energy supply | 1,911,000 | <5 |
| Forestry | 80,973,000 | <5 |
| Industrial processes | 798,000 | <5 |
| Public | 334 | <5 |
| Residential | 448,000 | <5 |
| Transport | 471 | <5 |
| Waste management | 7,431,000 | <5 |
| Unspecified | 45,493,000 | <5 |
| Type of Technical Assistance | ||
| Capacity building | 21,867,000 | <5 |
| Policy support and evidence | 4,500 | <5 |
| Project and investment support | 195,000 | <5 |
| Unspecified | 116,857,000 | <5 |
Appendix
Annex 1: Estimated ICF expected total programme benefits
Expected total programme benefits include all the benefits from current and past ICF programmes, both those already delivered and those expected in the future. This includes benefits that continue after a programme has ended. For example, clean energy technology installed by a programme will keep reducing emissions for as long as it works. We adjust these estimates to account for risks, such as the technology breaking down.
We do not report expected total programme benefits for KPI 15 or TA KPI 1. For KPI 15, scores are given at the programme level, so results cannot be added together. For TA KPI 1, some programmes decide which countries to support later in their lifetime. Because we only count each country once, reporting expected total benefits could lead to double counting.
How to use expected total programme benefits
Expected total programme benefits help us estimate the long-term impact of UK International Climate Finance (ICF) by including projected future benefits. When planning a programme, we model these benefits using assumptions about the local context and how well the interventions will work. We update these estimates during the programme as we get better data, so the numbers may go up or down.
Monitoring usually ends when a programme closes, but counting total programme benefits gives a fuller picture of what ICF has achieved overall. There is no fixed end date for these benefits, as each programme is different.
Note, expected total programme benefits are not targets and should not be treated as targets.
Table 16: Expected total programme benefits
| KPI number | KPI title | Expected total programme benefits |
|---|---|---|
| ICF KPI 1 | Number of people supported to better adapt to the effects of climate change as a result of ICF | 242,101,000 People |
| ICF KPI 2.1 | Number of people with improved access to clean energy as a result of ICF | 165,561,000 People |
| ICF KPI 2.2 | Number of social institutions with improved access to clean energy as a result of ICF | 1,955 Institutions |
| ICF KPI 4 | Number of people whose resilience has been improved as a result of ICF | 57,993,000 People |
| ICF KPI 6 | Tonnes of greenhouse gas emissions reduced or avoided | 1,711,346,000 Tonnes of CO2 (tCO2e) |
| ICF KPI 7 | Installed capacity of clean energy as a result of ICF | 11,000 Megawatts (MW) |
| ICF KPI 8 | Ecosystem loss avoided | 10,176,000 Hectares |
| ICF KPI 10 | Value of ecosystem services generated or protected as a result of ICF | 6,520,000 GBP (£) |
| ICF KPI 11 | Volume of public finance mobilised for climate change purposes as a result of ICF | 19,608,608,000 GBP (£) |
| ICF KPI 12 | Volume of private finance mobilised for climate change purposes as a result of ICF | 21,714,254,000 GBP (£) |
| ICF KPI 15 | Extent to which ICF intervention is likely to lead to transformational change | Not Applicable |
| ICF KPI 17 | Area under sustainable management practices as a result of ICF | 70,705,000 Hectares |
| ICF TA KPI 1 | Number of countries supported by ICF Technical Assistance | Not Applicable |
| ICF TA KPI 2.1 | Number of individuals supported by ICF Technical Assistance | 6,446,000 People |
| ICF TA KPI 2.2 | Number of organisations supported by ICF Technical Assistance | 10,000 Organisations |
| ICF TA KPI 3 | Number of climate policies informed by ICF Technical Assistance | 557 Policies |
| ICF TA KPI 5 | Tonnes of greenhouse gas emissions reduced or avoided through ICF Technical Assistance | 404,451,000 Tonnes of CO2 (tCO2e) |
Annex 2: List of programmes that have contributed to the ICF results
This includes all programmes that have reported ICF results, even those that have now closed. Some programmes were fully funded by ICF, while others only received a small amount of ICF funding. You can find more details about each programme on DevTracker by searching the programme ID.
Table 17: All programmes that have ever reported ICF results between 2011 and 2025
| Programme ID | Programme title |
|---|---|
| PRPIND001007 | Accelerating Smart Power and Renewable Energy in India (ASPIRE) |
| PRPIND001005 | UK-Niti Aayog Electric Mobility Accelerator Programme |
| PRPIND001004 | Voluntary Contribution to support International Energy Agency (IEA) activities in India within Clean Energy Transitions Programme |
| PRPIND001002 | Exploring Policy and Institutional arrangements for advancing City - Decarbonisation |
| PMNISFDIQB2532001 | International Organisation for Migration (IOM) Climate Migration |
| GB-GOV-52-CSSF-06-000023 | Conflict, Stability and Security Fund (CSSF) Middle East Peace Process |
| GB-GOV-3-PF-CHP-924 | China Prosperity Fund Portfolio Phase 1 Programme Energy and Low Carbon Economy |
| GB-GOV-3-PF-ASEAN | Support on Floating Solar Photovoltaic (PV) Projects in Laos |
| DefraPO031 | Championing Inclusivity in Plastic Pollution (CHIPP) |
| DefraPO030 | Illegal Wildlife Trade Challenge Fund |
| DefraPO029 | Darwin Plus |
| DefraPO028 | Global Biodiversity Framework Fund (GBF Fund) |
| DefraPO027 | Environmental Pollution Programme |
| DefraPO026 | Nature Positive Economy |
| DefraPO025 | Darwin Initiative |
| DefraPO023 | Global Fund for Coral Reefs (GFCR) |
| DefraPO022 | Ocean Risk and Resilience Action Alliance (ORRAA) |
| DefraPO021 | Ocean Country Partnership Programme (OCPP) |
| DefraPO020 | Global Plastic Action Partnerships (GPAP) |
| DefraPO018 | Cities4Forests |
| DefraPO017 | Biodiverse Landscapes Fund (BLF) |
| DefraPO016 | Global Centre for Biodiversity and Climate (GCBC) |
| DefraPO015 | Taskforce on Nature-related Financial Disclosures (TNFD) |
| DefraPO014 | Global Programme for Sustainability |
| DefraPO013 | Low Carbon Agriculture and Avoided Deforestation in Brazil - Phase 2 (Rural Sustentavel Phase 2) |
| DefraPO012 | Low Carbon Agriculture and Avoided Deforestation in Brazil - Phase 1 (Rural Sustentavel Phase 1) |
| DefraPO009 | Land Degradation Neutrality Fund |
| DefraPO008 | UK Blue Carbon Fund |
| DefraPO006 | United Nations Development Programme (UNDP) Climate promise |
| DefraPO005 | Biofin |
| DefraPO004 | Sustainable Cooling and Cold Chain Solutions (SCCCS) |
| DefraPO003 | The eco.business Fund |
| DefraPO002 | Reducing Deforestation and Forest Fires in the Brazilian Cerrado |
| DefraPO001 | Blue Forests Initiative |
| 025-Ci-Dev | Carbon Initiative for Development (Ci-Dev) |
| 009-GETFiT | Global Energy Transfer Feed-in Tariff (GETFiT) |
| 0046-AIM4Forests | Accelerating Innovation Monitoring For Forests (AIM4Forests) |
| 0045-IDBABFM | Inter-American Development Bank (IDB) Amazon Bioeconomy and Forests Management |
| 0044-ETP | South East Asia Energy Transitio Programme (ETP) |
| 0043-GFDT | Global Facility to Decarbonise Transport (GFDT) |
| 0042-LEAF | Lowering Emissions by Accelerating Forest finance (LEAF) Coalition |
| 0040-MFF | Mobilising Finance for Forests (MFF) |
| 0038-PMI | Partnerships for Market Implementation (PMI) |
| 0037-CEIF | Clean Energy Innovation Facility (CEIF) |
| 0036-CFA | Climate Finance Accelerator (CFA) |
| 0034-CASA | Capacity Building for International Negotiations (CASA) |
| 0033-ESMAP | Energy Sector Management Assistance Programme (ESMAP) |
| 0032-MAGC | Market Accelerator for Green Construction (MAGC) |
| 0029-KEEP | Knowledge, Evidence and Engagement Portfolio(KEEP) |
| 0028-C | 2050 Calculator |
| 0027-TCAF | Transformational Carbon Asset Fund (TCAF) |
| 0026-PMR | Partnership for Market Readiness (PMR) |
| 0023-FSP | Fiji Support Programme |
| 0022-CBIT | Capacity Building for Transparency Initiative (CBIT) |
| 0020-SPS | Silvopastoral Systems (SPS) |
| 0019-REM | REDD Early Movers programme (REM) |
| 0017-FCPF-C | Forest Carbon Partnership Facility - Carbon Fund (FCPF -C) |
| 0016-ISFL | BioCarbon Fund Initiative for Sustainable Forested Landscapes (ISFL) |
| 0015-UKCI | UK Climate Investments (UKCI) |
| 0012-TGIL | The Global Innovation Lab |
| 0011-GCPF | Global Climate Partnership Fund (GCPF) |
| 0008-NDCP | NDC Partnership (NDCP) |
| 0007-MAF | Mitigation Action Facility (MAF) |
| 0006-CETP | Clean Energy Transition Programme (CETP) |
| 0003-CLIC | Climate Leadership In Cities (CLIC) |
| 0002-CEFTA | Clean Energy Fund Technical Assistance Programme (CEF TA) |
| 0001-CCUS | International Carbon Capture, Usage and Storage (CCUS) |
| 400399 | Indonesia Renewable Energy Programme (MENTARI) |
| 400159 | Enhanced Water Leadership in a Changing Climate |
| 400158 | Food and Agriculture Organisation (FAO) Early Action and Resilience Transformation in Humanitarian (EARTH) |
| 400156 | Climate, Energy and Water Security in Central Asia CEW-CA |
| 400153 | Scaling Agriculture Investment in Digital, AI and Innovation |
| 400095 | Risk Informed Early Action Partnership (REAP) |
| 400094 | Race to Resilience (RtR) |
| 400093 | Delivering Locally-Led Adaptation Action (LIFE-AR) |
| 400047 | India-UK Economic Cooperation Programme |
| 400028 | Afghanistan Food Security and Livelihoods Programme (FSL) |
| 400024 | Ukraine Resilience and Energy Security Programme (URES) |
| 400021 | Pacific Clean Energy |
| 400020 | India Challenge Enabling Fund (ICE) |
| 301583 | Humanitarian Response Pakistan - 2022 Floods |
| 301579 | Catalysing Private Finance for Adaptation and Resilience |
| 301568 | South Sudan Humanitarian Assistance and Resilience Programme (SSHARP) |
| 301554 | Delivering the Agricultural Breakthrough |
| 301532 | Climate Resilient and Sustainable Health Systems |
| 301529 | WASH (water, sanitation and hygiene) Systems for Health |
| 301527 | Supporting Afghanistan’s Basic Services |
| 301526 | Powering Sierra Leone’s Hospitals |
| 301523 | Just Energy Transition Partnership Support South Africa |
| 301517 | Renewable Energy Performance Platform (REPP) |
| 301516 | Sustainable Infrastructure Programme - Latin America (SIP LA) |
| 301502 | Territorios Forestales Sostenibles (TEFOS) |
| 301499 | Urban Climate Action Programme |
| 301495 | UK Partnering for Accelerating Climate Transitions (UK PACT) |
| 301474 | Ethiopia Crises 2 Resilience (EC2R) |
| 301454 | Good Governance Fund (Phase 3) Eastern Neighbourhood: Supporting Governance and Economic Reform |
| 301442 | Catalytic Climate Action in Iraq |
| 301440 | Transforming Access to Climate Finance |
| 301439 | Sustainable Blue Economies |
| 301406 | Climate, Environment and Nature (CLEAN) helpdesk |
| 301328 | Animal and Plant Health Innovation and Evidence Delivery (APHID) |
| 301293 | Global Partnership for Education |
| 301268 | Global Environment Facility 8th Replenishment |
| 301253 | COVID-19 Green Response and Recovery Support |
| 301252 | Justice and Stability in the Sahel (JASS) |
| 301242 | Pakistan Climate Investment Fund (CIF-PAK) |
| 301240 | Enabling Development for Girls Education |
| 301217 | Adaptation Adviser Secondment to the Green Climate Fund (Africa) |
| 301183 | Livelihoods and Food Security Fund |
| 301160 | Small Island Developing States Development and Resilience Programme (SIDAR) |
| 301147 | Myanmar Foundations for Peace & Democracy |
| 301142 | Pioneering a Holistic approach to Energy and Nature-based Options in the Middle-East and North Africa (MENA) for Long-term stability - PHENOMENAL |
| 301109 | Strengthening Societal and Economic Resilience in Jordan (SSERJ) |
| 301106 | Investing in Nature and Forests (INAFOR) Indonesia Partnership |
| 301015 | Climate Smart Jobs Programme |
| 301013 | Resilient Water Sanitation and Hygiene (WASH) and Emergency Preparedness Programme (RWEPP) |
| 301010 | Nepal Local Infrastructure Support Programme (LISP) |
| 301000 | Climate Action for a Resilient Asia |
| 300991 | Bangladesh Climate Change and Environment Programme |
| 300978 | Humanitarian Assistance and Resilience Building in Somalia (HARBS) |
| 300961 | Effective Governance for Economic Development in Central Asia |
| 300934 | Malawi Trade and Investment Programme |
| 300921 | Mobilising Institutional Capital Through Listed Product Structures |
| 300889 | Global Water Leadership in a Changing Climate |
| 300886 | Building Resilience in the Sahel through Adaptive Social Protection: Phase II |
| 300857 | Better Lives for Somali Women and Children |
| 300856 | Green Climate Fund First Replenishment |
| 300836 | Propcom+ Supporting economic development in conflict and climate affected regions in Nigeria |
| 300812 | The Growth Gateway programme |
| 300808 | Africa Regional Climate and Nature Programme (ARCAN) |
| 300801 | Evidence for Health: E4H |
| 300798 | Building Resilience and Addressing Vulnerability in Emergencies (BRAVE) |
| 300755 | Securing global wheat crops for food and nutritional security - in partnership with the Bill & Melinda Gates Foundation (BMGF) |
| 300751 | Global Risk Financing (GRIF) Programme |
| 300728 | Tackling global plant and animal health risks which threaten global food systems and health - in partnership with the Bill & Melinda Gates Foundation (BMGF) |
| 300725 | Transforming Access to WASH (water, sanitation and hygiene) and Nutrition Services in Mozambique |
| 300724 | Water Resource Accountability in Pakistan (WRAP) |
| 300708 | The Evidence Fund |
| 300705 | Delivering ambition of the United Nations Secretary General’s Climate Summit 2019 to build resilience to climate change |
| 300702 | Accelerating Ethiopia’s Economic Transformation |
| 300686 | Support for the Climate Resilience Execution Agency of Dominica |
| 300683 | Strengthening Ethiopia’s Adaptive Safety Net (SEASN) |
| 300678 | Core Contribution 2020 to 2021 Food and Agriculture Organisation |
| 300675 | Low Carbon Development Initiative 2 (LCDI 2) Programme |
| 300671 | Support to the CGIAR 2021 to 2024 |
| 300667 | Supporting Economic Empowerment and Development in the Occupied Palestinian Territories (SEED OPTs) |
| 300655 | Supporting Pastoralism and Agriculture in Recurrent and Protracted Crises (SPARC) |
| 300654 | Innovative Metrics and Methods in Agriculture and Nutrition (IMMANA) Phase 2 |
| 300650 | Unlocking Prosperity in the Horn of Africa |
| 300644 | Enhancing Digital and Innovations for Agri-food Systems and Livelihoods (eDIAL) |
| 300635 | Private Enterprise Programme Zambia Phase II |
| 300632 | Strengthening Impact Investment Markets for Agriculture (SIIMA) |
| 300580 | Educate the Most Disadvantaged Children in Bangladesh |
| 300566 | Green Cities and Infrastructure Programme |
| 300555 | Global Land Governance Programme |
| 300554 | Bangladesh: Rohingya Response and National Resilience (RRNR) |
| 300539 | Pioneer Outcomes Funds (POF) |
| 300531 | Africa Humanitarian Response Fund |
| 300524 | Strengthening Disaster Recovery and Resilience in the Caribbean |
| 300489 | Africa Food Trade and Resilience programme |
| 300467 | Better Assistance in Crises (Social Protection) |
| 300452 | Global Finance Programme |
| 300435 | Delivering Accelerated Family Planning in Pakistan (DAFPAK) |
| 300432 | North East Nigeria Transition to Development Programme |
| 300424 | Reducing Deforestation Through Improved Spatial Planning in Papua Provinces, Indonesia |
| 300421 | UK : India Fastrack Start-up Fund (FSF) |
| 300418 | UK-INDIA Partnership on National Investment and Infrastructure Fund - Green Growth Equity Fund |
| 300414 | Essential Healthcare for the Disadvantaged in Bangladesh |
| 300385 | Leave No-one Behind Programme in Ghana |
| 300370 | Supporting Inclusive Growth in Somalia (SIGS) |
| 300363 | Building Resilience in Ethiopia (BRE) |
| 300351 | Second phase of DFID’s Support to the Private Infrastructure Development Group (PIDG) |
| 300308 | Direct Response through Emergency Cash Transfers |
| 300303 | Rural Electrification in Sierra Leone |
| 300298 | Humanitarian Response in Mozambique |
| 300274 | UK Nigeria Infrastructure Advisory Facility (UKNIAF) |
| 300252 | Teacher Effectiveness and Equitable Access for Children (TEACH) |
| 300237 | Strengthening Climate Resilient Systems for Water, Sanitation and Hygiene Services in Ethiopia (SCRS - WASH) |
| 300230 | Transboundary Water Management in Southern Africa |
| 300187 | Strengthening Palm Oil Sustainability in Indonesia |
| 300185 | Supporting a Sustainable Future for Papua’s Forests |
| 300168 | Zimbabwe - Support to Agriculture, Land Governance and Resilience Programme (2021 to 2025) |
| 300166 | Khyber Pakhtunkhwa Merged Districts (KPMD) Support Programme (previously called the Federally Administered Tribal Areas (FATA) Development Programme) |
| 300164 | Climate Adaptation Water and Energy Infrastructure Programme |
| 300161 | Zambia Social Protection Expansion Programme Phase II |
| 300150 | Umoyo Wathu Health System Strengthening Programme |
| 300147 | Reducing Insecurity and Violent Extremism in the Northern Territories (Re-INVENT) |
| 300143 | Hunger Safety Net Programme (HSNP Phase 3) |
| 300141 | Sustainable Energy and Economic Development (SEED) Programme |
| 300137 | Regional Economic Development for Investment and Trade (REDIT) Programme |
| 300134 | Revenue Mobilisation, Investment and Trade Programme (REMIT) |
| 300128 | ASEAN Catalytic Green Finance Facility |
| 300126 | CLARE - CLimate And REsilience Framework Programme |
| 300125 | Climate Compatible Growth |
| 300124 | SMEP - Sustainable Manufacturing and Environmental Pollution programme |
| 300123 | MECS - Modern Energy Cooking Services |
| 300116 | Productivity for Prosperity (P4P) |
| 300113 | Building Resilience and adapting to climate change in Malawi |
| 300111 | Low Energy Inclusive Appliances |
| 300110 | Smart Urban Development in Indian States (SmUDI) |
| 300109 | Technical Assistance for Smart Cities (TASC) |
| 300102 | The Future of Agriculture in Rwanda (FAiR) |
| 300067 | Water, Environmental Sanitation and Hygiene Programme |
| 300057 | Global Environment Facility 7th replenishment |
| 300003 | Strengthening disaster resilience in Nepal |
| 205271 | Support to the International Agriculture Research Centres developing and delivering agriculture technologies and knowledge to reduce poverty, hunger and adapt to climate change |
| 205268 | Strengthening humanitarian preparedness and response in Bangladesh |
| 205266 | Pacific Catastrophe Risk Assessment and Financing Initiative |
| 205258 | Green Economic Growth for Papua |
| 205252 | To contribute to the Least Developed Countries Fund for adaptation, hosted by the Global Environment Fund. |
| 205246 | Girls and out of school children: Action for learning (GOAL) |
| 205238 | Financial Sector Deepening Africa (FSDA) Platform |
| 205231 | Centre for Disaster Protection (CDP) |
| 205226 | Manufacturing Africa - Foreign Direct Investment |
| 205222 | Cities and Infrastructure for Growth (CIG) |
| 205195 | Rehabilitation of Freetown’s Water Supply System |
| 205188 | Increasing access to electricity in Sierra Leone |
| 205157 | UK Caribbean Infrastructure Fund |
| 205145 | Nepal Health Sector Programme III |
| 205142 | The India-UK Global Partnership Programme on Development |
| 205138 | Post-Earthquake Reconstruction in Nepal - Building Back Better |
| 205128 | Somalia Humanitarian and Resilience Programme (SHARP) 2018 to 2022 |
| 205122 | Malawi Humanitarian Preparedness and Response Programme |
| 205118 | Commercial Agriculture for Smallholders and Agribusiness Programme |
| 205116 | Support for Protection and Assistance of Refugees in Kenya (SPARK) |
| 205115 | Adapt Environmental and Climate Resilience in Sudan |
| 205082 | Rural Water for Sudan (RW4S) |
| 205061 | Increasing renewable energy and energy efficiency in the Eastern Caribbean |
| 205058 | UK - Ghana Partnership for Jobs and Economic Transformation (JET) |
| 205045 | Zimbabwe Resilience Building Fund Programme (ZRBF) |
| 205027 | Delivering climate resilient Water, Sanitation and Hygiene in Africa and Asia |
| 204989 | Central Asia Enterprise and Innovation Programme (EIP) |
| 204984 | Climate Smart Development for Nepal |
| 204956 | CONGO - Improving Livelihoods and Land Use in Congo Basin Forests |
| 204941 | Sustainable Inclusive Livelihoods through Tea Production in Rwanda |
| 204940 | Improving Market Systems for Agriculture in Rwanda (IMSAR) |
| 204916 | Strategic Partnership Arrangement II between DFID and BRAC |
| 204903 | Somali Health and Nutrition Programme (SHINE) |
| 204888 | Building Resilience Through Asset Creation and Enhancement II – South Sudan (ICF Programme) |
| 204869 | PMEH - Pollution Management & Environmental Health |
| 204867 | Transforming Energy Access (TEA) |
| 204842 | Promoting Conservation Agriculture in Zambia |
| 204837 | BRILHO - Energy Africa Mozambique |
| 204804 | Accountability in Tanzania Programme - Phase II |
| 204794 | Infrastructure for Climate Resilient Growth in India |
| 204784 | Green Mini-Grids Africa Regional Facility for Market Preparation, Evidence and Policy Development |
| 204783 | Climate Action for Middle East and North Africa (CAMENA) |
| 204773 | Applied Research on Energy and Growth |
| 204764 | CGIAR 2017 to 2021, Support to develop and deploy the next generation of agriculture technology to support poor farmers by the international agriculture research organisation the CGIAR, 2017 to 2021 |
| 204702 | Sanitation, Water and Hygiene for the Rural Poor |
| 204694 | Zimbabwe Economic Stability and Transformation (ZEST) |
| 204672 | Business for Shared Prosperity in Burma |
| 204656 | Building Urban Resilience to Climate Change in Tanzania |
| 204640 | Zambia Health Systems Strengthening Programme |
| 204637 | Africa Clean Energy Programme (ACE) |
| 204624 | WISER - Weather and climate Information and SERvices for Africa |
| 204623 | Forestry, Land-use and Governance in Indonesia |
| 204607 | Sub-National Governance Programme II (SNG II) |
| 204603 | Multi-Year Humanitarian Programme in Pakistan |
| 204531 | Work and Opportunities for Women (WOW) |
| 204495 | Support to Trademark East Africa Rwanda (TMEA) Rwanda Country Programme - Strategy II |
| 204477 | Exiting Poverty in Rwanda |
| 204471 | UK Support to Access to Finance Rwanda (AFR) Phase II Operations (2016 to 2020) |
| 204456 | Programme of Support to Agriculture in Rwanda |
| 204420 | Gates Agriculture & Food Systems for Nutrition |
| 204415 | Transform |
| 204369 | Corridors for Growth |
| 204365 | Improving Energy Access in Tanzania through Green Mini-Grids |
| 204364 | Assisting Public Institutions and Markets to Become Resilient to Effects of Climate Change in Tanzania (AIM for Resilience) |
| 204338 | Sustainable Urban Economic Development Programme (SUED) |
| 204290 | Productive Safety Net Programme Phase 4 |
| 204270 | Africa Division funding to the African Agriculture Development Company (AgDevCo) |
| 204258 | Hunger Safety Net Programme |
| 204250 | Infrastructure and Cities for Economic Development (ICED) |
| 204248 | Global Green Growth Institute (GGGI) |
| 204202 | Sustainable Energy for Women and Girls (SEWG) |
| 204196 | Burma Humanitarian Assistance and Resilience Programme |
| 204148 | Food and Agriculture Organisation Core Assessed Contribution 2018 to 2019 |
| 204135 | Bihar Agriculture Growth and Reform Initiative (BAGRI) |
| 204059 | Supporting Structural Reform in the Indian Power Sector |
| 204056 | Global Environment Facility 6th Replenishment |
| 204045 | Urban Water for Sudan (UW4S) |
| 204033 | Support to Rural Water Supply, Sanitation & Hygiene in Tanzania |
| 204020 | Climatescope - Clean Energy Investment Index |
| 204019 | Humanitarian Assistance and Resilience in South Sudan (HARISS) 2015 to 2021 |
| 204012 | Transforming the Economy through Climate Smart Agribusiness (NU-TEC) |
| 203998 | Green Mini-Grids Kenya |
| 203911 | India: Infrastructure Equity Fund - Investment in small infrastructure projects in India’s poorest states |
| 203904 | Multi-Year Humanitarian Support to Afghanistan |
| 203871 | Energy Security and Resource Efficiency in Somaliland |
| 203864 | Better Health in Bangladesh |
| 203852 | Pathways to Prosperity for Extremely Poor People in Bangladesh (PPEPP) |
| 203844 | Research on Growth and High Volume Transport in Low Income Countries |
| 203842 | Managing Climate Risks for Urban Poor |
| 203809 | Disaster Risk Insurance |
| 203804 | GSMA Mobile for Development |
| 203768 | Strengthening Emergency Preparedness and Response in Kenya (2014 to 2018) |
| 203766 | Water, Sanitation and Hygiene (One WASH) Programme |
| 203764 | Nepal Local Governance Support Programme |
| 203674 | Solar Nigeria Programme |
| 203641 | Social Protection Support to the Poorest in Rwanda |
| 203640 | Ghana Partnership Beyond Aid |
| 203603 | Enhancing resilience in Karamoja Uganda |
| 203599 | Building adaptation to climate change in health through resilient water, sanitation & hygiene |
| 203595 | Achieving Water Security in the Southern Agricultural Growth Corridor |
| 203582 | Provision of finance to the Rwanda Fund for Climate Change and Environment |
| 203574 | Strengthening Adaptation and Resilience to Climate Change in Kenya Plus (StARCK+) |
| 203551 | Tackling Maternal and Child Undernutrition Programme- Phase II |
| 203491 | Support to Bangladesh’s National Urban Poverty Reduction Programme (NUPRP) |
| 203488 | Transparency and Right to Information |
| 203473 | Productive Social Safety Net Programme |
| 203469 | African Risk Capacity (ARC) |
| 203445 | Increasing sustainable access to water sanitation and hygiene in the Democratic Republic of Congo |
| 203444 | British International Investment (BII) Programme of Support in Africa, South Asia, Indo-Pacific & Carib (2015 to 2027) |
| 203427 | Accelerating Investment and Infrastructure in Nepal |
| 203294 | Community Disaster Risk Reduction Fund |
| 203290 | Improving climate change resilience in Caribbean communities |
| 203282 | Promoting Low Carbon Development with Returnable Capital in Indonesia |
| 203279 | CCMCC Promoting co-operation and avoiding conflict in managing the impacts of climate change |
| 203272 | Strengthening Health Facilities in the Caribbean |
| 203264 | Building Disaster Resilience in Pakistan |
| 203186 | Rural Access Programme 3 |
| 203185 | Asia Regional Resilience to a changing climate (ARRCC) |
| 203180 | Climate Proofing Growth and Development in South Asia |
| 203161 | Private Sector Development programme in the DRC. |
| 203153 | East Africa Geothermal Energy (EA-Geo) |
| 203123 | Low Carbon Support to the Ministry of Finance |
| 203052 | AgResults |
| 203029 | ‘Pakistan National Cash Transfers Programme’ |
| 202995 | Support for Refugees in Kenya (2012 to 2016) |
| 202976 | Providing Clean Energy to the Rural Poor of Bangladesh |
| 202957 | Results Based Financing for Low Carbon Energy Access |
| 202956 | Global Network of Climate Technology Innovation Centres |
| 202954 | Support for Energy Sector Analysis that influences global energy decision makers |
| 202921 | Building Resilience and Adaptation to Climate Extremes and Disasters |
| 202884 | The Water Security Programme |
| 202869 | India: Infrastructure Loan Fund – Small loans to bridge the infrastructure gap for the poor |
| 202867 | Financing Liveable Habitat for Poor in Low Income States |
| 202844 | Southern Agriculture Growth Corridor Programme in Tanzania |
| 202835 | Private Enterprise Development in low-income countries (PEDL) |
| 202817 | Adaptation for Smallholder Agricultural Programme (ASAP) |
| 202775 | South Asia Water Governance Programme (SAWGP) |
| 202762 | Supporting Indian Trade and Investment for Africa |
| 202745 | Investments in Forests and Sustainable Land Use (IFSLU) |
| 202698 | Kenya Market Assistance Programme (MAP) |
| 202697 | Punjab Education Support Programme II |
| 202691 | Support to improved water and sanitation in rural areas – Zimbabwe |
| 202657 | Kenya Essential Education Programme |
| 202619 | Arid Lands Support Programme |
| 202604 | Global Innovation Fund (GIF) |
| 202597 | Climate High-Level Investment Programme |
| 202595 | Support for priority actions to operationalise the Implementation Plan for Development Resilient to Climate Change in the Caribbean |
| 202571 | Support to the Global Agriculture and Food Security Programme (GAFSP) |
| 202555 | Private Sector Energy Efficiency |
| 202549 | Reducing Maternal and Newborn Deaths in Kenya |
| 202541 | Climate Smart Agriculture in Africa |
| 202539 | Regional Transboundary Water Resources Programme: Phase 3 |
| 202536 | Scaling up of the Energy and Environment Partnership with Southern and East Africa |
| 202534 | Tanzania Climate Change Institutional Strengthening Programme |
| 202520 | Water for Three States (Red Sea, Gadarif and Kassala) |
| 202495 | Enterprise and Assets Growth Programme |
| 202433 | UK Support to Increase Resilience to Natural Disasters in Nepal |
| 202376 | Promoting Low Carbon Development in Indonesia |
| 202345 | Sanitation and Hygiene Programme in Zambia |
| 202328 | Khyber Pukhtunkhwa Education Sector Programme |
| 202214 | Malawi Health Sector Support Programme |
| 202108 | AGMIP: Agricultural Model Inter-Comparison and Improvement Project |
| 202098 | Rural and Agriculture Markets Development programme for Northern Nigeria (PrOpCom Mai-karfi) |
| 201989 | Vietnam: DFID-World Bank Climate ChangePartnership |
| 201986 | Caribbean Renewable Energy and Energy Efficiency Improvement Projects |
| 201980 | Private Enterprise Programme in Zambia |
| 201942 | Indonesia Low Carbon Growth Project |
| 201931 | Green Africa Power (GAP): Renewable Energy for Africa |
| 201913 | Strengthening Adaptation and Resilience to Climate Change in Kenya (StARCK) |
| 201866 | Strategic Climate Institutions Programme |
| 201857 | Market Development in Northern Ghana |
| 201733 | Climate Public Private Partnership Programme (CP3) |
| 201724 | Forest Governance, Markets and Climate |
| 201575 | Renewable Energy and Adaptation Climate Technologies (Africa Enterprise Challenge Fund) |
| 201295 | Strategic Influencing Fund |
| 201286 | Strategic Partnership between BRAC, DFID and AusAID to support BRAC in delivering progress towards the MDGs in Banglades and to support its Institutional Development |
| 201239 | Livelihoods and Food Security Trust Fund for Burma(NUTSEM) |
| 201196 | Enhancing Community Resilience Programme |
| 201129 | Nepal Climate Change Support Programme |
| 200773 | Multi-Stakeholder Forestry Programme - Nepal |
| 200658 | Care Adaptation Learning Programme |
| 200498 | Accountability in Tanzania Programme (ACT) |
| 200496 | Co-operation in International Waters in Africa |
| 200368 | Support to the multilateral Climate Investment Funds (CIFs) |
| 200136 | Climate Development for Africa |
| 114293 | Poorest States Inclusive Growth Programme |
| 114058 | Climate Change Programme - Jolobayoo-O-Jibon |
| 113889 | Congo Basin Forest Fund (CBFF) Start Up Programme |
| 112082 | ESPA - Eco System Services for Poverty Alleviation |
| 102580 | Nile Basin Initiative |
-
The non-continuous numbering of the ICF KPIs is because some earlier indicators are no longer used, as they were not well suited for monitoring the ICF portfolio. ↩
-
Additionality - how much of the results were achieved because of the ICF projects, compared to what would have happened without them, under ‘business as usual’ ↩
-
Direct beneficiaries are defined as those that are both targeted and receive high intensity support. Further details of this definition are included in the KPI 1 methodology. ↩
-
For this KPI, social institutions are defined as: schools, universities, hospitals, health centres, government institutions, state owned infrastructure and civil society organisations. ↩
-
Attributed means that our work directly and solely caused the results (this is calculated as a UK share of results where there are multiple donors); contributed means our work was part of a number of factors which led to a result. For further information on attribution, contribution and additionality, see our supplementary guidance on additionality and attribution ↩ ↩2
-
DAC refers to the Development Assistance Committee, an international forum of some of the largest providers of aid, with the aim of promoting development co-operation ↩
-
ODA funding is reserved for low- and middle-income countries. Only countries and territories included in the DAC list of ODA recipients are eligible to receive this assistance. ↩