UK International Climate Finance results 2023
Updated 6 October 2023

© Crown copyright 2023
This publication is licensed under the terms of the Open Government Licence v3.0 except where otherwise stated. To view this licence, visit nationalarchives.gov.uk/doc/open-government-licence/version/3 or write to the Information Policy Team, The National Archives, Kew, London TW9 4DU, or email: psi@nationalarchives.gov.uk.
Where we have identified any third party copyright information you will need to obtain permission from the copyright holders concerned.
This publication is available at https://www.gov.uk/government/publications/uk-international-climate-finance-results-2023/uk-international-climate-finance-results-2023
International Climate Finance
International Climate Finance (ICF) is Official Development Assistance (ODA) from the UK to support developing countries to reduce poverty and respond to and mitigate the challenges caused by climate change and environmental degradation. These investments help developing countries to:
- adapt and build resilience to the current and future effects of climate change
- pursue low-carbon development
- support sustainable management of natural resources
- increase access to clean energy
- reduce deforestation
The UK has committed to spending £11.6 billion of ICF between financial years 2021 to 2022 to 2025 to 2026, with £3 billion of this to be invested in climate change solutions that protect, restore and sustainably manage nature. The Prime Minister announced at COP27 that we are tripling our adaptation finance from £500 million in 2019 to £1.5 billion in 2025. The UK met its previous ICF commitment of £5.8 billion between 2016 to 2017 and 2020 to 2021 and £3.8 billion was spent from 2011 to 2012 to 2015 to 2016. The UK International Climate Finance Strategy[footnote 1] outlines how ICF is being spent and how it is delivering results.
The ICF portfolio is delivered jointly across 4 UK Government Departments:
- the Foreign Commonwealth & Development Office (FCDO)
- the Department for Energy Security and Net Zero (DESNZ formerly the Department for Business, Energy and Industrial Strategy)
- the Department for Science, Innovation and Technology (DSIT)
- the Department for Environment, Food & Rural Affairs (Defra)
This publication presents the headline achievements of ICF since 2011.It brings together results against 15 key performance indicators (KPIs) from UK aid programmes that have climate change adaptation or mitigation as an objective. The ICF portfolio results framework does not attempt to capture the full benefits of ICF programmes, because individual programmes have context-specific aims that are not necessarily covered by the ICF KPIs. Some programmes integrate climate as part of a broader development project, so not all their aims feed into the ICF KPIs, while others have indirect impacts that that are hard to aggregate across the ICF portfolio. Some programmes may also have not reported all relevant KPIs due to capacity constraints, data limitations, or considerations of proportionality or value for money. Overall, we always aim to provide a conservative estimate of ICF Results rather than overclaim our impact.
Climate change
In 2023, the world experienced the hottest summer on record. The wildfires in Europe were devastating with the Greek wildfire being the largest recorded in the EU. China and America experienced powerful hurricanes with floods in Northern India and Pakistan. The impacts of climate change extend across the Sustainable Development Goals (SDGs), with increased extreme weather events already affecting plant and animal species. To limit warming to 1.5°C, as set out in the Paris Agreement, requires a 43% decrease in global greenhouse gas emissions by 2030, and net zero by 2050.
The sixth assessment from the Intergovernmental Panel on Climate Change (IPCC) emphasises the interdependence of climate, ecosystems and biodiversity, and human society, and the need for an integrated approach across these areas to solve the challenges we face. The mutually reinforcing crises of rapid climate change and unprecedented biodiversity loss are a key threat to global security and prosperity. We cannot reach net zero or limit global temperature rises to 1.5 degrees without protecting and restoring ecosystems. Therefore, improvements in agriculture, protecting and restoring nature and using land and the ocean sustainably are central to efforts to tackle and adapt to climate change, build resilience against wider shocks and to protect the global economy. By 2030, climate change and environmental degradation could push a further 100 million into poverty[footnote 2]. Millions of people are increasingly exposed to food and water insecurity, but it is the poorest and most vulnerable who are hit first, hardest and who are least able to cope[footnote 3]. The UK’s International Development Strategy in 2022 and the Integrated Review Refresh in 2023 set out how tackling, and adapting, to climate change are, and will be, part of the UK’s development offer.
While the IPCC assessment stressed the severity of the situation, it also outlined how it is still possible to achieve the necessary emissions reductions to keep global warming to 1.5°C[footnote 4]. Substantial progress was made at the United Nations Climate Change Conference COP26, hosted by the UK in 2021, which included:
- securing net zero commitments for over 90% of the world’s economy – up from 30% 2 years previously, when the UK began preparations for COP26
- the Glasgow Climate Pact was agreed, which set out ambitious commitments to increase action on climate change[footnote 5], including phasing down coal and ending inefficient fossil fuel subsidies for the first time
- increased support to developing countries, including at least doubling adaptation finance to $40 billion per year by 2025
- leaders representing over 90% of the world’s forests pledged to halt and reverse forest loss and land degradation by 2030
At the United Nations Climate Change Conference COP 27 hosted in Egypt in 2022 further progress was made, including an agreement on a Loss and Damage Fund for particularly vulnerable countries devastated by climate impacts.
ICF results 2022 to 2023
Improvements to the publication for 2023
We continually seek to improve our reported results to enhance the publication’s usefulness and transparency. This year:
- results against 4 new KPIs, which measure results supported by ICF technical assistance activities (Technical Assistance KPIs) are reported
- we have continued to expand the availability of disaggregated results
- methodologies and guidance on reporting against most of the KPIs have been improved, with a new scoring methodology for KPI 15 and expanded scope for KPIs 8, 10 and 17
- for enhanced transparency, we have published the version of our data processing pipeline used to produce the 2023 ICF results, under the Digital Object Identifier (DOI):10.5281/zenodo.8411125
Monitoring progress on inclusion
We are pleased to present more disaggregated results in this year’s publication, building on last year when we reported disaggregated data for the first time. Requirements to break down beneficiary counts by sex, age, disability and geography have been strengthened in recent years, but not all programmes have monitoring systems that enable this information to be collected.
In particular, it is not always possible for programmes to report an individual’s characteristics across multiple categories – for example, disabled women in rural areas. Where a programme has not been able to provide a disaggregation in the format required, the results are listed as ‘unspecified’ within the publication. This can include those within disaggregation categories we do not yet report on, those where we cannot sufficiently verify the data or the level of data is not yet available. We are continuing to improve our data systems to support better disaggregated data collection and are working towards increased coverage of disaggregated results.
To protect sensitive data where the number of programmes reporting is very low, we suppress disaggregated results with fewer than 5 reporting programmes or fewer than 20 individual beneficiaries.
Total achieved results
ICF Results are reported for 11 KPIs and 4 TA KPIs[footnote 6]. Two hundred ninety-seven programmes have reported ICF results since 2011. Many of these programmes will continue to deliver further benefits after they have ended, so as well as cumulative results to date, we also report on total expected programme benefits (see Annex 1).
The total cumulative results achieved for each KPI between April 2011 and March 2023 are shown in table 1. Where this year’s KPI results are compared to those from the previous year, the latest available data has been used, including historic revisions, so these differences may not match previously published data. Throughout the publication, all presented figures greater than 10,000 have been rounded down to the nearest whole thousand.
For each KPI, cumulative results are calculated by summing results from all reporting programmes, across all years from 2011. More detailed results for each KPI are outlined below in the section ‘Results for each Key Performance Indicator (KPI)’. The percentage increases presented from the previous year are based on the latest available data, after any updates to historical data. Where there have been notable corrections to historic data these are identified within the KPI section below. All charts are also based on the latest cumulative results and include any updates to historical data.
Previous publications and the methodologies used to guide results monitoring and collection can be found on the ICF Results webpages. Details of the programmes referenced throughout this publication can be found on Development Tracker.
Table 1: ICF results achieved from April 2011 to March 2023
| KPI number | KPI title | Achieved total |
|---|---|---|
| KPI 1 | Number of people supported to better adapt to the effects of climate change | 101,589,000 People |
| KPI 2.1 | Number of people with improved access to clean energy | 69,747,000 People |
| KPI 2.2 | Number of social institutions with improved access to clean energy | 271 Institutions |
| KPI 4 | Number of people whose resilience has been improved | 32,254,000 People |
| KPI 6 | Tonnes of greenhouse gas emissions reduced or avoided | 86,791,000 tonnes of CO2 (tCO2e) |
| KPI 7 | Installed capacity of clean energy | 3,601 Megawatts (MW) |
| KPI 8 | Ecosystem loss avoided | 413,000 Hectares |
| KPI 10 | Value of ecosystem services generated or protected | 5,302,000 GBP (£) |
| KPI 11 | Volume of public finance mobilised for climate change purposes | 6,984,840,000 GBP (£) |
| KPI 12 | Volume of private finance mobilised for climate change purposes | 6,884,443,000 GBP (£) |
| KPI 15 | Extent to which ICF intervention is likely to lead to transformational change | 61.82% programmes scored a 4 or 5 |
| KPI 17 | Area under sustainable management practices | 2,700,000 Hectares |
| TA KPI 1 | Number of countries supported by ICF Technical Assistance | 125 Countries |
| TA KPI 2.1 | Number of individuals supported by ICF Technical Assistance | 414,000 People |
| TA KPI 2.2 | Number of organisations supported by ICF Technical Assistance | 1,450 organisations |
| TA KPI 3 | Number of climate policies informed by ICF Technical Assistance | 98 Policies |
| TA KPI 5 | Tonnes of greenhouse gas emissions reduced or avoided through ICF Technical Assistance | 35,001,000 Tonnes of CO2 (tCO2e) |
Results for each key performance indicator
KPI 1: Number of people supported to better adapt to the effects of climate change
This indicator tracks the number of people directly supported by UK ICF to better adapt to the impacts of climate change. Many different types of interventions contribute to climate adaptation support, including improving food security, water management and preparedness against climate-related natural disasters. These interventions support the achievement of Sustainable Development Goal (SDG) target 13.1 on strengthening resilience and adaptive capacity to climate-related hazards, as well as contributing towards SDG 2 on food security and SDG 6 on access to water.
A total of 101,589,000 people were directly supported to adapt to climate change from April 2011 to March 2023, reported by 129 programmes. This was an increase of 7,528,000 (8.00%) from the previous year (Figure 1). These results reflect the people directly reached by UK interventions, rather than indirect benefits to the wider community.
The 3 programmes that contributed the largest increases in results for this KPI in the last year were ‘Disaster Risk Insurance’, ‘Global Risk Financing Facility (GRIF)’ and ‘Asia Regional Resilience to a changing climate (ARRCC)’. There were also programmes that revised their historical results due to methodological and data quality improvements, leading to a decrease of 567,784 beneficiaries reached in historical results.
Disaggregation of the results by sex has been reported for 83.77% of programmes. Where results are available by sex, there was a split of 48% female beneficiaries compared to 52% male. Most beneficiaries were adults where disaggregation was available. Of the 2.40% of results disaggregated by disability, 2.83% of beneficiaries were recorded as having a disability. Where geographic disaggregation was reported (9.68% of results), 78.47% of beneficiaries were in rural locations, compared to 21.53% in urban locations.

Figure 1: Cumulative annual results achieved for KPI 1 as a result of UK ICF, from April 2011 to March 2023
Table 2: Disaggregated data for KPI 1
| Disaggregation | Total achieved | Number of programmes |
|---|---|---|
| Age | ||
| Child (Age 0-14) | 151,000 | <5 |
| Youth (Age 15-24) | 40,000 | <5 |
| Adult (Age 25-64) | 876,000 | 6 |
| Elder (Age 65+) | 27,000 | <5 |
| Unspecified | 100,493,000 | 128 |
| Disability | ||
| Disabled | 69,000 | 10 |
| Not disabled | 2,371,000 | 10 |
| Unspecified | 99,149,000 | 121 |
| Geography | ||
| Rural | 7,718,000 | 27 |
| Urban | 2,117,000 | 7 |
| Unspecified | 91,753,000 | 108 |
| Sex | ||
| Female | 40,851,000 | 93 |
| Male | 44,252,000 | 92 |
| Unspecified | 16,485,000 | 61 |
KPI 2.1: Number of people with improved access to clean energy
This indicator directly contributes to SDG 7 (affordable and clean energy) and SDG 3 (health and wellbeing), reducing carbon emissions and improving health, since the use of polluting cooking fuels is a major contributor to indoor air pollution.
The types of interventions that contribute to this KPI include the installation of solar technology, green mini-grids for local power supply in rural areas, clean cook stoves that reduce people’s dependence on firewood and supporting improvements in energy efficiency.
A cumulative total of 69,747,000 people were supported with improved access to clean energy from 2011 to 2023, which was an increase of 12,942,000 (22.78%) since 2022 (Figure 2). From the 51 programmes reporting against this KPI, the largest increases in achieved results came from the programmes ‘Transforming Energy Access (TEA)’, ‘Low Energy Inclusive Appliances’ and ‘Second phase of DFID’s Support to the Private Infrastructure Development Group (PIDG)’ As well as the additional results achieved in 2022/2023, a small number of programmes revised their historical results, which saw a decrease in the total reported for previous years by 773,347 beneficiaries.
The results for KPI 2.1 were disaggregated by age, disability, energy type, geography and sex. For the results where sex data were available (55.86% of results), there were 49.09% female and 50.91% male beneficiaries. Less than 1% of beneficiaries were disaggregated by age or disability. Geographic disaggregation covered 3.51% of results, with 28.93% of beneficiaries from urban locations. Of the results where type of clean energy was disaggregated, clean electricity made up 87.12% and clean cooking 12.88%.

Figure 2: Cumulative annual results achieved for KPI 2.1 as a result of UK ICF, from April 2011 to March 2023
Table 3: Disaggregated data for KPI 2.1
| Disaggregation | Total achieved | Number of programmes |
|---|---|---|
| Age | ||
| Youth (Age 15-24) | 11,000 | <5 |
| Adult (Age 25-64) | 106,000 | <5 |
| Unspecified | 69,629,000 | 49 |
| Clean energy | ||
| Clean cooking | 2,400,000 | 6 |
| Clean electricity | 16,236,000 | 18 |
| Unspecified | 51,110,000 | 36 |
| Disability | ||
| Disabled | 9,200 | <5 |
| Not disabled | <20 | <5 |
| Unspecified | 69,738,000 | 51 |
| Geography | ||
| Rural | 709,000 | 9 |
| Urban | 1,741,000 | 7 |
| Unspecified | 67,296,000 | 43 |
| Sex | ||
| Female | 19,124,000 | 24 |
| Male | 19,837,000 | 24 |
| Unspecified | 30,784,000 | 36 |
KPI 2.2: Number of social institutions with improved access to clean energy
KPI 2.2 is similar to KPI 2.1 but focuses on social institutions[footnote 7] that have improved access to clean energy, which thereby provides benefits to the wider community. One of the biggest contributors to this KPI was the ‘Somali Health and Nutrition Programme’.
A total of 271 institutions have been supported with improved energy access between 2011 and 2023, through 9 programmes (Figure 3). There was an increase of 47 (20.98%) institutions supported.

Figure 3: Cumulative annual results achieved for KPI 2.2 as a result of UK ICF, from April 2011 to March 2024
Case study KPI 2: Enabling Development for Girls Education Programme
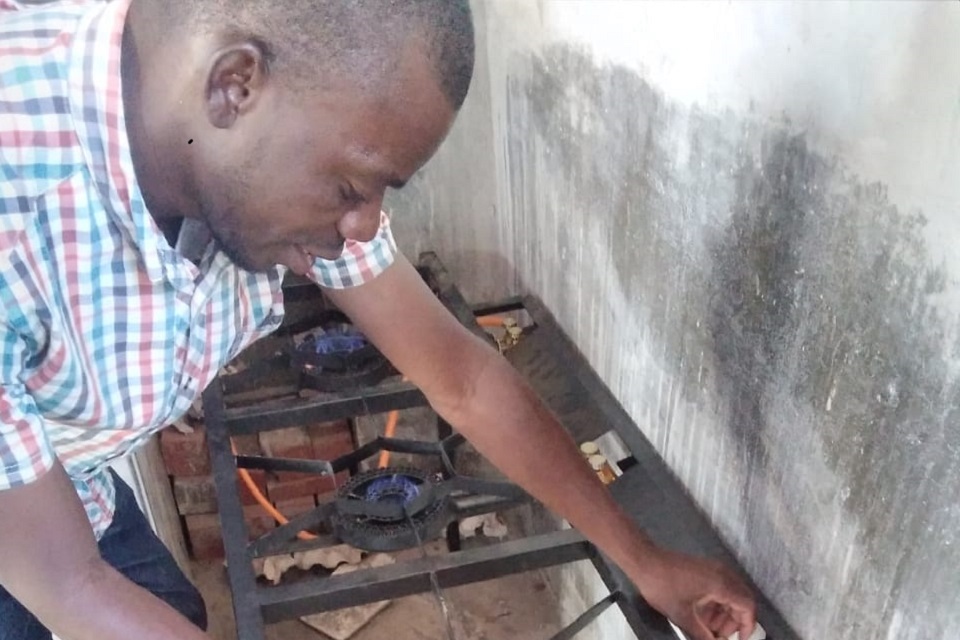
Installation of sustainably produced clean cooking fuel. Credit: Enabling Development for Girls Education Programme case study: Promoting Equality in African Schools (PEAS)
Promoting Equality in African Schools (PEAS) is a not-for-profit organisation, focusing on expanding education opportunities to those that need them the most – including rural communities, low-income families and girls. PEAS has 15 years’ experience building and running low-cost secondary schools in rural areas of Uganda and Zambia and works with local governments to improve the secondary education system.
Through FCDO Zambia EDGE programme, PEAS has piloted several innovative approaches to reduce the environmental impact of building and running schools. One highlight has been the construction of an innovative biodigester latrine at a school in the Northern Province, which uses a digestive process to breakdown human and kitchen waste into cooking gas, which can be used in the school kitchens to reduce the use of non-renewable fuel. The new latrine is now fully operational and has led to significant reductions in the ongoing fuel costs at the school.
KPI 4: Number of people whose resilience has been improved
This indicator tracks the number of people for whom UK ICF interventions have improved their resilience to climate shocks and stresses. Programmes reporting on this indicator support the achievement of SDG target 13.1 on strengthening resilience and adaptive capacity to climate-related hazards. ICF programmes are designed to improve climate resilience according to context-specific climate risks.
Climate resilience can be considered as having 3 dimensions: adaptive capacity, anticipatory capacity, and absorptive capacity. Context-relevant indicators of resilience are defined across at least 2 dimensions of resilience for reporting against KPI 4. Interventions may include: building houses on plinths; preserving water catchments; strengthening flood defences; establishing early-warning systems and social protection. This indicator may overlap with KPI 1, as it can include helping people to adapt to climate change, but for this indicator there needs to be evidence of improved resilience across more than one dimension, supported by data before and after the programme interventions. This makes it more complicated than KPI 1, which reports how many people have been directly reached by our interventions. Improvement on each indicator is demonstrated through repeated beneficiary surveys. These individual indicator results are combined in a predefined way to give a single result of ‘improved’ or ‘not improved’ in relation to each programme participant.
Resilience was improved for a total of 32,254,000 people across 28 ICF programmes from April 2011 to March 2023 (Figure 4). This was an increase of 216,000 (0.67%) from the previous year. The largest increase came from ‘Transforming Access to WASH and Nutrition Services in Mozambique’, reporting against this indicator for the first time. Overall, despite increasing, the cumulative results have plateaued this year due to the completion, and closure, of several programmes that have reported large results in the past.
Disaggregation by sex covered 64.74% of reported results for KPI 4. Where the sex of beneficiaries was known, 41.73% were female and 58.27% were male. Where disability status was known (0.70% of results), 1.13% of beneficiaries had a disability and 98.87% beneficiaries did not have a disability. Around 6.44% of KPI 4 results included geography disaggregation. Where geography was known, there were 99.38% rural beneficiaries and <1% urban beneficiaries.

Figure 4: Cumulative annual results achieved for KPI 4 as a result of UK ICF, from April 2011 to March 2025
Table 4: Disaggregated data for KPI 4
| Disaggregation | Total achieved | Number of programmes |
|---|---|---|
| Disability | ||
| Disabled | 2,500 | <5 |
| Not disabled | 221,000 | <5 |
| Unspecified | 32,029,000 | 28 |
| Geography | ||
| Rural | 2,063,000 | 6 |
| Urban | 12,000 | <5 |
| Unspecified | 30,177,000 | 23 |
| Sex | ||
| Female | 8,713,000 | 21 |
| Male | 12,166,000 | 20 |
| Unspecified | 11,374,000 | 9 |
KPI 6: Tonnes of greenhouse gas emissions reduced or avoided
This indicator estimates the reduction in greenhouse gas emissions as a result of UK ICF interventions, compared with expected emissions in the absence of this support. It is a similar indicator to the new TA KPI 5 indicator which measures the volume of greenhouse gas emissions supported by ICF technical assistance activities. However, there are key differences between these 2 indicators. KPI 6 focuses on capital investment projects where we can directly attribute the emissions reduced or avoided to ICF funding. TA KPI 5 measures the contribution that ICF technical assistance has made to reducing emissions [footnote 8].
UK ICF delivers reductions in emissions of greenhouse gases through programmes that cover all sectors of the economy. Activities that deliver against this KPI include those that replace fossil fuels with renewable energy sources (such as solar, wind or geothermal), promote low carbon alternatives to non-sustainably sourced wood for domestic cooking, and reduce deforestation. This indicator is aligned with SDG indicator 13.2.21 which also measures the net change in annual greenhouse gas emissions.
Benefits can be delivered against KPI 6 even after a programme has closed if emissions continue to be reduced or avoided. For example, solar panels will continue to generate clean energy and reduce greenhouse gas emissions after the end of the programme which funded their installation, for as long as they continue to function. This explains why the expected total lifetime results are much higher than the results achieved so far against this indicator – see Annex 1.
It is estimated that 86,791,000 tonnes of carbon dioxide equivalent were reduced or avoided as a result of ICF programmes since 2011, an increase of 32.15% compared to the cumulative results up to 2022 (Figure 5). Four programmes also reported against this KPI for the first time in 2023, taking the total number of ICF reporting programmes to 56. As seen last year, large increases were reported in ‘REDD Early Movers programme (REM)’ and ‘Support to the multilateral Climate Investment Funds (CIFs)’, however the largest increase was reported by ‘UK-INDIA Partnership on National Investment and Infrastructure Fund – Green Growth Equity Fund’.
Sector breakdowns have been reported by 48% of programmes, which represent 56.01% of the total greenhouse gas emission reductions. Energy supply contributed the largest emissions reduced or avoided with 40.06% of results for which disaggregated data were reported. This was followed by forestry (23.13%), land/sea-use and land/sea-use change (15.48%), transport (15.31%) and industrial processes (3.95%). The remaining sectors (agriculture, business, residential, waste management and water) all recorded smaller amounts of emissions reduction.

Figure 5: Cumulative annual results achieved for KPI 6 as a result of UK ICF, from April 2011 to March 2026
Table 5: Disaggregated data for KPI 6
| Disaggregation | Total achieved | Number of programmes |
|---|---|---|
| Sector | ||
| Agriculture | 27,000 | <5 |
| Business | 12,000 | <5 |
| Energy supply | 19,475,000 | 20 |
| Forestry | 11,242,000 | <5 |
| Industrial processes | 1,921,000 | <5 |
| Land/sea-use and land/sea-use change | 7,526,000 | <5 |
| Residential | 492,000 | <5 |
| Transport | 7,444,000 | 6 |
| Waste management | 469,000 | 6 |
| Water | 16 | <5 |
| Unspecified | 38,179,000 | 45 |
KPI 7: Installed capacity of clean energy
This indicator measures clean energy capacity installed as a result of UK ICF interventions. It tracks both on- and off-grid clean energy sources, such as wind, solar, or geothermal energy; and clean cookstoves. Installed capacity refers to the rated power output when the clean energy source is operational, which is different to energy generated.
Access to energy is a primary constraint to inclusive economic growth and job creation. This supports SDG target 7 to expand infrastructure and technology to supply modern, sustainable energy for all in developing countries. In many cases, the generation of energy from clean sources partially displaces fossil fuel energy generation, resulting in reduced greenhouse gas emissions and thereby also contributing to KPI 6 ‘Net change in greenhouse gas emissions’.
It is estimated that 3,601 megawatts (MW) of clean energy capacity were installed by ICF programmes between 2011 and 2023, an increase of 22.90% on the cumulative installed capacity up to 2022 (Figure 6). A total of 46 programmes have reported against this KPI, 6 programmes more than reported in 2022.
Both the ‘Climate Public Private Partnership Programme (CP3)’ and ‘Global Climate Partnership Fund (GCPF)’ saw a decrease in cumulative achieved results due to methodological improvements and increased data availability. However, this decrease has been offset by lager increases seen in the ‘Support to the multilateral Climate Investment Funds (CIFs)’, ‘British International Investment (BII) Programme of Support in Africa, South Asia, Indo-Pacific & Carib (2015-2027)’ and ‘UK-INDIA Partnership on National Investment and Infrastructure Fund – Green Growth Equity Fund’ programmes.
Installed clean energy capacity results are disaggregated by geography, grid connectivity and technology type. For the 15 programmes that reported against geography (17.87% of reported results), most were reported in urban locations compared to rural (54.42% to 45.58%). 40.72% of the results were disaggregated by type of grid connectivity, with 93.93% of this feeding into a national or regional grid (on-grid). These projects will typically be utility-scale, in the order of tens or hundreds of megawatts. Disaggregation by technology type covers 60.27% of the reported megawatts of clean energy capacity installed. Solar photovoltaic (PV) recorded the majority of these disaggregated results (64.2%), followed by wind and hydropower with 12.82% and 7.77%, respectively. There were smaller results reported for biofuels, biomass, clean cookstoves, concentrated solar power (CSP) and multiple/mixed renewable energy.

Figure 6: Cumulative annual results achieved for KPI 7 as a result of UK ICF, from April 2011 to March 2027
Table 6: Disaggregated data for KPI 7
| Disaggregation | Total achieved | Number of programmes |
|---|---|---|
| Geography | ||
| Rural | 293 | 9 |
| Urban | 350 | 9 |
| Unspecified | 2,900 | 42 |
| On/off grid | ||
| Off-grid | 89 | 15 |
| On-grid | 1,300 | 14 |
| Unspecified | 2,100 | 14 |
| Technology type | ||
| Biofuels | 89 | <5 |
| Biomass | 31 | <5 |
| Clean cookstoves | 51 | <5 |
| Concentrated solar power (CSP) | 75 | <5 |
| Hydropower | 169 | 6 |
| Multiple/mixed renewable energy | 84 | <5 |
| Solar photovoltaic (PV) | 1,300 | 24 |
| Wind power | 278 | 5 |
| Unspecified | 1,400 | 38 |
KPI 8: Ecosystem loss avoided
This indicator measures the difference in area of ecosystem coverage resulting from an ICF project, relative to the counterfactual of what would have happened in the absence of the intervention. Prevention of ecosystem loss contributes to climate change mitigation by reducing greenhouse gas emissions, as well as helping to preserve biodiversity. Methodology updates in February 2023 have broadened the ecosystems that can be measured to allow non-forest areas to be included such as marine, freshwater and grassland (using IUCN biome typologies). Additionally, this indicator also assesses if the condition of the habitat retained has been maintained in a functioning state and not degraded.
Between April 2011 and March 2023, a total of 413,000 hectares of land have avoided ecosystem loss, reported by 15 programmes (Figure 7). Since 2022, there has been a 3.28% increase in area (13,000ha). Improvements to methodologies for the Blue Forests programme and the REDD Early Movers programme resulted in a decrease of historic results by 12,604 hectares overall. However, this decrease in previous results has been counteracted by the Forest Carbon Partnership Facility – Carbon Fund reporting results for the first time and additional results delivered this year, particularly by REDD Early Movers programme.

Figure 7: Cumulative annual results achieved for KPI 8 as a result of UK ICF, from April 2011 to March 2028
KPI 10: Value of ecosystem services generated or protected
Ecosystem services are the many and varied benefits to humans, provided by the natural environment and healthy ecosystems. Ecosystem services can be divided into 4 categories: provisioning services (for example, energy, food, medicine); regulating services (for example, flood protection, climate regulation, pest control); cultural services (for example, education, recreation, spiritual) and supporting services (for example, services that underpin ecosystem functioning such as nutrient and hydrological cycles that support other services). The types of interventions contributing to this indicator include reducing deforestation of mangroves and other forests, promoting sustainable practices within forest habitats and improved resource management. This indicator contributes to the Kunming-Montreal Global Biodiversity Framework target 11 on maintaining or enhancing nature’s contribution to people, including ecosystem services. KPI 10 also provides evidence of support across multiple Sustainable Development Goals (SDGs) that rely on ecosystem services, including food (SDG 2), water (SDG 6), health (SDG 3), and biodiversity (SDGs 14 and 15).
From April 2011 to March 2023, £5,302,000 worth of ecosystems services have been generated or protected as a result of ICF interventions (Figure 8). Only 3 programmes have reported results for KPI 10 and no new programmes reported this year. The programmes are ‘Reducing deforestation and Forest Fires in the Brazilian Cerrado’, ‘Blue Forest Initiative’ and ‘Accountability in Tanzania Programme – Phase II’.
The low level of reporting seen for this indicator is partly because the methodology is based on area reported under KPI 8 – historically restricting this indicator to programmes on reporting ecosystem services provided by forests. As with KPI 8, methodology updates in February 2023 have broadened the ecosystems that can be measured to allow non-forest areas to be included such as marine, freshwater and grassland (using IUCN biome typologies). The addition of more up-to-date data sources within the KPI 10 methodology for ecosystem service valuation should support more accurate valuations of services. Additionally, more detailed disaggregation is now suggested for reporting such as the ecosystem type and the ecosystem services it provides. These updates were published too close to this year’s results collection to expect an increase in the number of programmes reporting this year but should capture more of the ecosystem services supported by ICF in future publications.

Figure 8: Cumulative annual results achieved for KPI 10 as a result of UK ICF, from April 2011 to March 2029
Case study KPI 10: Blue Forests - sustainable mangrove management and loss avoided
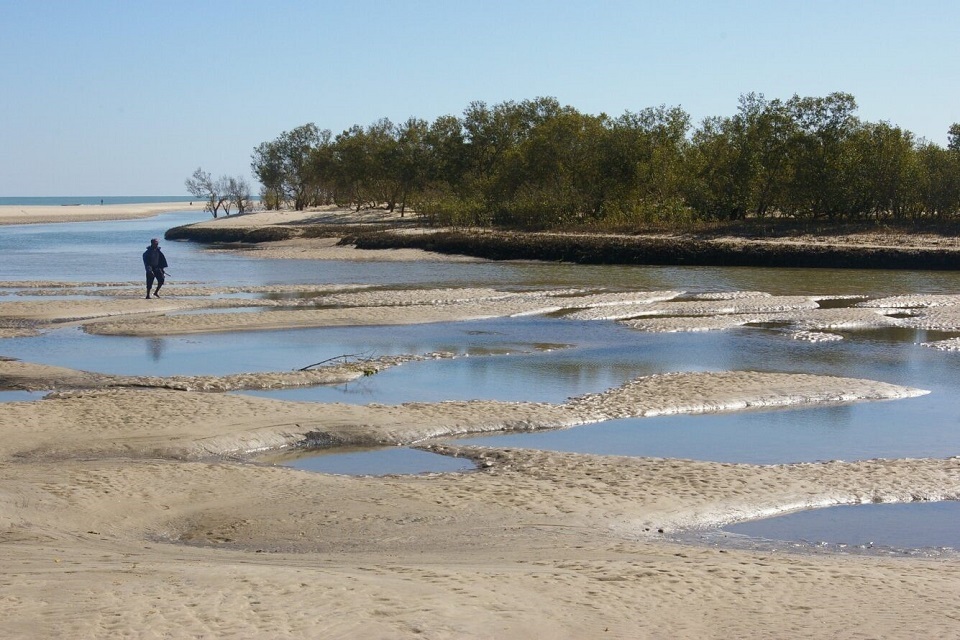
Mangrove regeneration in South-west Madagascar. Credit: Dr Estelle Jones
Starting life as a Darwin Initiative grant project, Blue Forests was scaled up in 2016. Blue Forests implements models for the sustainable management of mangrove habitats across Madagascar and Indonesia. Mangrove habitats are vital for local communities and coastal livelihoods. They provide important sources of income (for example, carbon credits, honey production, and shrimp farming), provide adaptation and resilience services (for example, natural defences against floods and coastal erosion) and are integral to the protection of endangered marine biodiversity.
The programme tackles drivers of mangrove deforestation by working directly with local communities, the private sector, and national governments to establish tenure rights and community-led fisheries and forestry management. It also aims to improve livelihoods by working to create opportunities for equitable access to microfinance and markets.
KPI 11: Volume of public finance mobilised for climate change purposes
Delivering the UK’s global climate change objectives requires substantial amounts of finance from non-UK sources. This indicator estimates the amount of money from non-UK government public sources that has been mobilised for climate change as a result of UK ICF interventions.
Mobilised finance measured under this indicator is from public sources including partner country governments, UN agencies and multilateral or regional development banks. To be counted against this indicator, the mobilised funds must either be additional funds, or existing funds diverted from a more fossil-fuel-intensive use.
A total of £6,984,840,000 is estimated to have been mobilised since 2011, an increase of 21.20% compared to 2022 (Figure 9). Results for this KPI have been reported by 74 programmes since 2011. The largest increases in achieved results were seen in the programmes ‘Global Environment Facility 7th replenishment’, ‘Transforming Energy Access (TEA)’ and ‘Market Accelerator for Green Construction (MAGC)’.
The largest volumes of public finance mobilised were sourced from other donors and from developing countries (those which are ODA eligible), with 46.79% and 38.01% of known finance origins, respectively. Of the programmes that reported public finance disaggregated by mitigation or adaptation theme (55%), 85.54%of finance was reported against the mitigation theme.

Figure 9: Cumulative annual results achieved for KPI 11 as a result of UK ICF, from April 2011 to March 2030
Table 7: Disaggregated data for KPI 11
| Disaggregation | Total achieved | Number of programmes |
|---|---|---|
| Climate theme | ||
| Adaptation | 664,740,000 | 18 |
| Mitigation | 3,930,833,000 | 27 |
| Unspecified | 2,389,266,000 | 47 |
| Origin of public finance mobilised | ||
| Developing country finance | 740,613,000 | 14 |
| Donor finance | 911,782,000 | 12 |
| Multilateral finance | 296,145,000 | 6 |
| Unspecified | 5,036,300,000 | 64 |
Information: KPI 11 and 12 climate theme disaggregation
The UK is committed to a balanced split between mitigation and adaptation programmes through its climate finance. Disaggregation by Climate Theme represents the theme where additional finance has been mobilised and is not representative of ICF spending.
KPI 12: Volume of private finance mobilised for climate change purposes
This indicator tracks the amount of private finance mobilised for climate change purposes as a result of UK ICF interventions.
Mobilised finance measured under this indicator is from non-public sources such as banks (excluding multilateral or regional development banks), private companies, pension funds, non-governmental organisations, Clean Development Mechanism (CDM) financing[footnote 9], voluntary carbon credit market, insurance companies, private savings, family money, entrepreneurs’ own capital and sovereign wealth funds. It includes all types of finance such as equity, debt and guarantees. This indicator helps measure the UK’s contribution to the commitment made by developed countries to mobilise $100 billion of public and private finance per year to help developing countries respond to climate change, as set out in SDG target 13.a.
It is estimated that £6,884,443,000 of private finance has been mobilised up to 2023, an increase of 24.88% when compared with the cumulative results up to 2022 (Figure 10). Eleven additional programmes reported against this KPI for the first time this year bringing the total to 74 reporting programmes. Large increases against this KPI were seen in ‘British International Investment (BII) Programme of Support in Africa, South Asia, Indo-Pacific & Carib (2015-2027)’, ‘Global Environment Facility 7th replenishment’ and ‘Sustainable Infrastructure Programme – Latin America (SIP LA)’.
Of the results that reported the disaggregation for origins of private finance mobilised (72.64% of results), 86.26% of results were from multiple origins. Simple co-financing arrangements were the most frequently used by the programmes which reported the finance leveraging mechanism (57.88%). These arrangements refer to various business partnerships, business surveys, matching programmes and similar, but also result-based approaches to leveraging finance.

Figure 10: Cumulative annual results achieved for KPI 12 as a result of UK ICF, from April 2011 to March 2031
Table 8: Disaggregated data for KPI 12
| Disaggregation | Total achieved | Number of programmes |
|---|---|---|
| Climate theme | ||
| Adaptation | 551,497,000 | 18 |
| Mitigation | 4,601,938,000 | 39 |
| Unspecified | 1,731,007,000 | 41 |
| Leveraging mechanism and role position | ||
| Common share In flat collective investment vehicle | 296,213,000 | <5 |
| Credit Lines | 234,846,000 | 6 |
| Direct investment In companies/SPVs, equity | 755,815,000 | 9 |
| Project finance | 252,229,000 | 7 |
| Shares in the riskiest tranche of structured collective investment vehicle | 33,506,000 | <5 |
| Simple co-financing arrangements | 2,163,577,000 | 40 |
| Syndicated loan, arranger | 1,001,000 | <5 |
| Syndicated loan, participant | 1,084,000 | <5 |
| Unspecified | 3,146,168,000 | 36 |
| Origin Of private finance mobilised | ||
| Multiple origins | 4,314,103,000 | 55 |
| Provider country | 3,868,000 | <5 |
| Recipient country | 412,384,000 | 13 |
| Third high-income/OECD country | 270,717,000 | 5 |
| Unspecified | 1,883,369,000 | 27 |
KPI 15: Extent to which ICF intervention is likely to lead to transformational change
For KPI 15, programmes score their likelihood of leading to transformational change on a scale from 1 to 5. For this reason, the results cannot be reported cumulatively. Instead, we present the distribution of scores across all reporting programmes.
During the 2023 update of ICF KPI methodological notes, the scoring was updated to 1 to 5 (from previously reported 0 to 4) and qualitative descriptions for each score were improved to make it easier to distinguish between different scores on the scale. Descriptions cannot be directly mapped between the different scoring approaches, and programmes need to individually assess their evidence against the new scale. Guidance on converting scores to the new scale are provided in table 4 of the KPI 15 Methodology Note. Due to the change in scoring approach this year, data are presented for 2022/2023 only, with the time series of previous scores presented in Annex 2.
In total, 106 programmes have reported on KPI 15, with 55 reporting this year using the new scale.

Figure 11: Annual results achieved for KPI 15 from April 2011 to March 2023. This shows the proportion of programmes achieving each score per year on the y axis, and the total number of programmes reporting this KPI is annotated above the bars for context.
Table 9: New scores and definitions for KPI15
| Score | Description |
|---|---|
| 1 | Substantial evidence transformational change is unlikely or will not occur |
| 2 | Partial evidence transformational change is unlikely |
| 3 | Not enough evidence yet to assess, or the balance of evidence is inconclusive |
| 4 | Partial evidence transformational change is likely |
| 5 | Substantial evidence transformational change is likely or already occurring |
KPI 17: Area under sustainable management practices
Ecosystem degradation is a major driver of biodiversity loss and carbon emissions, which both exacerbates, and is exacerbated by, climate change. It reduces the benefits that people derive from the natural environment, including contributions to their livelihoods, health and wellbeing. By working to manage ecosystems sustainably, we can mitigate the impacts of climate change, protect ecosystem services and biodiversity, while also making them more resilient to future climate shocks.
What constitutes sustainable management is context specific and will vary geographically, as well as depending on the dominant ecosystem and its use in the region. Sustainable management may include, but is not limited to, vegetation management, aquaculture, habitat protection or restoration. These interventions support the achievement of SDG target 12.2 on sustainable management and effective use of natural resources, and SDG 14.2 and 15.1 on sustainable use and restoration of land and sea ecosystems. This indicator also contributes towards the Kunming-Montreal Global Biodiversity Framework target 10 for ensuring ecosystem use is managed sustainably.
A total of 2,700,000 hectares have received sustainable management practices through ICF from April 2011 to March 2023, reported by 16 programmes. This was an increase of 584,000 hectares (27.63%) from the previous year (Figure 12) with 5 new programmes reporting against this indicator. The programmes that contributed the largest increases in results for this KPI in the last year were ‘Forest Carbon Partnership Facility (FCPF -C) - Carbon Fund’, the ‘Adaptation for Smallholder Agricultural Programme (ASAP)’ and ‘REDD Early Movers programme (REM)’. There were also some programmes that revised their historical results as a result of improvements to methodologies and data quality, leading to an increase of 1,210,000 hectares in historical results.
Updates to this indicator’s methodology in February 2023 have broadened the practices that can be included, allowing for non-forest environments such as marine, freshwater and agricultural. Additionally, more disaggregated data has been requested from programmes on management theme (management, restoration, or protection), the sustainable practice implemented, and ecosystem type.
Disaggregation of the results by sustainable management theme was reported by 37% of programmes (80.54% management, 19.45% protection and less than 1% management restoration, where theme disaggregation was available).
The ecosystem type being managed has been reported for 7.62% of results. Where disaggregated results are available, the ecosystem types being managed are intensive land-use (99.29%), anthropogenic marine (less than 1%) and tropical-subtropical forests (less than 1%).
Around a third of programmes reported results disaggregated by management practice (0.22% of results), with the most common practices being vegetation management (87.96%), aquaculture (8.67%) and forest management (3.37%).
Disaggregation by the country the sustainable practice is taking place, was reported for 9.46% of results and showed 16 countries having benefited from sustainable management practices as a result of UK ICF support.

Figure 12: Cumulative annual results achieved for KPI 17 as a result of UK ICF, from April 2011 to March 2032
Table 10: Disaggregated data for KPI 17
| Disaggregation | Total achieved | Number of programmes |
|---|---|---|
| Country | ||
| Bolivia | 302 | <5 |
| Brazil | 162,000 | <5 |
| Burkina Faso | 97,000 | <5 |
| Cambodia | 11,000 | <5 |
| Colombia | 49,000 | <5 |
| Côte D’Ivoire | 745 | <5 |
| Democratic Republic Of The Congo | 30,000 | <5 |
| Ghana | 28,000 | <5 |
| Indonesia | 6,500 | <5 |
| Laos | 688,000 | <5 |
| Mexico | 376,000 | <5 |
| Mozambique | 4,800 | <5 |
| Niger | 7,900 | <5 |
| Saint Lucia | 12 | <5 |
| Tajikistan | 8,100 | <5 |
| Zambia | 11,000 | <5 |
| Unspecified | 1,214,000 | 9 |
| Ecosystem Type | ||
| Anthropogenic Marine | 513 | <5 |
| Intensive Land-Use | 204,000 | <5 |
| Tropical-Subtropical Forests | 939 | <5 |
| Unspecified | 2,494,000 | <5 |
| Sustainable Management Practice | ||
| Aquaculture | 513 | <5 |
| Forest Management | 200 | <5 |
| Vegetation Management | 5,200 | <5 |
| Unspecified | 2,694,000 | 7 |
| Sustainable Management Theme | ||
| Management | 205,000 | 5 |
| Protection | 49,000 | <5 |
| Restoration | 10 | <5 |
| Unspecified | 2,444,000 | 8 |
ICF Technical Assistance key performance indicator results
Technical Assistance Key Performance Indicators (TA KPIs) are being published for the first time this year, following an internal pilot of the methodologies. These cover technical assistance (TA) activities which are a form of non-financial development assistance provided by specialists, and can include:
- capacity building – for example, supporting individuals in gaining knowledge or capacity through training, workshops, conferences
- policy support and evidence – for example, sharing information and advice through knowledge products, support for project planning or policy development, or providing data or climate information
- project and investment support – for example, providing assistance to develop projects more effectively, expert guidance, supporting collaboration between public and private actors
Most monitoring and reporting approaches currently, implicitly or explicitly, assume capital spending, and so are not well suited for tracking the activities and performance of programmes solely delivering TA. Additionally, ICF TA is often provided alongside other support such as capital investment from UK Government or another development partner, TA support from other organisations, and national government financial and technical contributions. This makes it more challenging or even impossible to isolate results that are specifically attributable to ICF TA support. We have, therefore, developed a series of TA indicators to support the measurement of ICF TA’s contributions to results[footnote 10].
TA KPI 1: Number of countries supported by ICF technical assistance
The ICF TA KPI 1 indicator seeks to provide a high-level assessment of the breadth of coverage of ICF TA support for climate action by measuring the number of countries that have received TA support from ICF. ICF supports ODA eligible countries, and this list is revised every 3 years. Results are reported cumulatively; therefore, the list of countries represent those which have received a form of technical assistance support since 2011 but not necessarily in the latest year. Some countries are no longer eligible for ICF TA support but appear in the list because they were eligible in previous years.
A total of 36 programmes delivered TA across 125 countries.

Figure 13: Countries support with technical assistance reported by ICF TA KPI 1. Darker shades are countries that have been supported
Table 11: Countries supported by ICF Technical Assistance
| Countries supported by ICF Technical Assistance |
|---|
| Afghanistan, Albania, Algeria, Angola, Antigua And Barbuda, Argentina, Armenia, Azerbaijan, Bangladesh, Belize, Benin, Bhutan, Bolivia, Bosnia And Herzegovina, Botswana, Brazil, Bulgaria, Burkina Faso, Cabo Verde, Cambodia, Cameroon, Central African Republic, Chad, Chile, China, Colombia, Costa Rica, Côte D’ivoire, Democratic Republic Of The Congo, Dominica, Dominican Republic, Ecuador, Egypt, El Salvador, Equatorial Guinea, Eswatini, Ethiopia, Fiji, Gabon, Georgia, Ghana, Grenada, Guatemala, Guinea, GuineaBissau, Guyana, Haiti, Honduras, India, Indonesia, Iraq, Jamaica, Jordan, Kazakhstan, Kenya, Kosovo, Kyrgyzstan, Laos, Lebanon, Liberia, Madagascar, Malawi, Malaysia, Maldives, Mali, Marshall Islands, Mauritania, Mauritius, Mexico, Moldova, Mongolia, Montenegro, Montserrat, Morocco, Mozambique, Myanmar, Namibia, Nauru, Nepal, Nicaragua, Niger, Nigeria, North Macedonia, Pakistan, Panama, Papua New Guinea, Paraguay, Peru, Philippines, Republic Of The Congo, Russia, Rwanda, Saint Kitts And Nevis,Saint Lucia, Saint Vincent And The Grenadines, Samoa, Sao Tome And Principe, Senegal, Serbia, Seychelles, Sierra Leone, Somalia, South Africa, Sri Lanka, Sudan, Suriname, Tajikistan, Tanzania, Thailand, The Bahamas, The Gambia,Togo, Tonga, Trinidad And Tobago, Tunisia, Turkey, Uganda, Ukraine, Uruguay, Uzbekistan, Vanuatu, Vietnam, Yemen, Zambia, Zimbabwe |
TA KPI 2.1: Number of individuals supported by ICF Technical Assistance
This indicator estimates the number of individuals that have been supported by technical assistance from ICF.
Up to March 2023, 414,000 individuals were supported through 27 ICF programmes delivering technical assistance. ‘Climate Smart Development for Nepal’ delivered the largest contribution to these results.
This TA KPI is disaggregated by sector and type of technical assistance. Of results that were disaggregated by type of technical assistance (87.76%), project and investment support (66.73%) and capacity building (33.27%) were the main focus with a few results reported in policy support and evidence. Sector disaggregation was provided for 62.24% of results where the sectors with the largest results were agriculture and energy supply (68.28% and 30.03%).
Table 12: Disaggregated data for TA KPI 2.1
| Disaggregation | Total Achieved | Number of Programmes |
|---|---|---|
| Sector | ||
| Agriculture | 175,000 | <5 |
| Business | <20 | <5 |
| Energy supply | 77,000 | 6 |
| Industrial processes | 152 | <5 |
| Public | 481 | <5 |
| Transport | 212 | <5 |
| Waste management | 3,100 | <5 |
| Water | 331 | <5 |
| Unspecified | 156,000 | 19 |
| Type of technical assistance | ||
| Capacity building | 120,000 | 11 |
| Policy support and evidence | <20 | <5 |
| Project and investment support | 242,000 | 5 |
| Unspecified | 50,000 | 14 |
TA KPI 2.2: Number of organisations supported by ICF Technical Assistance
This indicator estimates the number of organisations supported by technical assistance from ICF.
Up to March 2023, a total of 1,450 organisations were supported through 26 different programmes. The ‘Clean Energy Innovation Facility (CEIF)’ contributed the most to this result.
This TA KPI is disaggregated by sector and type of technical assistance. Sector disaggregation was available for 33.86% of results. The sectors supported were diverse and varied with 28.11% of organisations supported in the public sector, 17.72% agriculture, 13.85% in transport, 12.42% in business and 12.63% in energy supply. Other sectors supported included forestry, industrial processes, waste water management, and water. 38.97% of results were disaggregated by type of technical assistance, with 78.23% of these results towards capacity building, 18.41% project and investment support, and 3.36% policy support and evidence.
Table 13: Disaggregated data for TA KPI 2.2
| Disaggregation | Total achieved | Number of programmes |
|---|---|---|
| Sector | ||
| Agriculture | 87 | <5 |
| Business | 61 | <5 |
| Energy Supply | 62 | 7 |
| Forestry | 1 | <5 |
| Industrial Processes | 36 | <5 |
| Public | 138 | <5 |
| Transport | 68 | <5 |
| Waste management | 38 | <5 |
| Unspecified | 959 | 26 |
| Type of technical assistance | ||
| Capacity building | 442 | 7 |
| Policy support and evidence | 19 | 6 |
| Project and investment support | 104 | 7 |
| Unspecified | 885 | 21 |
TA KPI 3: Number of climate policies informed by ICF Technical Assistance
This TA KPI indicator counts the number of public sector climate policies informed by ICF technical assistance programming. This indicator accounts for all forms of TA delivered, ranging from training workshops to knowledge products to feasibility studies.
Up to March 2023, a total of 98 climate policies were informed by ICF TA. The ‘Mitigation Action Facility (MAF)’ programme had the largest contribution to these results (see the MAF Case Study for further detail).
TA KPI 3 can be disaggregated by Sector and Type of Technical Assistance. 54.08% of the results were disaggregated by sector, with 62.26% categorised as energy supply, 16.98% as transport, and less than 10% for each of agriculture, land/sea-use and land/sea-use change, waste management and public. 37.76% of the results were disaggregated by type of technical assistance, with 21.62% of results focussed toward project and investment support, and 78.38% policy support and evidence.
Table 14: Disaggregated data for TA KPI 3
| Disaggregation | Total achieved | Number of programmes |
|---|---|---|
| Sector | ||
| Agriculture | 3 | <5 |
| Energy supply | 33 | <5 |
| Public | 5 | <5 |
| Transport | 9 | <5 |
| Waste management | 3 | <5 |
| Unspecified | 45 | 7 |
| Type of technical assistance | ||
| Policy support and evidence | 29 | 5 |
| Project and investment support | 8 | <5 |
| Unspecified | 61 | 9 |
TA KPI 5: Volume of emissions reductions avoided/supported by International Climate Finance technical assistance
ICF TA KPI 5 aims to provide a measure of the results of UK ICF technical assistance programming in supporting reductions in GHG emissions or avoided GHG emissions among countries, investments, or projects. As it is challenging to attribute particular outcomes to TA support specifically, this indicator does not attempt to determine a specific volume of emissions reductions that ICF TA has causally influenced or that can be directly attributed to ICF investments. Instead, it measures the contribution of ICF TA to emissions abatement: the total volume of emissions reduced or avoided that have been supported by ICF TA. Therefore, this is a broader measure than KPI 6, which measures the volume of emissions reductions that can be directly attributable to ICF (which is not possible to identify in many cases of TA provision). Technical assistance and capital investment programmes may report on both these indicators, so some emissions may be reported under one indicator and others may be reported under both.
Up to March 2023, ICF TA from 6 programmes supported the reduction/avoidance of a total of 35,001,000 tonnes of CO2 (tCO2e) emissions. The ‘Partnerships for Forests (P4F)’ programme had the largest contribution to these results.
TA KPI 5 can be disaggregated by sector and type of technical Assistance. 29.02% of results were disaggregated by sector, with 66.93% categorised as waste management and 18.77% as energy supply. 36.63% of results were disaggregated by type of technical assistance, with the vast majority (99.24%) of results focused on capacity building.
Table 15: Disaggregated data for TA KPI 5
| Disaggregation | Total achieved | Number of programmes |
|---|---|---|
| Sector | ||
| Agriculture | 942,000 | <5 |
| Business | 95 | <5 |
| Energy supply | 1,906,000 | <5 |
| Industrial processes | 167,000 | <5 |
| Residential | 341,000 | <5 |
| Transport | 24 | <5 |
| Waste management | 6,799,000 | <5 |
| Unspecified | 24,843,000 | <5 |
| Type of technical assistance | ||
| Capacity building | 12,724,000 | <5 |
| Project and investment support | 97,000 | <5 |
| Unspecified | 22,180,000 | <5 |
Case study TA KPIs: Mitigation Action Facility
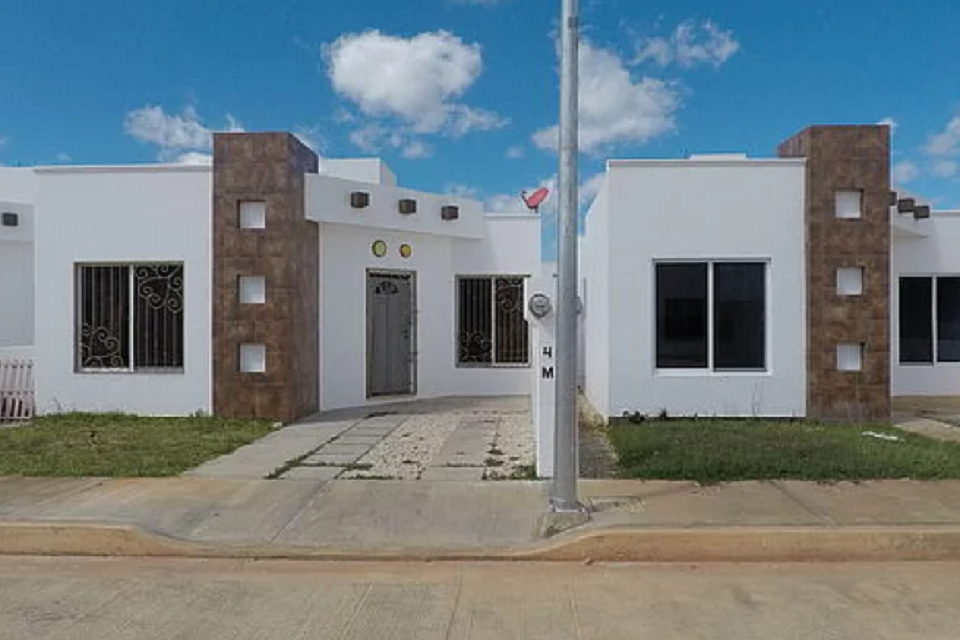
Energy efficient homes in Mexico. Credit: Mitigation Action Facility case study (KFW)
The Mitigation Action Facility programme supports mitigation by providing funding to the most transformational parts of Nationally Appropriate Mitigation Actions plans. NAMAs are concrete projects, policies, or programmes that shift a technology or sector in a country onto a low-carbon development trajectory. One supported project – Mexican New Housing – based on the whole-house approach focusing on the total energy performance of a building. The overarching goal of the project was to implement mitigation measures which promotes cost-effective energy-efficient building concepts across the housing sector, with a particular focus on low-income housing. The project contributed to the implementation of the mitigation measures in 2 ways: Firstly, it promoted the penetration of basic efficiency standards in the entire new housing market in Mexico by means of technical assistance to large public housing financiers and housing developers and financial incentives for small and medium sized developers and financial intermediaries. Secondly, it promoted the upgrading of energy efficiency standards to more ambitious levels.
Corrections
If an error in any of these results is discovered after publication, a proportionate response will be made depending on whether the incorrect value would lead to a materially different conclusion. If it would, FCDO will issue an ‘unscheduled revision’ as soon as possible after the error is discovered. Errors which are smaller in magnitude will be corrected in the next annual update.
If you have an idea to improve this publication, please get in touch at statistics@fcdo.gov.uk.
Appendix
Annex 1: ICF expected total programme benefits
Expected total programme benefits include all past and future benefits from current or previous ICF programmes. Benefits include those expected to be delivered after a programme has closed. This is common in climate change mitigation programmes, where, for example, a clean energy technology has been installed that will continue to deliver emissions reductions during the technology’s lifetime. Adjustments are made to reflect risks such as the technology breaking down.
Both KPI 15 and TA KPI 1 do not report expected total programme benefits. For KPI 15, this is because scores are provided at a programme level meaning results cannot be aggregated. For TA KPI 1, some programmes will determine the specific countries they will deliver to later in the programme’s lifetime. Since we only count each country once, we do not report expected results due to the risk of double counting.
How to use expected results
Expected results can be used to estimate the longer-term achievements of UK ICF by taking account of projected future benefits. At the planning stage of a programme, expected results are modelled based on assumptions about the context and the effectiveness of interventions. These estimates are revised during implementation and may go up or down as better data become available. As programme monitoring finishes at programme closure, counting the total programme benefits allows a more comprehensive assessment of the overall achievements of ICF.
Table 16: Expected total programme benefits
| KPI number | KPI title | Expected total programme benefits |
|---|---|---|
| ICF KPI 1 | Number of people supported to better adapt to the effects of climate change as a result of ICF | 250,228,000 people |
| ICF KPI 2.1 | Number of people with improved access to clean energy as a result of ICF | 143,273,000 people |
| ICF KPI 2.2 | Number of social institutions with improved access to clean energy as a result of ICF | 529 institutions |
| ICF KPI 4 | Number of people whose resilience has been improved as a result of ICF | 54,239,000 people |
| ICF KPI 6 | Tonnes of greenhouse gas emissions reduced or avoided as a result of ICF | 1,165,028,000 tonnes of CO2 (tCO2e) |
| ICF KPI 7 | Installed capacity of clean energy as a result of ICF | 8,869 megawatts (MW) |
| ICF KPI 8 | Ecosystem loss avoided as a result of ICF | 42,176,000 hectares |
| ICF KPI 10 | Value of ecosystem services generated or protected as a result of ICF | 636,755,000 GBP (£) |
| ICF KPI 11 | Volume of public finance mobilised for climate change purposes as a result of ICF | 14,103,908,000 GBP (£) |
| ICF KPI 12 | Volume of private finance mobilised for climate change purposes as a result of ICF | 14,376,265,000 GBP (£) |
| ICF KPI 15 | Extent to which ICF intervention is likely to lead to transformational change | Not applicable |
| ICF KPI 17 | Area under sustainable management practices as a result of ICF | 22,311,000 hectares |
| ICF TA KPI 1 | Number of countries supported by ICF Technical Assistance | Not applicable |
| ICF TA KPI 2.1 | Number of individuals supported by ICF Technical Assistance | 599,000 people |
| ICF TA KPI 2.2 | Number of organisations supported by ICF Technical Assistance | 1,667 organisations |
| ICF TA KPI 3 | Number of climate policies informed by ICF Technical Assistance | 146 policies |
| ICF TA KPI 5 | Tonnes of greenhouse gas emissions reduced or avoided through ICF Technical Assistance | 244,544,000 Tonnes of CO2 (tCO2e) |
Note: Data presented in table 16 were revised on 6 October 2023. Details can be found in the revisions log (ODT, 9 KB).
Annex 2: ICF KPI 15 historical results
Figure 14 shows results for KPI 15 up to 2021/2022, after which the scoring system was changed (see section KPI 15 for an outline of the new scale). The number of programmes reporting KPI 15 in each year of the time series has changed compared to the number reported last year, due to methodological and data revisions. The number of programmes reported in 2015 has been amended to 26 (from 27) due to an error in last years’ time series. We have also changed the way we treat the 4 sub funds under the ‘Climate Investment Funds’ to align with other ICF programmes – previously they were counted as separate programmes, whereas now we count them as a single programme. There have also been changes to the time series for 2021 and 2022, where programmes have reported historical data for KPI 15 in this year’s collection for those previous years. Those new programmes reported scores for 2021 and 2022 using the old scale to maintain the integrity of the time series.

Figure 14: ICF KPI 15 results up to 2021/2022 using the previous scoring approach
Annex 3: List of programmes that have contributed to the ICF results
This includes all programmes that have reported ICF results, including programmes that have since closed. These programmes range from fully ICF funded to those that only include a small ICF component. Further details of programmes can be found on DevTracker by searching the programme ID.
Table 17: All programmes that have ever reported ICF results between 2011 and 2023
| Programme ID | Programme Title |
|---|---|
| PRPIND001007 | Accelerating Smart Power and Renewable Energy in India (ASPIRE) |
| PRPIND001005 | UK – Niti Aayog Electric Mobility Accelerator Programme |
| PRPIND001004 | Voluntary Contribution to support IEA activities in India within Clean Energy Transitions Programme |
| PRPIND001002 | Exploring Policy and Institutional arrangements for advancing City – Decarbonisation |
| GB-GOV-52-CSSF-06-000023 | Conflict, Stability and Security Fund (CSSF) Middle East Peace Process |
| GB-GOV-50-PF-13B-INJRE | Indonesia Renewable Energy Programme (MENTARI) |
| DefraPO023 | Global Fund for Coral Reefs (GFCR) |
| DefraPO022 | Ocean Risk and Resilience Action Alliance (ORRAA) |
| DefraPO021 | Ocean Country Partnership Programme (OCPP) |
| DefraPO020 | Global Plastic Action Partnerships (GPAP) |
| DefraPO018 | Cities4Forests |
| DefraPO013 | Low Carbon Agriculture and Avoided Deforestation in Brazil – Phase 2 (Rural Sustentavel Phase 2) |
| DefraPO012 | Low Carbon Agriculture and Avoided Deforestation in Brazil – Phase 1 (Rural Sustentavel Phase 1) |
| DefraPO009 | Land Degradation Neutrality Fund |
| DefraPO005 | BIOFIN |
| DefraPO004 | Sustainable cold chain solutions (F-gases) |
| DefraPO003 | The eco.business Fund |
| DefraPO002 | Reducing Deforestation and Forest Fires in the Brazilian Cerrado |
| DefraPO001 | Blue Forests Initiative |
| 025-Ci-Dev | Carbon Initiative for Development (Ci-Dev) |
| 009-GETFiT | Global Energy Transfer Feed-in Tariff (GETFiT) |
| 0040-MFF | Mobilising Finance for Forests (MFF) |
| 0038-PMI | Partnerships for Market Implementation (PMI) |
| 0037-CEIF | Clean Energy Innovation Facility (CEIF) |
| 0036-CFA | Climate Finance Accelerator (CFA) |
| 0034-CASA | Capacity Building for International Negotiations (CASA) |
| 0033-ESMAP | Energy Sector Management Assistance Programme (ESMAP) |
| 0032-MAGC | Market Accelerator for Green Construction (MAGC) |
| 0029-KEEP | Knowledge, Evidence and Engagement Portfolio (KEEP) |
| 0028-C | 2050 Calculator |
| 0027-TCAF | Transformational Carbon Asset Fund (TCAF) |
| 0026-PMR | Partnership for Market Readiness (PMR) |
| 0023-FSP | Fiji Support Programme |
| 0022-CBIT | Capacity Building for Transparency Initiative (CBIT) |
| 0020-SPS | Silvopastoral Systems (SPS) |
| 0019-REM | REDD Early Movers programme (REM) |
| 0017-FCPF-C | Forest Carbon Partnership Facility (FCPF -C) – Carbon Fund |
| 0016-ISFL | BioCarbon Fund Initiative for Sustainable Forested Landscapes (ISFL) |
| 0015-UKCI | UK Climate Investments (UKCI) |
| 0012-TGIL | The Global Innovation Lab |
| 0011-GCPF | Global Climate Partnership Fund (GCPF) |
| 0008-NDCP | NDC Partnership (NDCP) |
| 0007-MAF | Mitigation Action Facility (MAF) |
| 0006-CETP | Clean Energy Transition Programme (CETP) |
| 0003-CLIC | Climate Leadership In Cities (CLIC) |
| 0002-CEFTA | Clean Energy Fund Technical Assistance Programme (CEF TA) |
| 0001-CCUS | International Carbon Capture, Usage and Storage (CCUS) |
| 301583 | Humanitarian Response Pakistan – 2022 Floods |
| 301517 | Renewable Energy Performance Platform (REPP) |
| 301516 | Sustainable Infrastructure Programme – Latin America (SIP LA) |
| 301502 | Territorios Forestales Sostenibles (TEFOS) |
| 301499 | Urban Climate Action Programme |
| 301495 | UK Partnering for Accelerating Climate Transitions (UK PACT) |
| 301474 | Ethiopia Crises 2 Resilience (EC2R) |
| 301253 | COVID-19 Green Response and Recovery Support |
| 301240 | Enabling Development for Girls Education |
| 301217 | Adaptation Adviser Secondment to the Green Climate Fund (Africa) |
| 301183 | Livelihoods and Food Security Fund |
| 301160 | Small Island Developing States Development and Resilience Programme (SIDAR) |
| 301142 | Pioneering a Holistic approach to Energy and Nature-based Options in MENA for Long-term stability – PHENOMENAL |
| 301013 | Resilient Water Sanitation and Hygiene (WASH) and Emergency Preparedness Programme (RWEPP) |
| 300978 | Humanitarian Assistance and Resilience Building in Somalia (HARBS) |
| 300921 | Mobilising Institutional Capital Through Listed Product Structures |
| 300889 | Global Water Leadership in a Changing Climate |
| 300886 | Building Resilience in the Sahel through Adaptive Social Protection- Phase II |
| 300857 | Better Lives for Somali Women and Children |
| 300856 | Green Climate Fund First Replenishment |
| 300751 | Global Risk Financing Facility (GRIF) |
| 300725 | Transforming Access to WASH and Nutrition Services in Mozambique |
| 300724 | Water Resource Accountability in Pakistan (WRAP) |
| 300708 | The Evidence Fund |
| 300705 | Delivering ambition of the United Nations Secretary General’s Climate Summit 2019 to build resilience to climate change |
| 300702 | Accelerating Ethiopia’s Economic Transformation |
| 300686 | Support for the Climate Resilience Execution Agency of Dominica |
| 300683 | Strengthening Ethiopia’s Adaptive Safety Net (SEASN) |
| 300679 | FAO Core contribution new biennium 2022-2326 |
| 300678 | Core Contribution 2020 – 2021 Food and Agriculture Organisation |
| 300675 | Low Carbon Development Initiative 2 (LCDI 2) Programme |
| 300667 | Supporting Economic Empowerment and Development in the Occupied Palestinian Territories (SEED OPTs) |
| 300655 | Supporting Pastoralism and Agriculture in Recurrent and Protracted Crises (SPARC) |
| 300644 | Enhancing Digital and Innovations for Agri-food Systems and Livelihoods (eDIAL) |
| 300635 | Private Enterprise Programme Zambia Phase II |
| 300632 | Strengthening Impact Investment Markets for Agriculture (SIIMA) |
| 300555 | Global Land Governance Programme |
| 300554 | Bangladesh – Rohingya Response and National Resilience (RRNR) |
| 300524 | Strengthening Disaster Recovery and Resilience in the Caribbean |
| 300489 | Africa Food Trade and Resilience programme |
| 300467 | Better Assistance in Crises (Social Protection) |
| 300432 | North East Nigeria Transition to Development Programme |
| 300424 | Reducing Deforestation Through Improved Spatial Planning in Papua Provinces, Indonesia |
| 300421 | UK : India Fastrack Start-up Fund (FSF) |
| 300418 | UK-INDIA Partnership on National Investment and Infrastructure Fund – Green Growth Equity Fund |
| 300414 | Essential Healthcare for the Disadvantaged in Bangladesh |
| 300363 | Building Resilience in Ethiopia (BRE) |
| 300351 | Second phase of DFID’s Support to the Private Infrastructure Development Group (PIDG) |
| 300308 | Direct Response through Emergency Cash Transfers |
| 300303 | Rural Electrification in Sierra Leone |
| 300298 | Humanitarian Response in Mozambique |
| 300274 | UK Nigeria Infrastructure Advisory Facility (UKNIAF) |
| 300230 | Transboundary Water Management in Southern Africa |
| 300187 | Strengthening Palm Oil Sustainability in Indonesia |
| 300185 | Supporting a Sustainable Future for Papua’s Forests |
| 300168 | Zimbabwe – Support to Agriculture, Land Governance and Resilience Programme (2021 -2025) |
| 300166 | Khyber Pakhtunkhwa Merged Districts (KPMD) Support Programme (previously called the Federally Administered Tribal Areas (FATA) Development Programme) |
| 300164 | Climate Adaptation Water and Energy Infrastructure Programme |
| 300161 | Zambia Social Protection Expansion Programme Phase II |
| 300147 | Reducing Insecurity and Violent Extremism in the Northern Territories (Re-INVENT) |
| 300143 | Hunger Safety Net Programme (HSNP Phase 3) |
| 300141 | Sustainable Energy and Economic Development (SEED) Programme |
| 300137 | Regional Economic Development for Investment and Trade (REDIT) Programme |
| 300125 | Climate Compatible Growth |
| 300123 | MECS – Modern Energy Cooking Services |
| 300116 | Productivity for Prosperity (P4P) |
| 300113 | Building Resilience and adapting to climate change in Malawi |
| 300111 | Low Energy Inclusive Appliances |
| 300110 | Smart Urban Development in Indian States (SmUDI) |
| 300109 | Technical Assistance for Smart Cities (TASC) |
| 300102 | The Future of Agriculture in Rwanda (FAiR) |
| 300067 | Water, Environmental Sanitation and Hygiene Programme |
| 300057 | Global Environment Facility 7th replenishment |
| 300003 | Strengthening disaster resilience in Nepal |
| 205268 | Strengthening humanitarian preparedness and response in Bangladesh |
| 205266 | Pacific Catastrophe Risk Assessment and Financing Initiative |
| 205258 | Green Economic Growth for Papua |
| 205252 | To contribute to the Least Developed Countries Fund for adaptation, hosted by the Global Environment Fund. |
| 205238 | Financial Sector Deepening Africa (FSDA) Platform |
| 205231 | Centre for Disaster Protection (CDP) |
| 205226 | Manufacturing Africa – Foreign Direct Investment |
| 205222 | Cities and Infrastructure for Growth (CIG) |
| 205195 | Rehabilitation of Freetown’s Water Supply System |
| 205188 | Increasing access to electricity in Sierra Leone |
| 205157 | UK Caribbean Infrastructure Fund |
| 205145 | Nepal Health Sector Programme III |
| 205142 | The India-UK Global Partnership Programme on Development |
| 205138 | Post-Earthquake Reconstruction in Nepal – Building Back Better |
| 205128 | Somalia Humanitarian and Resilience Programme (SHARP) 2018-2022 |
| 205122 | Malawi Humanitarian Preparedness and Response Programme |
| 205118 | Commercial Agriculture for Smallholders and Agribusiness Programme |
| 205116 | Support for Protection and Assistance of Refugees in Kenya (SPARK) |
| 205115 | Adapt Environmental and Climate Resilience in Sudan |
| 205082 | Rural Water for Sudan (RW4S) |
| 205061 | Increasing renewable energy and energy efficiency in the Eastern Caribbean |
| 205045 | Zimbabwe Resilience Building Fund Programme(ZRBF) |
| 205027 | Delivering climate resilient Water, Sanitation and Hygiene in Africa and Asia |
| 204984 | Climate Smart Development for Nepal |
| 204956 | CONGO – Improving Livelihoods and Land Use in Congo Basin Forests |
| 204941 | Sustainable Inclusive Livelihoods through Tea Production in Rwanda |
| 204940 | Improving Market Systems for Agriculture in Rwanda IMSAR |
| 204916 | Strategic Partnership Arrangement II between DFID and BRAC |
| 204903 | Somali Health and Nutrition Programme (SHINE) |
| 204888 | Building Resilience Through Asset Creation and Enhancement II – South Sudan (ICF Programme) |
| 204869 | PMEH – Pollution Management & Environmental Health |
| 204867 | Transforming Energy Access (TEA) |
| 204842 | Promoting Conservation Agriculture in Zambia |
| 204837 | BRILHO – Energy Africa Mozambique |
| 204804 | Accountability in Tanzania Programme – Phase II |
| 204794 | Infrastructure for Climate Resilient Growth in India |
| 204784 | Green Mini-Grids Africa Regional Facility for Market Preparation, Evidence and Policy Development |
| 204783 | Climate Action for Middle East and North Africa (CAMENA) |
| 204773 | Applied Research on Energy and Growth |
| 204702 | Sanitation, Water and Hygiene for the Rural Poor |
| 204656 | Building Urban Resilience to Climate Change in Tanzania |
| 204640 | Zambia Health Systems Strengthening Programme |
| 204637 | Africa Clean Energy Programme (ACE) |
| 204624 | WISER – Weather and climate Information and Services for Africa |
| 204623 | Forestry, Land-use and Governance in Indonesia |
| 204603 | Multi-Year Humanitarian Programme in Pakistan |
| 204495 | Support to Trademark East Africa Rwanda (TMEA) Rwanda Country Programme – Strategy II |
| 204477 | Exiting Poverty in Rwanda |
| 204471 | UK Support to Access to Finance Rwanda (AFR) Phase II Operations (2016-2020) |
| 204456 | Programme of Support to Agriculture in Rwanda |
| 204369 | Corridors for Growth |
| 204365 | Improving Energy Access in Tanzania through Green Mini-Grids |
| 204364 | Assisting Public Institutions and Markets to Become Resilient to Effects of Climate Change in Tanzania ( AIM for Resilience) |
| 204338 | Sustainable Urban Economic Development Programme (SUED) |
| 204290 | Productive Safety Net Programme Phase 4 |
| 204270 | Africa Division funding to the African Agriculture Development Company (AgDevCo) |
| 204258 | Hunger Safety Net Programme |
| 204250 | Infrastructure and Cities for Economic Development (ICED) |
| 204248 | Global Green Growth Institute (GGGI) |
| 204202 | Sustainable Energy for Women and Girls (SEWG) |
| 204196 | Burma Humanitarian Assistance and Resilience Programme |
| 204148 | Food and Agriculture Organisation Core Assessed Contribution 2018 to 2019 |
| 204135 | Bihar Agriculture Growth and Reform Initiative (BAGRI) |
| 204059 | Supporting Structural Reform in the Indian Power Sector |
| 204056 | Global Environment Facility 6th Replenishment |
| 204045 | Urban Water for Sudan (UW4S) |
| 204033 | Support to Rural Water Supply, Sanitation & Hygiene in Tanzania |
| 204020 | Climatescope – Clean Energy Investment Index |
| 204019 | Humanitarian Assistance and Resilience in South Sudan (HARISS) 2015 to 2021 |
| 204012 | Transforming the Economy through Climate Smart Agribusiness (NU-TEC) |
| 203998 | Green Mini-Grids Kenya |
| 203911 | India: Infrastructure Equity Fund – Investment in small infrastructure projects in India’s poorest states |
| 203904 | Multi-Year Humanitarian Support to Afghanistan |
| 203871 | Energy Security and Resource Efficiency in Somaliland |
| 203864 | Better Health in Bangladesh |
| 203852 | Pathways to Prosperity for Extremely Poor People in Bangladesh (PPEPP) |
| 203844 | Research on Growth and High Volume Transport in Low Income Countries |
| 203842 | Managing Climate Risks for Urban Poor |
| 203809 | Disaster Risk Insurance |
| 203768 | Strengthening Emergency Preparedness and Response in Kenya (2014-2018) |
| 203766 | Water, Sanitation and Hygiene (One WASH) Programme |
| 203764 | Nepal Local Governance Support Programme |
| 203674 | Solar Nigeria Programme |
| 203641 | Social Protection Support to the Poorest in Rwanda |
| 203603 | Enhancing resilience in Karamoja Uganda |
| 203599 | Building adaptation to climate change in health through resilient water, sanitation & hygiene |
| 203595 | Achieving Water Security in the Southern Agricultural Growth Corridor |
| 203582 | Provision of finance to the Rwanda Fund for Climate Change and Environment |
| 203574 | Strengthening Adaptation and Resilience to Climate Change in Kenya Plus (StARCK+) |
| 203551 | Tackling Maternal and Child Undernutrition Programme- Phase II |
| 203491 | Support to Bangladesh’s National Urban Poverty Reduction Programme (NUPRP) |
| 203488 | Transparency and Right to Information |
| 203473 | Productive Social Safety Net Programme |
| 203469 | African Risk Capacity (ARC) |
| 203445 | Increasing sustainable access to water sanitation and hygiene in the Democratic Republic of Congo |
| 203444 | British International Investment (BII) Programme of Support in Africa, South Asia, Indo-Pacific & Carib (2015-2027) |
| 203427 | Accelerating Investment and Infrastructure in Nepal |
| 203294 | Community Disaster Risk Reduction Fund |
| 203290 | Improving climate change resilience in Caribbean communities |
| 203282 | Promoting Low Carbon Development with Returnable Capital in Indonesia |
| 203279 | CCMCC Promoting cooperation and avoiding conflict in managing the impacts of climate change |
| 203272 | Strengthening Health Facilities in the Caribbean |
| 203264 | Building Disaster Resilience in Pakistan |
| 203186 | Rural Access Programme 3 |
| 203185 | Asia Regional Resilience to a changing climate (ARRCC) |
| 203180 | Climate Proofing Growth and Development in South Asia |
| 203161 | Private Sector Development programme in the DRC. |
| 203153 | East Africa Geothermal Energy (EA-Geo) |
| 203123 | Low Carbon Support to the Ministry of Finance |
| 203029 | ‘Pakistan National Cash Transfers Programme’ |
| 202995 | Support for Refugees in Kenya (2012-2016) |
| 202976 | Providing Clean Energy to the Rural Poor of Bangladesh |
| 202957 | Results Based Financing for Low Carbon Energy Access |
| 202956 | Global Network of Climate Technology Innovation Centres |
| 202954 | Support for Energy Sector Analysis that influences global energy decision makers |
| 202921 | Building Resilience and Adaptation to Climate Extremes and Disasters |
| 202884 | The Water Security Programme |
| 202869 | India: Infrastructure Loan Fund – Small loans to bridge the infrastructure gap for the poor |
| 202867 | Financing Liveable Habitat for Poor in Low Income States |
| 202844 | Southern Agriculture Growth Corridor Programme in Tanzania |
| 202835 | Private Enterprise Development in low-income countries (PEDL) |
| 202817 | Adaptation for Smallholder Agricultural Programme (ASAP) |
| 202775 | South Asia Water Governance Programme (SAWGP) |
| 202762 | Supporting Indian Trade and Investment for Africa |
| 202745 | Partnerships for Forests (P4F) |
| 202698 | Kenya Market Assistance Programme (MAP) |
| 202697 | Punjab Education Support Programme II |
| 202691 | Support to improved water and sanitation in rural areas – Zimbabwe |
| 202657 | Kenya Essential Education Programme |
| 202619 | Arid Lands Support Programme |
| 202604 | Global Innovation Fund (GIF) |
| 202597 | Climate High-Level Investment Programme |
| 202595 | Support for priority actions to operationalise the “Implementation Plan for Development Resilient to Climate Change in the Caribbean” |
| 202571 | Support to the Global Agriculture and Food Security Programme (GAFSP) |
| 202555 | Private Sector Energy Efficiency |
| 202549 | Reducing Maternal and Newborn Deaths in Kenya |
| 202541 | Climate Smart Agriculture in Africa |
| 202539 | Regional Transboundary Water Resources Programme – Phase 3 |
| 202536 | Scaling up of the Energy and Environment Partnership with Southern and East Africa |
| 202534 | Tanzania Climate Change Institutional Strengthening Programme |
| 202520 | Water for Three States (Red Sea, Gadarif and Kassala) |
| 202495 | Enterprise and Assets Growth Programme |
| 202433 | UK Support to Increase Resilience to Natural Disasters in Nepal |
| 202376 | Promoting Low Carbon Development in Indonesia |
| 202345 | Sanitation and Hygiene Programme in Zambia |
| 202328 | Khyber Pukhtunkhwa Education Sector Programme |
| 202214 | Malawi Health Sector Support Programme |
| 202108 | AGMIP – Agricultural Model Inter-Comparison and Improvement Project |
| 202098 | Rural and Agriculture Markets Development programme for Northern Nigeria (PrOpCom Mai-karfi) |
| 201989 | Vietnam: DFID-World Bank Climate Change Partnership |
| 201986 | Caribbean Renewable Energy and Energy Efficiency Improvement Projects |
| 201980 | Private Enterprise Programme in Zambia |
| 201942 | Indonesia Low Carbon Growth Project |
| 201931 | Green Africa Power (GAP): Renewable Energy for Africa |
| 201913 | Strengthening Adaptation and Resilience to Climate Change in Kenya (StARCK) |
| 201866 | Strategic Climate Institutions Programme |
| 201857 | Market Development in Northern Ghana |
| 201733 | Climate Public Private Partnership Programme (CP3) |
| 201724 | Forest Governance, Markets and Climate |
| 201575 | Renewable Energy and Adaptation Climate Technologies (Africa Enterprise Challenge Fund) |
| 201295 | Strategic Influencing Fund |
| 201286 | Strategic Partnership between BRAC, DFID and AusAID to support BRAC in delivering progress towards the MDGs in Bangladesh and to support its Institutional Development |
| 201239 | Livelihoods and Food Security Trust Fund for Burma (NUTSEM) |
| 201196 | Enhancing Community Resilience Programme |
| 201129 | Nepal Climate Change Support Programme |
| 200773 | Multi-Stakeholder Forestry Programme – Nepal |
| 200658 | Care Adaptation Learning Programme |
| 200498 | Accountability in Tanzania Programme (ACT) |
| 200496 | Cooperation in International Waters in Africa |
| 200368 | Support to the multilateral Climate Investment Funds (CIFs) |
| 200136 | Climate Development for Africa |
| 114293 | Poorest States Inclusive Growth Programme |
| 114058 | Climate Change Programme – Jolobayoo-O-Jibon |
| 113889 | Congo Basin Forest Fund (CBFF) Start Up Programme |
| 112082 | ESPA – Eco System Services for Poverty Alleviation |
| 102580 | Nile Basin Initiative |
-
UK Government (2023) Together for People and Planet: UK International Climate Finance Strategy ↩
-
World Bank (2016) Managing the impacts of climate change on poverty. ↩
-
Dasgupta et. al. (2021) The Economics of Biodiversity ↩
-
IPCC (2022) 6th Assessment Report WGIII: Summary for Policymakers ↩
-
UN (2022) COP26 Glasgow Climate Pact ↩
-
UN (2015) United Nations Framework Convention on Climate Change: Paris Agreement ↩
-
The non-continuous numbering of ICF KPIs reflects the discontinuation of indicators found not to be well suited to ICF portfolio monitoring in previous reviews. ↩
-
For this KPI, social institutions are defined as: schools, universities, hospitals, health centres, government institutions, state owned infrastructure and civil society organisations. ↩
-
Attributed means that our work directly and solely caused the results; contributed means our work was part of a number of factors which led to a result. ↩
-
The Clean Development Mechanism (CDM) is a way to finance emissions mitigation projects by selling certified emission reductions, or CERs. For further information, see https://cdm.unfccc.int/. ↩