The impact of additional Jobcentre Plus support on the employment outcomes of disabled people
Published 18 March 2025

© Crown copyright 2025
This publication is licensed under the terms of the Open Government Licence v3.0 except where otherwise stated. To view this licence, visit nationalarchives.gov.uk/doc/open-government-licence/version/3 or write to the Information Policy Team, The National Archives, Kew, London TW9 4DU, or email: psi@nationalarchives.gov.uk.
Where we have identified any third party copyright information you will need to obtain permission from the copyright holders concerned.
This publication is available at https://www.gov.uk/government/publications/the-impact-of-additional-jobcentre-plus-support-on-the-employment-outcomes-of-disabled-people/the-impact-of-additional-jobcentre-plus-support-on-the-employment-outcomes-of-disabled-people
Statement of application of the Code of Practice for Statistics
The analysis in this report has been produced as far as possible in line with the Code of Practice for Statistics. The code is built around 3 main concepts, or pillars, trustworthiness, quality and value:
- trustworthiness – is about having confidence in the people and organisations that publish statistics
- quality – is about using data and methods that produce assured statistics
- value – is about publishing statistics that support society’s needs for information
The following explains how we have applied the pillars of the Code in a proportionate way.
Trustworthiness
DWP analysts work to a professional competency framework and Civil Service core values of integrity, honesty, objectivity, and impartiality. Analysts have produced these statistics and conducted rigorous quality assurance in line to the standards usually applied to ad hoc releases. Background and methodology information is also included in the release.
The analysis has been signed off by the expert lead analyst and the Department’s Head of Profession for Statistics was consulted on the production and publication process and the timing of the publication was pre-announced.
Care has been taken to ensure only those who needed to see the analysis prior to publication had access to it.
The detailed methodology, data sources and approach taken in this research are set out in this report alongside the findings. The approach used builds on the methodology used for previous labour market programme evaluations.
Quality
The process to produce the analysis in this report was conducted by professional analysts taking account of the latest administrative data and applying methods using their professional judgement. The analysis has been through a rigorous quality-assurance and sign-off process by other DWP analysts.
Value
The publication of this release ensures the information are equally available to all users as well as providing transparency. This research provides important new evidence for Ministers, policy makers and external stakeholders.
Key findings
This note presents two pieces of complementary evidence showing how additional Jobcentre Plus support improves the employment outcomes of disabled people and people with health conditions.
First, analysis of the impact of Additional Work Coach Support for customers in the limited capability for work and work-related activity group finds the following:
- 12 months after the intervention, 11% of participants were in work compared to 8% of the comparison group – a 3%-point employment impact. This impact is statistically significant
- 4% of participants start further provision within 12 months of the intervention compared to 2% of the comparison group – a 2%-point impact for starts to other provision. This impact is statistically significant
Second, a 7-year follow-up of the impacts of the work-related activity group trial of additional JCP support for the equivalent of the limited capability for work group found the following:
- the intervention had a positive impact on the number of months of employment in each year, 2 to 6 years after the intervention. This impact is statistically significant
- the support had a positive and statistically significant impact on earnings in each year, 2 to 3 years later
- there was no statistically significant impact of the intervention on the amount paid in Universal Credit and legacy benefits
Additional Work Coach Support Impact Evaluation
Introduction
Additional Work Coach Support provides increased work coach appointment time for new and existing Universal Credit (UC) and Employment and Support Allowance (ESA) customers with health conditions or disabilities. It provides regular and normally mandatory appointment time of 30 minutes every fortnight for customers awaiting their work capability assessment (pre-WCA) or in the limited capability for work (LCW) group. Additionally, a strand offers customers in the limited capability for work and work-related activity (LCWRA) group voluntary work coach appointments. This offer gives them access to support equivalent to 30-minutes of work coach appointment time every month. A research report “The customer experience of Additional Work Coach Support: Findings from qualitative interviews with customers” will be published alongside this, which details 90 qualitative interviews with customers and their experience of Additional Work Coach Support.
Additional Work Coach Support has been rolled out in Jobcentres from June 2022 onwards and is now being delivered across Great Britain. It was introduced via a staggered rollout; - a third of districts were covered in year 1, a second third in year 2, and a final third in year 3 – taking provision to all Jobcentres. This meant that the availability of support varied over time depending on which JCP office a UC customer was attached to.
Research Question
Whilst Additional Work Coach Support was delivered to UC customers on the health journey[footnote 1] and ESA WRAG and Support Group customers, this analysis only relates to UC LCWRA participants[footnote 2]. A robust impact evaluation was not possible for the pre-WCA and LCW groups. This is because the eligibility criteria for Additional Work Coach Support specifically excludes customers in the LCW/pre-WCA groups who “have a short term illness and/or are likely to return to work without support”. This creates a bias in the analysis as work coaches do not enrol to the support claimants who they think will get a job without support or who they know have a job offer already. This makes the treatment and comparison groups dissimilar in a way which cannot be accounted for.
Whilst we do not have robust evidence of the impact of Additional Work Coach Support for the LCW/pre-WCA groups, the second section of this evidence pack shows that the WRAG pilots improved employment outcomes up to 6 years after the intervention. This supports the case that additional JCP support works for improving outcomes for a wide range of customers with health conditions. The research question is “Did Additional Work Coach Support improve employment outcomes and referrals to provision for participants in the LCWRA group?”. These participants received 4 appointments each, on average.
The majority of participants of Additional Work Coach Support were in the Pre-WCA group
Figure 1: Volumes of participants receiving Additional Work Coach Support, June 2022 to February 2025
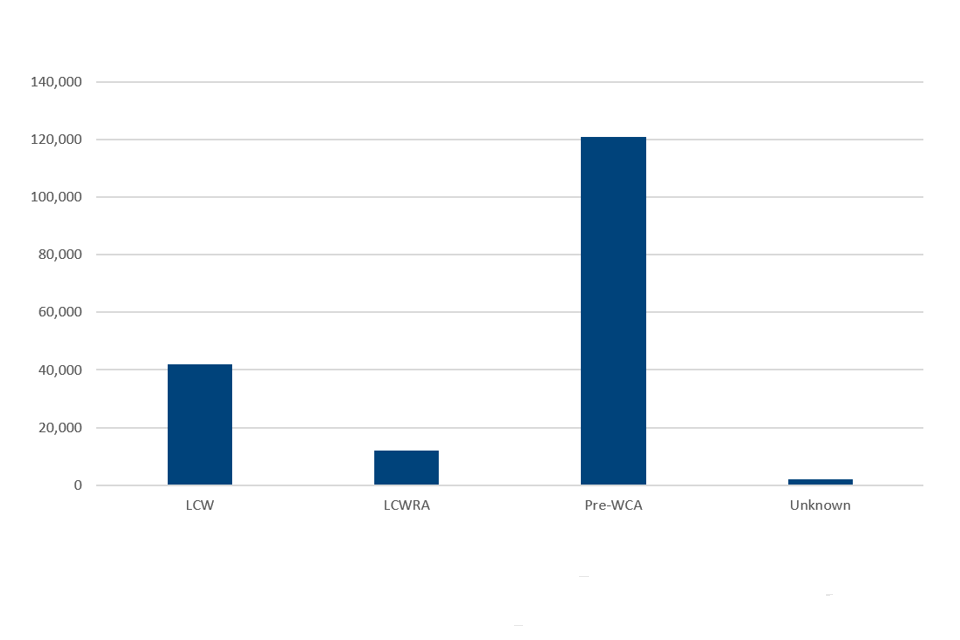
Figure 1 shows to the total number of Additional Work Coach Support customers by UC group. UC group is measured at the time of first appointment.
Approximately 177,000 UC customers have had one or more Additional Work Coach Support appointment between June 2022 and February 2025. At the time of the first appointment:
a. 42,000 (24%) were in the LCW group
b. 12,000 (7%) were in the LCWRA group
c. 121,000 (68%) were in the pre-WCA group
d. 2,000 (1%) had a group which was not identifiable in the data.
The average number of appointments per Additional Work Coach Support participant was 5. This average varied slightly by group:
a. On average, 6 appointments for the LCW group
b. On average, 4 appointments for the LCWRA group
c. On average, 4 appointments for the pre-WCA group
d. On average, 6 appointments for the unknown group
Non-Technical Summary
To estimate the impact of Additional Work Coach Support, we compare the outcomes of Additional Work Coach Support participants in the LCWRA group to a comparison group who did not participate in the support. To make the participant and comparison groups as similar as possible, we apply a method called Propensity Score Matching. Propensity Score Matching was applied to align the characteristics of the treatment and comparison groups in terms of demographics, employment history and benefit receipt.
The key outcomes (employment and starting further intensive DWP provision) were then tracked for 12 months and compared to estimate the impacts of the intervention. The findings indicated:
- 12 months after the intervention, 11% of participants were in work compared to 8% of the comparison group – a 3%-point employment impact. This finding was statistically significant
- of the 3%-point employment impact, approximately two-thirds was driven by working more than 16 hours per week and one-third to working fewer than 16 hours per week
- 4% of participants started further DWP provision within 12 months of the intervention compared to 2% of the comparison group – a 2%-point impact for starts to other support. This impact is statistically significant
Technical Summary
Methodology
The aim of impact evaluation is to estimate the “additionality” or additional impact of an intervention. To do so, we try to compare the outcomes of people who participate in Additional Work Coach Support, with what their outcomes would have been had they not participated – the “counterfactual”. The “counterfactual” must be estimated because only the actual outcomes of participants can be observed[footnote 3]. In this analysis, the “counterfactual” is estimated using the outcomes of a comparison group of similar people who do not participate in Additional Work Coach Support, by using an approach called Propensity Score Matching – as illustrated by Figure 2.
Propensity Scores Matching compares the outcomes of participants to a similar comparison group who do not participate
Figure 2: Venn diagram to illustrate Propensity Score Matching
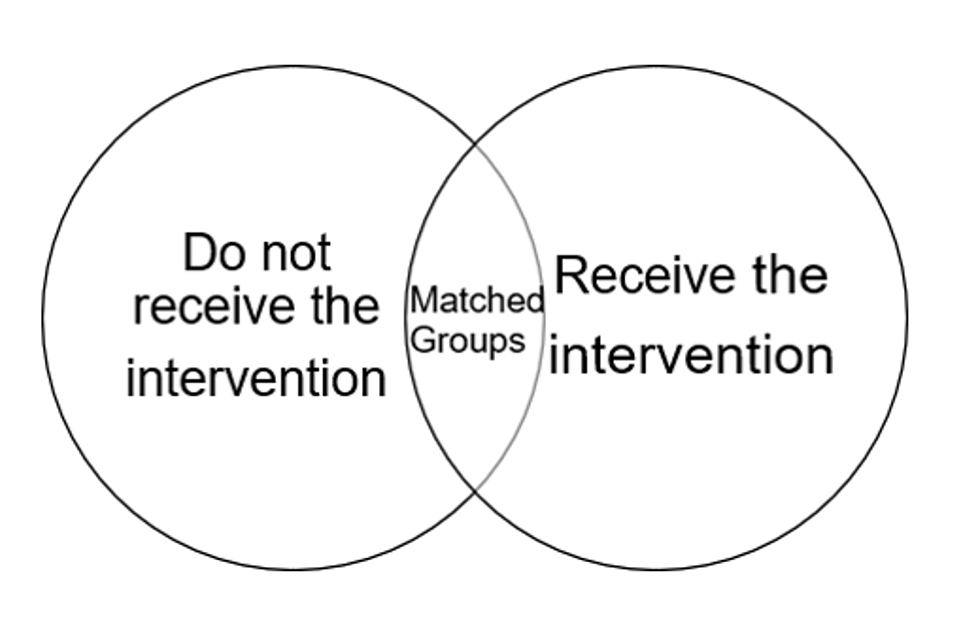
1. Identify a comparison pool of people who are likely to experience similar outcomes to the participants of the intervention - illustrated by the left circle of the Venn diagram in Figure 2. In this case, the comparison group is UC customers who are in the LCWRA group who do not participate in Additional Work Coach Support.
2. Identify a treatment group. In this case the treatment group is people who are in the LCWRA group who take part in Additional Work Coach Support. The treatment group is represented by the right circle of the Venn diagram in Figure 2.
3. From the comparison pool, identify a subset who are most similar to participants across a large number of variables (these matching variables are outlined in the data section) are identified using a matching process[footnote 4]. The matched treatment and comparison groups are illustrated by the overlapping sections of the Venn diagram in Figure 2.
4. The average outcomes of the matched comparison group are deducted from the average outcomes for participants to give an estimate of the average impact of the intervention[footnote 5].
Key assumptions of Propensity Score Matching
The key assumption of Propensity Score Matching to reliably estimate the impact of an intervention is known as the “Conditional Independence Assumption”. This means that there are no remaining differences between the matched treatment and matched comparison groups that would affect outcomes. Phrased differently, the 2 matched groups would have the same outcomes if the treatment group had not participated in the intervention.
Treatment and Comparison Group Selection
The treatment group is defined as any LCWRA customer in a phase 1 area who attended their first Additional Work Coach Support appointment between 1 June 2022 and 28 February 2023. The number of participants used for the analysis totals 3,600. The comparison group is selected as LCWRA customers in phase 3 areas during the same period - Additional Work Coach Support had not yet rolled out in these areas.
Data
Outcome variables
For the treatment group, outcomes are tracked monthly from the date of the first Additional Work Coach Support appointment. For the comparison group, outcomes are tracked from a “pseudo-start date” - a date assigned to the comparison group instead of the real programme start dates of the participant group[footnote 6].
- employment is a binary variable equal to 1 if the individual had positive earnings from employment in a calendar month, 0 if the individual had zero earnings. Earnings data is from Real Time Information (RTI) earnings data from employment supplied by HMRC. Self-employment earnings are excluded from the RTI data
- employment up to 16 hours – pre-tax earnings equal up to 16 hours at the National Living Wage (NLW)
- employment greater than 16 hours – pre-tax earnings greater than the equivalent of 16 hours at the NLW
- participation in further DWP provision – a binary variable equal to 1 if the individual starts intensive DWP provision within 12 months of first Additional Work Coach Support appointment, 0 otherwise[footnote 7]
A UC customer is defined as being in the LCWRA group at intervention/pseudo-start using administrative data from the UC Health Caseload dataset[footnote 8].
Matching variables
Matching variables used in this analysis are measured at the time of, or in each of the 24 months prior to, the intervention-start date (treatment group) or pseudo-start date (comparison group):
- employment history variables (24 months of history)
- demographics (at intervention or pseudo-start):
- family status: couple without children, couple with children, single without children, single with children
- age category: 18 to 24, 25 to 34, 35 to 44, 45 to 54 and 55+ years.
- gender: male, female
- cluster: indicator that an individual lives in one of 14 labour market clusters of local authorities (GB only) at programme start[footnote 9]
- participation in one or more DWP intensive provision in the past 24 months[footnote 10]
- benefit history indicators (24 months of history per variable):
- Employment and Support Allowance (24 months of history)
- Jobseekers Allowance
- Housing Benefit
- Personal Independence Payment or Disability Living Allowance receipt
- Past UC receipt health group (LCWRA, LCW and pre-WCA)
- time on UC health journey, measured in months
Results
12 months after the intervention, participants are 3% points more likely to be in work
Figure 3: The impact of Additional Work Coach Support on probability of employment, by month
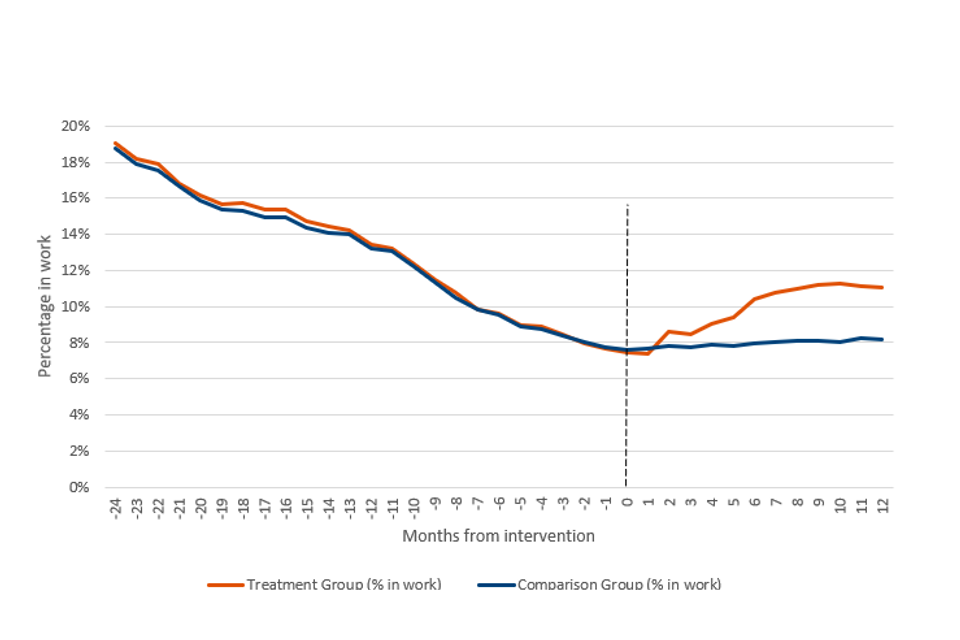
Figure 3 shows the impact of Additional Work Coach Support on employment. Month indicates the month in relation to the intervention - negative numbers indicate before the intervention and positive numbers indicate after the intervention. The orange line indicates the employment rate of the treatment group and the blue line indicates the same for the comparison group. The difference between the lines shows the impact of the intervention:
a. In months -24 to -1 (prior to the intervention), the groups have similar average outcomes[footnote 11] – this is reassuring and indicates that the matching worked reasonably well to align the employment trends of the 2 groups.
b. The impact of the intervention grows over time and is statistically significant from month 5 onwards.
c. 12 months after the intervention, 11% of participants were in work compared to 8% of the comparison group – a 3%-point employment impact.
12 months after the intervention, participants are 1% point more likely to work up to 16 hours per week
Figure 4: The impact of AWCT on the probability of working up to 16 hours a week, by month
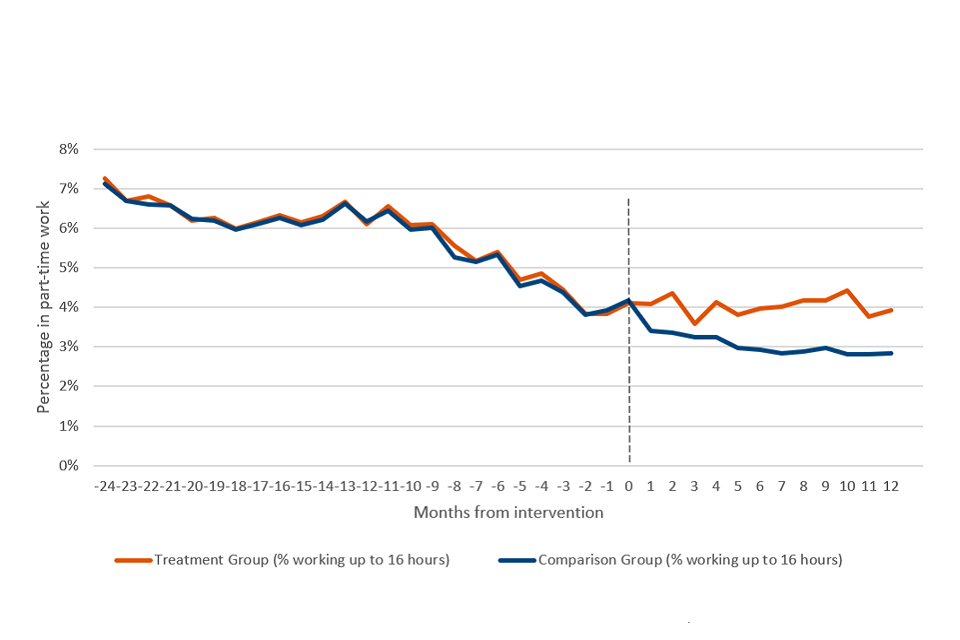
Figure 4 shows the impact of Additional Work Coach Support on working up to 16 hours per week. Month indicates the month in relation to the intervention where negative numbers indicate before the intervention and positive numbers indicate after the intervention. The orange line indicates the percentage of the treatment group who work up to 16 hours per week. The blue line indicates the same percentage for the comparison group. The difference between the lines is the impact of the intervention:
a. The impact of the intervention is statistically significant in month 2 and from months 4 to 12.
b. 12 months after the intervention, 4% of participants work up to 16 hours per week compared to 3% of the comparison group – a 1%-point additional impact.
12 months after the intervention, participants are 2%-points more likely to work more than 16 hours per week than the comparison group
Figure 5: The impact of Additional Work Coach Support on the probability of working more than 16 hours per week, by month
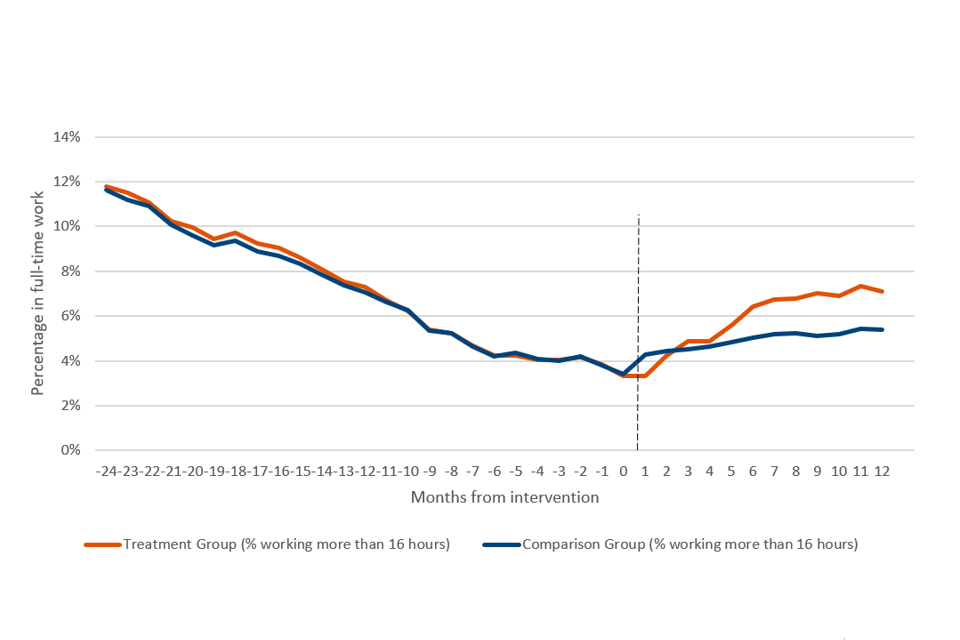
Figure 5 shows the impact of Additional Work Coach Support on working more than 16 hours per week. Month indicates the month in relation to the intervention where negative numbers indicate before the intervention and positive numbers indicate after the intervention. The orange line indicates the percentage of the treatment group who work more than 16 hours per week. The blue line shows the same for the comparison group. The gap between the lines is the impact of Additional Work Coach Support:
a. The impact of the intervention is statistically significant in month 1 and months 5 to 12.
b. 12 months after the intervention, 7% of participants work more than 16 hours compared to 5% of the comparison group – a 2%-point impact.
In combination, the findings presented in Figures 4 and 5 indicate that approximately two thirds of the employment impact is driven by working more than 16 hours per week and one third is driven by working fewer than 16 hours per week.
Participants are 2% points more likely to be referred to DWP intensive provision within 12 months
Figure 6: The impact of Additional Work Coach Support on starting DWP intensive provision within 12 months of first appointment
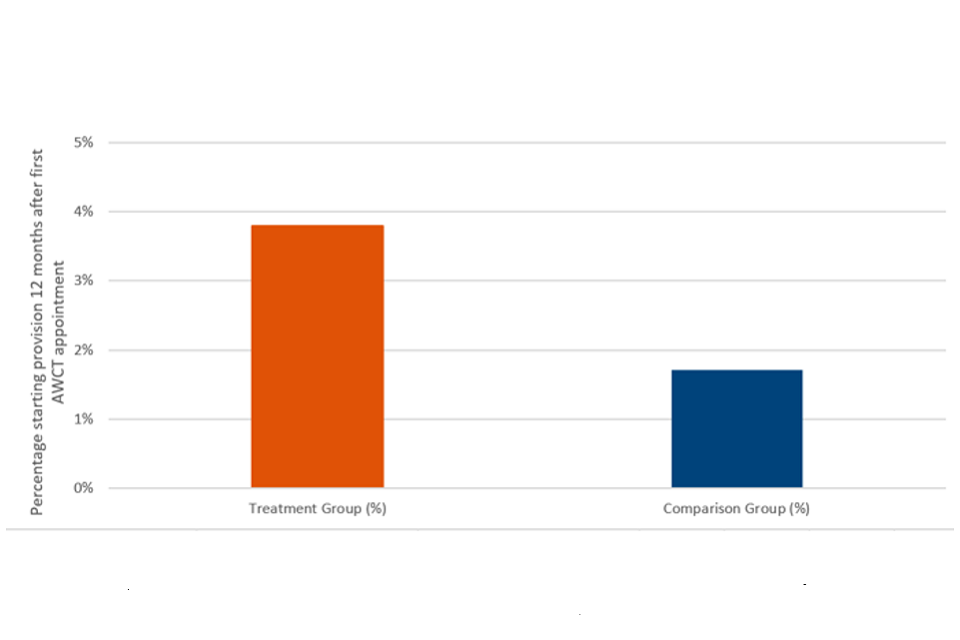
Figure 6 shows the impact of Additional Work Coach Support on the probability of starting DWP intensive provision within 12 months of the intervention.
The orange bar indicates the proportion of the treatment group who started intensive DWP provision within 12 months of the intervention. The blue bar indicates the same for the comparison group. The difference between the 2 bars indicates the impact of the intervention:
a. 4% of participants start further provision within 12 months of the intervention compared to 2% of the comparison group – a 2%-point impact for starts to other provision. This impact is statistically significant.
Work-Related Activity Group Pilots: 7-year Impact Evaluation
Background
The Work-Related Activity Group (WRAG) pilots were launched in 2013 and tested different forms of additional support for those in the WRAG. The WRAG were the equivalent of the LCW group under the legacy system of Employment and Support Allowance which was superseded by UC. The findings from the WRAG pilots impact evaluation were published in 2019 and provide extensive background information on the trial[footnote 12].
To track the long-term impact of the WRAG pilot of additional JCP support, we use DWP and HMRC administrative data to compare the employment and benefit receipt outcomes of the control and treatment groups for a seven-year period after the trial.
Technical Summary
Methodology
To track the 7-year impacts of the WRAG JCP pilots we apply the approach taken for the 2019 publication:
1. From the trial data, identify people in the Southern England JCP group (the JCP group where the JCP pilot was implemented).
2. Remove people who were classified as exempt.
After applying this process, the sample size for the treatment group is 2,434 observations, 120 fewer observations than the sample size in the published impact evaluation[footnote 13]. The control group had a sample size of 2,734 observations, which was 77 observations more than the original WRAG publication. The sample sizes do not perfectly align with the published impact evaluation due to the original methodology for linking JCP offices to JCP groups no longer being available. It was therefore necessary to recreate this linking process.
Data
The analysis linked information detailing the participants of the WRAG pilots to data from Registration and Population Interaction Database (RAPID) from 2014/15 to 2021/22 financial years. RAPID is based on 100% extracts of various DWP benefit systems and is supplemented with 100% data extracts from HMRC systems. RAPID collates information on individual interactions with DWP and HMRC within each tax year, including benefit, employment and in-work benefit interactions, for example Tax Credits and Housing Benefit.
The employment data within RAPID is Pay as You Earn (PAYE) data from HMRC data extracts and includes all employment and pension records that are submitted via employer’s payroll processes. In contrast to the published impact evaluation which did not have access to self-employment data, the HMRC Self-Assessment extract is used for the purposes of assessing tax liabilities for the self-employed, people with multiple employments, and for people with investment income that is not captured by the PAYE system.
The key outcome variables were:
- months in employment per year – the total number of months with positive total earnings from PAYE employment and self-employment per year[footnote 14]
- total annual earnings from PAYE employment and self-employment
- total annual benefit receipt (£) – amount of UC, Carer’s Allowance, and legacy benefits (Job Seeker’s Allowance, Income Support, Employment and Support Allowance, Child Tax Credits, and Working Tax Credits)[footnote 15]
Results
Participants worked during more months 2 to 6 years after the intervention
Figure 7: The impact of the WRAG JCP Pilots on months in employment (employment or self-employment), by year (with 95% confidence intervals)
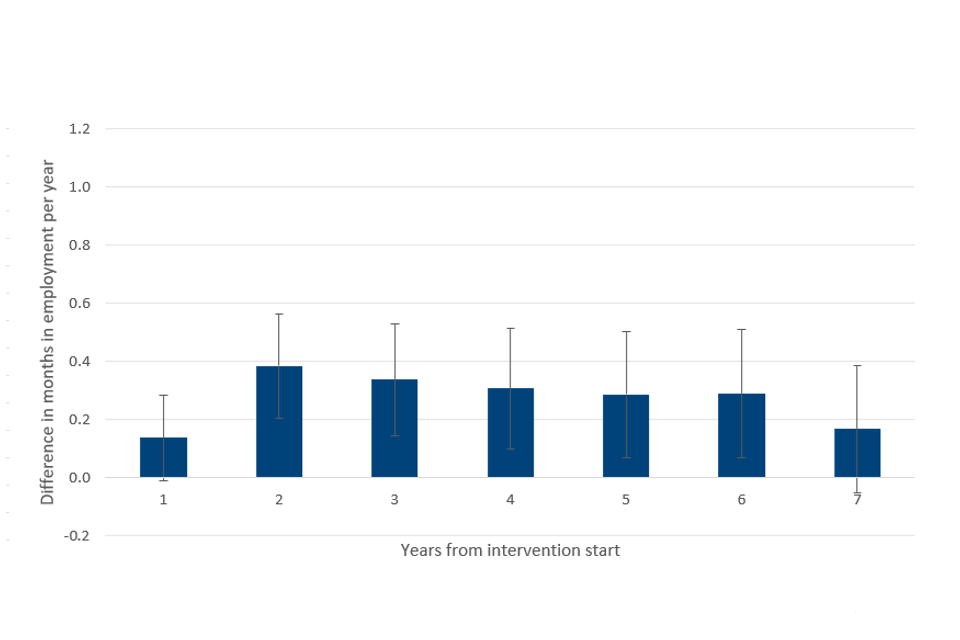
Figure 7 shows the impact of the intervention on the number of months in employment (PAYE and self-employment) in years 1 to 7 after the intervention:
a. There is a statistically significant impact of the intervention on months in employment in years 2 to 6, though there is no statistically significant impact in years 1 and 7.
b. In year 2, the treatment group was employed during 0.38 months per year more than the control group. Approximately, this is equivalent to the intervention leading to 2 in every 5 participants being employed in one extra month in year 2.
c. The cumulative 7-year impact was that participants were in employment in an extra 1.9 months, a statistically significant result. Note that these results differ from the 2019 publication[footnote 16], which reported minimal employment impacts. The change is likely to be due to our updated results using higher quality earnings data which included self-employed earnings. This allowed for a more precise and comprehensive assessment of outcomes.
The intervention increased earnings 2 to 3 years after the intervention
Figure 8: The impact of the WRAG JCP Pilots on total annual earnings, by year (with 95% confidence intervals)
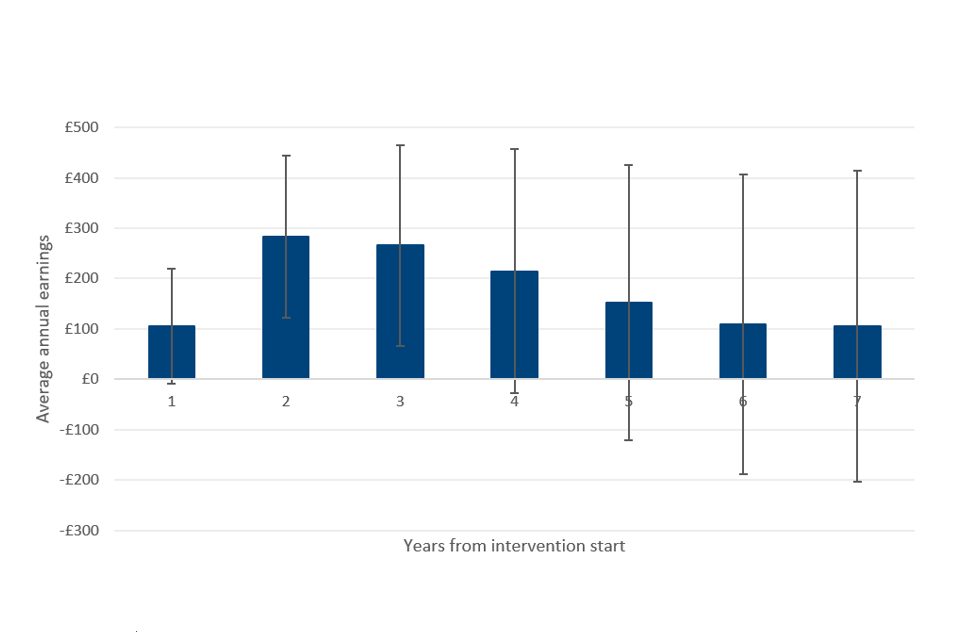
Figure 8 shows the impacts on overall annual earnings from PAYE employment and self-employment for years 1 to 7 following the intervention. In each year for years 2 to 3, there was a statistically significant impact of the intervention on average overall earnings. There was no statistically significant impact in year 1 or in years 4-7. Across the first 3 years, participants earned approximately £650 more than those who did not receive additional support.
The intervention did not have a statistically significant impact on total UC and legacy benefit receipt
Figure 9: The impact of the WRAG JCP Pilots on total UC and legacy benefit receipt (with 95% confidence intervals)
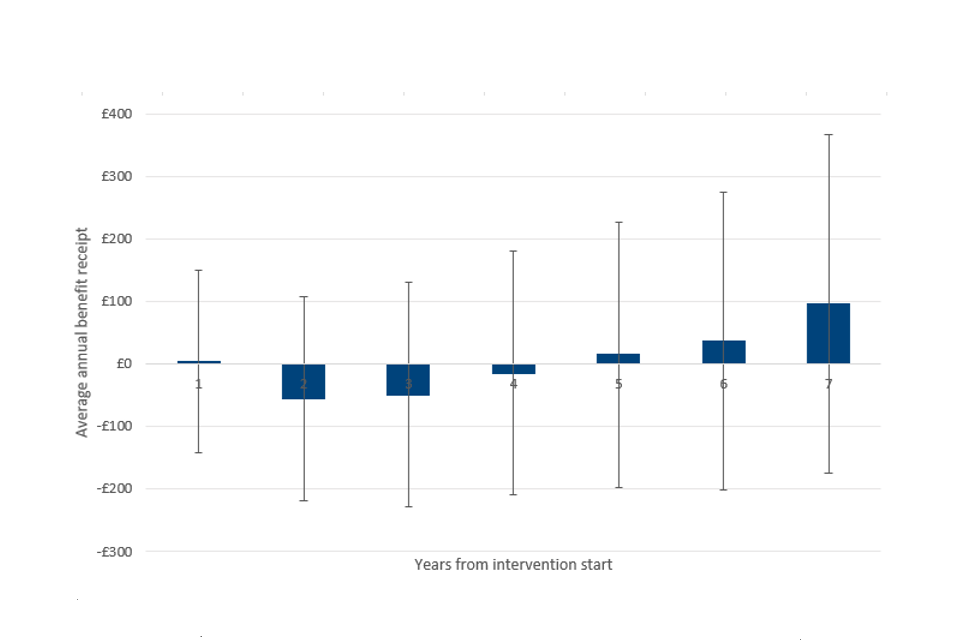
Figure 9 indicates that there is no statistically significant impact of the intervention on the amount of benefit a customer received[footnote 17] in years 1 to 7, measured in £. A possible explanation for this is that whilst the intervention increased employment and earnings, treated participants did not earn above the UC work allowance[footnote 18] or the ESA permitted work rules[footnote 19] for the amount of benefit they received to be reduced.
Note that these results differ from the 2019 publication[footnote 20], which reported a reduction in claimants on benefits for the first 2 years of treatment. The difference is due to the inclusion of Working Tax Credits and Child Tax Credits in our outcome measure. This suggests that the treatment group were moving from out-of-work benefits like JSA and ESA to in-work benefits.
-
The health journey is UC customers in the LCWRA, LCW, and pre-WCA group. ↩
-
For ESA participants there were insufficient sample sizes to evaluate the impact for Additional Work Coach Support. ↩
-
This is because at a given point in time an individual either participates in Additional Work Coach Support or does not participate, never both. ↩
-
For a more detailed explanation of how Propensity Score Matching works and its application to labour market interventions, see the DWP Datalab Methodology publication. For past applications of PSM to evaluate labour market interventions, see Ward et al. (2016) and Ainsworth and Marlow (2007). ↩
-
This is known as the Average Treatment effect on the Treated (ATT). ↩
-
The comparison group does not start the intervention and therefore does not have a start date on the intervention. Consequently, a pseudo-start date is required for the comparison group as a reference point to track their outcomes from. The pseudo-start dates of the comparison group were assigned to align those of the treatment group. For a further explanation of pseudo-start dates, see Appendix B of the Employment Datalab Methodology Report. ↩
-
Work and Health Programme, Intensive Personalised Employment Support, Sector-based Work Academy Programme, Restart or Kickstart. ↩
-
The UC Health Caseload dataset is a historic, cumulative dataset containing all live UC claims on the second Thursday of each month . For further information on the UC Health Caseload dataset, see Section 3.1 of the UC WCA statistics guidance. ↩
-
Further information on labour market cluster variables is presented in Appendix A of the Employment Datalab Methodology Report. ↩
-
DWP intensive provision is Work and Health Programme, Intensive Personalised Employment Support, Sector-¬based Work Academy Programme, Restart or Kickstart. ↩
-
The participants have slightly better outcomes overall (though these differences are not statistically significant) and decline close to the start date. ↩
-
See Employment and Support Allowance work-related activity group pilots – GOV.UK. See The impact evaluation. ↩
-
See page 55, Table A.3. Process and impact assessment: Employment and Support Allowance: evaluation of pilots to support work-related activity group customers with an 18 to 24 month re referral period ↩
-
The months in employment per year is calculated as follows. First, monthly overall earnings (PAYE employment plus self-employment) are calculated. Then the number of months per year where monthly overall earnings are positive is then counted. The months in employment per year variable ranges from 0 months to 12 months. ↩
-
We don’t include on/off benefits as an outcome variable for our 7-year follow-up analysis as this concept is less meaningful with the introduction of Universal Credit where many claimants are both in-work and on UC. ↩
-
See Employment and Support Allowance work-related activity group pilots – GOV.UK . See The impact evaluation. ↩
-
In UC, Carer’s Allowance, and legacy benefits. ↩
-
Information on the UC work allowance. ↩
-
Information about the ESA permitted work rules: Permitted work factsheet – GOV.UK. ↩
-
See Employment and Support Allowance work-related activity group pilots – GOV.UK. See The impact evaluation. ↩