CJRS final evaluation: Accompanying technical information
Published 17 July 2023

© Crown copyright 2023
This publication is licensed under the terms of the Open Government Licence v3.0 except where otherwise stated. To view this licence, visit nationalarchives.gov.uk/doc/open-government-licence/version/3 or write to the Information Policy Team, The National Archives, Kew, London TW9 4DU, or email: psi@nationalarchives.gov.uk.
Where we have identified any third party copyright information you will need to obtain permission from the copyright holders concerned.
This publication is available at https://www.gov.uk/government/publications/the-coronavirus-job-retention-scheme-final-evaluation/cjrs-final-evaluation-accompanying-technical-information
Introduction
This is an accompanying document to the Coronavirus Job Retention Scheme (CJRS) final evaluation. It provides details of the range of data sources, research and analysis that has been conducted to inform this evaluation. Further, it provides additional information on the CJRS policy timeline and the coverage of the CJRS grant which has previously been reported on in the Coronavirus Job Retention Scheme interim evaluation.
In addition to internal data, commissioned research and internal analysis detailed in this CJRS final evaluation, some information from other government departments, public bodies and intergovernmental organisations is also used. These sources are primarily used to provide context.
1. Internal data sources
1.1 HMRC CJRS data
This is data collected by HMRC from CJRS applications submitted via Pay As You Earn (PAYE) schemes. It includes information such as the number of employees on furlough and the amount claimed. This data covers the whole population rather than a sample of people or companies and is used to produce the CJRS Official Statistics.
1.2 HMRC Pay As You Earn (PAYE) Real Time Information (RTI)
This Management Information System enables analysis of employee’s area of residence, age, gender, and their employer’s industry or sector. Information on employees’ occupation, ethnicity and disability status is not available. Monthly statistics based on HMRC’s RTI system are published in a joint release between HMRC and the Office for National Statistics (ONS). Data from HMRC’s RTI system was matched with HMRC CJRS data in order to produce the CJRS Official Statistics.
1.3 HMRC CJRS Official Statistics
HMRC produced CJRS Official Statistics which include figures from the start of the scheme in March 2020 through to the end of the CJRS in September 2021, with a final publication in December 2021.
The statistics include estimates of the number and value of CJRS claims made. They include time series data of employments on furlough by different characteristics, including sector, employer size, country and region. They also include cumulative statistics for total number of employments on furlough, total number of employers that have used the scheme and total value of claims made.
Information on the number of employers and employees on furlough, furlough dates, claim values and furlough type is based on data submitted by employers as part of their CJRS claim. Information on characteristics is based on data provided by employers to HMRC’s PAYE RTI system. Industrial sector information is based on the Inter-Departmental Business Register (IDBR) produced by the ONS.
The CJRS statistics are Experimental Statistics. There have been some improvements made to the methodology used to produce the statistics, where relevant to the evaluation, which has the potential to cause some small differences compared to published statistics, thus affecting the comparability of statistics over time.
Further details about the Official Statistics, including the data sources, methodology, limitations and revisions can be found in the monthly publications and associated background quality report.
2. Evaluation approach
2.1 Evaluation questions
The final evaluation is assessed on 3 main areas: the process of the implementation and operation of the CJRS, the impact on the micro and macroeconomy, and value for money (VfM) of the overall scheme. The questions that the evaluation addresses are outlined in table 2.1 below.
Table 2.1: Evaluation questions
Process:
-
How effective was the scheme at reaching the intended recipients?
-
What was the estimated scale of error and fraud?
-
How was it controlled through the design and implementation of the scheme, including compliance checks?
Impact:
-
To what extent did the scheme protect jobs?
-
To what extent did the winding down and closure of the scheme affect employment?
-
To what extent did the scheme support household incomes and protect living standards?
-
How effective was the scheme at reducing the risk of permanent business closure?
-
To what extent did the scheme reduce the risk of economic scarring – long-lasting and significant adverse effects on employment and output?
-
To what extent did the scheme support the economic recovery?
-
To what extent did the scheme have wider outcomes and impacts beyond the intended scheme objectives?
-
To what extent did employers and employees respond to scheme changes as intended?
-
Who was impacted by the scheme and what can be learned from their employment outcomes?
VfM:
-
How effective was the scheme?
-
How fair was the scheme?
-
How much did the scheme cost?
-
How efficient was the scheme?
-
Was the CJRS overall VfM?
Cross-cutting and policy themes:
-
What were employer and employees’ views on the scheme?
-
What lessons can be learned to inform future policy design and implementation?
3. Commissioned research (evidenced throughout multiple chapters)
3.1 CJRS employer quantitative research: Wave 2
3.1.1 Overview
A random probability survey was undertaken by Ipsos with the following groups:
- 4,860 employers who had used the CJRS at any point between March 2020 and September 2021
- 1,807 employers who were eligible for the CJRS but did not use it
These 2 groups comprised 4,284 ‘new’ participants who took part in the survey for the first time and 2,383 ‘longitudinal’ participants who had taken part in wave 1.
Table 3.1: Type of respondent against source
| Type of respondent | Fresh | Longitudinal |
|---|---|---|
| User | 3,048 | 1,812 |
| Non-User | 1,236 | 571 |
Source: CJRS employer quantitative research
The research explored employers’ experiences of applying for the CJRS and the impacts of the scheme on redundancies and business survival.
Fieldwork took place between 11 July 2022 and 21 November 2022.
The survey focused on the entire period that the CJRS existed. Public sector employers that had not used the CJRS were asked a screening question at the start of the Non-User survey to identify whether they received public funding for their staff costs. Public sector employers that were not eligible for the CJRS, as well as organisations that had no employees between March 2020 and September 2021, were screened out of the Non-User survey.
Employers (both CJRS Users and CJRS Non-Users) were sampled from the Inter-Departmental Business Register (IDBR) administered by the Office for National Statistics (ONS). Prior to sampling, the IDBR was matched to HMRC’s CJRS database to flag employers who had claimed the CJRS. Wave 2 took a mixed cross-sectional and longitudinal approach for measuring employer-level change over time. The longitudinal sample consisted of Users and Non-Users that took part in the wave 1 survey.
Data were weighted to correct for:
-
unequal selection probabilities
-
response rates among sub-sets of the population (such as by size, sector, and region for Users and Non-Users)
Weights were generated for Users and Non-Users separately. Rim-weighting methods were used to adjust the responding sample of businesses so that the weighted profile matched that of the population of employers. For Users, the population figures were based on CJRS claims. For Non-Users the population figures were calculated by taking overall business counts from the IDBR and subtracting the CJRS claimants.
Users were weighted to size, sector (interlocked) and region. Some small sectors were collapsed to make the weighting more efficient. Non-Users were weighted to the same 3 measures, but size and sector were not interlocking (the sample size for the Non-Users was smaller and did not allow for this). These weights were then combined into a single weight that covered all employers in the population, giving 3 weights in total (Users, Non-Users, and all employers).
Of these 3 weights, 2 versions were created. The first was generated for the cross-sectional sample (all cases interviewed in wave 2). The process was then repeated for the longitudinal sample (cases that were interviewed in both wave 1 and wave 2). The latter set of weights weighted the responding sample back to the initial wave 1 population and are designed for analysis of change over time.
Finally, a further set of weights was generated that weighted the sample to the population of employees. These weights also grossed the sample, so that the survey estimates can be reported in terms of total employee counts. The main set of weights should be used for employer-level estimates (to report X% of employers did Y). The employee weights should be used for grossed employee-level estimates (to report that Z employees did Y).
Confidence intervals are a measure of precision. A 95% confidence interval is calculated so that 95 times out of 100 it will contain the true population figure. A narrower interval indicates a higher level of precision. Based on this design, the confidence interval for a survey estimate of 10% from micro Users is expected to be around + or - 1.1%, meaning the true population value is likely to fall between 8.9% and 11.1%.
Further technical information about this research is provided in the accompanying technical research report.
3.1.2 Estimating jobs protected and permanent employer closures prevented by the CJRS
To explore the impact of the CJRS, the research asked employers to predict what would have happened to their organisation and their employees in the absence of the scheme. They were asked whether they thought they would have had to make additional redundancies, and how many, as well as whether they thought they would have been able to continue operating without the scheme. Responses to these survey questions were scaled up to the total population using estimates of the size of the total populations of eligible employees and eligible employers, to estimate the total number of jobs protected by the CJRS and the total number of employers protected from permanent closure by the scheme.
Estimates of jobs protected by the CJRS were also scaled up by individual sector. This analysis was used to explore whether the impact of the scheme on protecting jobs varied for employers from the sectors most negatively impacted by COVID-19.
There are many complex outcomes that could have occurred in the absence of the CJRS, which may have impacted on an employer’s ability to continue operating and keep their staff in employment. These may have been challenging for employers to unpick and fully factor into their responses. For example, they may have had to consider how a non-CJRS scenario might have impacted on their customers and supply chains, and subsequently their own sales and operations, or understanding the knock-on implications of having to draw on other sources of finance, such as savings.
Additionally, employers may also have not factored into their responses the potential increase in their use of other schemes introduced during the COVID-19 pandemic, in absence of the CJRS. This effect could work both ways. For example, an increased use of other schemes could have resulted in fewer redundancies made by the employer, or if those schemes were not as suited to their needs as the CJRS was, this could have resulted in comparatively more redundancies being made.
The combination of these factors may mean that the estimates of jobs protected from redundancy and jobs protected from permanent closure using this research data are under or over-estimates and they should therefore be treated with caution. However, a strength of using research data in this way is the generalisability of the findings to the total population of eligible employers. Due to the probability-based sample of employers eligible to use the CJRS and weighting to correct for unequal selection probabilities and non-response bias, there is confidence that the employer survey responses represent an accurate indication of employer expectations, within a known confidence interval. Confidence interval ranges, including information on how these have been calculated, can be found in the accompanying technical research report.
3.2 CJRS employer qualitative research: Wave 2
Ipsos conducted 40 in-depth interviews with employers who used the CJRS between 1 August 2022 and 7 October 2022, by telephone or online video calling software. A range of different employer groups who used the CJRS were included in the research. Interviews explored the impact of the scheme in relation to the following:
- decision-making: why employers decided to use the scheme and how employers decided to use the scheme in relation to topping-up wages, flexible furlough, rotating employees on furlough, and training
- decision-making at the end of the CJRS: how the closure of the scheme affected employers’ decision-making
- impact of the CJRS: the extent to which the CJRS protected jobs and businesses
Interviews were conducted across different organisation size, location and region based on agreed quotas. More information on these breakdowns can be found in the accompanying technical research report.
Potential participants were generated from the Ipsos CJRS Employer Quantitative Research: Wave 2 and were contacted promptly after their participation in the survey. This helped ensure that the research and their consent for re-contact were fresh in their minds.
All recruitment was guided by a screening questionnaire, agreed by HMRC, designed to ascertain eligibility, to check key quotas, and any accessibility requirements for the interview. Recruitment was handled by an experienced recruiter who had previously managed recruitment of employers for the wave 1 survey.
A further wide range of quotas were set to ensure a good mix of Users. They considered duration of time staff were on furlough, anticipated outcomes without the CJRS, and use of flexible furlough, among other variables.
Further technical information about this research is provided in the accompanying technical research report.
3.3 CJRS employee qualitative research
Ipsos undertook qualitative research to evaluate the delivery and impact of the CJRS amongst employees. This research investigated the experiences of:
- employees whose employers placed them on furlough and claimed for a proportion of their wages
- employees who continued to work whilst others in their organisation were placed on furlough
Ipsos conducted 80 in-depth interviews over the telephone or through Microsoft Teams with people who either are or were working for an employer which placed at least one employee on furlough. These participants were either placed on furlough by their employer (who then claimed for part of their earnings through the scheme), or had continued working throughout the course of the scheme. Quotas can be found in table 3.2 below.
Table 3.2: Quota group definitions and frequencies
| Group | Group description | Number of interviews completed |
|---|---|---|
| A | Placed on furlough, returned to work, and were not placed on furlough again | 18 |
| B | Placed on furlough, returned to work, and were placed on furlough again at least once more | 16 |
| C | Placed on furlough and took up secondary employment while on furlough | 11 |
| D | Placed on furlough and were then made redundant by their employer | 12 |
| E | Continued working whilst some colleagues they worked closely with were on furlough | 15 |
| F | Continued working whilst other people in their organisation they did not work closely with were on furlough | 8 |
| All | Total: | 80 |
Fieldwork was conducted between 9 May and 26 August 2022.
Participants were identified for this research from a sample provided by HMRC of employees who worked for organisations which had placed at least one employee on furlough and claimed a portion of their wages through the CJRS. Further technical information about this research is provided in the main CJRS employee qualitative research report.
4. Internal analysis
4.1 Error and fraud estimates (evidenced in Chapter 3)
To develop error and fraud estimates, specific risks for the scheme were identified. These fall into 3 broad categories:
- organised crime
- opportunistic fraud
- error
Each component was estimated separately, given the different sub risks, and then quantified for each category. More information on the methodological approach can be found in the 2022 to 2023 HMRC annual report and accounts.
4.2 Labour market outcomes analysis (evidenced in Chapter 4)
4.2.1 Aim of the analysis
The labour market outcomes analysis aims to provide an understanding of the impact of the CJRS on employees who were on furlough between March and September 2021. The analysis uses data from HMRC CJRS data and earnings and employment data from Pay As You Earn (PAYE) Real Time Information (RTI).
More specifically, this analysis explores the employment outcomes of individuals who have been on furlough at any point. The employment outcomes were examined at 2 points in time, December 2021 and June 2022. These were chosen so that the short and medium-term impacts of the scheme can be assessed, whilst also accounting for natural labour market and economic changes.
Analysis was also produced to understand the outcomes in June 2022 of those who were on furlough in September 2021, the final month of the CJRS. The outcomes of these individuals were compared to those in employment in September 2021 who had never been on furlough. This aimed to identify if there were differences between the 2 groups.
To understand if the scheme’s impact varied by characteristic, a modelling technique was used to calculate the probability of an employee being in employment 9 months after leaving furlough. A range of characteristics, including gender, age and sector are controlled for.
4.2.2 Datasets
For this analysis, CJRS claims were matched to the corresponding PAYE RTI employment data.
The PAYE RTI dataset contains the amount of pay each month for each employment. For this analysis, an employment is classified as being on payroll in a given month if it is paid more than 10 pence in that month. The CJRS claims used in this analysis were submitted up to 21 November 2021 and the PAYE RTI data were submitted by 21 July 2022.
When looking at the outcomes of all individuals on furlough at any point, the population was 10,568,650. When looking at the schemes’ impact by characteristics, the population was 5,136,750 individuals. This reduction in the population is due to individuals with missing characteristics being excluded by the modelling method, therefore only individuals with all characteristics available are included. When comparing employments in September 2021, the furlough population was 1,173,450 employments and the non-furlough population was 18,561,400.
Figures in this analysis are not comparable with figures in the CJRS Official Statistics and figures in the Earnings and employment from PAYE Real Time Information publications. This is because:
- some employees on furlough in the CJRS data are excluded from the analysis because the data could not be matched with PAYE RTI employment data and so it would not be possible to identify the employment outcome
- analysis was conducted on an individual (National Insurance (NI) number) level without calendarisation adjustments (attribution of payments to the month they relate to. The CJRS Official Statistics are reported on an employment as opposed to an individual level and individuals may have been on furlough from more than one employment. The earnings and employment from PAYE Real Time Information publication includes calendarisation to produce monthly employment counts adjusted for the estimated period of employment within each month. The analysis does not include calendarisation adjustments and instead reports the number of individuals paid and therefore on payroll at any point in a given month
All results are rounded to the nearest 50 employments.
4.2.3 Definitions
The analysis explores the outcomes of individuals who were on furlough at any point during the CJRS. It looks at their employment outcomes in December 2021 and June 2022.The 3 possible outcomes were:
- working in an employment that they were previously on furlough from – an individual experiencing this outcome was, in June 2022 on payroll with at least one employment which they were on furlough from via the CJRS, at any point
This group represent individuals who were successfully able to return to active work after a period on furlough.
- working in an alternative employment to one they were on furlough from – an individual experiencing this outcome was, in June 2022
- on payroll with at least one employment which they were never on furlough from via the CJRS, at any point (March 2020 to September 2021)
- not on payroll with any employment for which they were on furlough from via the CJRS
This group includes a mix of individuals who were made redundant and who voluntarily left their employment, after a period of furlough. However, this group also includes some individuals in employments which cannot be wholly considered as new employments. This is because this group includes individuals on payroll with employments the individual held at the same time as being on furlough, but which they were not on furlough from.
- not in employment – an individual experiencing this outcome was, in June 2022, not on payroll with any employment
This group includes individuals who were no longer in employment for a number of reasons. These include being made redundant, leaving employment to become self-employed, retiring, leaving the UK, or returning to education.
For individuals with more than one employment in the data, it needed to be determined which employment characteristics to use in the analysis. To do this, characteristics related to the latest paid employment for the individual were used, except for the characteristics of employments on furlough, where the characteristics of the highest paid employment that was on furlough at any point were used.
4.2.4 Additional information
There are certain cases where it may not be possible to distinguish between different types of payments on PAYE RTI as there are no separate identifiers compared to normal pay, such as in the case of payrolled redundancy payments. Therefore, employments receiving such payments may appear to be continuing. This means a larger number of employments may be seen to still on payroll than actual continued employments; it might be expected that a single redundancy payment is to be paid via PAYE the month after the last furlough period, but for no further payments to be made.
Employments paid less frequently than monthly are not entirely captured in this analysis. This is because the PAYE RTI dataset classifies an employment as ‘on payroll if it receives a payment in a given month’. This means that these employments will show as not on payroll in the months without payment, despite being employed.
The analysis will misclassify employments with missing PAYE RTI data due to late data submissions. If an employer had not made a submission for a particular date at the time the analysis was conducted, then an individual will be classified as not on payroll with that employer on that date. Missing data is not adjusted for in the analysis, which is expected to be less than 1% of employments, although this may differ across months and increase in months towards the end of the period of analysis.
An employment is defined as a NI number and PAYE scheme combination. As such, an employee moving between PAYE schemes owned by the same employer would result in the employee being classified as being in a different employment from the one they were on furlough from. This definition of an employment may differ from other analysis or publications.
4.3 Long-term furlough outcomes (evidenced in Chapter 4)
4.3.1 Aim of the analysis
This analysis followed individuals who were on furlough for the duration of the CJRS to understand whether they were still in the labour market following their time on furlough. The analysis uses data from HMRC CJRS data and earnings and employment data from PAYE RTI. The long-term furlough outcomes analysis explores the employment outcomes of individuals who have been on furlough for the duration of the CJRS with no breaks longer than 3 days. The allowance for the 3-day break was included to account for the possibility of individuals not being placed on furlough across bank holidays, as these often fall at the end or beginning of months. The outcomes were examined at June 2022. This time period was chosen so the medium-term impacts on these individuals can be assessed, whilst also accounting for natural labour market and economic changes.
4.3.2 Datasets
For this analysis, CJRS claims were matched to the corresponding PAYE RTI employment data.
The PAYE RTI dataset contains the amount of pay each month for each employment. For this analysis, an employment is classified as on payroll in a given month if it is paid more than 10 pence in that month. The CJRS claims used in this analysis were submitted up to 21 November 2021 and the PAYE RTI data was submitted by 21 July 2022.
For this analysis, there were 194,750 individuals that were on full furlough and 144,150 individuals that were on a mix of full and flexible furlough for the duration that they were on the CJRS.
Figures in this analysis are not comparable with figures in the CJRS Official Statistics. This is because some employees on furlough in the CJRS claims data are excluded from the analysis because the data could not be matched with PAYE RTI employment data and so it would not be possible to identify the individual’s outcome. All results are rounded to the nearest 50 employments.
4.3.3 Definitions
The analysis explores the outcomes of individuals who were on furlough at any point during the CJRS. It looks at their employment outcomes in June 2022. The 4 possible outcomes were:
- working in an employment that they were previously on long-term furlough from – an individual experiencing this outcome was, in June 2022 on payroll with at least one employment which they were on long-term furlough from via the CJRS
This group represent individuals who were successfully able to return to active work after the CJRS ended.
- working in an alternative employment to one they were on long-term furlough from, that they were also on furlough from at any point – an individual experiencing this outcome was, in June 2022:
- on payroll with at least one employment which was on furlough at any point but was not on long-term furlough
- not on payroll with any employment for which they were on long-term furlough
- working in an alternative employment to one they were on furlough from – an individual experiencing this outcome was, in June 2022:
- on payroll with at least one employment which they were never on furlough from via the CJRS, at any point (March 2020 to September 2021)
- not on payroll with any employment for which they were on furlough from via the CJRS
- not in employment – an individual experiencing this outcome was, in June 2022, not on payroll with any employment
This group includes individuals who were no longer in employment, which may have been for a number of reasons. These include being made redundant, leaving employment to become self-employed, retiring, leaving the UK, or returning to education.
4.3.4 Additional information
There are certain cases where it may not be able to distinguish between different types of payments on PAYE RTI as there are no separate identifiers compared to normal pay, such as in the case of payrolled redundancy payments. Therefore, employments receiving such payments may appear to be continuing. This means a larger number of employments may still be seen on payroll than actual continued employments; it might be expected that a single redundancy payment is paid via PAYE the month after the last furlough period, but for no further payments to be made.
Employments paid less frequently than monthly are not entirely captured in this analysis. This is because the PAYE RTI dataset classifies an employment as ‘on payroll if it receives a payment in a given month’. This means that these employments will show as not on payroll in the months without payment, despite being employed.
The analysis will misclassify employments with missing PAYE RTI data due to late data submissions. If an employer had not made a submission for a particular date at the time the analysis was conducted, then an individual will be classified as not on payroll with that employer on that date. Missing data is not adjusted for in the analysis and is expected to be less than 1% of employments, although this may differ across months, and increase in months towards the end of the period of analysis.
An employment is defined as a NI number and PAYE scheme combination. As such, an employee moving between PAYE schemes owned by the same employer would result in the employee being classified as being in a different employment from the one they were on furlough from. This definition of an employment may differ from other analysis or publications.
4.4 Impact of employer contributions (evidenced in Chapter 4)
4.4.1 Aim of the analysis
The employer contributions analysis aims to provide an understanding of the impact of the employer contributions on the total employments on the CJRS. Specifically, the analysis assessed if the introduction of employer contributions encouraged employers to move individuals from the CJRS back into active employment.
The 2 main CJRS employer contributions that are assessed are the reintroduction of National Insurance contributions (NICs) and the specific contribution rates to employees’ wages. Whilst employers also had to pay auto-enrolment pension contributions from August 2020, this could not be measured effectively within the data, so this is not included in the analysis. The 2 main employer contributions that are captured in the analysis were introduced at different times:
- National Insurance contributions – introduced in August 2020 and stayed throughout the remainder of the scheme
- specific contributions rates to employees’ wages – 10% in September 2020, 20% in October 2020, 10% in July 2021 and 20% in August and September 2021
Both linear and logistic regressions are used to establish what causal relationship exists between changes in employer contributions and employments on furlough.
Linear regression was conducted to understand the impact of employer contributions on employers. Impact was determined by estimating the change in total employments on furlough when NICs and specific employer contribution rates are introduced.
Logistic regression was conducted to assess the impact of employer contributions on furlough employments by characteristic. The approach estimates a probability of an individual being on or off furlough, given a range of characteristics, as discussed below.
4.4.2 Datasets
The analysis uses HMRC CJRS administrative data, alongside PAYE information from HMRC’s RTI system. 2 additional data sources were used to control for other factors in the total employments on furlough; gross value added (GVA) from the ONS and data from the Business Impacts of COVID-19 survey (BICS). The latter concerned the trading status question in the survey which provided a proportion of business that had temporarily or permanently closed trading.
The dataset covers 9.6 employments on furlough, with a small number of adjustments made to account for flexible furlough and removing any anomalies in the data, such as those individuals that cannot be matched to RTI.
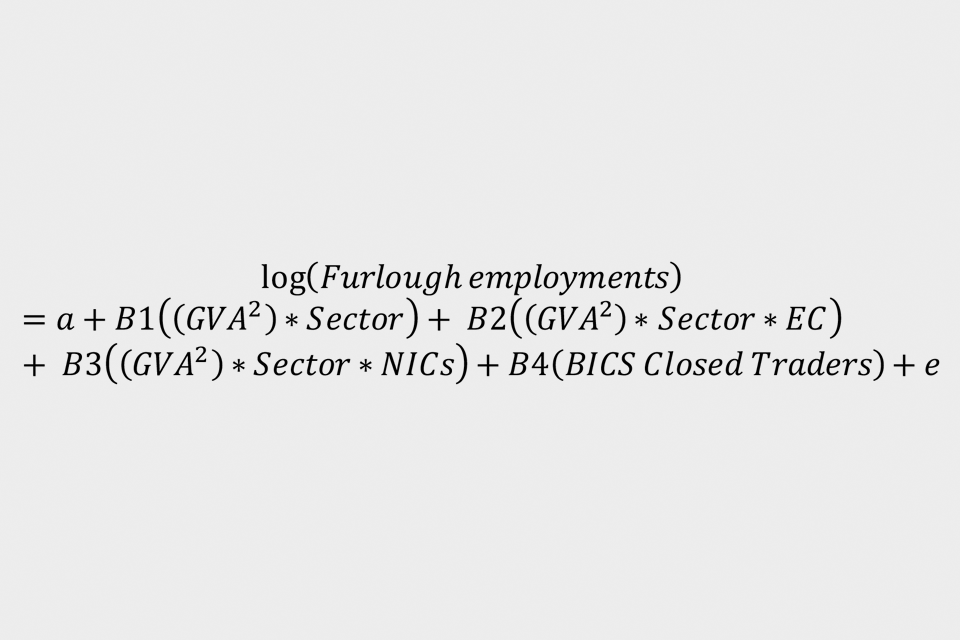
For the linear regression, 2 additional data sources were used to control for other factors in the total employments on furlough; GVA from the ONS and business trading status from BICS. The latter concerned the trading status question in the survey which provided a proportion of employers that had temporarily or permanently closed trading. GVA was squared to improve the fit of the variable to the model.
Having tested several regression models, the final model contained 3 coefficients, all of which were significant to the 5% level. The main variables of interest were national insurance contributions, which was estimated to have caused a 1% reduction in employments on furlough, and the employer contribution rate, which caused a 3% reduction.
For the logistic regression, several characteristics were used: Sector, Gender, Age, Region, Length of employment, Company age, Company size, and Income band.
Table 4.1: Variables used within the logistic regression base case for estimating the impact of the employer contributions on employment outcomes
| Characteristic | Value |
|---|---|
| Sector | Administrative and support services |
| Gender | Female |
| Age | 51 years old |
| Region | West Midlands |
| Length of employment | 4 to 5 years |
| Company age | 20 to 29 years |
| Company size | 11 to 20 employees |
| Income band | Less than £5,000 |
The base case, which can be interpreted as the average User within the data used, showed that an individual had a 43% chance of being removed from furlough after the introduction of employer contributions.
4.4.3 Definitions
The linear regression results discussed above are derived from equation 4.1:
The logistic regression results discussed are derived from equation 4.2:
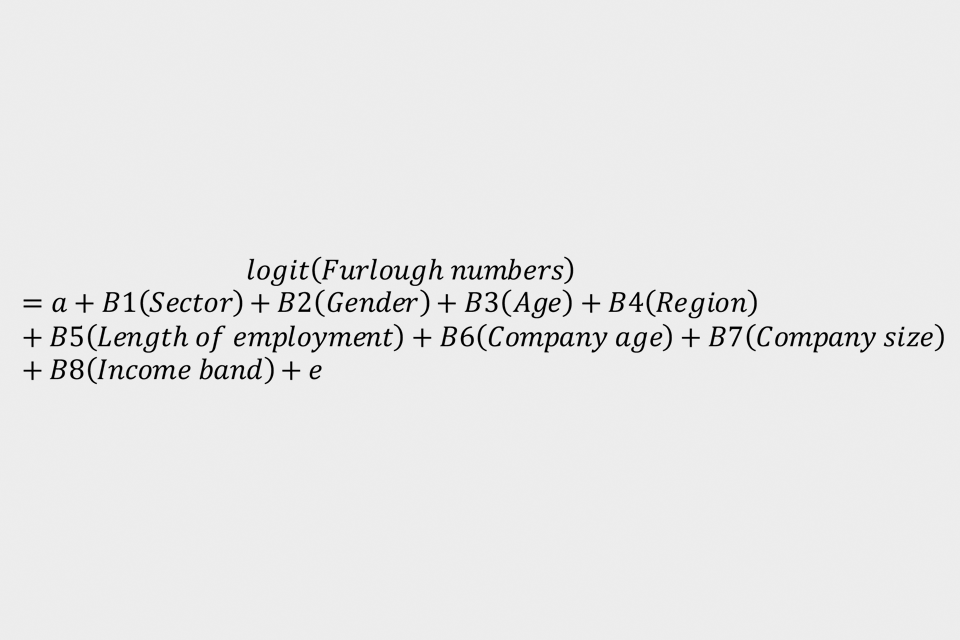
Within the logistic regression, the impact was determined from an employment being removed from furlough a full week after an employer contribution was introduced. This does not mean the entire impact of the contribution will be accounted for; how and when employers react to contributions will differ. This analysis did not distinguish between NICs and specific employer contribution rates.
4.4.4 Additional information
Caution should be taken when interpreting the results from the logistic regression. The model had an Area Under Curve (AUC) score of 0.61. This is a metric used to assess how well the model classifies data and predicts probabilities. A higher AUC score generally indicates a more robust model. Although an AUC score of 0.7 or more would have been preferable, this shows that employee characteristics do not exclusively determine if an employment is removed from furlough, which is to be expected given employers are primarily responsible for furlough (unless an employee chooses to leave their employment which cannot be identified from PAYE RTI). The logistic regression model was tested against a randomised version of the data, with the AUC being the same in both, ensuring the model is valid and accurate.
4.5 Flexible furlough use (evidenced in Chapter 4 and Chapter 6)
4.5.1 Aim of the analysis
The introduction of flexible furlough provided employers additional flexibility on how to use the CJRS. This could provide benefits to both employers and employees. This analysis aimed to understand how flexible furlough was used, in particular, when it was first introduced.
The use of flexible furlough was analysed in several ways. Employments were tracked between May and October 2020 to see whether they were on furlough, and if so, whether they were on flexible furlough, as well as checking the employments not on furlough were being paid in each month. This aimed to understand how flexible furlough was used at the employment level, as the change was introduced.
To understand how flexible furlough was used at the PAYE scheme level, the mean percentage of employments that were on flexible furlough at each PAYE scheme was calculated. This involved counting the number of employments on furlough at the PAYE scheme and dividing this number by the total number of paid employments at the PAYE scheme, with the mean of this percentage calculated across all PAYE schemes that had at least on employment on furlough in the month. This aimed to understand how the use of flexible furlough by PAYE schemes changed over time.
4.5.2 Datasets
For this analysis, CJRS claims were matched to PAYE RTI employment data. Within the employment data, pay data was used to identify employments that were paid any amount each month. For the analysis tracking employments, this dataset consisted of employments that were on furlough at any point in May 2020.
The figures in this analysis are not comparable to the CJRS Official Statistics. This is because some employments and PAYE schemes were excluded from the analysis as the data on their CJRS claims did not match to their PAYE RTI employment data. In addition, the number of employments on furlough includes any employments on furlough in the month rather than on a particular date. When tracking employments over time, the population was 8,937,600 employments.
4.6 Household incomes modelling (evidenced in Chapter 5)
4.6.1 Aim of the analysis
The aim of this analysis is to show how the average impact that CJRS payments had on the net income of working-age households varied across the income distribution. This impact is shown as a percentage of pre-pandemic household income and averages the impact out across working-age households regardless of whether a worker was on furlough, or not. This analysis builds on that presented in the interim evaluation by extending the analysis to later stages of the scheme, covering 3 snapshot months: May 2020, September 2020 and January 2021.
4.6.2 Datasets
The household incomes analysis is based on HM Treasury’s distributional analysis model. It uses the COVID-19 survey modules conducted by the long-running UK Household Longitudinal Study (UKHLS)[footnote 1] to estimate the probability of an employee losing their job; and for those who do not lose their job HMRC administrative data to estimate the rate of CJRS participation, for both flexible and full furlough (and hours worked for those on flexible furlough). For both, different probabilities were calculated based on different gross earnings bands.
This data is used to estimate the probability of workers employed in February 2020 being on furlough in later months. These likelihoods are then used to randomly assign furlough status to individuals in HM Treasury’s distributional analysis model (the Intra-Governmental Tax and Benefit Microsimulation model (IGOTM)) taking into account their gross earnings. More information about IGOTM, can be found in documents published alongside recent fiscal events.
It is then possible to microsimulate the impact on incomes at a household level, and the government support provided to workers on furlough. This is then compared to an illustrative scenario where these workers instead of being on furlough, lost their jobs. The results are collected for all working-age households in the model (defined as a those where the household reference person is under the age of 65), and each household placed in one of 10 deciles, based on their pre-pandemic net equivalised household income. Household income is considered on a Before Housing Costs (BHC) basis.
The analysis looks at 3 snapshot months (May 2020, September 2020 and January 2021) to give an indication of how the support provided by the CJRS and the resulting impacts on household income evolved over time: This includes the extension to the CJRS in November 2020. These months were chosen to reflect the scheme’s impact against a backdrop of changing NPIs, varying levels of employer contributions, and the full and flexible furlough stages of the scheme (as well as data limitations in later months).
To assess the distributional impact of support provided by the CJRS to households, the net impact of the CJRS has been compared against an illustrative scenario where employees lost their job, or had their hours reduced, instead of being on furlough. This is in line with previous distributional analysis publications. In the illustrative scenario, households that claim and are entitled to Universal Credit are given the benefit income they would have received had they become unemployed, including the temporary £20 per week uplift to Universal Credit that applied at that time. Once CJRS payments have been allocated to workers on furlough in the model (based on a percentage of their earnings, and subject to a cap), this may then result in Universal Credit entitlement ceasing, or being reduced, depending on the circumstances of the claimant.
The model considers the change in the CJRS in September 2020, where government support reduced from 80% to 70%, with employers responsible for the remaining 10%. The model excludes any employer top-ups (mandatory top-ups to 80%, and voluntary top-ups above 80%) and employer contributions to wages for hours not worked as these were not funded by the government. Only CJRS payments themselves are considered, and any contribution to employer costs in the form of help with employer NICs or pension contributions have been ignored. Analysis of employer top-ups is covered later in the chapter using alternative modelling.
Throughout this analysis, it is the average net impact of CJRS payments on household income which are presented. This considers how much tax would have been paid on this income, as well as how benefit income may have reduced by. Top-ups and employer contributions would have provided additional support to household incomes beyond that which is indicated in the analysis.
While it is unlikely that all employees placed on furlough would have been made redundant in the absence of the CJRS, the comparison with this illustrative scenario allows the analysis to capture the average proportion of net pre-pandemic household income that the CJRS helped to support across the working-age income distribution.
4.6.3 Definitions
This analysis uses equivalised net household income before housing costs (BHC) as the measure by which to rank households from lowest income to highest income. This indicator is comprised of several components:
- equivalised: equivalisation is a process that adjusts a household’s net income to consider the fact that larger households will require a higher net income to achieve the same standard of living as a household with fewer members. The equivalisation factors used in the analysis are the modified OECD factors (as used in DWP’s Households Below Average Income publication)
- net: household incomes are ranked after deductions from direct taxes, and after additions from welfare benefits. Deductions from indirect taxes, or additions through benefits-in-kind from public services, are not used to rank households
- household: incomes are assessed in aggregate at the household, not individual level. Comparing household, rather than individual incomes reduces the subjectivity of this analysis, ensuring that no assumptions are made about how incomes or expenditure are shared between separate individuals within the household
- before housing costs: housing costs such as rent or the cost of servicing a mortgage are not deducted from household incomes
The household income distribution is created by ranking working-age households from the lowest equivalised net income to the highest equivalised net income, and then dividing this ranking into 10 equally sized groups (called deciles), across which the analysis is produced.
Table 4.2 below shows estimated median gross incomes (pre-tax private income including earnings, private pensions, savings and investments, plus benefit income) within each decile in 2020 to 2021 for all households[footnote 2]. This gives a less precise estimate of a household’s position in the income distribution than net income but is easier to understand because many people think about their incomes or salaries in gross rather than net terms.
Table 4.2 should therefore be used to approximate where a household will be found in the income distribution. For example, if a household consisting of 2 adults earns £22,900 per year between them, there is a high likelihood that this household will be found in the third income decile in 2020 to 2021. However, this is not guaranteed, as different gross household incomes can result in different net household incomes, depending on how many earners there are in the household, the size of the household, and for which benefits the household qualifies.
Table 4.2: Median gross income for each decile (£ per year, 2020 to 2021) for different household compositions
| Median gross income of households in decile | 1 adult | 1 adult and 1 child | 2 adults | 2 adults and 1 child | 2 adults and 2 children |
|---|---|---|---|---|---|
| Top decile | 67,600 | N/A | 98,800 | 134,100 | 160,200 |
| Ninth decile | 45,100 | N/A | 66,900 | 83,900 | 107,300 |
| Eighth decile | 35,800 | N/A | 52,900 | 70,900 | 86,600 |
| Seventh decile | 29,800 | 41,400 | 44,100 | 58,100 | 71,900 |
| Sixth decile | 25,500 | 34,600 | 37,500 | 49,900 | 60,000 |
| Fifth decile | 21,200 | 28,000 | 31,300 | 41,800 | 49,800 |
| Fourth decile | 17,800 | 22,900 | 26,900 | 35,100 | 42,300 |
| Third decile | 15,100 | 20,300 | 22,900 | 30,100 | 35,300 |
| Second decile | 12,500 | 17,100 | 19,200 | 23,400 | 28,300 |
| Bottom decile | 9,300 | 12,200 | 14,200 | 18,100 | 20,000 |
Source: HM Treasury distributional analysis model
4.6.4 Additional information
There are a number of caveats with the modelling:
- HMRC data reporting the probability of being on the CJRS by earnings bands is based on employments, rather than total employee earnings. The model uses these probabilities and furloughs workers based on their total employee earnings, rather than on an employment-by-employment basis. This only affects workers with 2 or more jobs
- the model considers the furlough status of workers at a particular point in time (in May 2020, September 2020 or January 2021), whereas the HMRC data considers all those workers on the CJRS at any time over the course of each month
HMRC data does not capture earnings band information for all employments. The probability of being on furlough in the model is only based on HMRC data where earnings were known. No adjustment is made to the probabilities used in the model to account for cases where this information is missing in the HMRC data.
4.7 CJRS pay top up (evidenced in Chapter 5)
4.7.1 Aim of the analysis
The pay top-up analysis looks at understanding the number of employments on furlough that had their pay topped up by their employer, and by how much. The analysis uses RTI data for individuals in PAYE employment.
This is calculated by measuring the difference between pre-furlough pay and an employment’s earnings whilst on furlough. The analysis allows us to estimate what the extent of pay top-up was throughout the entire CJRS period, which is done by examining whether there was a change in monthly income whilst on furlough. This can help provide more context on the impact of the CJRS on household incomes, whilst also showing a demographic breakdown of the results.
4.7.2 Datasets
First, mean pay between May 2019 and February 2020 is calculated and labelled as pre-furlough pay. If an employment started after May 2019, the mean is calculated from the second month employed up to February 2020. This means an employment must have started by January 2020 to be included in this study.
Monthly pay between March 2020 and September 2021 is compared to the mean of pre-furlough pay. This shows us if furlough pay was (nominally) greater, equal, or smaller than pre-furlough pay, which helps us estimate the level of pay top-up. This is because the CJRS contribution was capped at 80% of pay, up to £2,500. If an employment on furlough was earning equal to pre-furlough pay, this could indicate pay was topped up.
Finally, results are broken down by a range of demographics, including gender, age band, income band, scheme size, and sector. This helps us determine whether there is a link between the extent of pay top-up and the demographics. Table 4.3 below contains the number of individuals in the sample that fall into each pay category.
Table 4.3: Comparison of pay whilst on furlough to pre-furlough average pay for individual employments in the sample
| Date | Greater than pre-furlough pay | Equal to pre-furlough pay | Smaller than pre-furlough pay |
|---|---|---|---|
| Apr 2020 | 189,000 | 784,000 | 908,000 |
| Jul 2020 | 152,000 | 524,000 | 575,000 |
| Nov 2020 | 155,000 | 397,000 | 334,000 |
| Jan 2021 | 189,000 | 473,000 | 393,000 |
| May 2021 | 138,000 | 303,000 | 208,000 |
| Sep 2021 | 94,000 | 194,000 | 115,000 |
Source: HMRC RTI Data
4.7.3 Definitions
All employments with greater than 10% variation between maximum and minimum pre-furlough pay are removed from the sample. This is to ensure accuracy of results because pay top-up cannot be differentiated from a change in underlying pay. For the same reason, only employments with regular and monthly pay are included in the sample. This results in a sample size of 2.2 million, out of a total of 11.7 million employees on furlough. Due to this, the results may not be completely representative of the entire population on furlough. Individuals not receiving regular monthly pay accounts for around 40% of the furlough population. Variable pay accounts for roughly an additional 38%. Individuals who are not being paid monthly results in variable pay (such as weekly pay results in 4 or 5 payments per month, 4-weekly pay results in 1 or 2 payments per month). Secondly, many individuals who are paid a fixed monthly wage may still receive performance-related or one-time bonuses that can result in variable pay. This may distort the comparison between pre-furlough and furlough pay, potentially to underestimate the level of pay top-up
Not being paid monthly can result in variable pay; for example, weekly pay results in 4 or 5 payments per month, while 4-weekly pay results in 1 or 2 payments per month. Also, many individuals who are paid a fixed monthly wage may still receive performance-related or one-time bonuses that can result in variable pay. This may distort the comparison between pre-furlough and furlough pay, potentially to underestimate the level of pay top-up if they are no longer receiving these bonuses whilst on furlough.
‘Equal to pre-furlough pay’ means that an employment on furlough earned within 5% of pre-furlough pay in a particular month. Furlough income of 105% or more of pre-furlough pay is labelled as ‘greater than pre-furlough pay’. This 5% basis has been added to account for practical implications of using the data, as well as a margin of error within the data itself.
4.8 Business outcomes - scheme size changes (evidenced in Chapter 6)
4.8.1 Aim of the analysis
This analysis looked at how the number of employments at each PAYE scheme changed between 2 time points and how this varied between those on furlough and not on furlough of the CJRS. As one of the aims of the CJRS was reducing the risk of permanent closures, understanding changes in the number of employments can provide insight into whether the CJRS was successful in this aim. It also links to the main aim of the CJRS, in protecting jobs.
The PAYE scheme size change analysis examined the number of employments that were paid in April 2020 at each PAYE scheme. This was then compared to the number of paid employments at the same PAYE schemes in January 2022 to understand if PAYE schemes had increased, decreased, or had no change in the number of employments. The endpoint of January 2022 was chosen so that the data reflected any PAYE schemes closing following the end of the CJRS.
This analysis was repeated for all PAYE schemes between April 2018 and January 2020 to examine whether the changes during the CJRS reflected a difference from historic data.
4.8.2 Datasets
For this analysis, CJRS claims were matched to PAYE RTI employment data. Within the employment data, pay data was used to identify employments that were paid any amount each month. This was then used to identify PAYE schemes that had made a claim for the CJRS and at least one employment that was claimed for had matched to the corresponding PAYE RTI employment data. This was the CJRS furlough population. The CJRS non-furlough population was identified as all remaining PAYE schemes that had at least one paid employment between April 2018 and January 2022.
The total User population was 1,230,300 PAYE schemes whilst the non-User population was 709,700 PAYE schemes. The figures in this analysis are not comparable to the CJRS Official Statistics. This is because some PAYE schemes were excluded from the analysis as the employments on their CJRS claims did not match to their PAYE RTI employment data.
4.8.3 Definitions
In this analysis, a PAYE scheme is classed as closed if there were no paid employments in January 2022.
4.9 Business costs avoided through labour retention (evidenced in Chapter 6)
4.9.1 Aim of the analysis
The analysis of saved hiring costs aims to provide an understanding of how the CJRS enabled businesses to avoid hiring and training costs when consumer demand and labour demand recovered. Many of the jobs protected by the CJRS may have needed to be filled when demand recovered. The aim of this analysis is to estimate the costs saved to firms in terms of hiring and training costs.
4.9.2 Datasets
To estimate this benefit of the CJRS, estimates were inspired by literature from Faccini and Yashiv (2022). These estimates equate the cost of hiring workers to their wage level.
The ‘4 million’ estimated jobs protected by the CJRS is considered. An assumption is made that approximately 54% of the jobs protected by the CJRS would have remained until June 2022. This figure is from labour market outcomes analysis that assessed the outcomes of the individuals on the CJRS.
In this analysis approximately 54% of the estimated jobs protected by the CJRS are estimated to be the employees that would have been rehired, in absence of the CJRS, once consumer and labour demand recovered. Using CJRS and RTI data, average salary of the CJRS population was calculated. By applying the costs outlined in the definitions below (pre-match, post-match, and reduced productivity cost), the aggregate costs saved are calculated.
To estimate the variation in costs of hiring and training in different sectors, differences in sector wages were used. The average salaries per sector was calculated from the CJRS population and the estimated costs of hiring and training were calculated by applying the costs outlined in the definitions below.
4.9.3 Definitions
All salaries derived were from the year 2019 to 2020. This was done to reduce the potential distortion COVID-19 may had on salaries. Costs were estimated from survey data that the literature source used.
Pre-match costs are the costs that are incurred before the employment match has occurred (this includes costs such as advertisement, consultancy, and interview costs). The pre-match costs in total accounted for approximately half month of the wage of a worker.
Post-match costs are the costs that are incurred after the employment match has occurred (this includes costs of direct training, indirect training and disruption). The post-match costs (excluding the reduced productivity cost) in total accounted for approximately 2 months wages of a worker.
There is a reduced productivity cost of a worker joining an organisation and experiencing a shortfall of productivity relative to a worker that has undergone training. This accounted for approximately half month of the wage of a worker.
There are limitations to these estimates due to the assumptions made to derive them, such as:
- the relationships may not hold across different countries, due to labour market differences and the time of the survey (survey used was from the years 2012 to 2013)
- the study was regarding newly hired skilled employees. This may not be representative of the entire jobs protected estimate. However, it is worth noting that the estimates are derived from the salary of the CJRS population, and the relationships being used are a proportion of salary. Therefore, this rests upon hiring costs as a percentage of wages being similar for different skilled employee groups
- another assumption that is made is that the outcomes of the jobs protected population was the same of that of the CJRS population. A 46% labour reduction figure was used to estimate how many individuals of the jobs protected estimate, would have been rehired when demand recovered
- for the sectoral estimates to be estimated, it was assumed that the CJRS jobs protected population has the same sectoral breakdown as the overall CJRS population
4.9.4 Additional information
Sensitivity analysis was carried out on these estimates to reflect average employment flows during pre-crisis periods. In this sensitivity analysis, it is assumed that approximately 30% of the jobs protected population, rather than the 46% used previously, were estimated to have left their original employer by June 2022. This figure was derived by using average employment flows from pre-crisis periods. Using the pre-crisis labour market churn rates, the estimated costs saved (of hiring and training) by the CJRS are 30.4% higher than the original estimates in this analysis.
4.10 Macroeconomic impacts - estimated impact on employment and output (evidenced in Chapter 7)
4.10.1 Aim of the analysis
The CJRS enabled businesses to keep employees who they might otherwise have made redundant. This analysis combines the estimate that the CJRS protected around 4 million jobs with information about the speed at which unemployed people enter employment to derive profiles for employment and output in a scenario in which the CJRS had not been in place.
4.10.2 Datasets
The estimates make use of information from the ONS Labour Force Survey flows estimates and from United States Job to job flows about the proportions of people who move between employment, unemployment and inactivity each quarter. The analysis constructs a baseline for the evolution of employment and unemployment with the CJRS in place, by combining out-turn data from the ONS with the projections made in the OBR’s March 2023 Economic and Fiscal Outlook. The baseline incorporates assumptions about the evolution of each of the transition rates between employment, unemployment and inactivity. It uses the ONS data for these up until 2022 Q4. Rates in subsequent quarters are a weighted average of the previous quarter’s value and the 2015 to 2019 average values, which are assumed to be a measure of their steady state values[footnote 3].
4.10.3 No-CJRS employment scenarios
Three no-CJRS reference scenarios were created, that differ in respect to the assumptions they make for:
- the flows from employment to unemployment in 2020 Q2 and 2020 Q3, (following the restrictions on economic activity that were in place from March 2020), and in 2021 Q1, following the renewed tightening of restrictions in January 2021
- the evolution of the transition rates[footnote 4] between employment, unemployment and inactivity
- the size of the multiplier applied to the additional incomes of CJRS recipients who might otherwise have become unemployed between 2020 Q2 and 2021 Q1. The multiplier translates government spending on the CJRS into an increase in household spending, relative to a no-CJRS counterfactual scenario
The scenario assumptions are reported in table 4.4 and visualised in figure 4.1.
Table 4.4: Assumptions for no-CJRS scenarios
| Central VfM scenario | Lower VfM scenario | Upper VfM scenario | |
|---|---|---|---|
| Additional flows from employment to unemployment between 2020 Q2 and 2021 Q1 | 3.8 million | 3.6 million | 4 million |
| 2020 Q2 | 1.7 million | 1.6 million | 1.8 million |
| 2020 Q3 | 1.7 million | 1.6 million | 1.8 million |
| 2020 Q4 | 0 | 0 | 0 |
| 2021 Q1 | 0.4 million | 0.4 million | 0.4 million |
| Additional flows from unemployment to employment in 2022 Q1 | 0.4 million | 0.4 million | 0.4 million |
| Unemployment to employment transition rates between 2021 Q2 to 2022 Q1 | 33.9% | 34.7% | 33.1% |
| Fiscal multiplier value | 0.15 | 0.1 | 0.2 |
Notes: These transition rates correspond to the 95th (central VfM scenario), 98th (lower VfM scenario) and 93rd (upper VfM scenario) percentiles of the historical distribution of transitions into employment in the Labour Force Survey data. Values at the top end of the historical distribution have been selected to reflect the expected strength of labour demand following the easing of restrictions on economic activity in 2021 following the substantial estimated job losses in 2020 in the no-CJRS scenarios.
Figure 4.1: Transition rates between unemployment and employment

Source: HM Treasury calibration
Table 4.5: Transition rates between unemployment and employment
| Quarter | Central VfM scenario (percentage) | Lower VfM scenario (percentage) | Upper VfM scenario (percentage) |
|---|---|---|---|
| 2021 Q1 | 26 | 26 | 26 |
| 2021 Q2 | 34 | 35 | 33 |
| 2021 Q3 | 34 | 35 | 33 |
| 2021 Q4 | 34 | 35 | 33 |
| 2022 Q1 | 34 | 35 | 33 |
| 2022 Q2 | 33 | 33 | 32 |
| 2022 Q3 | 32 | 32 | 31 |
| 2022 Q4 | 31 | 31 | 31 |
| 2023 Q1 | 31 | 31 | 30 |
| 2023 Q2 | 30 | 30 | 30 |
| 2023 Q3 | 30 | 30 | 30 |
| 2023 Q4 | 30 | 29 | 30 |
| 2024 Q1 | 30 | 29 | 29 |
| 2024 Q2 | 29 | 29 | 29 |
| 2024 Q3 | 29 | 29 | 29 |
| 2024 Q4 | 29 | 29 | 29 |
Source: HM Treasury calibration
The increased flow into unemployment leads to employment being below its 2020 Q3 out-turn by 9.3% in the central VfM scenario. This gap narrows in subsequent quarters (figure 4.2). These outcomes reflect the combination of the further additional flow from employment to unemployment (in 2021 Q1) and the flows back from unemployment to employment, which vary across the 3 scenarios.
Figure 4.2: Employment in no-CJRS scenarios, compared with with-CJRS baseline

Source: HM Treasury calculation
Table 4.6: Employment in no-CJRS scenarios, compared with with-CJRS baseline
| Quarter | Central VfM scenario (percentage) | Lower VfM scenario (percentage) | Upper VfM scenario (percentage) |
|---|---|---|---|
| 2020 Q2 | -5.4 | -5.1 | -5.8 |
| 2020 Q3 | -9.3 | -8.7 | -9.8 |
| 2020 Q4 | -6.6 | -6.2 | -7.0 |
| 2021 Q1 | -6.4 | -6.1 | -6.7 |
| 2021 Q2 | -3.3 | -2.9 | -3.6 |
| 2021 Q3 | -2.7 | -2.3 | -3.0 |
| 2021 Q4 | -1.8 | -1.4 | -2.2 |
| 2022 Q1 | -1.4 | -0.9 | -1.7 |
| 2022 Q2 | -0.7 | -0.3 | -1.1 |
| 2022 Q3 | -0.3 | 0.1 | -0.7 |
| 2022 Q4 | -0.2 | 0.1 | -0.6 |
| 2023 Q1 | -0.1 | 0.1 | -0.5 |
| 2023 Q2 | -0.1 | 0.1 | -0.5 |
| 2023 Q3 | -0.1 | 0.1 | -0.4 |
| 2023 Q4 | 0.0 | 0.0 | -0.4 |
| 2024 Q1 | 0.0 | 0.0 | -0.3 |
| 2024 Q2 | 0.0 | 0.0 | -0.3 |
| 2024 Q3 | 0.0 | 0.0 | -0.3 |
| 2024 Q4 | 0.0 | 0.0 | -0.2 |
| 2025 Q1 | 0.0 | 0.0 | -0.2 |
| 2025 Q2 | 0.0 | -0.1 | -0.2 |
| 2025 Q3 | 0.0 | -0.1 | -0.2 |
| 2025 Q4 | 0.0 | -0.1 | -0.1 |
| 2026 Q1 | 0.0 | -0.1 | -0.1 |
| 2026 Q2 | 0.0 | -0.1 | -0.1 |
| 2026 Q3 | 0.0 | -0.1 | -0.1 |
| 2026 Q4 | 0.0 | -0.1 | -0.1 |
Source: HM Treasury calculation
Comparing transition rates between employment and non-employment in the United States in 2020 and 2021 with their typical pre-COVID-19 levels provides a benchmark for how transition rates in the United Kingdom could have evolved if the CJRS had not been in place.
The USA made limited use of job retention schemes. That led to a larger proportion of firms reducing employment levels in response to financial pressures associated with restrictions on their activities. Separation rates[footnote 5] were well above their 2012 to 2019 range during the first half of 2020. Labour demand picked up strongly once pandemic effects on the demand for goods and services eased. Hiring rates out of non-employment were around 20 per cent higher during the second half of 2021 (figure 4.3). These responses are consistent with job losses and subsequent hires being much stronger than average over the course of the pandemic and in its aftermath.
Figure 4.3: Job separation and hire rates in the United States

Source: United States Census Bureau: job to job explorer
Table 4.7: Job separation and hire rates in the United States
| Group | Quarter | 2012-19 median | 2012-19 range | 2020 | 2021 |
|---|---|---|---|---|---|
| Separations | Q1 | 5.6 | 0.0 | 9.8 | 5.6 |
| Separations | Q2 | 6.2 | 0.1 | 8.1 | 6.2 |
| Separations | Q3 | 7.0 | 0.2 | 6.8 | 7.2 |
| Separations | Q4 | 6.5 | 0.2 | 6.6 | 6.8 |
| Hires | Q1 | 6.0 | 0.4 | 5.1 | 6.0 |
| Hires | Q2 | 7.9 | 0.2 | 6.0 | 8.4 |
| Hires | Q3 | 6.8 | 0.3 | 8.0 | 8.0 |
| Hires | Q4 | 6.2 | 0.3 | 7.0 | 7.4 |
Source: United States Census Bureau: job to job explorer
Counterfactual paths for output have been derived by combining the paths for employment with an estimate that the labour productivity of those who were on the CJRS was, on average, 89% of the productivity of the whole workforce. The CJRS take-up was more heavily skewed towards industries with lower mean pay, which is used as a proxy measure of the productivity of employees in each industry (table 4.8).
Table 4.8: Whole economy average pay, £ per month
| Whole economy average pay | Value |
|---|---|
| Weighted pay (£ per month) of Feb 2020 employees | 2,482 |
| Weighted pay (£ per month) of employees on furlough | 2,208 |
| Relative pay of employees on furlough | 89% |
Source: Coronavirus Job Retention Scheme statistics: 7 October 2021 - GOV.UK (www.gov.uk) and Earnings and employment from Pay As You Earn Real Time Information, seasonally adjusted - Office for National Statistics (ons.gov.uk)
4.11 Multiplier effect on the wider economy (evidenced in Chapter 7)
4.11.1 Aim of the analysis
A fiscal multiplier represents the effect of a change in government spending or tax on the level of demand in the economy. The CJRS supported household incomes protected, allowing them to continue spending, keeping businesses open, and consequently boosted demand.
Judgements about the appropriate multiplier to use drew on a range of evidence, including analysis of how fiscal multipliers vary in recessions and pandemics.
4.11.2 Evidence sources
The main pieces of literature used to inform the multiplier used in this analysis:
- OBR Economic and fiscal outlook, November 2020 – judgement led forecast of the CJRS multiplier
- Bank of England working paper No.965, March 2022 – marginal propensity to consume in Covid times using evidence from UK survey data
- ONS Coronavirus and the impact on UK households and businesses, June 2022 – effect of COVID-19 pandemic on income and expenditure of UK households and businesses
- OBR Economic and fiscal outlook, July 2015 and IMF Fiscal multipliers: size, determinants, and use in macroeconomic projects, October 2014 – both showing that nominal multipliers in normal times are 0.6 for advanced economies
- IMF Fiscal multipliers during pandemics, July 2022 – estimates how fiscal multipliers vary over a pandemic, with the multiplier peaking in times of recovery
- IMF A simple method to compute fiscal multipliers, June 2014 – covering how to compute a multiplier, the factors why it varies and how a multiplier changes over a recession through an in-depth dive into multiplier literature
4.12 Impact on labour reallocation (evidenced in Chapter 7)
4.12.1 Aim of the analysis
The analysis aims to understand what effect the CJRS had on productivity through the labour reallocation channel. In preserving the job matches between employers and employees, allocative efficiency. For example, the movement of workers toward the most productive firms, may have been distorted.
The primary aim of the analysis was to examine the relationship between labour reallocation and productivity following the implementation of the CJRS. It sought to produce outputs which would indicate whether labour reallocation was productivity-enhancing throughout the duration of the scheme. In order to do this, a regression model was employed, whereby an employment change variable was created, to capture the reallocation aspect, as well as a lagged firm-level productivity variable. Specifically, this involved calculating the change in employment for firms in 3 periods: March 2020 to September 2020, March 2020 to March 2021, and March 2020 to September 2021. This was defined as the change in firm-level employment divided by the average employment across both periods.
The productivity variable was proxied as the average firm-level wage for the 2018/19 financial year. This is based on the monotonic relationship between firm productivity and firm-level average wages. Arguably superior measures of productivity such as gross value added per worker were unavailable due to limitations of the administrative data. A lagged variable was chosen to avoid volatility associated with the COVID-19 period.
Employment change (ΔE) was then regressed on productivity (LP), for the 3 different periods, for the CJRS and non-CJRS populations. Controls, denoted by FE, for initial firm size, sector and region were included in the regression model. The model specification is included below:
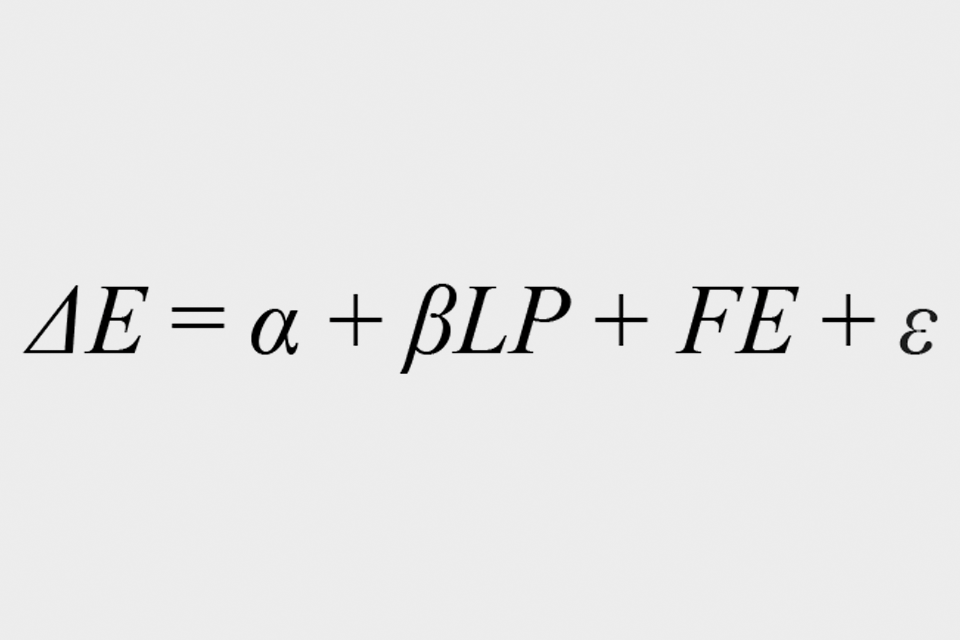
A positive coefficient on the productivity variable indicated that labour reallocation was productivity-enhancing in that period, with a larger coefficient implying that labour reallocation was more productivity-enhancing in the period. The difference in employment growth for low productivity and high productivity firms was then compared, by computing plus or minus 1 standard deviation from the mean firm productivity in the regression model.
4.12.2 Datasets
For this analysis, a dataset was used which joined CJRS and PAYE RTI data, in order to track number of employments, firm-level wages, and usage of the CJRS.
4.12.3 Definitions
Firms are defined as part of the CJRS population if they have at least one employment on furlough in the duration of the period, and non-CJRS if they have no employments on furlough.
4.12.4 Additional information
Methodology for the analysis follows previous work by the OECD into labour reallocation following the COVID-19 shock.
4.13 Impact of the CJRS on individuals becoming detached from the labour market (evidenced in Chapter 7)
4.13.1 Aim of the analysis
The labour market outcomes analysis aims to provide an understanding of the impact of the CJRS on employees who subsequently spent a significant time outside of the labour market. The analysis uses data from HMRC CJRS data and employment data from PAYE RTI. The aim of this analysis looks at the number of consecutive months that employees spent outside the labour market and observing whether the CJRS impacted this, with a focus on the months between January 2020 and June 2022.
January 2020 was chosen as it was 3 months before the CJRS started, allowing us to capture all individuals who were employed before the pandemic. June 2022 was chosen as it was 9 months after the CJRS ended. Therefore, analysis is not affected by the initial churn post CJRS closure.
The analysis focused on individuals who have been outside the labour market for 6 months or more. This is a significant period to be outside the labour market, and therefore, is considered as a potential proxy for an individual being economically inactive. ONS defines economic inactivity individual as individuals (over 16 years old) without a job who have not sought work in the last 4 weeks and/or are not available to start work in the next 2 weeks.
First, the analysis includes everyone who was employed at least once between January 2020 and September 2021, covering the entire CJRS (March 2020 and September 2021). This allows us to compare employees on furlough with employees not on furlough and then look at their employment status by June 2022, checking whether they are in employment or out of employment. If they are out of employment, how many months they have been out of employment is checked.
The above steps allow us to draw a parallel comparison between employments in the non-furlough and on furlough groups. This helps us interpret the impact on individuals leaving the labour market for more than 6 months.
Sensitivity analysis was performed to compare the results of the pandemic period (January 2020 to June 2022) to the pre-pandemic period (January 2017 to June 2019). The pre-pandemic analysis indicates how many employees left the labour market for more than 6 months and then returned. This helps us understand the change in the economic inactivity in the labour market. This sensitivity analysis produced complementary findings, adding robustness to the pandemic-period results.
The analysis results have been kept at a high level, breaking down only by age. This is because there are many factors which determine an individual being detached from the labour market and so if the analysis is broking down by other variables such as region and sector then the result will not be able to account for other interactions with other factors such as pay and scheme size. Therefore, it is best to look as the population as a whole.
4.13.2 Datasets
HMRC PAYE RTI data is used to capture whether each individual was employed during each month between January 2020 and June 2022, and then identify those employees who were employed at least once from January 2020 to September 2021.
For each individual, it is checked if they were employed in June 2022. If they were not in PAYE employment, the analysis then goes back each month to check when they were last employed. This allows us to calculate the number of months each individual has spent outside the labour market by June 2022.
For example, if an employee left the labour market in December 2021 and has not subsequently returned. It is checked if this individual was out of employment at June 2022 first. Next, the analysis then goes back each month (May 2022, April 2022, …) and find last month they were employed which would be November 2021. Therefore, in this example, this individual would be recorded as being out of labour market for 7 months.
Next, the analysis joins on the CJRS dataset which contains records of every individual who had been on furlough. This is joined to the dataset to determine who is in the on furlough group and non-furlough group. The non-furlough group contains 24,150,000 individuals and the on furlough group contains 10,705,000 individuals. As these groups are not directly comparable, due to difference in sizes, the analysis takes the proportion of individuals leaving the labour market for 6 months or more over the total number of individuals who have worked once between January 2020 and September 2021.
After this, the analysis is broken down by age, using RTI data. The age breakdowns used in the analysis are 0 to 17, 18 to 24, 25 to 49, 50 to 54, 55 to 59, 60 to 64 and 65+. The table below gives a breakdown of the population by age. Everyone in table 4.9 below has worked in PAYE at least once between January 2020 and September 2021. Each figure is rounded to the nearest 5,000.
Table 4.9: Age breakdowns of PAYE individuals, by furlough status
| Total population | 0-17 | 18 to 24 | 25 to 49 | 50 to 54 | 55-59 | 60 to 64 | 65+ | Unknown |
|---|---|---|---|---|---|---|---|---|
| Previously non-furlough | 1,075,000 | 3,005,000 | 12,745,000 | 2,440,000 | 2,385,000 | 960,000 | 755,000 | 785,000 |
| Previously on furlough | 360,000 | 1,805,000 | 5,580,000 | 1,015,000 | 1,030,000 | 455,000 | 340,000 | 115,000 |
4.13.3 Definitions
An individual is considered employed in a particular month if they were reported working for any period in that month by their employer. If an individual does not fulfil this condition, they are reported as ‘not employed’ for that month. It should be caveated that the analysis does not indicate the reason why these employees have been outside of PAYE. They could be ‘not employed’ for several reasons such as parental/caring leave. However, they could be detached from labour market by being economically inactive.
Likewise, the analysis considers an individual on furlough if they had been placed on furlough at any point in the time period. The analysis takes the age breakdown by finding out their date of birth from the RTI tables. This calculates the individual’s age on 1 January 2020. The analysis also removes any individuals who were deceased between January 2020 and June 2022.
4.13.4 Additional information
The analysis removes those individuals who were outside the PAYE labour market, but had filled out a self-assessment form that year. As the 2022 to 2023 tax year self-assessment data has not yet been collected, the analysis contains data on the 2019 to 2020, 2020 to 2021 and 2021 to 2022 tax years. This covers April 2019 to March 2020, April 2020 to March 2021 and April 2021 to March 2022 respectively.
Some employees on furlough are excluded from the analysis. This is because for these individuals, CJRS data could not be matched with PAYE RTI employment data, so it would not be possible to map their employment outcome.
4.14 CJRS redistributive benefits (evidenced in Chapter 8)
4.14.1 Aim of the analysis
The analysis looked to provide further understanding on the redistributive benefits of the CJRS by comparing the average wages of employments of the total and furlough populations. Mean and median wages for each were calculated to give insight into the income levels of each group. The 2018 to 2019, 2019 to 2020, and 2020 to 2021 financial years were all analysed. Wage quintiles for each population and year were also computed. Finally, the wages of employments were sorted into pay brackets and frequency distributions for each year and population were produced.
4.14.2 Datasets
The dataset used for the analysis included all employments of individuals who were eligible for the CJRS in the period from March 2020 to October 2020 (prior to the extension to November 2020). Payments from pension providers and missing values were removed. The total population included 43.3 million employments while the furlough population included 10.7 million employments. These figures are slightly lower than the CJRS Official Statistics for a few reasons:
- employments of individuals were only included if they were eligible for the March 2020 – October 2020 period of the CJRS to ensure consistency of annual earnings with previous years – meaning if an individual had employments that were only eligible for the CJRS from November 2020 onwards), they would not be included in this analysis
- employments had to be paid in either 2018 to 2019, 2019 to 2020 or 2020 to 2021
- some employees on furlough in the CJRS data are excluded from the analysis because the data could not be matched with PAYE RTI employment data and so it would not be possible to identify the pay of an employment
- It is also important to note that an employment will have been included even if it had ended or not been eligible for the CJRS, as long as the individual who the employments are associated with was eligible for the CJRS in the March to October 2020 period
4.14.3 Definitions
The total population was defined as all employments of individuals who were eligible for the CJRS in the March 2020 to October 2020 period. The furlough population included all those employments which used the CJRS.
4.15 CJRS equity benefits (evidenced in Chapter 8)
4.15.1 Aim of the analysis
This calculation is performed based on both mean and median incomes in order to provide a monetary range to quantify this benefit of the CJRS. As median is less impacted by outliers, it usually better reflects the outcomes of the overall population. However, given that redistribution is associated with inequality, in this case the mean may be more appropriate as it will account for inequality and high-income individuals more effectively. The OECD also highlights reductions in income inequality as a worthwhile outcome as widening income inequality can adversely affect economic growth.
4.15.2 Dataset
Informed by Green Book distributional weighting guidance, this effect is calculated by comparing the income of Users in absence of the scheme against the average income of all taxpayers in the UK, providing a relative measure of the impact of the scheme on income.
The average income for Users in the absence of the scheme is calculated in 2 stages – the first is to calculate the income of those individuals who would have lost their jobs in absence of the scheme (the 4 million population based on chapter 4 of the CJRS final evaluation). For these individuals, their income is assumed to be an average Universal Credit (UC) estimate. The second stage is calculating the income for those who would not have lost their jobs but whose income was nonetheless supported, an estimated 7.7 million. The average income in this analysis is of all Users. A weighted average is then calculated to give a final value. This figure is raised to the power 1.3, which is an adjustment to capture the positive benefits of reducing income inequalities (based on Green Book guidance). Finally, the figure is multiplied by the net spend of the scheme, (minus the total amount that would have been spent on universal credit payments, as well as error and fraud). This calculation is further outlined in the equation below:
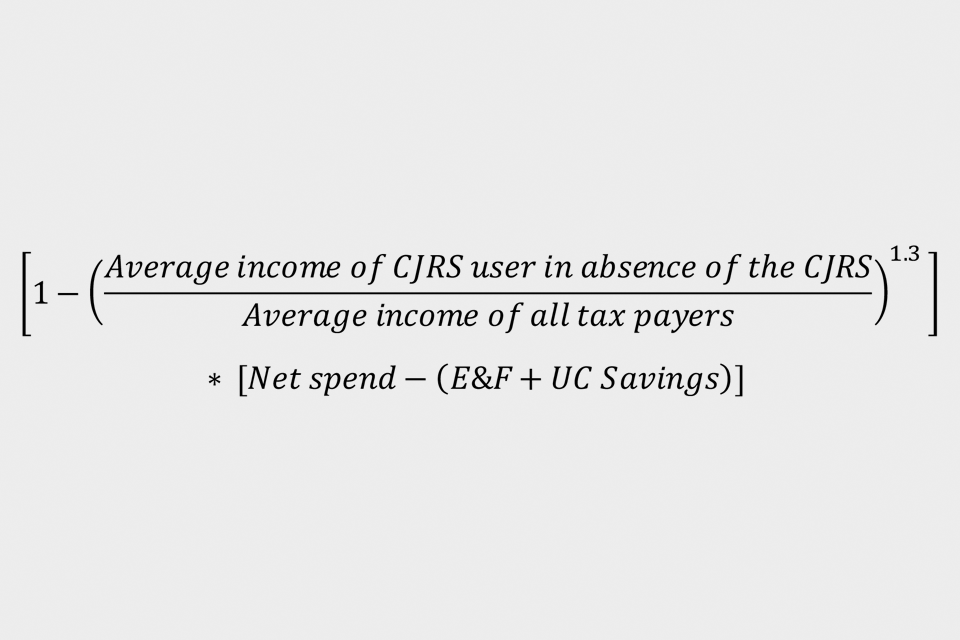
4.16 Universal Credit savings (evidenced in Chapter 8)
4.16.1 Aim of the analysis
The Department for Work and Pensions (DWP) have estimated the value of Universal Credit (UC) payments that would have occurred had individuals not received support from the CJRS. The aim of this analysis is to quantify the value of government benefits spending as a result of the CJRS. This means the cost of the scheme should consider that had jobs not been kept open by the CJRS, the number of people seeking to claim benefits support from DWP would have increased significantly, and so the cost of the CJRS should be interpreted as the cost only above and beyond this business as usual state.
4.16.2 Datasets
HMRC provided data based on the counterfactual methodology described in the CJRS final evaluation counterfactual technical note on the number of jobs protected by the CJRS, and an estimate of where in the income distribution these jobs protected would fall. Jobs protected by income band has been assumed to follow the income distribution of the overall furlough population, to provide a useful basis for the UC savings analysis. DWP used this data in the Policy Simulation model which is based on the Family Resource Survey (FRS).
The FRS was also used in the protected characteristics analysis. DWP take the FRS for the 2019 to 2020 tax year and project the population covered by the survey forward into the pandemic period in 2 ways. Firstly, they use the observable change in employment behaviour during the pandemic, and secondly they use the change in employment that would have occurred had the individuals that were identified as having their jobs protected by the CJRS instead became unemployed without the scheme. The difference in forecast Universal Credit payments between these 2 projections is taken as the estimated savings as a result of the CJRS.
While there is inherently some uncertainty in modelling, particularly in this scenario given the model is assessing the impact of the CJRS on UC claims during the COVID-19 pandemic, the model accounts for varying take-up rates and average UC payments of around £620 a month, and the fact that not all unemployed individuals would have been eligible for benefits, as benefits are assessed on a household basis. HMRC and HMT have not looked at furlough take-up by household characteristics that would impact Universal Credit eligibility. Consequently, some people may not have been eligible based on their partner’s income or savings, which the DWP model is able to manage through its micro-simulation modelling nature.
For this analysis, the volumes of jobs protected were segmented into income bands only, and not by any other characteristics. In running the simulation model, each PSM sample unit will have a different set of circumstances that affect how much UC they will receive, therefore the model already somewhat accounts for variation across the population of individuals on furlough. The sample units (who were all employed) chosen to have their income zeroed, representing the loss of their job, and calculate their UC award were selected randomly, so as to not bias any particular set of characteristics beyond income band in order to produce a representative estimate. Some of this variation may include varying numbers of children and disability status. Additionally, no adjustments have been made to decrease the amount of savings and capital people have.
There is evidence that suggests people did draw down on their savings to cope during the pandemic, and without the furlough scheme they may have drawn on even more, and the numbers drawing down may have increased. Modelling for this may have increased both the numbers flowing onto UC and their average gain, due to the £16,000 capital limit that disqualifies people from claiming UC and the fact that savings are tapered from the UC entitlement when calculating the final UC award.
A final limitation of this methodology is that it assesses the impact of the CJRS in isolation. It is possible that the partner’s income may also have been impacted by the pandemic if they were self-employed or they earned income from other sources, but this is challenging to capture robustly and risks double counting the savings from other interventions such as the SEISS. Nevertheless, this creates the possibility that these figures may slightly under-estimate the Universal Credit savings.
5. Additional information
5.1 Theory of change
A theory of change is a framework which sets out how an intervention, such as a policy or programme, is expected to work. It details inputs, such as financial investment and staff resource, and activities that will be conducted to implement that intervention and demonstrates how these are expected to lead to anticipated outputs, outcomes and impacts. It is often used as a tool to inform an evaluation. The theory of change for the CJRS can be found in the CJRS interim evaluation accompanying information document.
5.2 CJRS Policy timeline and associated grant levels
The CJRS policy timeline and associated grant levels can be found in the CJRS interim evaluation accompanying information document.
-
University of Essex, Institute for Social and Economic Research. (2021). Understanding Society: COVID-19 Study, 2020 to 2021. [data collection]. 11th Edition. UK Data Service. SN: 8644, DOI: 10.5255/UKDA-SN-8644-11. ↩
-
Table shows unequivalised median gross income deciles for all households. Analysis in the CJRS final evaluation uses income deciles for working age households. ↩
-
The justification for 2015 to 2019 values providing an indicator of the steady state values is that they occurred at a time when unemployment had stabilised at close to its estimated long-term level. ↩
-
The transition rate is the proportion of those employed (or unemployed or inactive) in one calendar quarter who remained or became employed (or unemployed or inactive) in the following calendar quarter. ↩
-
Separation rates are the proportion of those who were previously in employment who move into non-employment. ↩