Support for green finance and trusted messengers among UK homeowners: quantitative research (HTML)
Published 11 March 2026

© Crown copyright 2026
This publication is licensed under the terms of the Open Government Licence v3.0 except where otherwise stated. To view this licence, visit nationalarchives.gov.uk/doc/open-government-licence/version/3 or write to the Information Policy Team, The National Archives, Kew, London TW9 4DU, or email: psi@nationalarchives.gov.uk.
Where we have identified any third party copyright information you will need to obtain permission from the copyright holders concerned.
This publication is available at https://www.gov.uk/government/publications/support-for-green-finance-and-messengers-among-uk-homeowners/support-for-green-finance-and-trusted-messengers-among-uk-homeowners-quantitative-research-html
Acknowledgements:
Thank you to the Ipsos UK Public Affairs team for quality assuring this report.
Executive summary
We commissioned research among 876 UK owner-occupiers (adults who own the properties they occupy, either outright or on a mortgage). These respondents were asked questions regarding their willingness to use green loans and grants to help them decarbonise their homes, and which sources of information they trust for advice on decarbonising their homes. Primary findings from this research include:
Green finance
Half of owner-occupiers were not considering making home energy performance improvements. 26% were considering making improvements, but not willing to take a green loan to do so. 19% of owner-occupiers were willing to take a green loan to make improvements.
Owner-occupiers were more likely to say they were willing to take a green loan if they were: in households with annual incomes above £52,000, working full-time, graduates, male, or aged 25 to 44.
When owner-occupiers were presented with the hypothetical option of a government grant that would match the amount they borrowed through a green loan, twice as many said they would be willing to borrow.
Trusted messengers
More owner-occupiers selected government advice services as a trusted messenger than any other source for advice on: government green finance, private green finance, how to reduce energy bills, energy performance measures, and which tradesperson to use.
More owner-occupiers selected local authorities or councils as a trusted messenger for planning permission support than any other source.
Introduction
One fifth of UK territorial greenhouse gas emissions were from buildings and products in 2022.[footnote 1] Of these emissions, two-thirds were from residential buildings.[footnote 2] Over half of these residential buildings were owned by their occupants (for example, 65% in England).[footnote 3] Improving the energy performance of owner-occupied homes is therefore crucial to meeting our carbon budgets and reaching net zero emissions. Recent research found that upfront cost was owner-occupiers’ main barrier to installing insulation, double-glazing,[footnote 4] solar panels,[footnote 5] and low-carbon heating systems.[footnote 6] In addition to this, only around a third of owner-occupiers reported to know at least ‘a fair amount’ about the need to decarbonise homes and low-carbon heating systems.[footnote 7] Therefore, 2 important factors in decarbonising owner-occupied homes are:
- green finance—loans and grants to help owner-occupiers pay for measures to decarbonise their homes
- trusted messengers—the sources of information that owner-occupiers trust for advice on decarbonising their homes
There were evidence gaps around owner-occupiers’ willingness to take green loans and how government can affect this, and which messengers are most trusted at each stage of the decarbonisation journey. This research aimed to address these evidence gaps. The primary results are given in this report.
Methodology
We asked 3 questions on Ipsos UK’s KnowledgePanel, an omnibus survey that is issued periodically to a random probability-sampled panel of respondents. Further details on KnowledgePanel’s methodology and the questions we asked can be found in this report’s appendix.
Research fieldwork ran between the 14 March and 20 March 2024, and 876 respondents answered our survey questions. All respondents were aged 18 or over, were residents of the UK, and owned the property they occupied (either outright or on a mortgage).
Results
Green finance
Green finance willingness
Owner-occupiers were asked: ‘How much money, if any, would your household be willing to borrow through a private green loan to improve the energy performance of your home?’ (see Question 1 in the appendix). Half of owner-occupiers were not considering making energy improvements. 26% were considering making improvements, but not willing to take a green loan to do so. 19% of owner-occupiers were willing to take a green loan.
Figure 1. Proportion that would be willing to take a green loan to improve the energy performance of their home
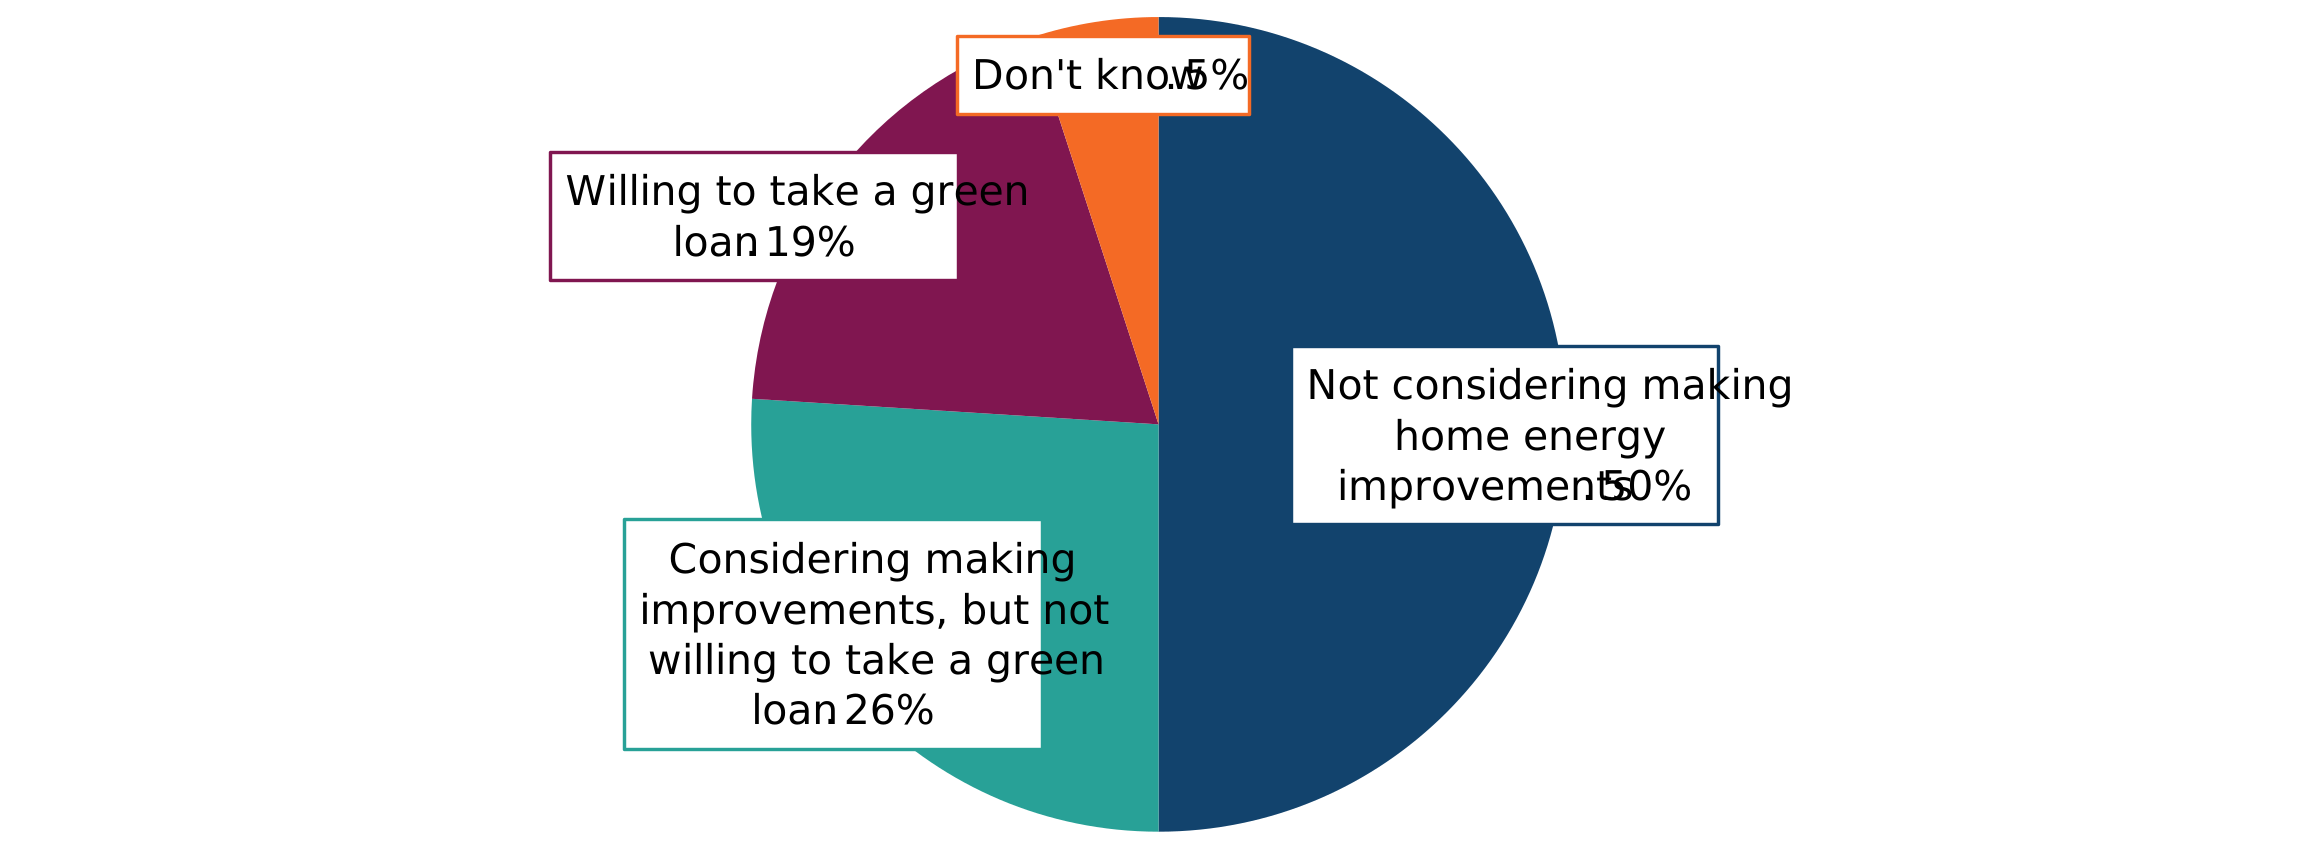
Weighted base size: All (n=876). This chart does not display n=2 ‘prefer not to say’ responses (0%).
Text alternative for Figure 1: This chart shows that 19% of respondents said they would be willing to take a green loan to pay for home energy improvements. 26% said they were considering making improvements but were not willing to take a green loan. 50% said they were not considering making home energy improvements. 5% reported not to know.
Owner-occupiers who were significantly more likely to say they were willing to take a green loan were those who were working full-time (27%, versus 13% among those who were not), those who had a degree (26%, versus 16% among non-graduates), and men (24%, versus 14% among women). There were no significant differences in willingness between those in different UK countries and regions and those of different occupation types.[footnote 8]
Green finance willingness by income
Owner-occupiers in households with annual household incomes under £52,000 were least likely to be willing to take a green loan. They were most likely to not be considering home energy improvements at all.
Owner-occupiers in households with annual household incomes over £100,000 were most likely to be willing to take a green loan (36%). This was followed by owner-occupiers in households with incomes between £52,000 and £99,999 (25%).
Figure 2. Proportion of each household income group that would be willing to take a green loan to improve the home energy performance of their home
| Annual household income | Not considering making home energy improvements | Considering making home energy improvements | Willing to take a green loan | Don’t know | Total |
|---|---|---|---|---|---|
| ≤£25,999 | 53% | 33% | 13% | 2% | 101% |
| £26,000-£51,999 | 53% | 27% | 17% | 3% | 100% |
| £52,000-£99,999 | 43% | 28% | 25% | 4% | 100% |
| ≥£100,000 | 39% | 23% | 36% | 3% | 101% |
Some bars may not sum to 100% due to rounding.
Weighted base sizes: All respondents with household income data (n=717). ≤£25,999: n=127. £26,000–£51,999: n=254. £52,000–£99,999: n=220. ≥£100,000: n=116.
Text alternative for Figure 2: This chart shows that 53% of owner-occupiers with annual household incomes of ≤£51,999 were not considering making home energy improvements. This is compared to 43% and 39% of owner-occupiers with annual household incomes of £52,000–£99,999 and ≥£100,000 respectively. This chart also shows that 25% and 36% of owner-occupiers with annual household incomes of £52,000–£99,999 and ≥£100,000 respectively were willing to take a green loan. This is compared to 13% and 17% of owner-occupiers with annual household incomes of ≤£25,999 and £26,000–£51,999.
Green finance willingness by age
Owner-occupiers aged 65 and over were most likely to not be considering making home energy improvements. Owner-occupiers aged 25 to 44 were most likely to be willing to take a green loan, followed by those aged 45 to 54. Owner-occupiers aged 18 to 24 were most likely to not know their answer to this question.
Figure 3. Proportion of each age group that would be willing to take a green loan to improve the energy performance of their home
| Age | Not considering making home energy improvements | Considering making home energy improvements | Willing to take a green loan | Don’t know | Total |
|---|---|---|---|---|---|
| 18‑24 | 45% | 22% | 14% | 18% | 99% |
| 25‑34 | 35% | 31% | 26% | 7% | 99% |
| 35‑44 | 44% | 24% | 30% | 2% | 100% |
| 45‑54 | 47% | 25% | 23% | 4% | 99% |
| 55‑64 | 46% | 30% | 20% | 5% | 101% |
| 65‑74 | 60% | 27% | 12% | 1% | 100% |
| ≥75 | 68% | 23% | 7% | 2% | 100% |
Some bars may not sum to 100% due to rounding.
Weighted base sizes: All respondents (n=876). This chart does not display n=2 ‘prefer not to say’ responses. 18 to 24: n=63. 25 to 34: n=109. 35 to 44: n=129. 45 to 54: n=160. 55 to 64: n=159. 65 to 74: n=135. ≥75: n=121.
Text alternative for Figure 3: This chart shows that 60% and 68% of owner-occupiers aged 65 to 74 and ≥75 respectively were not considering making home energy improvements, compared to proportions between 35% and 47% for younger age groups. This chart also shows that 26% and 30% of owner-occupiers aged 25 to 34 and 35 to 44 respectively were willing to take a green loan, compared to proportions between 7% and 23% for other age groups. 18% of owner-occupiers aged 18 to 24 reported ‘don’t know’ to this question, compared to between 1% and 7% for older age groups.
Green finance willingness with and without matched funding
Owner-occupiers were first asked if they would be willing to borrow through a private green loan to improve their home’s energy performance (see Question 1 in the appendix). They were then asked if they would be willing to borrow through a private green loan if the government gave them a grant that matched their borrowed amount (see Question 2 in the appendix).
Once the grant was offered, fewer owner-occupiers said they were not considering making energy performance improvements (50% without the grant and 40% with; see Figure 4), and the number of owner-occupiers who were considering making improvements but not willing to borrow almost halved (26% without the grant and 14% with) . Twice as many owner-occupiers were willing to borrow through a green loan once the grant was offered (19% without the grant and 40% with).
The same trend visible in Figure 2 (those with higher household incomes being more willing to take a private green loan) was found after a government grant was offered. Among a subgroup of owner-occupiers with annual household incomes above £52,000, 29% were willing to take a green loan without the grant and 52% with the grant).
Figure 4. Green finance willingness with and without matched funding from government
| Green finance willingness | How much money, if any, would your household be willing to borrow through a private green loan to improve the energy performance of your home? | And if government were to provide an additional grant to match any money you borrowed, so you would receive twice as much, how much money, if any, would your household be willing to borrow through a private green loan? |
|---|---|---|
| Not considering making home energy improvements | 50% | 40% |
| Considering making improvements but not willing to borrow | 26% | 14% |
| Willing to take a green loan | 19% | 40% |
Weighted base sizes: Without matched funding: all respondents (n=876); this chart does not display n=40 ‘don’t know’ responses (5%) and n=2 ‘prefer not to say’ responses (0%). With matched funding: all respondents (n=876); this chart does not display n=41 ‘don’t know’ (5%) and n=3 ‘prefer not to say’ responses (0%).
Text alternative for Figure 4: This chart shows the difference in owner-occupiers’ responses before and after a government grant was offered that matched the amount borrowed through a private green loan. 50% were not considering making home energy improvements before, versus 40% after. 26% were considering making improvements but not willing to borrow, versus 14% after. 19% were willing to take a green loan, versus 40% after.
Figure 5 shows how much money owner-occupiers were willing to borrow through a private green loan to improve their home’s energy performance without a government grant being offered and with a government grant being offered. When the grant was offered, the proportion of owner-occupiers willing to borrow almost doubled across each loan amount (for example, from 2% to 5% for loans of £999 or less, and from 3% to 7% for loans of £10,000 or more).
Figure 5. Green finance willingness with and without matched funding, by loan amount
| Green finance willingness | How much money, if any, would your household be willing to borrow through a private green loan to improve the energy performance of your home? | And if government were to provide an additional grant to match any money you borrowed, so you would receive twice as much, how much money, if any, would your household be willing to borrow through a private green loan? |
|---|---|---|
| Not considering making home energy improvements | 50% | 40% |
| Considering making improvements but not willing to borrow | 26% | 14% |
| Borrow ≤£999 | 2% | 5% |
| Borrow £1,000-£1,999 | 2% | 8% |
| Borrow £2,000-£4,999 | 5% | 10% |
| Borrow £5,000-£9,999 | 7% | 10% |
| Borrow ≥£10,000 | 3% | 7% |
For each column pair within a response category, the difference between the 2 columns is significant.
Weighted base sizes: Without matched funding: all respondents (n=876); this chart does not display n=40 ‘don’t know’ responses (5%) and n=2 ‘prefer not to say’ responses (0%). With matched funding: all respondents (n=876); this chart does not display n=41 ‘don’t know’ (5%) and n=3 ‘prefer not to say’ responses (0%).
Text alternative for Figure 5: This chart shows the difference in owner-occupiers’ responses before and after a government grant was offered that matched the amount borrowed through a private green loan. The amount owner-occupiers were willing to borrow increased after a grant was offered: from 2% to 5% for loans of £999 or less, from 2% to 8% for loans between £1,000 and £1,999, from 5% to 10% for loans between £2,000 and £4,999, from 7% to 10% for loans between £5,000 and £9,999, and from 3% to 7% for loans of £10,000 and above.
Trusted messengers
Owner-occupiers were asked the following question across 6 different subjects related to home decarbonisation (for example, private green loans and grants)[footnote 9]: ‘Which of the following, if any, would you trust to provide advice about the following subjects?’ For each subject, owner-occupiers were given a choice of 9 different messengers (see Question 3 in the appendix).
Bill reduction
Owner-occupiers were more likely to trust government advice services (for example, GOV.UK), energy suppliers, and non-government advice services than other messengers for advice on how they can reduce their energy bills, with 4 in 10 owner-occupiers selecting them as trusted sources. Banks and financial advisers were less often selected as trusted messengers for this type of advice.
Trusted messengers for advice on how to reduce energy bills did not differ extensively between age groups. However, friends and family fell from the most common trusted messenger for owner-occupiers aged 18 to 44 (49%) to one of the least for those aged 65 and over (21%). Banks and financial advisers saw a difference between owner-occupiers aged 18 to 34 (19%) and those aged 65 and over (1%).
Figure 6. Trusted messengers for advice about reducing energy bills
| Messengers for advice about reducing energy bills | Level of trust |
|---|---|
| Government advice services (e.g. GOV.UK) | 48% |
| An energy supplier | 44% |
| Non-government advice services | 41% |
| Friends or family | 36% |
| Your local authority or council | 29% |
| A tradesperson (e.g. a builder, plumber, gas fitter) | 28% |
| None of these | 7% |
| Bank or financial adviser | 7% |
| Other | 6% |
Weighted base size: All respondents (n=876). This chart does not display n=21 ‘don’t know’ responses (2%) and n=2 ‘prefer not to say’ responses (0%).
Text alternative for Figure 6: This chart shows the proportions of owner-occupiers who reported to trust the following messengers for advice about reducing energy bills: government advice services (48%), energy supplier (44%), non-government advice services (41%), friends or family (36%), local authority or council (29%), tradesperson (28%), none of these (7%), bank or financial adviser (7%), and other (6%).
Which measure to install
Owner-occupiers were more likely to trust government advice services (for example, GOV.UK) and tradespeople than other messengers for advice on which energy performance measures are best for their homes, with 4 in 10 selecting them as trusted sources.
Figure 7. Trusted messengers for advice about which energy performance measures are best
| Messengers for advice about which energy performance measures are best | Level of trust |
|---|---|
| Government advice services (e.g. GOV.UK) | 44% |
| A tradesperson (e.g. a builder, plumber, gas fitter) | 40% |
| An energy supplier | 31% |
| Non-government advice services | 30% |
| Your local authority or council | 29% |
| Friends or family | 26% |
| None of these | 9% |
| Other | 6% |
| Bank or financial adviser | 3% |
Weighted base size: All respondents (n=876). This chart does not display n=40 ‘don’t know’ responses (5%) and n=1 ‘prefer not to say’ response (0%).
Text alternative for Figure 7: This chart shows the proportions of owner-occupiers who reported to trust the following messengers for advice about which energy performance measures are best for their homes, in descending order: government advice services (44%), tradesperson (40%), energy supplier (31%), non-government advice services (30%), local authority or council (29%), friends or family (26%), none of these (9%), other (6%), and bank or financial adviser (3%).
Which tradesperson to choose
Owner-occupiers were more likely to trust government advice services (for example, GOV.UK), tradespeople, and friends and family than other messengers for advice on who to use to install energy performance improvements in their homes, with over a third of owner-occupiers selecting each of these sources as trusted.
Figure 8. Trusted messengers for advice about who to use to install energy performance improvements
| Messengers for advice about who to use to install energy performance improvements | Level of trust |
|---|---|
| Government advice services (e.g. GOV.UK) | 38% |
| A tradesperson (e.g. a builder, plumber, gas fitter) | 38% |
| Friends or family | 36% |
| Your local authority or council | 30% |
| Non-government advice services | 29% |
| An energy supplier | 28% |
| None of these | 8% |
| Other | 5% |
| Bank or financial adviser | 2% |
Weighted base size: All respondents (n=876). This chart does not display n=36 ‘don’t know’ responses (4%) and n=1 ‘prefer not to say’ response (0%).
Text alternative for Figure 8: This chart shows the proportions of owner-occupiers who reported to trust the following messengers for advice about who to use to install energy performance improvements, in descending order: government advice services (38%), tradesperson (38%), friends of family (36%), local authority or council (30%), non-government advice services (29%), energy supplier (28%), none of these (8%), other (5%), and bank or financial adviser (2%).
Planning permission
As might be expected, owner-occupiers were more likely to trust their local authority or council than other messengers for advice on support with any planning permission needed to install energy performance improvements, with 6 in 10 owner-occupiers selecting them as a trusted messenger. Government advice services (for example, GOV.UK) were the next most likely to be trusted, with 4 in 10 selecting them.
Figure 9. Trusted messengers for support with any planning permission needed to install energy performance improvements
| Messengers for support with any planning permission needed to install energy performance improvements | Level of trust |
|---|---|
| Your local authority or council | 64% |
| Government advice services (e.g. GOV.UK) | 46% |
| Non-government advice services | 29% |
| A tradesperson (e.g. a builder, plumber, gas fitter) | 28% |
| Friends or family | 17% |
| An energy supplier | 15% |
| None of these | 7% |
| Bank or financial adviser | 4% |
| Other | 3% |
Weighted base size: All respondents (n=876). This chart does not display n=35 ‘don’t know’ responses (4%) and n=1 ‘prefer not to say’ response (0%).
Text alternative for Figure 9: This chart shows the proportions of owner-occupiers who reported to trust the following messengers for support with any planning permission needed to install energy performance improvements, in descending order: your local authority or council (64%), government advice services (46%), non-government advice services (29%), tradesperson (28%), friends or family (17%), energy supplier (15%), none of these (7%), bank or financial adviser (4%), and other (3%).
Government funding
Perhaps unsurprisingly, owner-occupiers were more likely to trust government advice services for advice on government grants and loans to help fund home energy performance improvements, with 6 in 10 owner-occupiers selecting them as a trusted messenger. Local authorities and councils, and non-government advice services, were also perceived as trusted sources for this type of advice, with 4 in 10 selecting them.
Figure 10. Trusted messengers for advice about government grants and loans to help fund home energy performance improvements
| Messengers for advice about government grants and loans to help fund home energy performance improvements | Level of trust |
|---|---|
| Government advice services (e.g. GOV.UK) | 65% |
| Your local authority or council | 40% |
| Non-government advice services | 40% |
| An energy supplier | 22% |
| Friends or family | 20% |
| Bank or financial adviser | 17% |
| A tradesperson (e.g. a builder, plumber, gas fitter) | 12% |
| None of these | 8% |
| Other | 3% |
Weighted base size: All respondents (n=876). This chart does not display n=38 ‘don’t know’ responses (4%) and n=1 ‘prefer not to say’ response (0%).
Text alternative for Figure 10: This chart shows the proportions of owner-occupiers who reported to trust the following messengers for advice about government grants and loans to help fund home energy performance improvements, in descending order: government advice services (65%), your local authority or council (40%), non-government advice services (40%), an energy supplier (22%), friends or family (20%), bank or financial adviser (17%), tradesperson (12%), none of these (8%), and other (3%).
Private funding
While we might expect banks and financial advisers to be popular choices for advice on private green loans and grants, only 25% of owner-occupiers selected them as a trusted source for this type of advice. Owner-occupiers were more likely to trust government advice services (53%), non-government advice services (35%), and local authorities or councils (32%). Energy suppliers, friends and family, and tradespeople, were less often selected as trusted messengers for this type of advice.
Figure 11. Trusted messengers for advice about private green loans and grants
| Messengers for advice about private green loans and grants | Level of trust |
|---|---|
| Government advice services (e.g. GOV.UK) | 53% |
| Non-government advice services | 35% |
| Your local authority or council | 32% |
| Bank or financial adviser | 25% |
| An energy supplier | 20% |
| Friends or family | 19% |
| None of these | 13% |
| A tradesperson (e.g. a builder, plumber, gas fitter) | 10% |
| Other | 3% |
Weighted base size: All respondents (n=876). This chart does not display n=43 ‘don’t know’ responses (5%) and n=4 ‘prefer not to say’ responses (0%).
Text alternative for Figure 11: This chart shows the proportions of owner-occupiers who reported to trust the following messengers for advice about private green loans and grants, in descending order: government advice services (53%), non-government advice services (35%), local authority or council (32%), bank or financial adviser (25%), energy supplier (20%), friends or family (19%), none of these (13%), tradesperson (10%), and other (3%).
Appendix
Additional details on methodology
Ipsos UK’s KnowledgePanel is a probability survey panel with selection based on a random sample of UK households.[footnote 10] To recruit this panel, Ipsos sent letters to random UK addresses using the Royal Mail’s Postcode Address File, inviting up to 3 members of each household (aged 16+) to join. Individuals could register to join the panel via the Internet, telephone, or post. There are currently around 30,000 panellists. This group is periodically topped up.
As an incentive, panellists receive points when joining the panel and for every survey completed. Points can be exchanged for vouchers that can be used with a range of online and high street retailers. Panellists are restricted to a maximum of one survey invitation per week to avoid over-researching. Digitally excluded panellists are offered a tablet with free data and technical support to complete the survey. The online questionnaire is compatible with screen readers.
For our questions specifically, a maximum of one member of each recruited household was permitted to answer. Results were weighted by age, gender, UK region, ethnicity, IMD quintile, education level, and number of adults in the household.
Question module
Module intro text
We’d now like to ask you some questions about actions some people may consider taking to improve the energy performance of their home.
Question 1:
Ask all who buy their home on mortgage (tenure=1) or own it outright (tenure=2). Single code. Reverse scale for half respondents.
As you may know or have heard, homeowners in the UK can apply for a ‘green loan’ to pay for improvements to the energy performance of homes (for example, to install insulation, solar panels, and/or a heat pump). Green loans are provided through private providers, such as banks or credit unions, following a home energy efficiency assessment from a registered assessor. They typically have interest rates which are lower than standard loans, ranging between 0% and 5%.
How much money, if any, would your household be willing to borrow through a private green loan to improve the energy performance of your home? Please select one option only.
1. Nothing – I am not considering making home energy improvements. 2. Nothing – I am considering making home energy improvements but would not be willing to borrow through a private green loan. 3. Borrow between £1 and £999. 4. Borrow between £1,000 and £1,999. 5. Borrow between £2,000 and £4,999. 6. Borrow between £5,000 and £9,999. 7. £10,000 or more. 998. Don’t know. 999. Prefer not to say.
Question 2:
Ask all who buy their home on mortgage (tenure=1) or own it outright (tenure=2). Single code. Reverse scale for half of respondents. Info box: question mark next to ‘green loan’ and have the following definition pop up if respondents hover over: “Homeowners in the UK can apply for a ‘green loan’ to pay for improvements to the energy performance of homes (for example, to install insulation, solar panels, and/or a heat pump). Green loans are provided through private providers, such as banks or credit unions, following a home energy efficiency assessment from a registered assessor. They typically have interest rates which are lower than standard loans, ranging between 0% and 5%.”
And if the government were to provide an additional grant to match any money you borrowed, so that you would receive twice as much, how much money, if any, would your household be willing to borrow through a private green loan? Please select one option only.
1. Nothing – I am not considering making home energy improvements.
2. Nothing – I am considering making home energy improvements but would not be willing to borrow through a private green loan.
3. Borrow £1 to £999 and receive an additional government grant of £1 to £999.
4. Borrow £1,000 to £1,999 and receive an additional government grant of £1,000 to £1,999.
5. Borrow £2,000 to £4,999 and receive an additional government grant of £2,000 to £4,999.
6. Borrow £5,000 to £9,999 and receive an additional government grant of £5,000 to £9,999.
7. Borrow £10,000 or more and receive an additional government grant of £10,000 or more.
998. Don’t know.
999. Prefer not to say.
Question 3:
Loop/statement question format. Ask all who buy their home on mortgage (tenure=1) or own it outright (tenure=2). Multiple code per statement S1–S6.
Which of the following, if any, would you trust to provide advice about the following subjects? You can select one or more options per statement.
Randomise statements S1–S6:
S1. How to reduce your energy bills.
S2. Which energy performance measures are best for your home (e.g. insulation, solar panels, and/or a heat pump).
S3. Who to use to install energy performance improvements in your home.
S4. Support with any planning permission needed to install energy performance improvements.
S5. Government grants and loans to help fund home energy performance improvements.
S6. Private green loans and grants.
Randomise statements 1–7:
1. Government advice services (e.g. GOV.UK).
2. Non-government advice services (e.g. Citizens Advice).
3. Your local authority or council.
4. A tradesperson (e.g. a builder, plumber, gas fitter).
5. An energy supplier.
6. Bank or financial adviser.
7. Friends or family.
8. Other [fix].
9. None of these [fix, exclusive].
998. Don’t know [fix, exclusive].
999. Prefer not to say [fix, exclusive].
-
DESNZ (2024) ‘UK greenhouse gas statistics 1990 to 2022’ ↩
-
DESNZ (2024) ‘UK greenhouse gas statistics 1990 to 2022’ ↩
-
MHCLG (2023) ‘English Housing Survey 2022 to 2023’ ↩
-
DESNZ (2023) ‘Public attitudes tracker, winter 2022: Heat and energy in the home’ ↩
-
DESNZ (2024) ‘Public attitudes tracker, spring 2024: Heat and energy use in the home’ ↩
-
DESNZ (2024) ‘Public attitudes tracker, winter 2023: Heat and energy in the home’ ↩
-
DESNZ (2024) ‘Public attitudes tracker, spring 2024: Heat and energy use in the home’ ↩
-
NS-SEC occupation types included: ‘managerial, administrative, and professional occupations’, ‘intermediate occupations’, ‘small employers and own account workers’, ‘lower supervisory and technical occupations’, ‘semi-routine and routine occupations’, ‘long-term unemployed or never worked’, and ‘full-time student’. ↩
-
These 6 subjects were: reducing energy bills, which performance measures to install, who to use to make performance improvements, support with any planning permissions needed, government grants and loans to help fund improvements, and private green loans and grants. ↩
-
Ipsos (2022) ‘UK KnowledgePanel’ (PDF) ↩