Alcohol and drug treatment in secure settings 2019 to 2020: report
Published 28 January 2021
Applies to England

© Crown copyright 2021
This publication is licensed under the terms of the Open Government Licence v3.0 except where otherwise stated. To view this licence, visit nationalarchives.gov.uk/doc/open-government-licence/version/3 or write to the Information Policy Team, The National Archives, Kew, London TW9 4DU, or email: psi@nationalarchives.gov.uk.
Where we have identified any third party copyright information you will need to obtain permission from the copyright holders concerned.
This publication is available at https://www.gov.uk/government/statistics/substance-misuse-treatment-in-secure-settings-2019-to-2020/alcohol-and-drug-treatment-in-secure-settings-2019-to-2020-report
1. Main findings
1.1 Treatment numbers and substance use
There were 52,891 adults in alcohol and drug treatment in prisons and secure settings between 1 April 2019 and 31 March 2020.
Around 62% (32,988) of these people started treatment during this year. Of the people starting treatment, half (50%) said they had a problem with opiate use, the same proportion as the previous year.
Of the people starting treatment with opiate problems, 78% also had a problem with crack cocaine, a 3% increase from the previous year.
1.2 Adults leaving treatment
A total of 34,378 people left treatment in secure settings in 2019 to 2020.
Just over a quarter (26%) of those were discharged after completing their treatment free of dependence, compared to 27% last year.
People in the opiate group had the lowest rate of successfully completing their treatment at 12%, compared with between 40% and 41% for the other substance groups.
1.3 Deaths in treatment
There were 38 people who died while they were in treatment in 2019 to 2020. This is a 30% decrease compared to the previous year when 54 people died.
1.4 Young people’s treatment
There were 1,186 young people receiving treatment for drug and alcohol problems in secure settings in 2019 to 2020.
Cannabis was the most common problem substance among young people in treatment in secure settings (93%).
Of the 946 young people who left treatment in secure settings in 2019 to 2020, 28% completed their treatment successfully.
Most young people (94%) had a triage assessment within one week of arriving in a secure setting, and 90% of those starting treatment started their first intervention within one week of triage.
2. Adults in treatment: overview
2.1 Definitions
The National Drug Treatment Monitoring System (NDTMS) statistics report presents information on adults (aged 18 and over) who were receiving help in prisons and secure settings in England for problems with drugs and alcohol in the period 1 April 2019 to 31 March 2020.
Many people experience difficulties with and receive treatment for both substances. While they often share many similarities, they also have clear differences, so this report divides people in treatment into the 4 substance groups which are:
- opiate – people who are dependent on or have problems with opiates, mainly heroin
- non-opiate – people who have problems with non-opiate drugs only, such as cannabis, crack and ecstasy
- non-opiate and alcohol – people who have problems with both non-opiate drugs and alcohol
- alcohol only – people who have problems with alcohol but do not have problems with any other substances
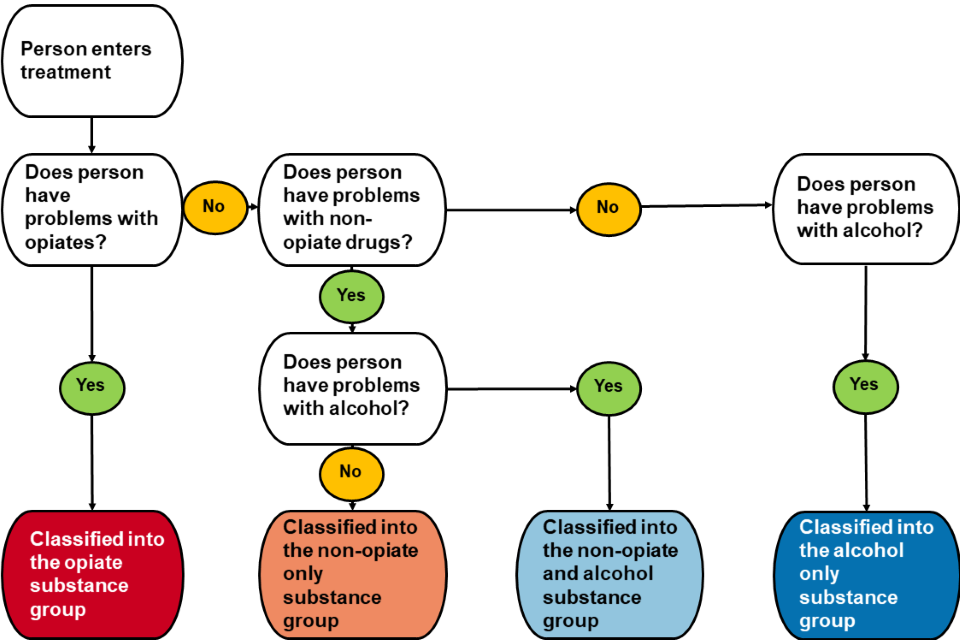
Figure 1: How people are classified into substance reporting group
See below for a text description of the flowchart showing how people are classified into substance reporting group after entering treatment and undergoing initial assessment. People with an opiate problem are placed in the opiate substance group regardless of whether other substances are also problematic. For all other individuals, they are categorised as non-opiate only, non-opiate and alcohol, or alcohol only.
Question 1: Does the person have problems with opiates?
- Yes: Person is classified into the opiate substance group
- No: Go to question 2
Question 2: Does the person have a problem with non-opiate drugs?
- Yes: Go to question 3
- No: Go to question 4
Question 3: Does the person have problems with alcohol?
- Yes: Person is classified into non-opiate and alcohol substance group
- No: Person is classified into non-opiate only substance group
Question 4: Does the person have problems with alcohol?
- Yes: Person is classified into alcohol-only substance group
2.2 Numbers in treatment
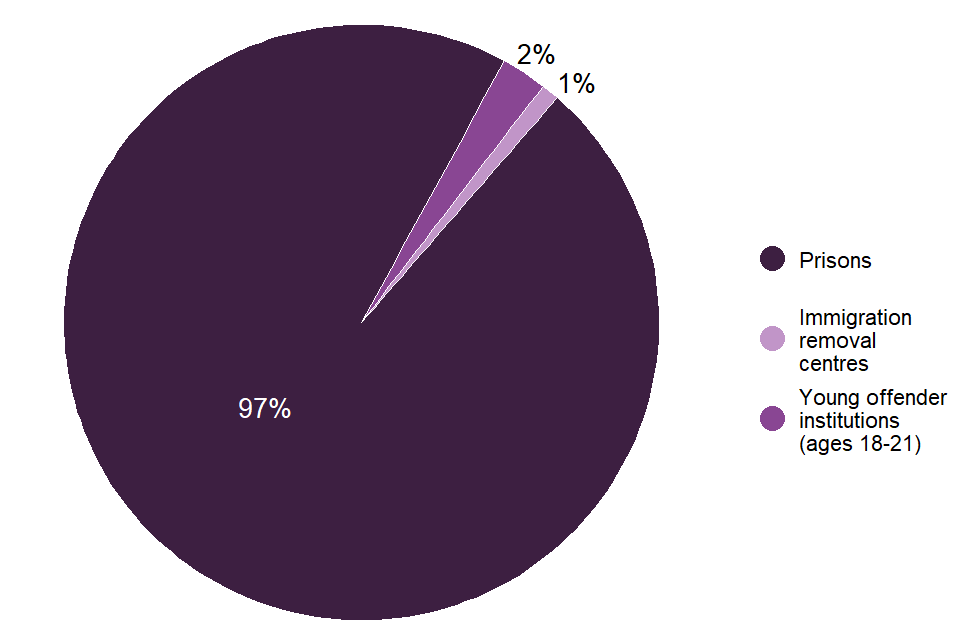
Figure 2: Adults in treatment by setting
There were 52,891 adults receiving treatment for drug and alcohol problems in secure settings between April 2019 and March 2020. Most adults received structured treatment in prison (97%), either in a local, training, high security or open prison. The remaining 3% received treatment in young offender institutions (2%) and immigration removal centres (1%).
You can find a definition of structured treatment in our community alcohol and drug treatment business definitions guidance.
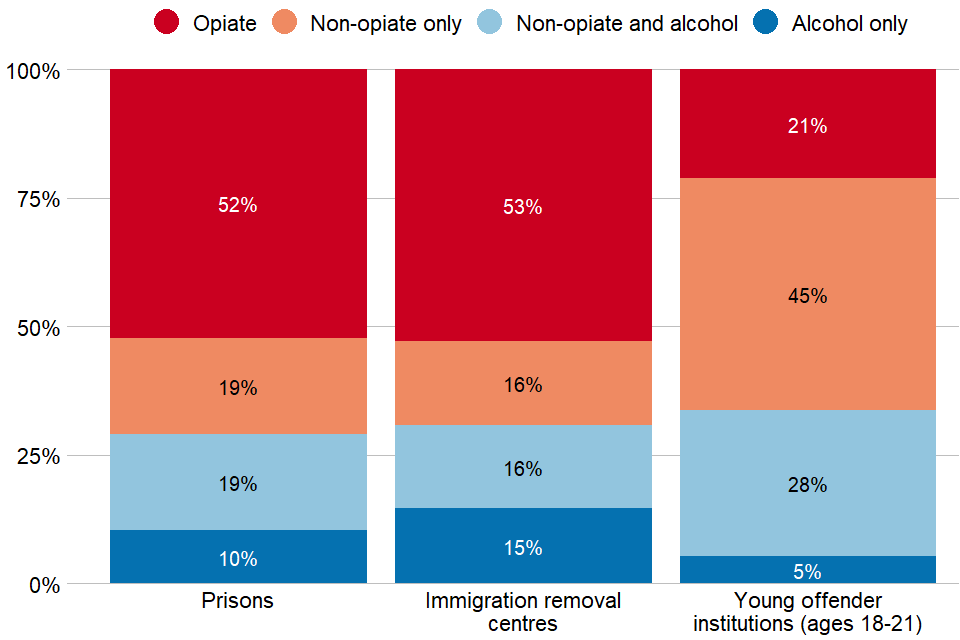
Figure 3: Adults in treatment by substance group and setting
In prisons and immigration removal centres, the largest drug category was the opiate group (52% and 53% respectively). Most people in young offender institutions (73%) were treated for non-opiate drug use, with 21% reporting opiate use. Non-opiate drug use was reported by 38% of people in drug and alcohol treatment in prisons and 32% of people in immigration removal centres. A higher proportion of people were treated for alcohol-only (15%) in immigration removal centres than in other areas of the secure estate (10% in prisons and 5% in young offender institutions).
2.3 Sex
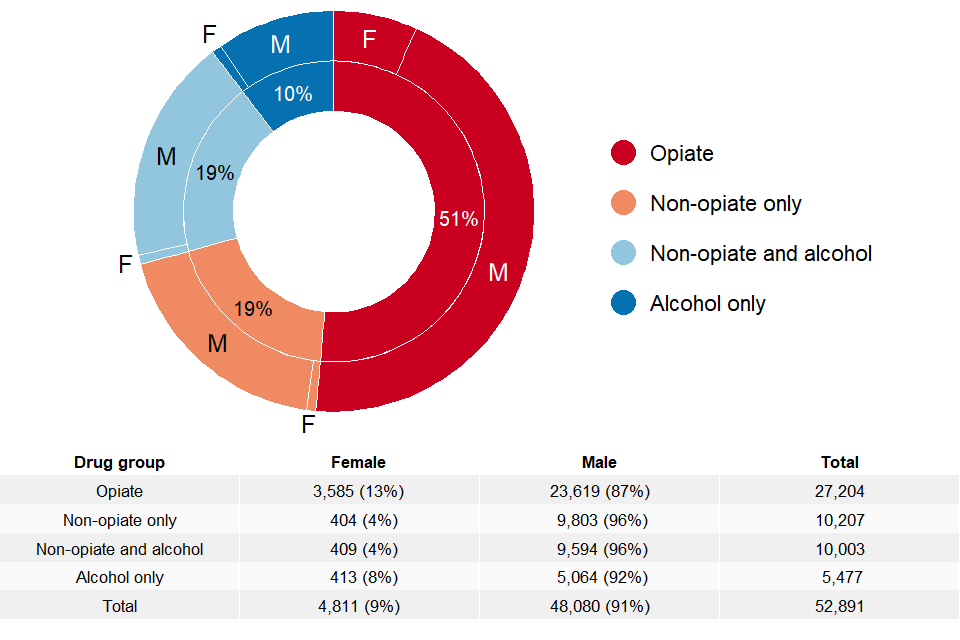
Figure 4: Breakdown of adults in treatment by sex and substance group
Ninety-one percent (48,080) of the people in treatment in adult secure settings were men and 9% (4,811) were women. This is more than double the proportion of women in the total prison population (which was 4% at the end of March 2020, as reported by Her Majesty’s Prison and Probation Service (HMPPS) offender equalities annual report. The proportion of women in each substance group ranged from 13% (3,585) in the opiate group to 4% in both the non-opiate only group (404) and the non-opiate and alcohol group (409).
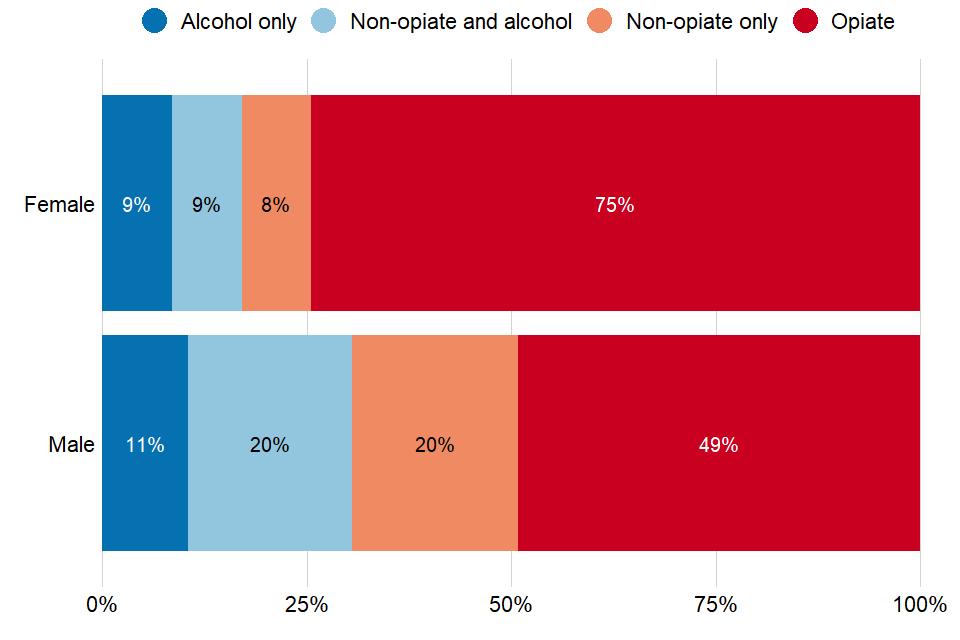
Figure 5: Proportion of substance groups by sex
The substance groups showed large differences by sex. Three-quarters of women (75%) in treatment had problems with opiate use compared with 49% of men. The other 25% of women were split almost evenly across the other treatment groups with 9% in both the alcohol only group and the non-opiate and alcohol group, and 8% in the non-opiate only group. Non-opiate drug use was the second most common among males, with 40% reporting this (20% in both non-opiate and non-opiate and alcohol groups). Eleven percent of males reported using alcohol only.
2.4 Age
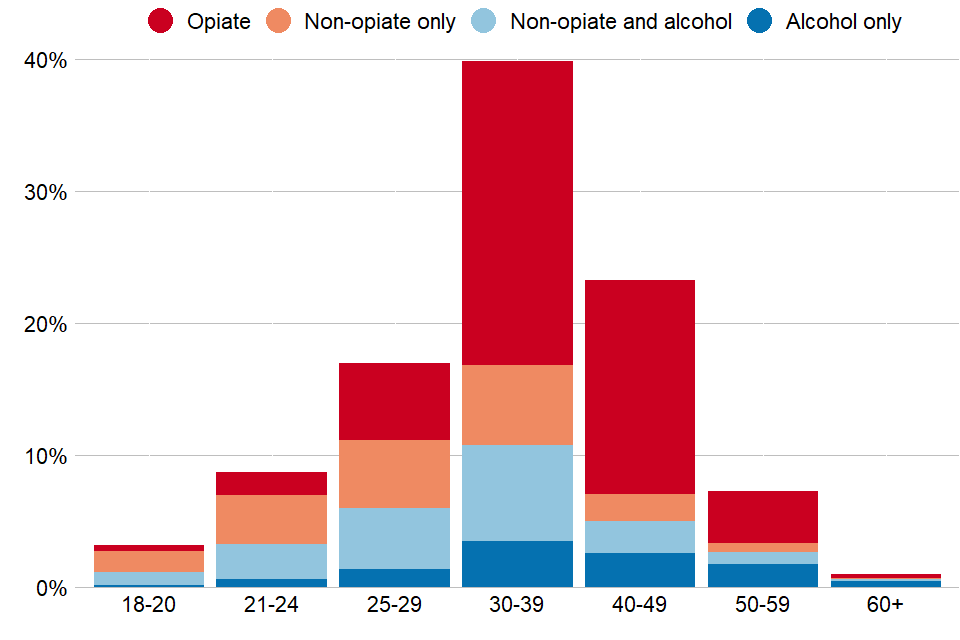
Figure 6: Age of people in treatment
The most common age range for adults in treatment in a secure setting was 30 to 39 years old. The largest drug group in this age group was opiates. This was also the largest drug group in 40 to 49 year olds, which was the second most common age range, and 50 to 59 year olds. The third and fourth most common age ranges were 25 to 29 and 21 to 24 respectively. People in the non-opiate and alcohol and non-opiate only groups make up the largest populations in these age ranges.
The median age of people in treatment for alcohol alone and those in treatment for opiate use was 38 years. This compares with 46 years and 41 years respectively for people in treatment in the community.
People in the non-opiate and alcohol and non-opiate only groups had median ages of 31 years and 29 years respectively (the median ages were 34 years and 30 years in community treatment).
Adults in alcohol and drug treatment in prisons tended to be younger than those in community-based treatment. Although, like community treatment, adults being treated for alcohol problems only or opiates tended to be older than those treated for other substances.
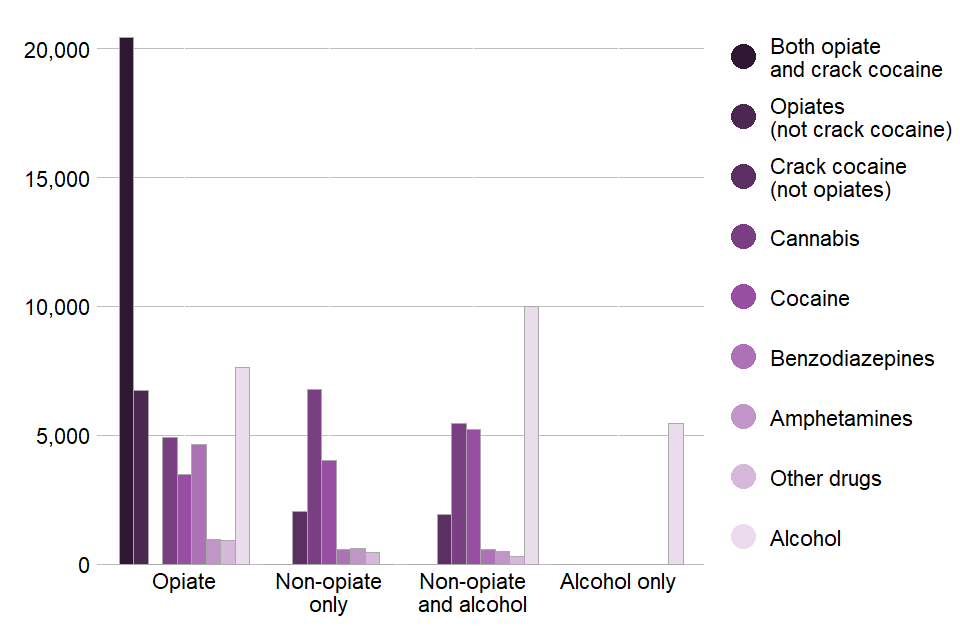
Figure 7: Substances by group for people in treatment (count of all problem substances reported)
Up to 3 substances can be recorded at the start of treatment, so a person may be counted more than once within the substance group in which they are reported in the chart above.
Of the people in treatment:
- 59% said they had a problem with opiate or crack use
- 44% said they had a problem with alcohol
- 10% said they had a problem with alcohol alone
- 32% said they had a problem with cannabis
- 24% said they had a problem with powder cocaine
Of the people with opiate problems:
- 75% said they had a problem with crack cocaine
- 28% said they had a problem with alcohol
- 17% said they had a problem with benzodiazepines
In the non-opiates only group, the most reported drug was cannabis, followed by cocaine and then crack. In the non-opiate and alcohol group, alcohol was the most reported drug, with almost double the number of people reporting it compared to the next most common drug. Cannabis and cocaine were the next most reported drugs in this group, followed by crack.
New psychoactive substances (NPS) were a problem for 10% of people in treatment in secure settings. This is not a reflection of overall NPS use in prisons.
3. People starting treatment: pathways, age, substances
3.1 Pathways into treatment
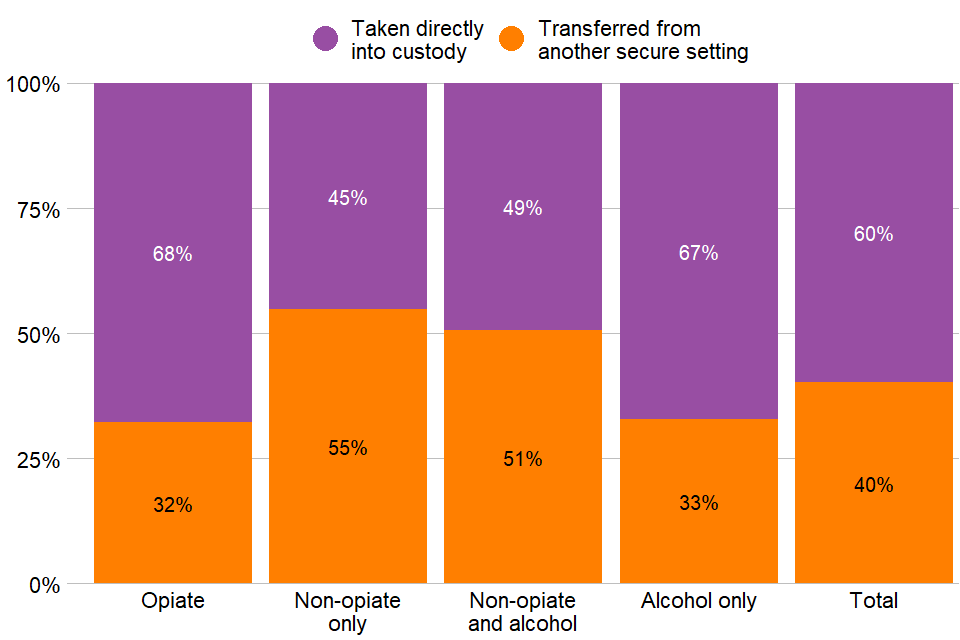
Figure 8: Pathway into treatment for adults starting treatment in 2019 to 2020
Over half (60%) of the people starting treatment in an adult secure setting between 2019 and 2020 were taken directly into custody or detention from the community. The other 40% started treatment after being transferred from another secure setting. Most people starting treatment for opiate use or alcohol use only came directly into custody from the community (68% and 67% respectively). In the non-opiate only and non-opiate and alcohol groups, just over half came into treatment after being transferred from another secure setting (55% and 51% respectively).
Most of the adults starting treatment who were taken directly into custody from the community (62%) started treatment immediately on arrival.
Eighty-nine percent of people who started treatment after beginning a new stay in custody started it within 3 weeks of arrival. However, 38% of people transferring from another secure setting took more than 3 weeks to start treatment.
3.2 Age and substances used

Figure 9: Substances by group for people starting treatment in 2019 to 2020 (count of all problem substances reported)
There were 32,988 people who started treatment for drug and alcohol problems in a secure setting in 2019 to 2020. This is where a person started a new treatment episode, which might also include returning to treatment.
Of the people starting treatment:
- 50% said they had a problem with opiate use
- 45% said they had a problem with alcohol
- 12% said they had a problem with alcohol alone
- 32% said they had a problem with cannabis
- 24% said they had a problem with cocaine
Of the people with opiate problems:
- 78% said they had a problem with crack cocaine
- 28% said they had a problem with alcohol
- 17% said they had a problem with cannabis
- 16% said they had a problem with benzodiazepines
Six in ten (60%) non-opiate users reported having problems with cannabis (66% for people in the non-opiate only group and 53% for people in the non-opiate and alcohol group). Just over a third (39%) of the non-opiate only group reported problems with cocaine powder at the start of treatment, compared to over half (52%) of the non-opiate and alcohol group. In the non-opiate and alcohol group, alcohol was the most reported drug, with almost double the number of people reporting it compared to the next most common drug.
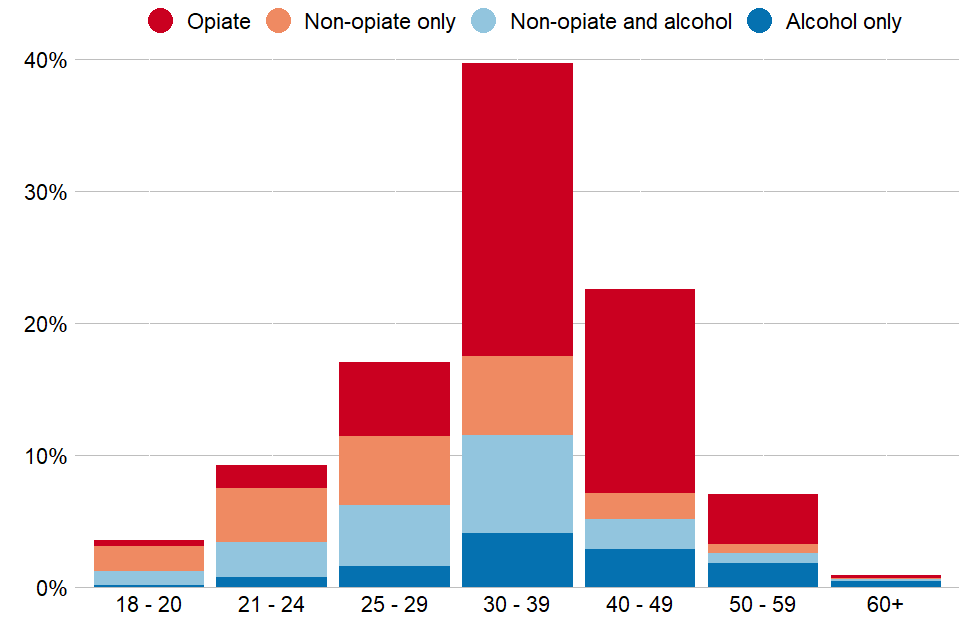
Figure 10: Adults starting treatment by age
Younger adults (aged 18 to 20) were most likely to start treatment reporting problems with cannabis (76%), alcohol (38%), cocaine (32%) or opiates (12%).
Most people that started treatment (62%) were between the ages of 30 and 49 and said they had problems with opiates (60%). People that started treatment saying they had problems with non-opiates were generally younger, with 85% aged under 40 (83% for the non-opiate and alcohol group and 87% for the non-opiate only group). Those that started treatment saying they had problems with only alcohol tended to be older, with 52% of people aged 60 or over.
4. Mental health
Over a third (37%) of people starting treatment were identified as having a mental health need. The highest proportion was seen in the opiate group (41%), compared to 30% in the non-opiate only group.
The mental health needs recorded in NDTMS should reflect the needs identified by prison healthcare staff or identified in the community before the person was in the secure setting.
5. Injecting drugs

Figure 11: Injecting status of people starting treatment in 2019 to 2020
Most people starting treatment in 2019 to 2020 had never injected (64%). People in the opiate group were most likely to be currently injecting (32%) compared to less than 2% for all other groups. Just over a quarter (27%) of people in the opiate group reported previously injecting compared to 9% in the non-opiate only group, 10% in the non-opiate and alcohol group, and 5% in the alcohol only group.
6. Parental status and safeguarding children
6.1 Parental status
| Parental status | % |
|---|---|
| Not parent and not in contact with children | 48 |
| Parent not with children | 38 |
| Other contact living with children | 8 |
| Parent living with children | 6 |
Figure 12: Parental status of people starting treatment in 2019 to 2020
Fourteen percent of people starting treatment in 2019 to 2020 were living with children, either their own or someone else’s, before coming into the secure setting. This was less than the previous year when 25% were living with their own or someone’s else’s children before starting treatment.
Most people starting treatment were not in contact with children. Almost half (24,981, 48%) reported that they were not parents and a further 19,879 (38%) people said they were parents but did not currently live with their children. Again, this was more than those who were not living with their children in the previous year (28%).
6.2 Safeguarding and early help

Figure 13: Children receiving early help or in contact with children’s social care
Eighty-two percent of the children of people starting treatment had no contact with children’s services. Seven percent of people starting treatment had a looked after child, though this figure was higher in the opiate group at 10%.
Three percent of people starting treatment had a child with a child protection plan, 3% were receiving early help and 1% were in contact with social services because they had a child in need.
7. Smoking
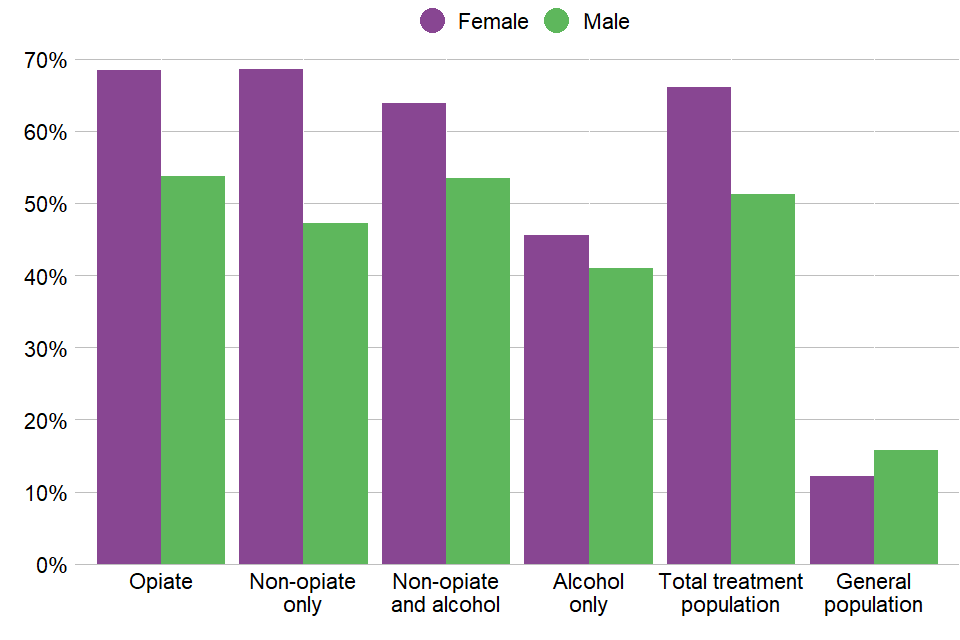
Figure 14: Smoking prevalence at start of treatment
Just over 7,000 people said they had smoked tobacco in the 28 days before entering prison and starting treatment. This is based on information collected at the start of treatment as part of Public Health England’s (PHE) treatment outcomes profile.
Across all substance groups, women consistently reported smoking at higher levels than men. The drug group with the lowest level of smoking for both men and women was the alcohol only group.
In all cases, the level of smoking was substantially higher than the smoking rates of the general population, which the latest ONS report on smoking habits in the UK says are 15.9% for men and 12.1% for women. The smoking rates for the total treatment population were 51% for men and 66% for women.
8. Treatment types

Figure 15: Breakdown of adults in treatment types by substance group
Almost all adults in treatment in secure settings (94%) received psychosocial interventions. Four percent received prescribing interventions only and 2% either did not start an intervention or an intervention was not recorded.
Psychosocial intervention only was the most common treatment type in the non-opiate only (92%), non-opiate and alcohol (82%) and alcohol only (65%) groups. Only 19% of people using opiates received psychosocial intervention only.
Almost half (49%) of adults in treatment received a prescribing intervention. There was 80% of the opiate group receiving these, 32% of the alcohol only group and just 6% of the non-opiate only group.
Prescribing interventions are generally provided alongside a psychosocial component to help support a person’s recovery, as recommended by the UK drug treatment clinical guidelines. This was the most common treatment type in the opiate group (75%). A quarter of the alcohol only group received both prescribing and psychosocial interventions.
9. Treatment outcomes
9.1. Treatment exits and successful completion
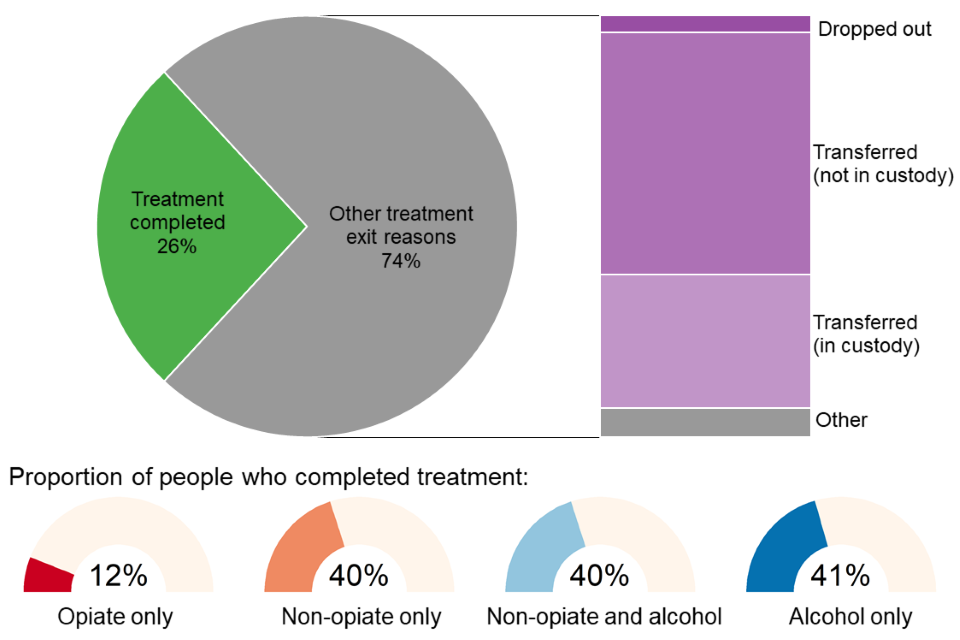
Figure 16: Breakdown of adult treatment exits in 2019 to 2020
A total of 34,378 people left treatment in secure settings between 1 April 2019 and 31 March 2020. Just over a quarter (26%) of those were discharged after completing their treatment free of dependence. Adults in treatment for opiate problems had the lowest rate of successful completion (12%) compared to the other substance groups where the rate was 40% or higher.
Two-thirds (66%) of adults leaving treatment were transferred for further treatment either in the community (42%) or in another secure setting (23%).
Continuity of care between treatment services in prisons and the community is monitored by the Public Health Outcomes Framework (PHOF) indicator C20. The proportion of adults successfully starting community treatment within 3 weeks of release was 34.5% in 2019 to 2020.
The remaining 8% of adults left treatment without completing it, mainly by dropping out of treatment (3%) or being discharged due to being released from court (2%).
9.2. Deaths in treatment
There were 38 people who died while they were in treatment in 2019 to 2020, which represented 0.1% of all people exiting treatment. This is a 30% decrease compared to the previous year where 54 people died. People with opiate problems accounted for 61% of these deaths, which is less than the proportion of people with opiate problems among all adults who died while in community treatment (69%).
Of the people who died while they were in treatment, 97% were male and 3% were female. The median age of adults who died was 40, with the median age ranging from 36 for the non-opiate and alcohol group, to 51 for the alcohol group.
The UK clinical guidelines for drug misuse and dependence highlights the importance of take-home naloxone for previously heroin-dependent prisoners when they leave prison. Of all the people who were treated for opiate problems, the proportion provided with take-home naloxone when they were released in 2019 to 2020 continued to rise, and is now at 28%, compared to 12% in 2017 to 2018.
10. Young people in treatment in secure settings
10.1 Young people’s treatment: overview
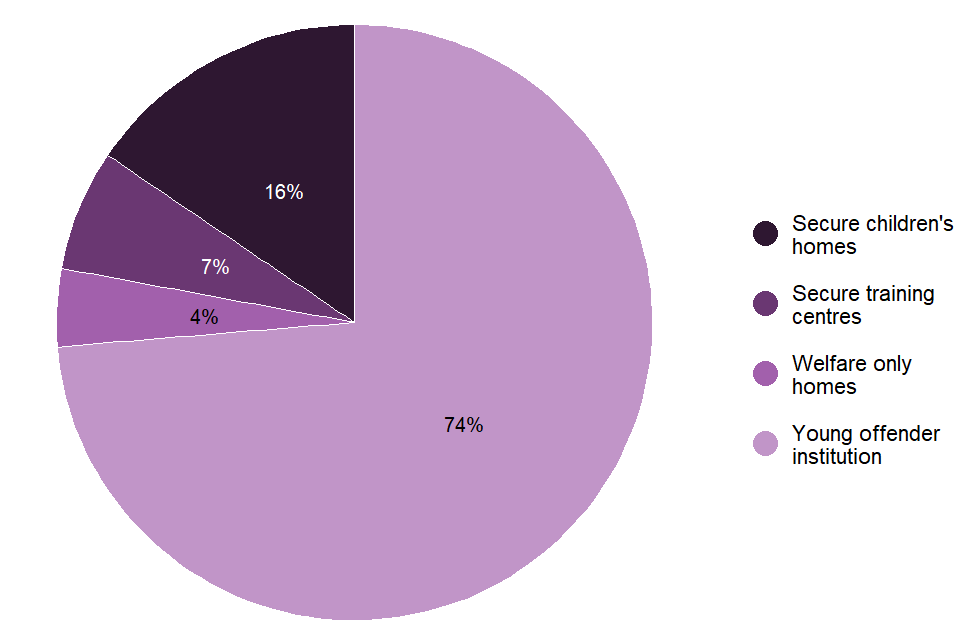
Figure 17: Young people in treatment by setting
There were 1,186 young people receiving treatment for drug and alcohol problems in secure settings in 2019 to 2020. Most (74%) of these were in young offender institutions, with a further 16% in secure children’s homes, 7% in secure training centres and 4% in welfare-only homes.
10.2 Young people: age and sex

Figure 18: Breakdown of young people by age and sex
Most (93%) of the young people in treatment in secure settings were male. HMPPS statistics on children and young people in secure settings show that 97% of the total youth custody population was male in March 2020 (excluding welfare only places but including settings in Wales).
There were 78 girls in treatment. Boys tended to be older, with a median age of 17, compared to girls who had a median age of 15.
10.3 Young people: substance use

Figure 19: Substance use by young people
Of the young people starting treatment in secure settings in 2019 to 2020:
- 93% said they had a problem with cannabis
- 40% said they had a problem with alcohol
- 24% said they had a problem with nicotine
- 16% said they had a problem with cocaine powder
- 5% said they had a problem with ecstasy
- 5% said they had a problem with opiates
- 2% said they had a problem with crack cocaine
Young people in treatment for problems with opiates, cocaine powder or crack were older (median age of 17) than those reporting other substances (the median age for cannabis, alcohol, ecstasy, solvents and nicotine was 16).
10.4 Vulnerabilities of young people starting treatment
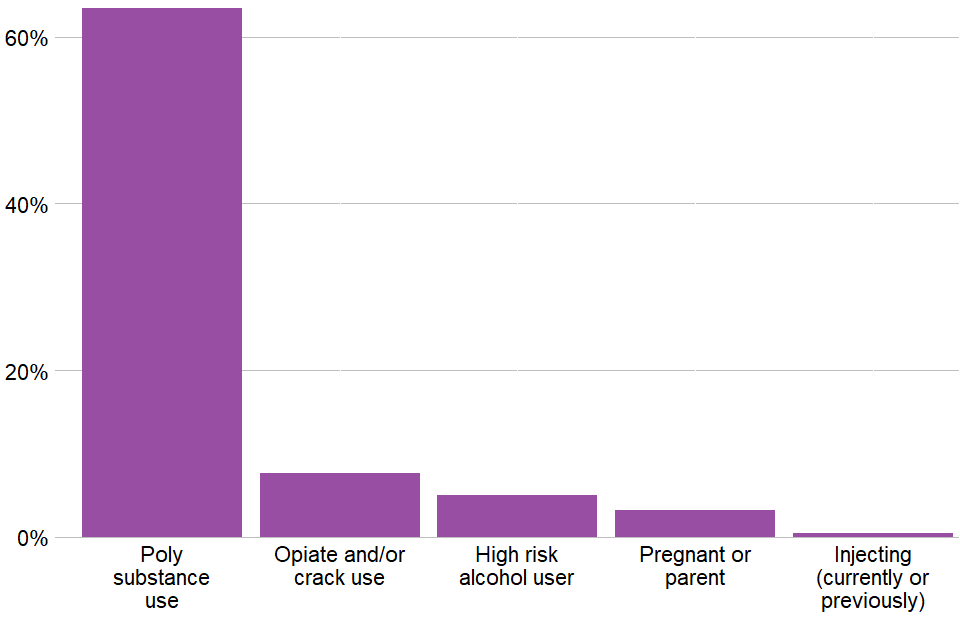
Figure 20: Vulnerabilities of young people starting treatment
Young people often enter specialist substance misuse services with a range of problems or ‘vulnerabilities’ which are related to, or in addition to, their substance use. These include using multiple substances (poly-substance use) and being a parent or pregnant.
The most common vulnerability by far was poly-substance use (63%). A further 8% said they used opiates or crack and 5% reported high-risk alcohol use. Three percent of young people reported being a parent or pregnant.
Half (50%) reported only one vulnerability, while 12% reported 2 vulnerabilities and only 2% said they had 3 or more vulnerabilities.
10.5 Young people: treatment type
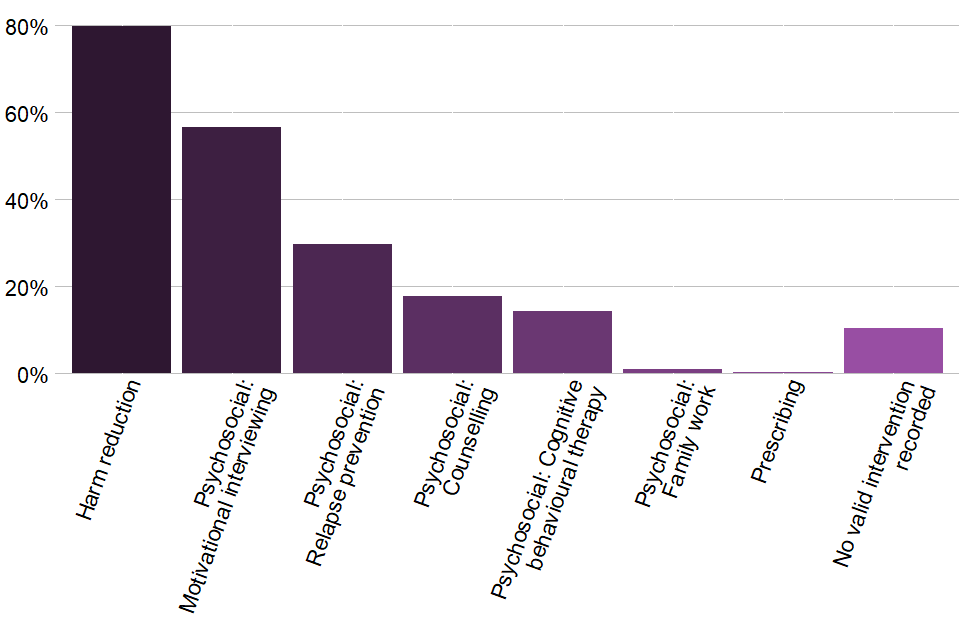
Figure 21: Intervention types for young people
Most young people in treatment (80%) received a harm reduction intervention. These interventions include support to manage risky behaviour associated with substance use, such as overdose or accidental injury.
Over half (57%) received motivational interviewing while nearly a third (30%) received relapse prevention. A further 32% received cognitive behavioural therapy and counselling (14% and 18% respectively). Less than 1% of young people received a pharmacological intervention (this involves medication prescribed by a clinician).
10.6 Young people: treatment exits
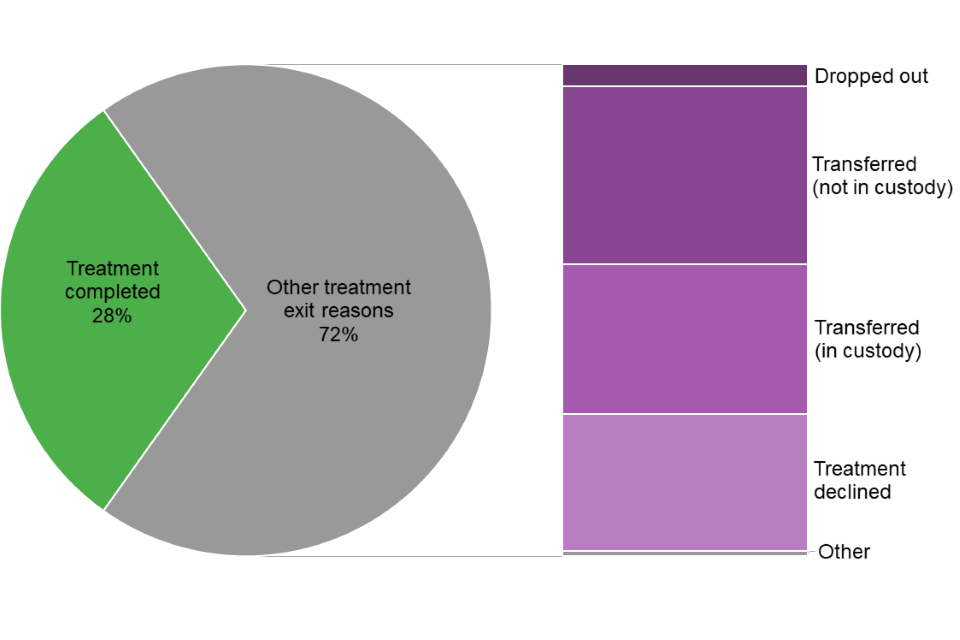
Figure 22: Breakdown of young people’s latest treatment exits in 2019 to 2020
There were 946 young people who left treatment in secure settings in 2019 to 2020. Of these, 28% completed their treatment successfully. This is a small reduction in the proportion of young people who successfully completed treatment since the previous year (from 29% to 28%).
Just under a quarter (23%) were released from custody and referred for further treatment in the community and 20% were transferred to another secure setting with the intention that their treatment would continue. A further 18% of young people declined treatment and 7% left treatment due to being released from court.
11. Trends over time
Due to data compliance issues in some previous years, trends are displayed as proportions and not numerical volume in the adult sections, except the deaths in treatment section.
11.1 Trends: adults in treatment
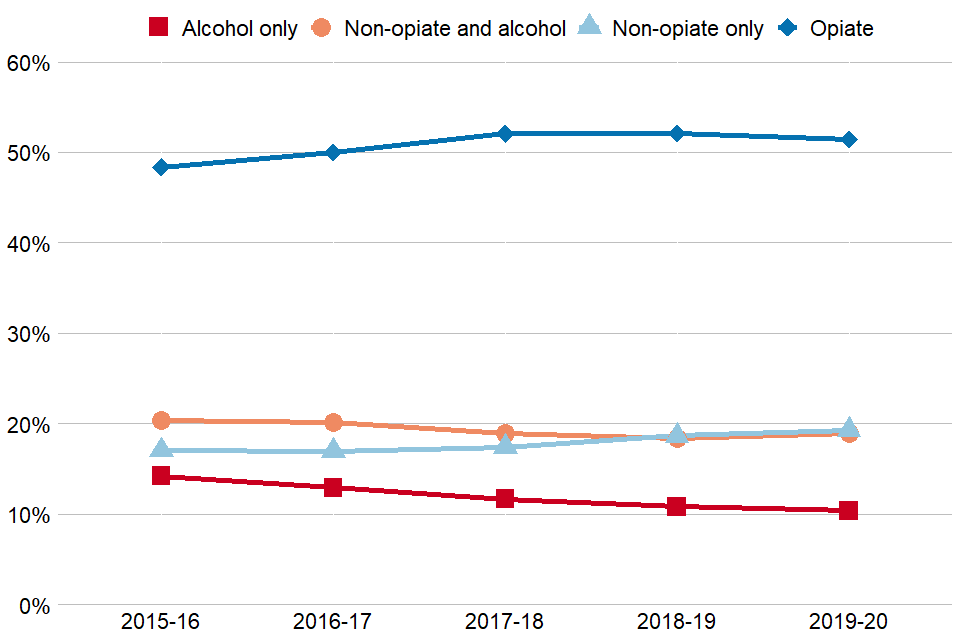
Figure 23: Trends in numbers in treatment by substance group from 2015 to 2016
The proportion of adults in prison who were in drug or alcohol treatment fell from 53,193 in 2018 to 2019 to 52,891% in 2019 to 2020 (less than 1% decrease). This continues a downward trend that is now 12% lower than the first year these statistics were reported (60,254 in 2015 to 2016).
Compared to the previous year, there were slight increases in numbers in the non-opiate only (3% increase) and non-opiate and alcohol (2%) groups. The alcohol only group saw a 5% decrease while the opiate group saw a small decrease of 2%.
The HMPPS offender equalities annual report shows that the overall prison population was less than 1% higher in March 2020 than in March 2019.
11.2 Trends: adults starting treatment
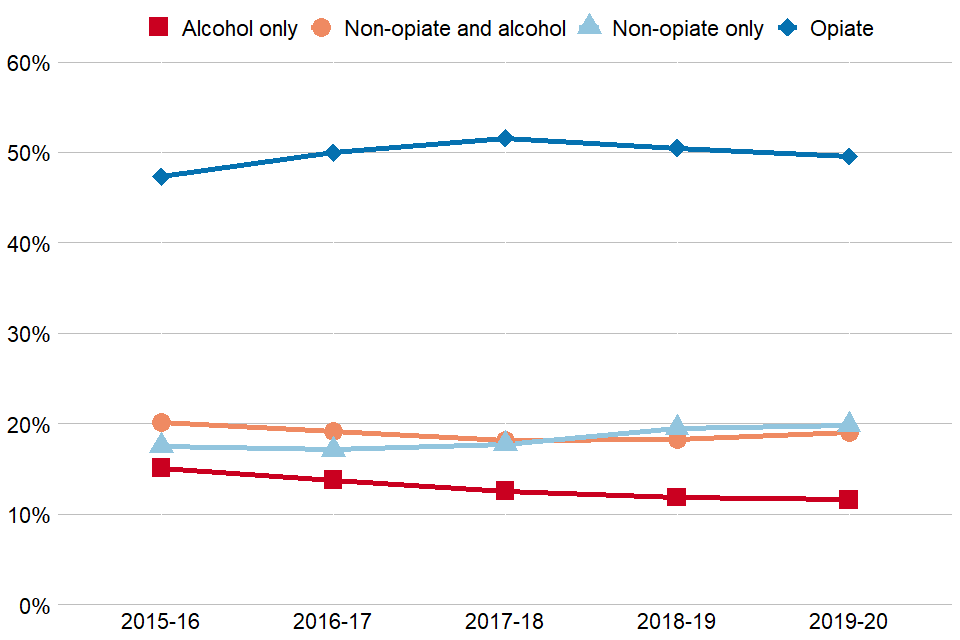
Figure 24: Trends in substance use by adults starting treatment
The number of adults starting treatment in secure settings in 2019 to 2020 was 5% lower than the previous year, continuing a year-on-year decrease that is now 18% lower than the first year of reporting.
The decrease was largest in the alcohol only group and the opiate group (7% and 6% decreases respectively). The non-opiate only group and non-opiate and alcohol group decreased by 3% and less than 1% respectively.
11.3 Trends: substance use in adults starting treatment
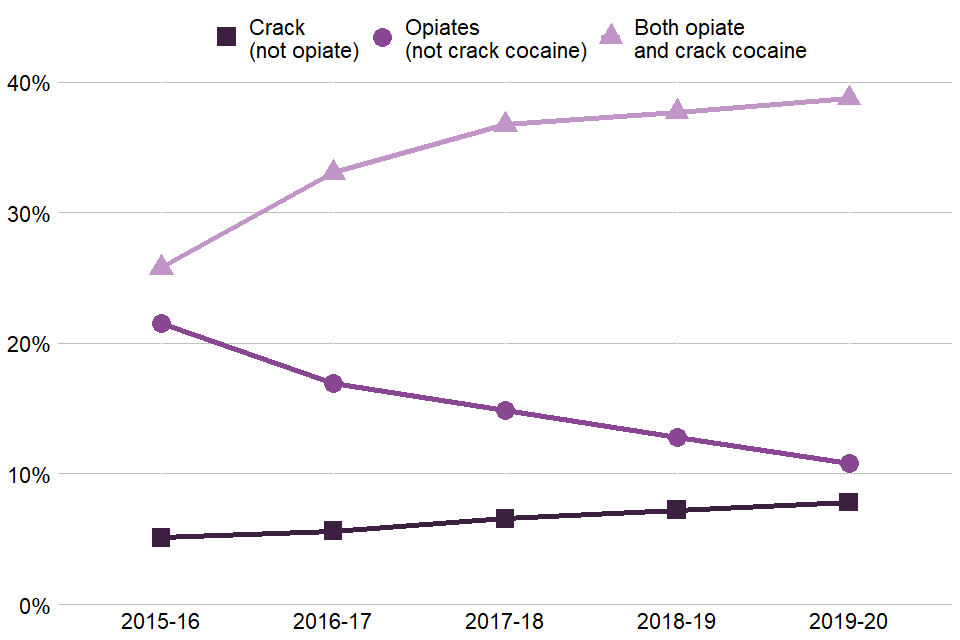
Figure 25: Trends of adults starting treatment with opiate or crack problems
Thirty-nine percent of people starting treatment in 2019 to 2020 reported problems with both crack and opiate use. This has increased from 26% in 2015 to 2016. However, the proportion of people starting treatment for opiate problems without crack use has fallen year-on-year (from 22% in 2015 to 2016 to 11% in 2019 to 2020).
The proportion of people starting treatment for crack problems without opiates has gone up each year these statistics have been published (from 5% in 2015 to 2016 to 8% in 2019 to 2020).

Figure 26: Trends of adults starting treatment with problems with other drugs
There was a continued decrease in the proportion of people starting treatment who reported alcohol problems, with 45% of people this year compared to 50% in 2015 to 2016.
Proportions of people in treatment for benzodiazepines and amphetamines have also seen large decreases since these statistics were first reported (decreases of 44% and 62% respectively).
Cocaine and cannabis had both decreased between 2015 to 2016 (22% and 33% respectively) and 2018 (21% and 30%) but have risen again slightly over the past 2 years (24% and 32% in 2019 to 2020).
The number of people reporting problems with other drugs has risen steadily from 1.6% in 2016 to 2017 to 3.1% this year. Half of these (50%) were from people who reported problems with pregabalin use.
The proportion of people in treatment who reported problems with NPS has continued to rise. Eleven percent of adults in treatment said they had a problem with this in 2019 to 2020 compared to 6% in 2015 to 2016.
11.4 Trends: adults leaving treatment

Figure 27: Trends in adults completing treatment since 2015 to 2016
The proportion of adults leaving treatment after successfully completing their treatment free of dependence decreased to 26%, from 27% in the previous year.
The only drug group to see a rise in people successfully completing treatment was the alcohol only group with 41% compared to 40% the previous year. However, this is still lower than the high of 44% in 2017 to 2018.
The opiate group have also seen a decline from a high of 18% in 2017 to 2018 to 12% this year. The proportions of people successfully completing treatment in the non-opiate only and the non-opiate and alcohol groups have been similar for the past 3 years.
Continuity of care between treatment services in prisons and the community is monitored by the PHOF indicator C20. The proportion of adults successfully starting community treatment within 3 weeks of release has remained similar to the previous year at 34.5%.
The numbers of people starting community-based treatment after release from prison increased for all regions apart from the North West, West Midlands and London. The biggest increase was in the North East, where 5% more people engaged with local treatment services than the previous year.
11.5 Trends: deaths in treatment
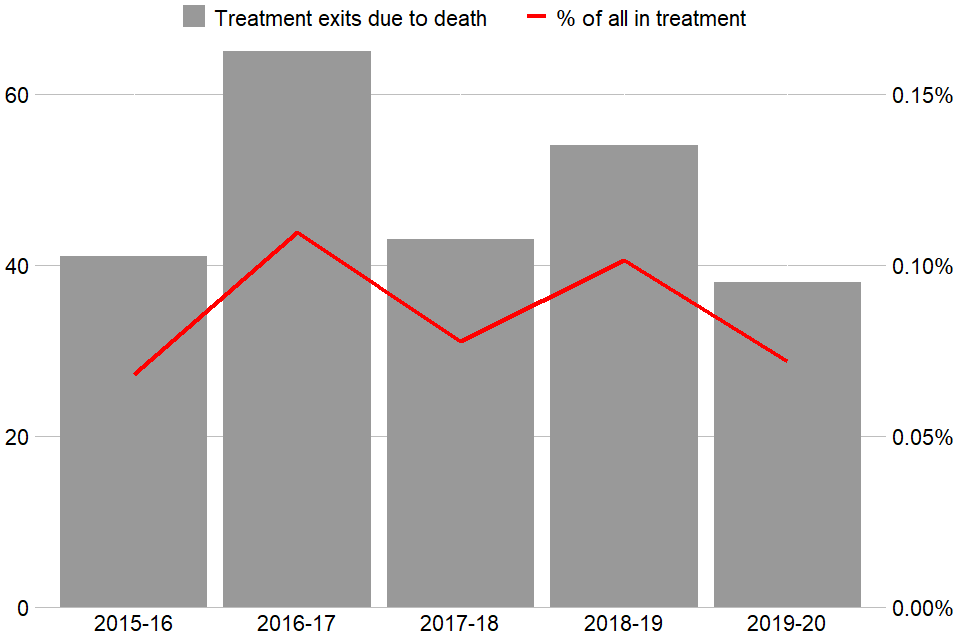
Figure 28: Trends in deaths of adults in treatment
The number of adults who died in 2019 to 2020 while they were in contact with treatment services decreased by 30% from 54 in the previous year to 38. There was a decrease for all substance groups, ranging from 14% for non-opiate and alcohol to 50% for alcohol only.
People with opiate problems continue to be the most at risk, with 61% of deaths in this group. The non-opiate only and non-opiate and alcohol groups accounted for 16% of deaths while 8% of adults who died were in treatment for alcohol-only problems.
11.6 Trends: young people in treatment

Figure 29: Trends in numbers of young people in treatment from 2015 to 2016
The number of young people in treatment in secure settings in 2019 to 2020 fell by 7% compared to the previous year, continuing an overall downward trend since 2015 to 2016. This is similar to the 11% decrease in the youth custody population (which includes 18 year olds) for England and Wales between March 2019 and March 2020 reported by HMPPS statistics on children and young people in secure settings.
11.7 Trends: substance use by young people starting treatment

Figure 30: Trends of young people in treatment by most reported problematic substance
Cannabis has always been the most common problem substance for young people in secure settings since these statistics were first published (93% had a cannabis problem in 2019 to 2020). The proportion has remained at similar levels since 2015 to 2016.
The proportion of young people reporting problems with nicotine (24%) and cocaine (16%) has also remained similar to previous years.
Fewer young people in treatment said they had problems with alcohol use in 2019 to 2020 (40%) than in 2015 to 2016 (51%).
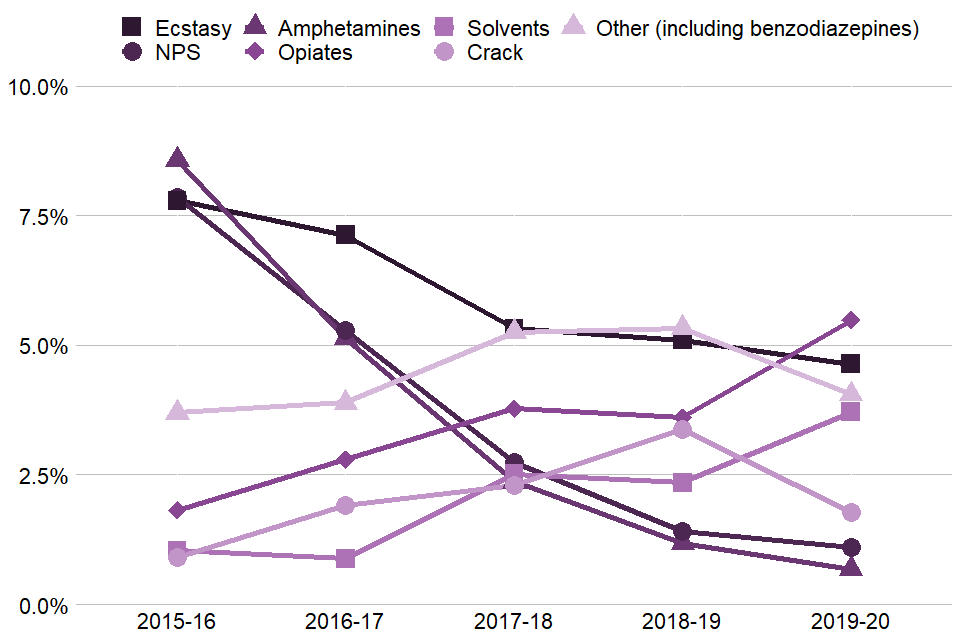
Figure 31: Trends of young people in treatment by other problematic substances
The proportion of young people in treatment reporting problems with crack (2%) and ecstasy (5%) has remained similar to previous years, while the proportion saying they have problems with opiate use has increased to 5% from 2% in 2015 to 2016.
The proportion of young people reporting problems with NPS and amphetamine use has fallen from 8% and 9% respectively in 2015 to 2016, to 1% this year.
Use of solvents has increased to 4%, the highest level since these statistics were first reported in 2015 to 2016 (1%). The proportion of young people in treatment reporting other drugs has decreased to 4% from 5% in the previous year.
11.8 Trends: young people’s treatment exits

Figure 32: Trends in young people leaving treatment
The proportion of young people completing substance misuse treatment in secure settings fell from 29% in 2018 to 2019 to 28% in 2019 to 2020. The proportion in 2016 to 2017 was 33%.
The proportion of young people in treatment who were transferred to other treatment services in custody and the proportion who declined treatment have both been increasing gradually over the last number of years, reaching 20% and 18% respectively in 2019 to 2020.
The number of young people transferred to treatment services in the community on their release fell from 51% (462) in 2017 to 2018 to 23% (221) in 2019 to 2020. There was also a decrease in the number of young people dropping out of treatment across these 2 years, from 6% to 3%.
These decreases may be explained in part by the NDTMS data set introducing a new discharge reason from April 2018, to include the young people who were released from court and discharged before a transfer to community services could be arranged. In 2019 to 2020, the proportion of young people in treatment who left treatment because they were released from court was similar to the previous year.
12. Background and policy context
12.1 Background
This report presents statistics on the availability and effectiveness of alcohol and drug treatment in prisons and secure settings in England, and the profile of people accessing this treatment.
The statistics in this publication come from analysis of the NDTMS, which collects data from services providing structured substance misuse interventions to adults and young people in about 140 prisons and secure settings across England, including adult settings (prisons and immigration removal centres) and the children and young people’s secure estate.
The data collected includes information on the demographics and personal circumstances of people receiving treatment, as well as details of the interventions delivered and their outcomes.
You can find more details on the methodology used in the report in the NDTMS annual statistics quality and methodology information paper.
12.2 Policy context
Alcohol and drug treatment services in prisons and secure settings for adults and young people are commissioned by NHS England.
NHS England commissions specialist treatment services in secure settings which are equivalent to community-based treatment and informed by evidence-based clinical guidance.
Treatment includes interventions to reduce harm and to help people recover from alcohol and drug dependence. NHS England’s latest service specification describes how substance misuse services in prisons and secure settings should be provided.
The Royal College of Paediatrics and Child Health has published healthcare standards for children and young people in secure settings.
Continuity of care for offenders leaving prison who still need treatment is a priority for NHS England, HMPPS, PHE, the Department of Health and Social Care and the Ministry of Justice as set out in their National Partnership Agreement. There is also a partnership agreement for children and young people which includes continuity of care as one of the shared objectives.
The Public Health Outcomes Framework supports this priority by monitoring the engagement rates of adults who leave prison and continue their substance misuse treatment in the community.
Under the Children Act 1989, local authorities can place children into secure children’s homes and welfare only homes. In these circumstances, children and young people are held there because of concerns about their welfare, rather than because they have offended.