Equalities analysis: executive summary
Published 7 December 2023
Applies to England

© Crown copyright 2023
This publication is licensed under the terms of the Open Government Licence v3.0 except where otherwise stated. To view this licence, visit nationalarchives.gov.uk/doc/open-government-licence/version/3 or write to the Information Policy Team, The National Archives, Kew, London TW9 4DU, or email: psi@nationalarchives.gov.uk.
Where we have identified any third party copyright information you will need to obtain permission from the copyright holders concerned.
This publication is available at https://www.gov.uk/government/publications/student-level-equalities-analyses-for-gcse-a-level-and-vtqs-2023/equalities-analysis-executive-summary
Authors
- Ming Wei Lee
- Dovile Rama
- Kate Johnson
Executive summary
Ofqual routinely analyses how attainment gaps for students with different protected characteristics and socio-economic status vary over time, for GCSEs and A levels (referred to here as general qualifications (GQ)) and a subset of vocational and technical qualifications (VTQ) (see: GQ 2020, VTQ 2020; GQ 2021; VTQ 2021, GQ & VTQ 2022). This year, results are published in an interactive format on Ofqual Analytics. This statistical analysis allows users to explore how differences in results between groups of students with different protected characteristics and socioeconomic status have changed in 2023 in relation to previous years.
The methodology used in this analysis allows us to identify and quantify the changes that have occurred. It is difficult, however, to identify the causes of any of these changes. There are likely to be many possible causal factors, including existing societal differences and the impact of the pandemic on teaching and learning. Analysis from 2018 and 2019 shows that differences in results existed in pre-pandemic times and can vary from year to year. Many of the findings reported here are likely to reflect normal fluctuations in outcomes from one year to the next.
As in previous analyses, in addition to presenting the descriptive analysis of the raw differences in results between groups of students, Ofqual used a multivariate analytical approach. This allows us to explore the impact on overall results of each feature separately while controlling for other features. This is important because we know that there are relationships between different features (for example, ethnicity and first language).
We used regression modelling to estimate differences in results for groups of students after controlling for other variables. The variables analysed were:
-
ethnicity
-
gender
-
special educational needs and disabilities (SEND) status
-
free school meal (FSM) eligibility (a measure of deprivation)
-
Income Deprivation Affecting Children Index (IDACI) score
-
prior attainment
-
first language (GQ only)
-
region (GQ only)
-
centre type (GQ only) according to JCQ categories
For most of the above variables, the largest group is used as a comparator, and all other groups are compared to that. For example, for ethnicity, we use white British as the comparator as it is the largest group. We compare students in other ethnic groups with white British students of the same gender, SEND status, FSM eligibility, IDACI score, prior attainment, first language, region and centre type. We estimate the results of the ‘average’ student, that is, a student who falls into the comparator group for every variable, and can then examine the impacts of each of the other groups separately.
In this analysis, results for 2023 are presented alongside those for the period from 2018 to 2022. This report focuses on 2 comparisons. We compare results in 2023, when exams were held with the aim to return to pre-pandemic grading, with results in 2022, when exams returned following the pandemic with a package of support for GCSE and A levels and adaptations (for GCSE, A levels and VTQs) including lenient grading. We also compare results in 2023 with results in 2019, the last year that summer exams were taken before the pandemic.
Analysis of results for 2018 to 2023 are shown in the interactive charts and accompanying data tables. Given the exceptional circumstances under which grades were awarded in 2020 and 2021, any adaptations for qualifications and the package of support in place for GCSE and A levels in 2022, any comparison with these years should be treated carefully.
General qualifications
For GCSEs and A levels we analysed 3 outcome measures:
- grade achieved
- the probability of attaining grade 7 and above for GCSE, or grade A and above for A level
- the probability of attaining grade 4 and above for GCSE, or grade C and above for A level
We used a set of criteria to identify changes we considered to be ‘notable’, those changes that we believe go beyond normal year-on-year fluctuations. These changes are drawn out in the interactive report. Of the many comparisons between groups of students presented in our modelling, the majority showed no notable change in 2023, with respect to 2019 and 2022.
A level
For A level in 2023, the modelling showed that the grade for an average student was a grade C (3.47 on a numeric scale of 0 to 6, where 0 was ungraded and 6 was A*). The probability of an average student attaining grade A and above was 18.3%, and the probability of them attaining grade C and above was 80.7%. The average student’s grade and probabilities of attaining grade C or above and grade A or above in 2023 were broadly in line with 2019 and lower than in 2022. This is to be expected, given the intended staged return to pre-pandemic grading over the last 2 years.
Some groups showed notable changes on all 3 of the above outcome measures when controlling for other variables. We found the following notable changes on all 3 outcome measures:
In 2023, students in further education colleges had lower outcomes than students in academies. The difference of 0.45 of a grade (almost half a grade) was 0.35 grade wider than in 2019, but broadly in line with 2022.
Students in sixth form colleges had lower outcomes than students in academies. The differences of 0.10 of a grade reversed the difference in 2019 when sixth form students had higher outcomes than academy students.
GCSE
For GCSE in 2023, the modelling showed that the grade for an average student was a high grade 4 (4.90 on a scale of 0 to 9, using the numeric grades). The probability of an average student attaining grade 7 and above was 16.0%, and the probability of them attaining grade 4 and above was 80.1%. The average student’s grade and probabilities of attaining grade 4 or above and grade 7 or above were similar to 2019 and lower than in 2022, as expected.
Some groups showed notable changes on all 3 outcome measures relative to demographics-matched students in the comparator groups:
Students in independent schools had higher outcomes than students in academies. The difference of 1.6 grades was 0.2 grade narrower than in 2019, but has widened slightly by 0.1 grade since 2022. Given that the gap for probability of attaining a 7 (or above) narrowed, this increase has to do with the probability of attaining a 4 (or above), which is slightly larger than in 2022, but still lower than in 2019.
White Gypsy and Roma students had lower outcomes than white British students. The difference of 0.92 grade was 0.28 grade narrower than in 2019.
Chinese students had higher outcomes than white British students. The difference of 1.12 grades was 0.22 grade wider than in 2019.
FSM-eligible students had lower outcomes than FSM-ineligible students. This difference of 0.51 grade was 0.13 grade wider than in 2019, though the change with respect to 2022 was not notable.
Male students had lower outcomes than female students. The difference of 0.28 grade was 0.12 grade narrower than in 2019.
Vocational and technical qualifications
For vocational and technical qualifications (VTQs) analysis, we focused on national qualifications used alongside GCSEs and A levels in schools and colleges and included in the Department for Education’s (DfE’s) performance tables – specifically Level 1, 1/2 and 2 Technical Awards and Technical Certificates, and Level 3 Applied Generals and Technical Level qualifications. Unlike GCSEs and A levels, these VTQs have different structures and grade scales. The analysis, therefore, looks at the probability of achieving the top grade, that is the highest grade that can be achieved in each qualification.
In the majority of cases, no notable changes over time in the relative average probabilities of achieving top grades between different groups of learners were observed.
For level 1, 1/2 and 2 Technical Awards and Technical Certificates the modelling showed that the probability of an average student attaining the top grade was 2.1% and 1.9% respectively in 2023. This is lower than in 2022.
There were no notable changes for level 1 and 2 Technical Awards, whereas for level 2 Technical Certificates notable changes were seen with respect to prior attainment. In 2023, the gap between students with low and very low prior attainment when compared to those with medium prior attainment narrowed 6 and 5 percentage points respectively compared to 2019. Students with low prior attainment were about as likely as students with medium prior attainment to obtain top grades in 2023, while students with very low prior attainment were on average 1% less likely to achieve top grades.
Additionally, there were notable changes relating to some groups with different ethnic backgrounds. However, the numbers of students in these groups are relatively small and so these findings should be treated with caution.
For level 3 VTQs the modelling showed that the probability of an average student attaining the top grade in Applied Generals and Tech Level qualifications was 2.9% and 4.6% respectively in 2023. This is similar to 2019 and lower than in 2022.
For Applied Generals there were no notable changes, whilst for Tech Level qualifications notable changes were highlighted for some ethnic background groups. The numbers of students in these groups are relatively small and so these findings should be treated with caution.
Changes to report format
This year, the analysis is being made available for the first time in an interactive report format . This means that users can more easily navigate to the results they are interested in, while still being able to find the detailed technical information made available in the previously published reports.
The interactive report comprises multiple sections which are navigable via the tabs at the top of the page. The results are shown in interactive charts in the separate results tabs for GQ and VTQ.
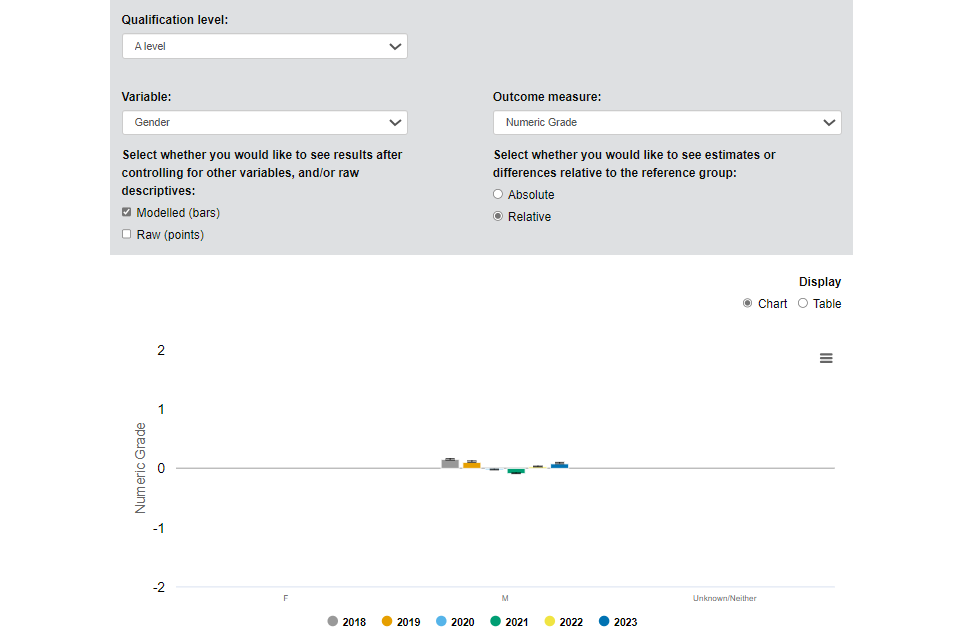
For the GQ charts, you can select the qualification level, variable and outcome measure that you are interested in seeing results for. You can also select whether you’d like to see modelled results (such as results which control for the other variables included in the analysis) and/or raw results (such as results which do not take into account any other factors). You can also choose whether to look at relative results (such as differences from the reference variable) or absolute results (such as overall estimates).
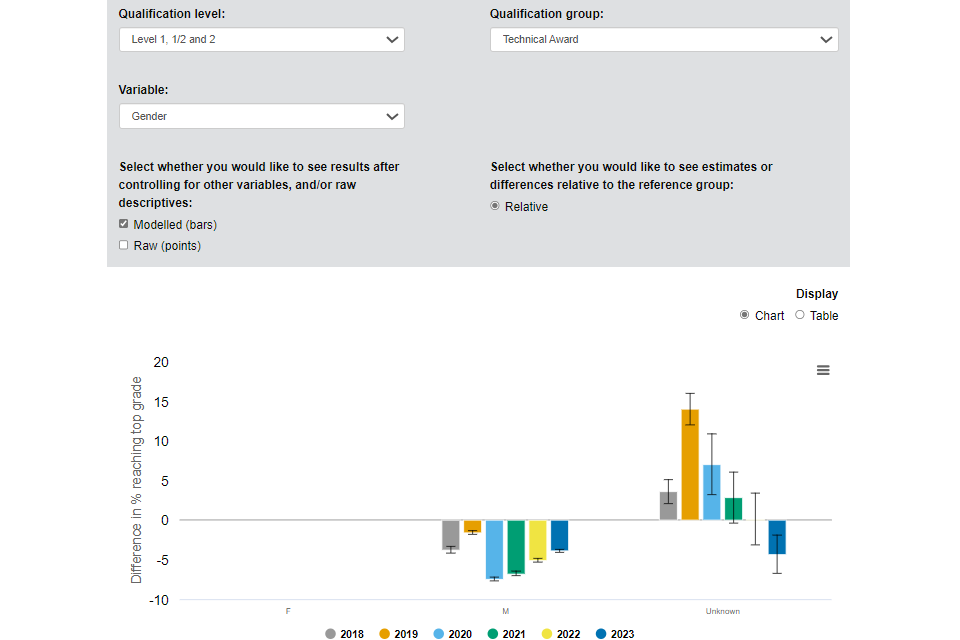
For the VTQ charts, you can select the qualification level, qualification group and variable that you are interested in seeing results for. You can also select whether you’d like to see modelled results (such as results which control for the other variables included in the analysis) and/or raw results (such as results that do not take into account any other factors). Results will show the average marginal effect, that is the difference in average probability of receiving a top grade between the results displayed and the reference group.
For both GQ and VTQ results, when you have selected the analysis you are interested in, you can view the results via a chart, or in a table. Text statements presented below the chart highlight which of the findings were identified as notable.