Statistics on changes in migrants' visa and leave status: 2016
Updated 18 April 2018

© Crown copyright 2018
This publication is licensed under the terms of the Open Government Licence v3.0 except where otherwise stated. To view this licence, visit nationalarchives.gov.uk/doc/open-government-licence/version/3 or write to the Information Policy Team, The National Archives, Kew, London TW9 4DU, or email: psi@nationalarchives.gov.uk.
Where we have identified any third party copyright information you will need to obtain permission from the copyright holders concerned.
This publication is available at https://www.gov.uk/government/statistics/statistics-on-changes-in-migrants-visa-and-leave-status-2016/statistics-on-changes-in-migrants-visa-and-leave-status-2016
This release is the eighth in an annual series of publications that explore changes in migrants’ visa and leave status within the UK’s immigration system.
1. Introduction
Understanding the processes that non-European Economic Area (EEA) migrants go through when they apply to stay in the UK or switch their immigration status helps to inform Parliament and the public on the impact of changes to the Immigration Rules.
The findings presented here are based on combining data collected from UK Visas and Immigration databases. These databases hold records of individuals granted (Entry clearance) visas outside the UK, and any subsequent grants of extensions of stay in the UK, as well as grants of settlement (indefinite leave to remain) and citizenship.
This report updates analysis from ‘Statistics on changes in migrants’ visa and leave status: 2015’ published in February 2017. It presents the data in two different but complementary ways, providing information on a forward view and backward view of the extent to which different types of non-EEA migrants change their immigration status or achieve settlement in the UK. The forward-view analysis examines the immigration status of migrants issued visas to the UK between 2004 and 2014. The latest findings discuss in detail the forward-view analysis of the cohort of those issued a visa in 2011, focusing on status 5 years later. Analysis of the immigration status at the end of 2016 is also examined in this report for all cohorts between 2004 and 2014. The backward-view analysis looks at those whose entry to the UK ultimately resulted in them being granted settlement (permission to stay permanently in the UK) and which visas they used on arrival to the UK.
This report focuses on outcomes for series of grants of leave following an initial non-visit visa, providing there is no more than a 12-month gap between periods of leave. Please see the ‘User Guide to the Home Office Statistics on changes in migrants’ visa and leave status’. This means numbers in this report for journeys starting each year will not match total numbers of visas granted each year.
The data presented in this report relate to all cases (both main applicants and dependants) and, where applicable, the supplementary tables separately identify all cases, by applicant type.
These figures for the cohorts described as starting with ‘Study’ include all lengths of sponsored Tier 4 Study visas but exclude in this analysis the separate category of unsponsored Short-term study that normally have validity up to 6 months (in some cases 11 months) and this category of leave cannot be extended in-country.
Of those having valid leave to remain in the UK, some may have left and the analysis in this report does not indicate how many are currently or were previously resident in the UK. Similarly of those in this analysis who are no longer recorded as having valid leave to remain in the UK, a number may have overstayed their leave but it is not possible from these data to determine whether a person is resident or not in the UK.
For the first time in this series of publications the detailed published spreadsheets differentiate between individuals granted settlement and individuals granted citizenship, allowing discussion and assessment of the transition from settlement to citizenship over time. Under the Immigration Rules, virtually all migrants who have been granted citizenship will have, at some point, been granted settlement at a previous stage and references in the text to those granted settlement should be taken to also include those ultimately granted citizenship, unless this is otherwise indicated.
The categorisation of Work visas has also been changed to relate to the different individual tiers of Work visa. This change was particularly prompted by policy changes from 2010 onwards that have altered eligibility of visas for ultimate settlement, meaning the previous categories of ‘work leading to settlement’ and ‘work not leading to settlement’ would now provide less meaningful time trends. More detailed discussion can be found in the ‘Change in methodology for categorising Work visas’ section.
Percentages in this report do not always add up to 100% due to rounding.
2. Key facts
Proportion of migrants issued a visa in 2011 with valid leave or settlement 5 years later by starting visa type
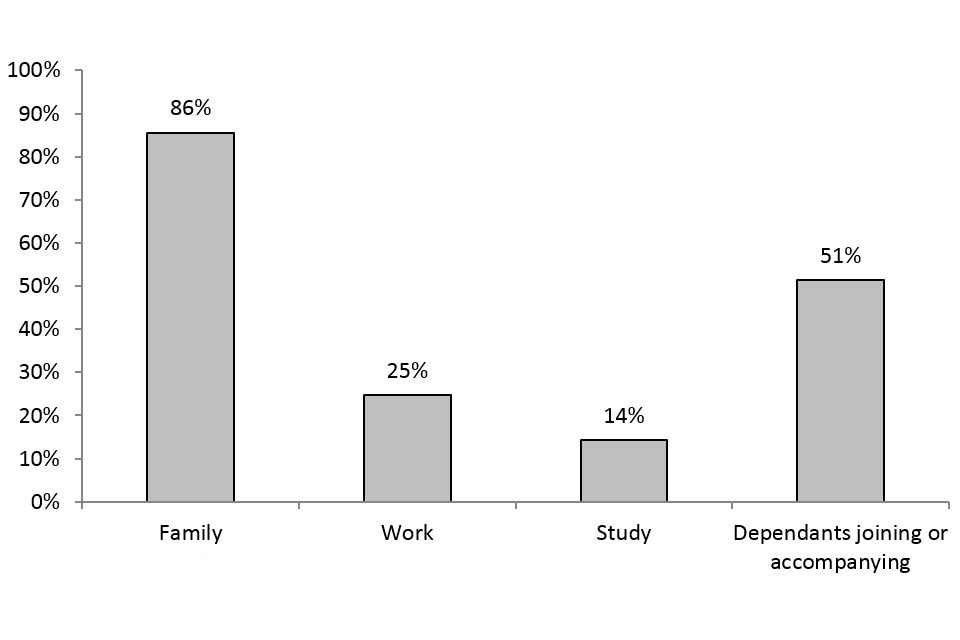
The chart shows the proportion with valid leave to remain or granted settlement after 5 years of those issued a visa in 2011, by type of visa issued.
Chart notes
Source: Home Office, ‘Statistics on changes in migrants’ visa and leave status: 2016’, volume 1, tables MJ 01-MJ 04.
-
Those issued a Family visa in 2011 were most likely to have achieved settlement or still have valid leave to remain in the UK 5 years after their initial visa grant (86%).
-
Around 4 out of 5 people (79% or 28,402) issued a Family visa in 2011 had been granted settlement 5 years later, with a further 7% recorded as still having valid leave to remain in the UK. The proportion of Family visa holders remaining legally in the UK 5 years after arrival rose in each successive cohort between 2004 and 2008 (from 79% to 86%), with this percentage remaining fairly stable in the cohorts between 2008 and 2011.
-
Of the top 5 nationalities issued a Family visa in 2011, Americans (66%) and Afghans (75%) were less likely to have obtained settlement within 5 years; while Indian (84%), Pakistani (83%) and Bangladeshi nationals (82%) were more likely.
-
Of those issued a Work visa in 2011, 13% (15,428) had been granted settlement 5 years after their initial visa had been granted; a further 12% (14,262) still had valid leave to remain in the UK: this compares with 18% and 13% respectively for the 2010 cohort, the fall in settlement possibly partly reflecting changes in eligibility and some of the other changes introduced as part of the points-based system (PBS) from 2008 onwards.
-
Indians were the nationality issued the most Work visas (34% of the total) in the 2011 cohort and, of these Indian nationals, 17% had received settlement after 5 years, while a further 10% still had valid leave to remain in the UK.
-
The proportion of migrants issued a Study visa that held valid leave to remain or settlement after 5 years fell from 19% in the 2010 cohort to 14% in the 2011 cohort. Study is not a direct route to settlement which explains the lower proportion compared with the Work and Family categories. This fall may reflect the tightening of the Immigration Rules on extending Study visas, but also in part the more limited employment opportunities in the years immediately following the 2008 recession, and there were also falls for migrants on the work route (from 30% to 25%). There was a smaller fall in the proportion of Dependants joining or accompanying who still held valid leave 5 years later (from 55% to 51%), which is largely accounted for by a fall in the proportion with settlement.
-
Migrants granted a Student visa in 2011 were less likely than migrants on other routes to have achieved settlement or have valid leave to remain in the UK after 5 years (14%). Only a small proportion had achieved settlement (1%) within the 5-year timeframe; however, this may reflect the length of time needed to establish residency for someone coming on what was initially a temporary route.
-
A large majority of migrants in the 2004 (i.e. the earliest) cohort who still held leave to remain in the UK in 2016 had by then been granted settlement or citizenship (95%). Those issued Study visas in 2004 had the lowest, though still large, proportion (90%) of migrants who still held valid leave to remain that were permanently settled or granted citizenship in 2016; those with Family visas had the highest proportion (99%).
-
Of those granted settlement in the 2016 cohort, 28% had originally been issued an initial starting visa for Study, 26% for Work and a further 12% were granted settlement on arrival. The remaining 34% had originally entered on other routes, including Family and Dependants joining or accompanying visas.
3. Change in methodology for categorising Work visas
Previous reports in this series have classified work categories as ‘Skilled work (with a potential path to settlement)’ or ‘Work (not leading to settlement)’.
Until April 2010, most high value and skilled workers (Tiers 1 and 2 of the PBS) were eligible for settlement after 5 years in the UK. Persons entering under the UK Ancestry or Domestic Workers routes were also able to apply for settlement after working in the UK for 5 years.
Changes to the Immigration Rules starting from April 2010 have removed the settlement rights for some Tier 2 migrants, domestic workers, and private servants in diplomatic households who come under the Tier 5 Temporary worker: international agreement category. Similarly, prior to the introduction of the PBS with shorter visas, many high-skilled workers obtained 5-year visas and therefore had a direct route to settlement without the need to obtain in-country extensions.
In light of these changes, which significantly altered the nature of migrants ‘with a potential path to settlement’, and for greater consistency with quarterly Immigration Statistics, the classifications used in this report for those granted Work visas have been changed and now provide a closer alignment to the more clearly defined Work categories (Tier 1, Tier 2, Tier 5 and Other work) used in the published Immigration statistics quarterly release series.
However, it should also be recognised that Tiers do change over time. For example, the Tier 1 (General route was closed to new applicants for entry clearance from December 2010, and the new Tier 1) Graduate entrepreneurs route was introduced from April 2012. There may have been a notable change in recent trends reflecting policy changes as part of the PBS.
For further details of changes to the Immigration Rules and their timing see ‘Policy and legislative changes affecting migration to the UK: timeline’.
4. Forward-view analysis
This analysis examines the changes in immigration status of migrants issued visas to the UK and explores four of the main routes of entry to the UK (excluding visitors) for migrants from outside the EEA:
- Family
- Work (of which: Tier 1 and pre-PBS equivalent; Tier 2 and pre-PBS equivalent; Tier 5 and pre-PBS equivalent; and Other work)
- Study
- Dependants joining or accompanying
The analysis tracks migrants who were initially issued a Family, Work or Study visa, or as a Dependant joining or accompanying someone who is not a settled person or British citizen through the immigration system in each subsequent year. This is to identify their immigration status at the end of the fifth year after their initial arrival.
The expiration of an individual’s Entry clearance visa or extension of stay does not necessarily confirm that the migrant has left the UK and returned to their home country. In fact, there are four possible outcomes for such migrants:
- the migrant has left the UK
- the migrant has made an application for a further extension of stay that has not been identified and or recorded
- the migrant is still in the UK (as an overstayer)
- the migrant never travelled to the UK (the visa was not used)
The figures presented here are not able to estimate the proportion of those whose Entry clearance visa or extension of stay has expired and have left the UK. Exit checks were introduced from April 2015 and the ‘Second report on statistics being collected under the exit checks programme’ published on 24 August 2017 provides some initial information on the departure of those whose visa or other leave permissions have expired.
Proportion of migrants issued an Entry clearance visa in 2004 to 2011 who still held valid leave to remain in the UK or had been granted settlement after 5 years, by visa type
| Cohort | Family1 | Work including dependants | Study including dependants | Dependants joining or accompanying2 |
|---|---|---|---|---|
| 2004 | 79% | 33% | 32% | 52% |
| 2005 | 80% | 31% | 27% | 54% |
| 2006 | 82% | 32% | 26% | 56% |
| 2007 | 84% | 26% | 24% | 61% |
| 2008 | 86% | 24% | 22% | 58% |
| 2009 | 85% | 31% | 21% | 58% |
| 2010 | 87% | 30% | 19% | 55% |
| 2011 | 86% | 25% | 14% | 51% |
Table notes
Source: Home Office, ‘Statistics on changes in migrants’ visa and leave status: 2016’, volume 1, tables MJ 01-MJ 04.
- Family visas are where an individual is applying for a visa on the basis of their relationship to a person settled in the UK or a British citizen. ‘Family: child’ includes adult offspring of the settled person or British citizen. ‘Family: other’ encompasses dependants who are not offspring or partners, such as elderly relatives.
This category also includes:
i) Following changes to the rules from July 2012, ‘post-flight’ family members and adult dependent relatives joining those who have been granted refugee status or humanitarian protection.
ii) Family members of those granted refugee status and who had gained settlement, or who had yet to gain settlement status if the individual coming to the country applied for a visa prior to the second quarter of 2011. - Dependants joining/accompanying are dependants applying for a visa on the basis of their relationship with another migrant, who is not a settled person or a British citizen.
Migrants granted a Student visa are less likely than migrants on other routes to have achieved settlement or have valid leave to remain in the UK after 5 years. Of these, only a small proportion achieves settlement within a 5-year timeframe. The reasons for this include:
- the rules for Study visas prohibiting a direct route to settlement
- the propensity for people in Study to switch into other immigration categories that have a route to settlement and the time that would then need to elapse before a settlement application can be made
The PBS was phased in from 2008 onwards. Tier 1 (which provides a route for highly-skilled migrants) was phased in between February and June 2008, followed by Tier 2 (which provides a route for skilled workers with a job offer) and Tier 5 (which is for temporary workers and youth mobility, providing a route for those coming to the UK for primarily non-economic reasons) which were implemented in November 2008. These changes to the rules may have influenced the characteristics of those arriving for work after 2008.
Number of migrants issued a visa in 2011 for each visa type, broken down by their immigration status 5 years later
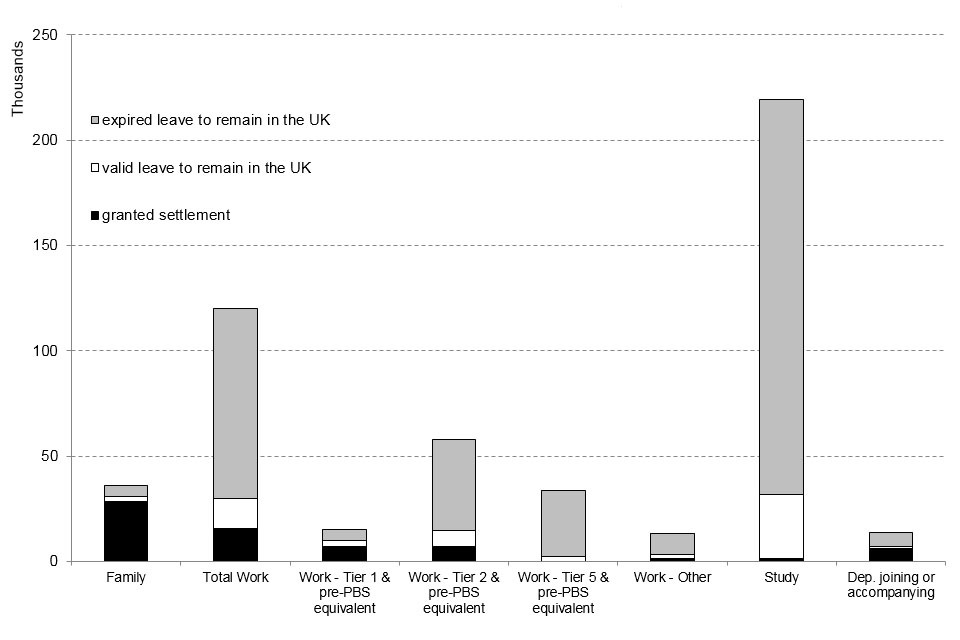
The chart shows the immigration status after 5 years of those issued a visa in 2011, by type of visa issued.
Chart notes
Source: Home Office, ‘Statistics on changes in migrants’ visa and leave status: 2016’, volume 1, Tables MJ 01-MJ 04 .
Home Office, ‘Statistics on changes in migrants’ visa and leave status: 2016’, volume 2, tables MJ 05-MJ 08 .
Percentages for migrants issued a visa in 2011 for each visa type, broken down by their immigration status 5 years later
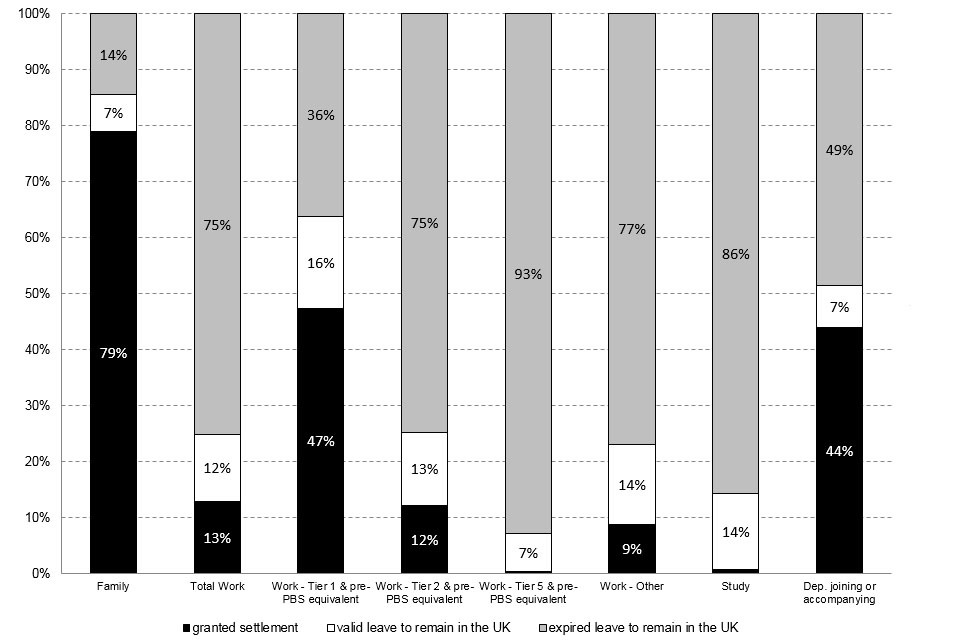
The chart shows the immigration status after 5 years of those issued a visa in 2011, by type of visa issued.
Chart notes
Source: Home Office, ‘Statistics on changes in migrants’ visa and leave status: 2016’, volume 1, tables MJ 01-MJ 04 .
Home Office, ‘Statistics on changes in migrants’ visa and leave status: 2016’, volume 2, Tables MJ 05-MJ 08 .
4.1 2011 cohort by immigration status at the end of each year
Those issued a Family visa in 2011 were most likely to have achieved settlement or still have valid leave to remain in the UK 5 years after their arrival (86% or 30,774). The chart below shows, for each of the visa types analysed, the proportion still holding a valid visa or who had gained settlement in each year after their initial grant. The patterns reflect the different rules that apply to each visa type. The decline over time is most rapid for those initially granted Work and Study visas and is least rapid for those granted Family visas, where the majority are ultimately granted settlement.
Migrants in the 2011 cohort still holding valid leave to remain in the UK or granted settlement at the end of each year, by visa type
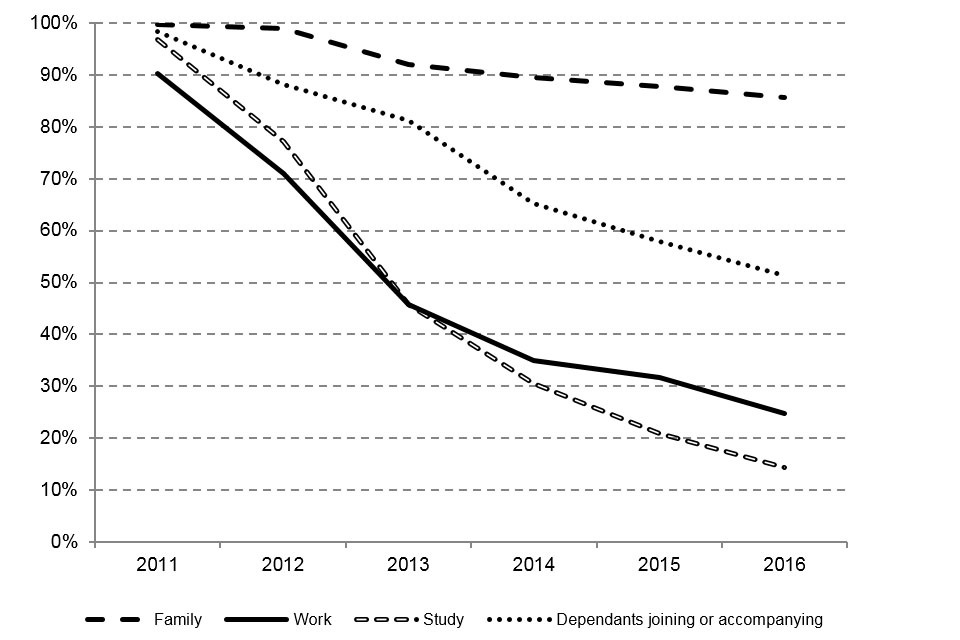
The chart shows the number of migrants in the 2011 cohort granted valid leave to remain or settlement at the end of each year, by visa type.
Chart notes
Source: Home Office, ‘Statistics on changes in migrants’ visa and leave status: 2016’, volume 1, tables MJ 01-MJ 04.
4.2 Family
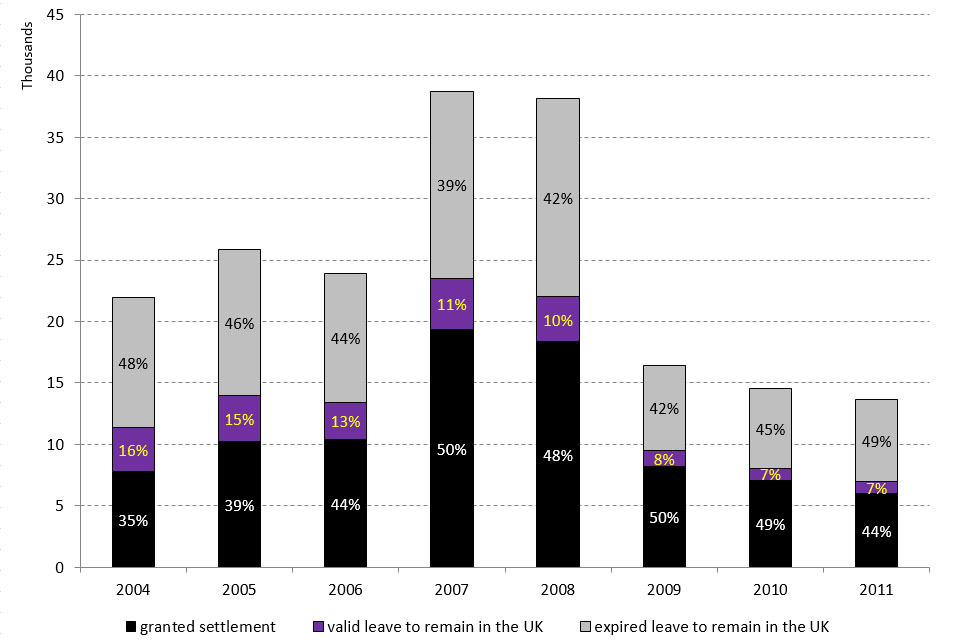
For people issued a Family visa in 2004, around 7 out of 10 (71%) had gained settlement (permission to stay permanently in the UK) 5 years later. This proportion increased for those in later cohorts, with around 8 out of 10 (79%) of those issued a Family visa in 2011 granted settlement 5 years later.
People coming under the Family route will normally be part of or seeking to establish a long-term relationship. Of the people issued a Family visa in 2011, almost half (48%) had gained settlement after 2 years. This can be accounted for by some migrants on a Family visa taking up settlement when they become eligible after 2 years, rather than extending their leave to remain in the UK.
Number of migrants issued a Family visa in 2004 to 2011, broken down by their immigration status 5 years later
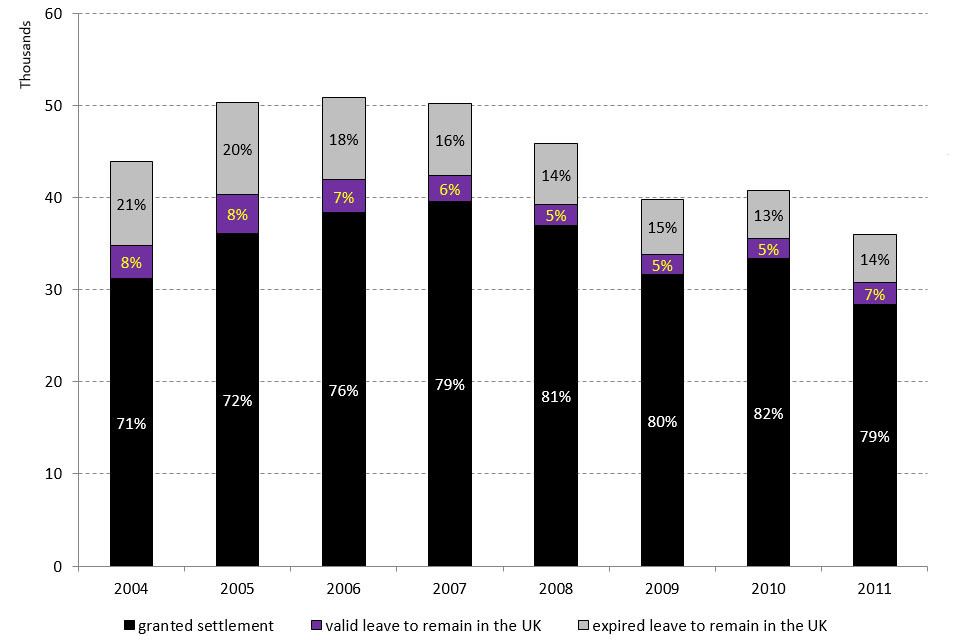
The chart shows the 2004 to 2011 cohorts issued a Family visa by immigration status 5 years later.
Chart notes
Source: Home Office, ‘Statistics on changes in migrants’ visa and leave status: 2016’, volume 1, table MJ 01.
In the 2011 cohort, the top 5 nationalities accounted for around two-fifths (43%) of the Family visas issued. These nationalities were Pakistani, Indian, American, Bangladeshi and Afghan - of whom the largest number were Pakistani nationals, as shown in the table below.
The proportion who had settled within 5 years also differs by nationality. A lower proportion of American (66%) and Afghan (75%) nationals were settled after 5 years, compared with nationals from India (84%), Pakistan (83%) and Bangladesh (82%).
Top 5 nationalities in the 2011 cohort issued a Family visa
| Nationality | Migrants in 2011 cohort | Immigration status 5 years later: % with expired leave to remain in the UK | Immigration status 5 years later: % with valid leave to remain in the UK | Immigration status 5 years later: % granted settlement |
|---|---|---|---|---|
| All nationalities | 36,088 | 14% | 7% | 79% |
| Of which: | ||||
| Pakistani | 7,232 | 9% | 8% | 83% |
| Indian | 2,792 | 11% | 5% | 84% |
| American | 2,417 | 29% | 4% | 66% |
| Bangladeshi | 1,832 | 9% | 9% | 82% |
| Afghan | 1,283 | 16% | 9% | 75% |
Table notes
Source: Home Office, ‘Statistics on changes in migrants’ visa and leave status: 2016’, volume 1, table MJ 01.
4.3 Work
Around a fifth (18%) of people issued a Work visa in 2004 had gained settlement 5 years later, and a further 16% still had valid leave to remain in the UK.
Between 2004 and 2011 there was an overall rise in the proportion of people whose leave to remain in the UK had expired after 5 years, from 67% of those issued a Work visa in 2004 to 76% in 2008, followed by a decrease in 2009 to 69% and then further increases in the 2010 (70%) and 2011 cohorts (75%).
Number of migrants issued a Work visa in 2004 to 2011, broken down by their immigration status 5 years later
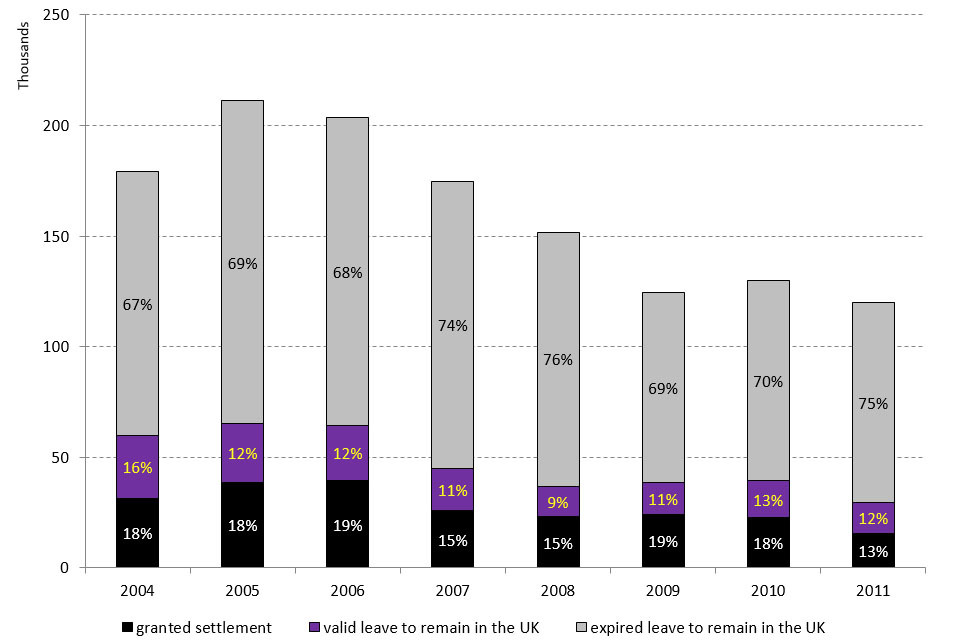
The chart shows the 2004 to 2011 cohorts issued a Work visa by immigration status 5 years later.
Chart notes
Source: Home Office, ‘Statistics on changes in migrants’ visa and leave status: 2016’, volume 1, Table MJ 02.
In the 2011 cohort, just 5 nationalities accounted for two-thirds (66%) of the work route. These 5 nationalities were Indian, Australian, American, New Zealander, and Canadian. Indian nationals comprised by far the largest number of non-EEA workers (34%) and account for over half (54%) of the workers initially granted a Tier 2 visa. This is consistent with the proportion of certificates of sponsorship issued for Indian national skilled workers over recent years.
Of the top 5 nationalities for workers granted a Work visa in 2011, Indian nationals were most likely to have obtained settlement after 5 years (17%) and also had the highest proportion of dependants (46%) compared with other nationalities. In contrast, a lower proportion of Australians (3%), Americans (4%), New Zealanders (4%) and Canadians (4%) had been granted settlement after 5 years. The majority of Work visa grants for Australians, New Zealanders and Canadians are for Tier 5 visas, which have no path to settlement. Tier 5 accounts for 78% of Australian, 73% of New Zealander, and 67% of Canadian migrants initially granted leave on a Work visa. This is reflected in the low rates of settlement for these nationalities.
Over two-thirds (68%) of all those issued a Work visa in the 2011 cohort were main applicants, and 32% were their dependants. Of the top 5 nationalities issued Work visas in the 2011 cohort, Indians (46%) and Americans (33%) had a much higher proportion of dependants than New Zealanders (3%), Australians (4%) and Canadians (10%). This can be partly explained by the rules of the Tier 5 Youth mobility scheme, under which individuals are not allowed to bring their dependants as part of their visa. New Zealand, Australia and Canada are 3 of the 8 countries eligible (along with Japan, Monaco, Hong Kong, South Korea and Taiwan).
The table below indicates lower gross domestic product (GDP) per head was associated with higher rates of settlement after 5 years (and lower rates of expired leave); albeit eligibility for Tier 5 Youth mobility scheme may have influenced comparisons between developed and developing countries. Within the top 5 nationalities, the proportion who were dependants also appears related to the proportion granted settlement.
Top 10 nationalities in the 2011 cohort issued Work visas, ordered by proportion granted settlement
| Nationality | Migrants in 2011 cohort | Proportion who were dependants | Immigration status 5 years later: % with expired leave to remain in the UK | Immigration status 5 years later: % with valid leave to remain in the UK | Immigration status 5 years later: % granted settlement | GDP per capita (US$) - 20111 |
|---|---|---|---|---|---|---|
| All nationalities | 120,113 | 32% | 75% | 12% | 13% | 17,156 |
| Of which: | ||||||
| Pakistan | 4,659 | 75% | 37% | 21% | 42% | 5,375 |
| China | 3,032 | 41% | 61% | 12% | 27% | 16,676 |
| India | 40,443 | 46% | 73% | 10% | 17% | 7,153 |
| Russia | 2,330 | 24% | 73% | 11% | 16% | 27,466 |
| Philippines | 4,739 | 14% | 70% | 16% | 15% | 8,270 |
| New Zealand | 5,176 | 3% | 84% | 12% | 4% | 38,707 |
| United States | 12,164 | 33% | 82% | 14% | 4% | 59,609 |
| Canada | 4,960 | 10% | 83% | 13% | 4% | 47,771 |
| Australia | 16,110 | 4% | 89% | 8% | 3% | 50,817 |
| Japan | 4,364 | 40% | 86% | 13% | 1% | 42,860 |
Table notes
Source: Home Office, ‘Statistics on changes in migrants’ visa and leave status: 2016’, volume 1, table MJ 02.
1. GDP per capita, Purchasing power parity in USD ($), Source International Monetary Fund.
Just under half (48%) of the work migrants in the 2011 cohort were on a Tier 2 visa. The proportions for Tier 1, Tier 5 and ‘Other work’ were 13%, 28% and 11% respectively.
Three-quarters of those initially granted a Tier 2 visa category had expired leave to remain after 5 years and 25% were granted settlement or had valid leave to remain. Those on a Tier 1 visa were the most likely (47%) to gain settlement after 5 years and least likely (36%) to have expired leave to remain after 5 years. However, it is important to note that the Tier 1 cohort was in transition over this period. While the Tier 1 General visa allowing suitably qualified individuals to come to the UK under the PBS to search for jobs closed to new applicants for entry clearance in December 2010, there were still visas and in-country extensions of leave in this category being issued to people in the UK who were already in the route and some dependents of skilled workers. Over the subsequent years, Tier 1 workers reduced in number as the vast majority of these cohorts became concentrated in the investor, entrepreneur and exceptional talent categories.
Migrants who initially were granted a Tier 5 visa were the least likely (less than 1%) to eventually gain settlement and were the most likely (93%) to have expired leave to remain in the UK after 5 years. This reflects the maximum length of stay (up to 24 months) permitted under the Tier 5 Youth mobility scheme for temporary work, which comprises around half of this group. Of the remaining 7%, 3% (906) were on a Tier 2 Work visa and 2% (619) were on a Family visa. The rest were on other routes and, in very rare instances, granted settlement after 5 years. For the ‘Other work’ category over three-quarters (77%) of the migrants had expired leave to remain after 5 years.
Percentages for immigration status 5 years later for migrants issued different categories of Work visa in 2011
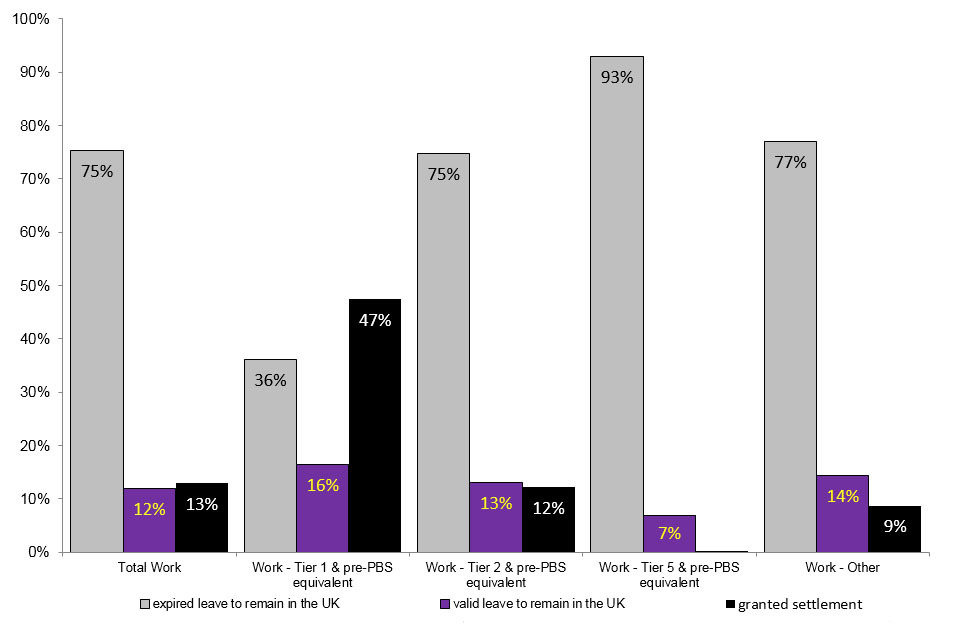
The chart shows the different work routes issued a visa for the 2011 cohort by immigration status 5 years later.
Chart notes
Source: Home Office, ‘Statistics on changes in migrants’ visa and leave status: 2016’, volume 2, tables MJ 05-MJ 08.
Migrants issued a Tier 2 Intra-company transfer (ICT) visa accounted for 63% of all Tier 2 visas issued in 2011.These individuals were much less likely to have valid leave to remain or settlement after 5 years than migrants on non-ICT Tier 2 visas (as shown in the table below). This is a result of the ICT visa route offering no route to settlement from April 2010, which requires migrants to switch visas in order to apply and be considered for indefinite leave. A quarter (25%) of migrants issued a Tier 2 visa in the 2011 cohort had valid leave to remain or settlement after 5 years. For Tier 2 ICT visa holders, the proportion with valid leave to remain or settlement after 5 years was only 11%, whereas for non-ICT Tier 2 visa holders this proportion was 49%.
Comparison of migrants issued a Tier 2 Work visa in the 2011 cohort
| Category | Migrants in 2011 cohort | Immigration status 5 years later: % with expired leave to remain in the UK | Immigration status 5 years later: % with valid leave to remain in the UK | Immigration status 5 years later: % granted settlement |
|---|---|---|---|---|
| Total | 57,747 | 75% | 13% | 12% |
| Of which: | ||||
| Tier 2 General | 5,323 | 45% | 24% | 31% |
| Tier 2 Intra-company transfers | 36,175 | 89% | 10% | 1% |
| Tier 2 Dependant | 14,182 | 56% | 17% | 28% |
| Work permit holders (pre-PBS) | 1,648 | 26% | 4% | 70% |
| Other Tier 2 visas | 419 | 55% | 30% | 15% |
4.4 Study
Over two-thirds (68%) of migrants who were issued a Study visa in 2004 no longer had valid leave to remain in the UK 5 years later. This proportion has increased in each subsequent cohort to 86% in 2011.
In part reflecting the changes in student migration over the last 6 years, the proportion of migrants who gained settlement 5 years after entering on a Study visa has declined over this period. For people issued a Study visa in 2004, 4% had gained settlement 5 years later and a further 28% still had valid leave to stay in the UK, either as students or in another route. For those arriving in 2011, only 1% had gained settlement 5 years later and a further 14% still had valid leave to stay in the UK. The rate of migrants in this route with valid leave to remain or settlement has declined steadily over the cohorts, including a sizeable fall to 14% in the 2011 cohort from 19% in 2010, and might be anticipated to continue to decline in subsequent years.
These changes are consistent with the tightening of the Immigration Rules for students since September 2007 (for details please see ‘Policy and legislative changes affecting migration to the UK’). They also reflect changes in the composition of student migrants coming to the UK, and the increasing likelihood that those on Student visas will be coming to study at higher education institutions rather than other educational establishments, and leaving the UK at the end of their studies where previously this might have occurred less. Such improvements in compliance with Immigration Rules is discussed further in the Home Office report ‘Second report on statistics being collected under the exit checks programme’ published on 24 August 2017.
Some of the fall in students remaining longer term may also be partly related to the economic conditions following the recession in 2008 to 2009, which for a while may have reduced the incentive for students to remain and seek work in the UK. However, it is also worth noting that those initially granted Study visas have comprised increasing proportions of the numbers eventually granted settlement over the past 7 years (see the backward-view analysis below).
Number of migrants issued a Study visa in 2004 to 2011, broken down by their immigration status 5 years later1
The chart shows the 2004 to 2011 cohorts issued a Study visa by immigration status 5 years later.
Chart notes
Source: Home Office, ‘Statistics on changes in migrants’ visa and leave status: 2016’, volume 1, table MJ 03.
1. Categories less than 5% have not been labelled on the chart.
Of the people issued a Study visa in 2011, 54% had expired leave to remain in the UK after just 2 years, indicating that many people on Student visas will come to study shorter courses, including both postgraduate studies and further education courses. The majority (59%) of non-EU students who enrolled at a UK university in 2011 to 2012 were studying a postgraduate course (often for just 1 or 2 years) rather than an undergraduate degree which would be longer in duration (please see table 11b in ‘Students in Higher Education 2011/12’).
In the 2011 cohort, just 5 nationalities accounted for over three-fifths (61%) of people who entered the UK on a Study visa. These nationalities were Chinese, Pakistani, Indian, American and Nigerian.
Most (91%) of those granted a Study visa in 2011 were main applicants (i.e. the student); the remaining 9% were those travelling as a dependent family member. Of the top 5 nationalities, Indian and Nigerian students had the highest proportion of dependants (14% and 10%) and Chinese the lowest (1%).
Around a quarter (23%) of Nigerian students had valid leave to remain in the UK or had obtained settlement after 5 years, the highest proportion among the top 5 and noticeably higher than the proportion for non-EU students as a whole (14%). American students had the lowest proportion with valid leave remaining after 5 years of the top 5 nationalities. As with work migrants, this may indicate that migrants from developing nations are more likely to seek to remain in the UK for longer periods or permanently, compared to those coming from wealthier nations.
Top 5 nationalities in the 2011 cohort issued a Study visa
| Nationality | Migrants in 2011 cohort | Proportion who were dependants | Immigration status 5 years later: % with expired leave to remain in the UK | Immigration status 5 years later: % with valid leave to remain in the UK | Immigration status 5 years later: % granted settlement |
|---|---|---|---|---|---|
| All nationalities | 222,017 | 9% | 86% | 14% | 1% |
| Of which: | |||||
| Chinese | 41,844 | 1% | 87% | 13% | 0% |
| Pakistani | 34,997 | 8% | 86% | 13% | 2% |
| Indian | 33,196 | 14% | 90% | 10% | 0% |
| American | 13,652 | 3% | 92% | 8% | 0% |
| Nigerian | 11,027 | 10% | 77% | 21% | 1% |
Table notes
Source: Home Office, ‘Statistics on changes in migrants’ visa and leave status: 2016’, volume 1, table MJ 03.
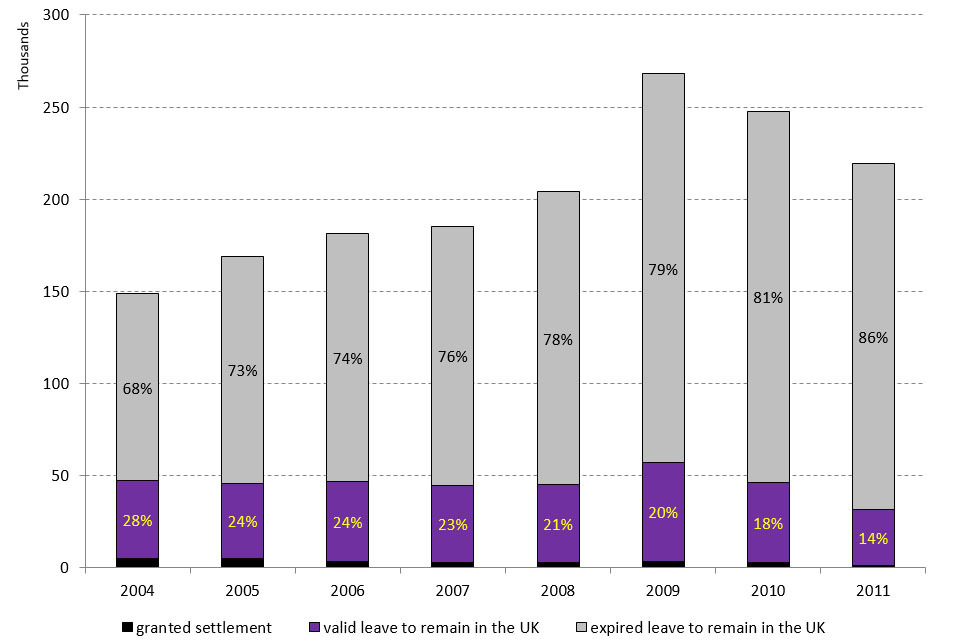
4.5 Dependants joining or accompanying
The ‘Dependants joining or accompanying’ category applies to people who have been issued a visa on the basis of their relationship with another migrant, who is not a settled person or British citizen and may have been issued a visa for any reason (for example, Work, Study, Family). Dependants are allocated an entry clearance category according to the circumstances of their application.
For people issued a Dependants joining or accompanying visa in 2011, 44% had gained settlement (permission to stay permanently in the UK) 5 years later and a further 7% still had valid leave to remain in the UK.
In the 2011 cohort, 13,698 migrants were issued a Dependants joining or accompanying visa. There was a notable decrease of 57% in the migrants issued a Dependants joining or accompanying visa between 2008 and 2009 cohorts. This coincides with the roll-out of the PBS for Work and Study visas across 2008 and 2009. Previously, all dependants of migrants on Work or Study visas would be provided with a ‘Joining or accompanying’ visa, which acts as a catch-all for all dependants. The majority of dependants are now captured under the respective categories of the main applicants, hence the large reduction in grants for more recent cohorts. Please see the ‘User guide to the Home Office Statistics on changes in migrants’ visa and leave status’ for further information on the entry clearance rules for dependants.
Number of migrants issued a Dependants joining and accompanying visa in 2004 to 2011, broken down by immigration status 5 years later
The chart shows the 2004 to 2011 cohorts issued a Dependant joining or accompanying visa by immigration status 5 years later.
Chart notes
Source: Home Office, ‘Statistics on changes in migrants’ visa and leave status: 2016’, volume 1, table MJ 04.
In the 2011 cohort, the top 5 nationalities accounted for just over half (52%) of Dependants joining or accompanying visas issued; of which, Indian nationals were most likely to have been granted settlement after 5 years (78%). Additionally, the majority of Afghan and Pakistani nationals arriving as dependants had been granted settlement after 5 years. Americans were by far the largest number of any nationality in this category, accounting for a quarter of the total in the 2011 cohort, but had a very low proportion of dependants who had been granted settlement after 5 years (3%) which may in part reflect use of these visas by dependants of American armed forces personnel stationed in the UK.
Top 5 nationalities in the 2011 cohort issued a Dependants joining or accompanying visa
| Nationality | Migrants in 2011 cohort | Immigration status 5 years later: % with expired leave to remain in the UK | Immigration status 5 years later: % with valid leave to remain in the UK | Immigration status 5 years later: % granted settlement |
|---|---|---|---|---|
| All nationalities | 13,698 | 49% | 7% | 44% |
| Of which: | ||||
| American | 3,434 | 88% | 8% | 3% |
| Pakistani | 1,503 | 24% | 7% | 69% |
| Afghan | 1,058 | 15% | 8% | 77% |
| Australian | 605 | 68% | 6% | 26% |
| Indian | 566 | 20% | 3% | 78% |
Table notes
Source: Home Office, ‘Statistics on changes in migrants’ visa and leave status: 2016’, volume 1, table MJ 04.
5. Latest status of all cohorts in 2016
This section is designed to give information on the latest status of all cohorts. The following tables show the status of each migrant cohort (between 2004 and 2014) at the end of 2016. In this section, citizenship is discussed as a separate category to settlement rather than being included within the settlement figure.
It should be recognised that figures for more recent cohorts will display large differences from older cohorts for the following reasons:
- Individuals in very recent cohorts, as a proportion, are more likely to have leave to remain in 2016 (i.e. the proportion with expired leave will be lower). The reason can be attributed to more recent cohorts of migrants still possessing leave to remain from their initial Entry clearance visa; for example, a migrant from the 2014 cohort attending a three-year higher education course is very likely to still have valid leave to remain at the end of 2016.
- The length of time taken to seek and be granted settlement. It typically takes migrants several years to be granted settlement, so the proportion of migrants granted settlement in the 2013 or 2014 cohort is very low across all routes.
- Changes to the Immigration Rules over time. Changes to visa policy will affect the rates of certain cohorts to obtain settlement or extend their leave.
Migrants in the 2014 cohort are, as one might expect, the most likely to have valid leave to remain or been granted settlement or citizenship (i.e. less likely to have expired leave to remain) in 2016 compared to the less recent cohorts. Migrants in the Family category are the most likely to possess valid leave to remain at the end of 2016, while the Study and Work categories are consistently the least likely.
Migrants in 2004 to 2014 cohorts still holding valid leave to remain in the UK or granted settlement or citizenship in 2016, by visa type
| Year of initial visa | Family | Work | Study | Dependants joining or accompanying |
|---|---|---|---|---|
| 2004 | 78% | 28% | 21% | 47% |
| 2005 | 79% | 26% | 18% | 49% |
| 2006 | 81% | 27% | 16% | 52% |
| 2007 | 84% | 23% | 14% | 59% |
| 2008 | 85% | 22% | 13% | 56% |
| 2009 | 84% | 29% | 13% | 56% |
| 2010 | 87% | 28% | 15% | 54% |
| 2011 | 86% | 25% | 14% | 51% |
| 2012 | 86% | 28% | 21% | 51% |
| 2013 | 87% | 32% | 32% | 54% |
| 2014 | 94% | 45% | 44% | 76% |
Table notes
Source: Home Office, ‘Statistics on changes in migrants’ visa and leave status: 2016’, volume 1, tables MJ 01-MJ 04.
The majority of migrants in the 2004 cohort with leave to remain in the UK in 2016 were permanently settled or granted citizenship, rather than possessing other leave to remain. For example, 77% of migrants in the Family category had settlement or citizenship status, with only 1% having other leave to remain. In contrast, the majority of migrants in the 2014 cohort had other leave to remain rather than settlement or citizenship status. Of those in the Study category in the 2014 cohort who possessed valid leave to remain, a very small number (around 0.02%) had settlement or citizenship at the end of 2016, whereas 19% of those in the same category in the 2004 cohort had been granted settlement or citizenship.
Migrants in 2004 to 2014 cohorts granted settlement or citizenship in 2016, by visa type
| Year of initial visa | Family | Work | Study | Dependants joining or accompanying |
|---|---|---|---|---|
| 2004 | 77% | 26% | 19% | 46% |
| 2005 | 77% | 25% | 15% | 48% |
| 2006 | 80% | 26% | 12% | 50% |
| 2007 | 82% | 21% | 7% | 56% |
| 2008 | 82% | 20% | 4% | 53% |
| 2009 | 81% | 25% | 3% | 52% |
| 2010 | 83% | 21% | 2% | 50% |
| 2011 | 79% | 13% | 1% | 44% |
| 2012 | 62% | 4% | 0% | 31% |
| 2013 | 13% | 1% | 0% | 11% |
| 2014 | 4% | 1% | 0% | 4% |
Table notes
Source: Home Office, ‘Statistics on changes in migrants’ visa and leave status: 2016’, volume 1, tables MJ 01-MJ 04.
In the 2004 cohort, 56% of the migrants in the Family category were granted citizenship at the end of 2016, while only 14% of those from the Study category were granted citizenship. The most recent cohorts will have lower rates, reflecting their limited opportunity to have yet been granted citizenship. Overall the Study route has the lowest rates.
Migrants in 2004 to 2014 cohorts granted citizenship in 2016, by visa type
| Year of initial visa | Family | Work | Study | Dependants joining or accompanying |
|---|---|---|---|---|
| 2004 | 56% | 21% | 14% | 36% |
| 2005 | 59% | 19% | 9% | 37% |
| 2006 | 61% | 20% | 6% | 38% |
| 2007 | 59% | 15% | 4% | 44% |
| 2008 | 55% | 13% | 2% | 38% |
| 2009 | 48% | 15% | 1% | 33% |
| 2010 | 37% | 9% | 1% | 27% |
| 2011 | 27% | 3% | 0% | 18% |
| 2012 | 23% | 2% | 0% | 10% |
| 2013 | 2% | 1% | 0% | 2% |
| 2014 | 0% | 0% | 0% | 1% |
Table notes
Source: Home Office, ‘Statistics on changes in migrants’ visa and leave status: 2016’, volume 1, tables MJ 01-MJ 04.
6. Backward-view analysis
The ‘Statistics on changes in migrants’ visa and leave status: 2016’ analysis also considers those whose entry to the UK ultimately results in them applying for settlement (permission to stay permanently in the UK) and which visas they used initially to come to the UK. The final part of this report looks at the immigration case histories of migrants who were granted settlement in each year from 2009 to 2016.
Limitations of data matching and the rules for settlement mean that it was not always possible to trace every case back to the first visa record. In addition, some original entry records will pre-date the electronic databases used for this analysis, meaning that the migrants could not be linked to an initial visa record.
Numbers of cases granted settlement can also reflect casework management decisions as well as policy changes. The higher volume of cases granted settlement in 2010 reflects more grants given on a discretionary basis. This resulted from a review of the backlog of cases involving unsuccessful asylum applications announced in July 2006 by the then Home Secretary.
The underlying data used to calculate the number of migrants granted settlement is derived from a different administrative source than the published settlement figures in the quarterly ‘Immigration Statistics’ release, so figures are not identical. Further information can be found in the user guide.
The most common pathways to settlement are the Family and some Skilled work routes - the direct routes to settlement allowed under the Immigration Rules. Both of these allow a grant of settlement without the migrant switching to another immigration category. Of those migrants granted settlement in 2016, 26% had originally entered the UK on a Work visa and 10% on a Family visa.
In 2016, 63,922 migrants were granted settlement, a third (33%) lower than the number of migrants who were granted settlement in 2015 (94,732), and almost three-quarters (74%) lower than in 2010 (245,738). The reduction in grants of settlement between 2015 and 2016 is accounted for by falls across all routes, most prominently the Study (down 8,918 or 33%), Tier 2 Work (down 6,219 or 45%) and Family (down 6,136 or 49%) routes. This reflects the numbers of visas and extensions granted in previous years and changes to the Immigration Rules over time. For further details see ‘Policy and legislative changes affecting migration to the UK: timeline’.
Over a quarter (28%) of those granted settlement in 2016 originally arrived to study or had accompanied a student. This proportion has increased from 12% of those granted settlement in 2009 reflecting past increases in Study visas. As this is a temporary route, these student migrants will, in most cases, have subsequently switched into another route to permanent settlement or used the long-term residency rule.
A further 12% of migrants in the 2016 cohort had settlement as their first record. This means that they had either been granted settlement on arrival - indefinite leave to enter the UK (ILE) - or had a grant of indefinite leave to remain in the UK (ILR) as their earliest record.
A fifth (20%) of the migrants granted settlement in 2016 came to the UK for other reasons. Close to two-thirds of the ‘Other’ category contain cases related to protection of individuals (e.g. as refugees or for some other protection reason) and the remainder include smaller numbers of other miscellaneous categories (e.g. those with EEA family permits). As was mentioned above, ‘Other’ cases accounted for 29% of migrants granted settlement in 2010, which was higher largely as a result of an increase of grants given on a discretionary basis.
Common immigration routes1,2 of those granted settlement in 2009 to 2016
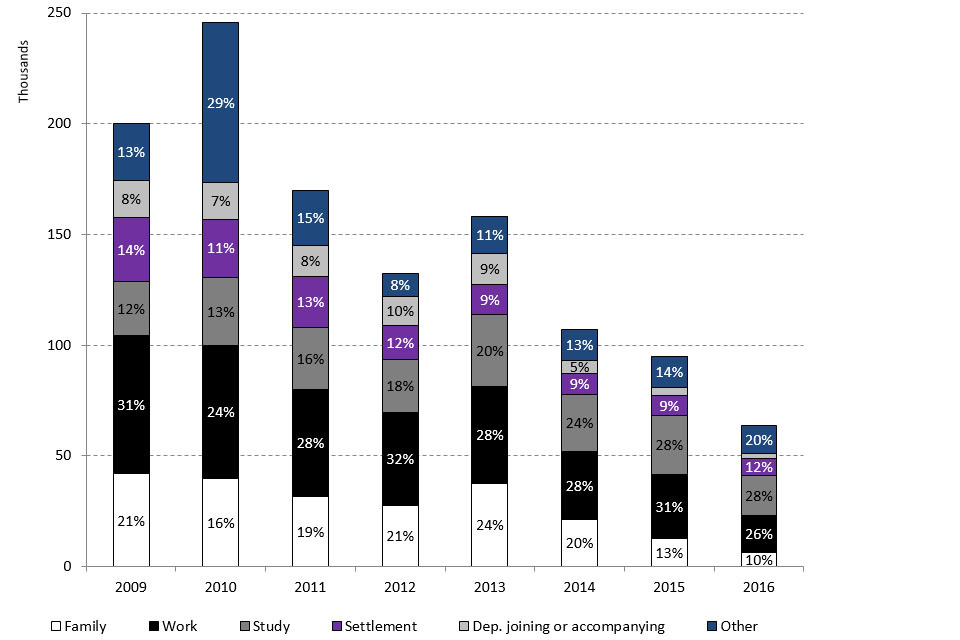
The chart shows the common immigration routes for those settling in 2009 to 2016.
Chart notes
Source: Home Office, ‘Statistics on changes in migrants’ visa and leave status: 2016’, volume 3, table MJ 09.
1. The chart displays the most common immigration routes.
2. Categories less than 5% have not been labelled on the chart.
The number of dependants granted settlement in 2016 differed according to the initial route of entry, as shown in the table below. There were 63,922 grants of settlement to non-EEA migrants in 2016. Over two-thirds (69%) of the total number of settlement grants in 2016 were issued to main applicants and almost a quarter (24%) were issued to their dependants (with 7% going to migrants with visas which can be used for both main applicants and dependants). Of the dependants granted settlement in 2016, almost half (46%) initially entered the UK with a main applicant on a Work dependants visa, (i.e. accompanying a migrant worker).
Immigration routes of those granted settlement in 2016
| Initial route of entry | Total | Main applicant | Dependants | Not specified |
|---|---|---|---|---|
| Total | 63,922 | 43,803 | 15,346 | 4,773 |
| Of which: | ||||
| Dependants joining or accompanying | 2,178 | 943 | 1,199 | 36 |
| Family | 6,445 | 4,484 | 1,934 | 27 |
| Work | 16,856 | 9,768 | 6,986 | 102 |
| Study | 17,819 | 16,149 | 1,623 | 47 |
| Settlement | 7,619 | 2,038 | 1,052 | 4,529 |
| Other1 | 13,005 | 10,421 | 2,552 | 32 |
Table notes
Source: Home Office, ‘Statistics on changes in migrants’ visa and leave status: 2016’, volume 3, table MJ 09.
1. The ‘Other’ category includes a small proportion of EEA family permits.
In the 2016 cohort, the top 5 nationalities (Indian, Pakistani, Nigerian, Chinese and Bangladeshi) accounted for 41% of the total number of settlement grants in that year, with Indian migrants making up the largest proportion (16% of the total). The numbers of migrants from particular nationalities will reflect the make-up of migrants on a path to settlement (entering some years earlier) and may not reflect the pattern among those migrants arriving now.
Of the Indian migrants granted settlement in 2016, 56% (5,753) initially entered the UK on a Work visa and 31% (3,229) initially came to the UK to study.
Of the Pakistani migrants granted settlement in 2016, 39% (2,821) came to the UK to study. A further 21% (1,529) were originally issued Work visas and 19% (1,363) came on the Family route.
The third largest group in 2016 were Nigerians. Two-fifths (40%) of Nigerian migrants granted settlement had come to the UK as students (1,372) and a further 20% (679) arrived on a Work visa.
Of the Chinese migrants who were granted settlement in the 2016 cohort, 43% (1,120) initially entered the UK on a Study visa and 24% (628) on a Work visa.
Of the Bangladeshi migrants, 47% (1,164) were originally issued Study visas and 20% (492) arrived on a Family visa.
Top 5 nationalities granted settlement in 2016, by initial route of entry to the UK1
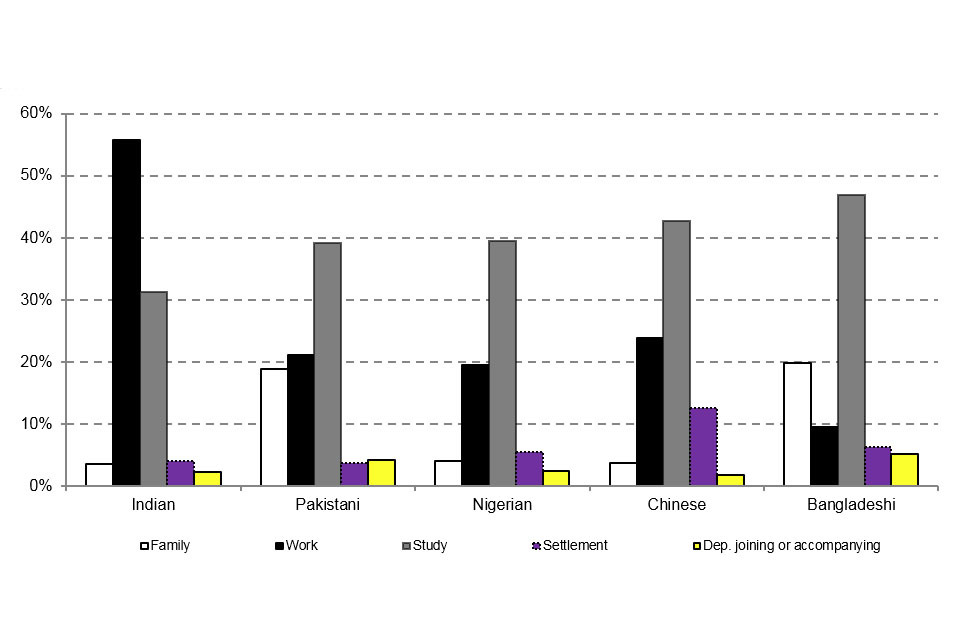
The chart shows the top 5 nationalities granted settlement in 2016 by initial route of entry to the UK.
Chart notes
Source: Home Office, ‘Statistics on changes in migrants’ visa and leave status: 2016’, volume 3, table MJ 09.
1. The chart displays the most common immigration routes and excludes EEA family permits.
7. Data tables
Further data on ‘Statistics on changes in migrants’ visa and leave status: 2016’ are available in:
8. About the figures
This is the eighth in a series of research reports based on the ‘Statistics on changes in migrants’ visa and leave status: 2016’; it is published annually by the Home Office and complements data on the number of visas already published as part of the regular National Statistics release of ‘Migration statistics’. If as a user you have any comments on this plan please email MigrationStatsEnquiries@homeoffice.gov.uk.
The findings presented here are based on data collected from Home Office administrative databases. These databases hold records of individuals granted Entry clearance visas and any subsequent grants of extensions of stay in the UK. As these are sourced from operational systems, numbers may change and may not precisely reflect other published statistics, if those are produced and published at a different time. While EEA nationals do not require visas, records suggest that some apply and are granted visas, and therefore small numbers may be included in this analysis. Nationals from countries that became part of the EEA over the time period of this analysis are also likely to be included in earlier cohorts.
The ‘User guide to statistics on changes in migrants’ visa and leave status’ provides further details on this topic including definitions used, how figures are compiled, data quality, and issues arising from figures based on data sourced from an administrative database.
Tier 1 (which provides a route for highly-skilled migrants) of the PBS was phased in between February and June 2008. Tier 2 (which provides a route for skilled workers with a job offer) and Tier 5 (which is for temporary workers and youth mobility, providing a route for those coming to the UK for primarily non-economic reasons) were implemented in November 2008, and new rules for business visitors were introduced at the same time.
The numbers of applications and decisions made reflect changes in the levels of immigration over time, as well as policy and legislative changes, including changes to immigration legislation. Details of these policy changes, together with information on changes to immigration legislation affecting the statistics, can be found in ‘Policy and legislative changes affecting migration to the UK: timeline’ published alongside this report.
9. Other related data
In September 2010, the Home Office published ‘The Migrant Journey: Research Report 43’, which presented data on the cohort of migrants who came to the UK in 2004. The findings reported the immigration status of these migrants over the subsequent 5 years, where migrants changed their category of leave to remain in the UK, and how migrants in temporary and permanent immigration routes achieved settlement in the UK.
In August 2011, a second report ‘Migrant Journey: Research Report 57’ extended the September 2010 analysis by reporting on specific migrant nationalities that were issued visas in 2004.
In February 2013, a third report ‘Migrant Journey: Third Report’ extended the August 2011 analysis by providing updates for two later cohorts of migrants, namely 2005 and 2006 for the forward-view analysis, and 2010 and 2011 for the backward-view analysis.
In February 2014, a fourth report ‘Migrant Journey: fourth report’ extended the February 2013 analysis by providing updates for the 2007 cohort of migrants for the forward-view analysis and 2012 for the backward-view analysis.
In February 2015, a fifth report ‘Migrant Journey: fifth report’ extended the February 2014 analysis by providing updates for the 2008 cohort of migrants for the forward-view analysis and 2013 for the backward-view analysis. For the first time, this report provided an extended analysis of the immigration status of migrants at the end of the seventh year after their visa was issued.
In February 2016, a sixth report ‘Migrant Journey: sixth report’ extended the February 2015 analysis by providing updates for the 2009 cohort of migrants for forward-view analysis and 2014 for the backward-view analysis.
In February 2017, a seventh report ‘Statistics on changes in migrants’ visa and leave status: 2015’ extended the February 2016 analysis by providing updates for the 2010 cohort of migrants for forward-view analysis and 2015 for the backward-view analysis.
In August 2013, a short statistical article on ‘Extensions of stay by previous category’ was published alongside ‘Immigration Statistics April to June 2013’ to provide further detailed information. Updates for 2016 of the more detailed tables provided in the article are included in the Extensions tables in ‘Immigration Statistics quarterly release’.
In August 2017, the Home Office published the ‘Second report on statistics being collected under the exit checks programme’, which includes some discussion on compliance and change in Immigration Rules.
The regular quarterly releases of Home Office migration statistics can be found at Immigration statistics quarterly release.